Article

A Water Supply Pipeline Risk Analysis Methodology Based on DIY and Hierarchical Fuzzy Inference

1
School of Arts and Sciences, University of Central Asia, Naryn 722918, Kyrgyzstan
2
Department of Hydraulic and Ocean Engineering, National Cheng-Kung University, Tainan 701, Taiwan
3
Faculty of Water Resource Engineering, Thuyloi University, Hanoi 100000, Vietnam
4
Institute of Research and Development, Duy Tan University, Danang 550000, Vietnam
5
Faculty of Environment, University of Science, Vietnam National University Ho Chi Minh City, Ho Chi Minh City 700000, Vietnam
6
Department of Computer Engineering, University of Kuala Lumpur (UniKl-MIIT), Kuala Lumpur 50250, Malaysia
7
Department of Computer Science & IT, University of Malakand, Chakdara 18800, Pakistan
*
Author to whom correspondence should be addressed.
Symmetry 2020, 12(1), 44; https://doi.org/10.3390/sym12010044
Submission received: 23 October 2019 / Revised: 1 December 2019 / Accepted: 6 December 2019 / Published: 25 December 2019

Abstract

:
The standard manufacturing organizations follow certain rules. The highest ubiquitous organizing principles in infrastructure design are modular idea and symmetry, both of which are of the utmost importance. Symmetry is a substantial principle in the manufacturing industry. Symmetrical procedures act as the structural apparatus for manufacturing design. The rapid growth of population needs outstrip infrastructure such as roads, bridges, railway lines, commercial, residential buildings, etc. Numerous underground facilities are also installed to fulfill different requirements of the people. In these facilities one of the most important facility is water supply pipelines. Therefore, it is essential to regularly analyze the water supply pipelines’ risk index in order to escape from economic and human losses. In this paper, we proposed a simplified hierarchical fuzzy logic (SHFL) model to reduce the set of rules. To this end, we have considered four essential factors of water supply pipelines as input to the proposed SHFL model that are: leakage, depth, length and age. Different numbers of membership functions are defined for each factor according to its distribution. The proposed SHFL model takes only 95 rules as compared to the traditional mamdani fuzzy logic method that requires 1225 rules. It is very hard and time consuming for experts to design 1225 rules accurately and precisely. Further, we proposed a Do-it-Yourself (DIY) system for the proposed SHFL method. The purpose of the DIY system is that one can design the FIS model according to his or her need.

1. Introduction

In recent times immense growth has occurred in the human population, particularly in cities. People are moving from rural areas to urban areas for jobs, better health facilities, schooling, and so forth. In order to fulfill the requirement of the people in cities, numerous underground facilities are installed, and among these facilities the most important are pipelines installed for water supply and the sewage. Different factors could cause the degradation of the water and sewage supply pipelines, such as age, depth, length, leakage, pipeline types and quality [1,2,3,4]. In the proposed work, we have considered the four essential factors (depth, length, age and leakage). The depth is an essential factor as near to surface pipeline has a high probability of damage because of the effect of surface activities. The pipelines buried deeper have less damage probability because they are not affected by surface activities. In the same way, the length is also a significant factor because the long pipelines have a high probability of damage [5]. The age of the pipelines is also a critical factor because when the pipeline gets older, its probability of damage becomes high as compared to the new water supply pipeline. The leakage of pipelines also contributes to the damage of pipelines [6].
It is very necessary to avoid the pipelines from being damaged because the damaged pipelines could cause damage to buildings, roads, bridges and eventually, it could occasion human accidents [7,8]. Hence, it is essential to develop a method to assess pipeline risks. Many methods have been developed for these purposes; most of them are based on fuzzy logic.
Nowadays, the tendency of the usage of fuzzy logic methods in different fields has been increased tremendously. The fuzzy logic (FL) techniques are applied approximately in all areas of research for diverse goals [9,10]. The FL techniques are useful to solve uncertainty. The FL techniques have also been used to evaluate the risk index in different areas. The most popular and effective fuzzy logic methods are Mamdani and Sugeno. The difference between the Mamdani and Sugeno fuzzy inference methods is the automatic creation of rules in the Sugeno fuzzy logic method. In the Mamdani FL technique, usually, experts are needed to design rules. The main problem associated with the traditional fuzzy logic (TFL) is the enormous increment in the rules when the number of input factors increases. It is tough for experts to design too many rules with accuracy because rules designing requires intense concentration. It is also essential to accurately design rules, because inaccurate rules may create a big problem. Hence, to overcome this problem, the hierarchical fuzzy logic method has been developed because it can decrease the number of rules dramatically [11,12]. The strategy behind this hierarchical fuzzy logic method is to partition the system into a low sub-dimensional. In the hierarchical fuzzy inference system, the number of rules increases linearly. In the conventional fuzzy inference system, there is only one fuzzy logic module, and all the inputs are directly inputted to that module as a contrast to the hierarchical, where the structure is hierarchically divided into different modules. Hence, the rules are not exponentially increasing in the hierarchical fuzzy inference system when new inputs are added to the system, as compared to the conventional fuzzy inference system, where rules eruption occurs when new inputs are added to the system [13].
Usually, there are numerous factors involved in the assessment of risk index of water supply (WS) pipelines; therefore, the designing of a specific FL model to decrease the number of rules and incorporate risk index assessment is essential.
Humans always want to carry out things by themselves. There are many drivers which motivate the human to the Do-It-Yourself (DIY) method, such as creation, simplification, extension, economic reasons and controlling [14]. The advancement and innovation in DIY electronics are offering a chance for the masses to purify their creativity. A huge inspiration for DIY is the system on chip (SoC), electronics development platforms, and kits in the shape of Arduino and Raspberry Pi. This Do-It-Yourself (DIY) paradigm of development is one of the most popular candidate solutions for the general public programming skills problem. State of the art studies have suggested DIY interfaces for their Internet of Things (IoT) implementations.
It has been identified that most of these implementations are application/domain-specific or too complex for a non-technical user to deploy to utilize them for the customization/development of IoT applications and services. In this paper, an approach has been proposed to bridge this gap between the utilization of masses for IoT development and the programming skill requirements on behalf of the masses and enhanced IoT composition architecture based on DIY business process modeling.
It was reported by the international telecommunication union (ITU) in 2005 that the Internet of Things (IoT) will link objects from the world, both in sensor and the smart way [15,16]. IoT was just an idea in the recent past, and its adoption was not carried out by the masses [17,18], but the number of devices and connections are overgrowing in the IoT. The involvement of end-users to create the IoT process is very important in order to adopt it successfully. It is stated in the Gartner Hype Cycle [19] that this IoT is of high significance, and now the IoT is a reality, not an imagination [20,21,22]. Although, the end-users must have the capability to create processes, discover things [23,24], control things and efficiently utilize the application for smart environments [25]. The same idea has been provided in [26].
Nowadays, many efforts have been made to develop electronic devices to facilitate developers in order to create and program for creation. Many hardware boards have been designed, such as Raspberry Pi [27] and Arduino [28], and many more. Only certain programming languages work on these boards.
In this paper, an SHFL model has been proposed. The primary motivation behind the designing of this model was to decrease the set of rules. Hence, the suggested model has significantly reduced the number of rules in a great manner. Another purpose was to develop a DIY system to facilitate a user to design a model according to his or her need and do the assessment of the WS pipeline risk index. By using the DIY system, the user can design different models according to their needs. The DIY model comprised of five layers, i.e., the physical network layer, virtual object layer, service logic layer, business process layer and the application layer. The representation of the risk index values of the SHFL model using a DIY system is carried out through different LED actuator’s colors. The manager can assess the risk index from these colors and act accordingly.
The rest of the paper is organized as: Section 2 depicts the related work, in Section 3 the proposed methodology has been explained in detail. In Section 4, the details about the implementation, results, and discussion are given, and the paper is concluded in Section 5.

2. Related Work

It is highly needed to analyze the risk index of WS pipelines, and usually, experts are required to assess its risk. However, searching and hiring such experts require a lot of time and money. Hence, it is very obligatory to develop such automatic methods that have the ability of assessment of the water supply (WS) pipelines risks. Many methods have been developed in the recent past to achieve this goal; some of the methods have been discussed here in detail.
The most effective and most common method for risk assessment is FL. The FL techniques have been used in diverse areas of research by different researchers for risk index assessment. Li et al. [29] applied the FL technique for a risk analysis of long WS pipelines. Tripathy et al. [30] used an FL to analyze the risk of care in coal mines. Chen et al. [31] developed a decision-making technique based on FL to select the supplier chain in the supply chain scheme. The fuzzy logic technique has also been used in the aluminum industry by Gul et al. [32]. Zhang et al. [33] used a fuzzy logic method to evaluate the underground risk index.
Traditional fuzzy inference methods have the drawback of rules explosion, or eruption. Hence, to overcome the rules explosion issue, HFIS methods have been used by different authors. Israr et al. [34] designed two models to evaluate the underground risk index and rules reduction. Fayaz et al. [35] developed a method named simplified HFIS for analyzing the underground risk index.
Two different methods, namely average rules-based and maximum rules-based, have also been developed. The primary aim of the designing of HFIS was to reduce the number of rules. Fayaz et al. [11] designed another model named as integrated based on HFIS methods to reduce the number of rules and to find the underground risk index. In the integrated HFIS, two types of rules construction methods have been used to facilitate users to construct rules without any expert. These rules construction methods save the time and money of the user. The integrated hierarchical fuzzy inference system method has been applied to the linear data, as well as being generated based on maximum rules-based and average rules-based, in order to assist the underground risk index. Chang et al. [13] proposed a method to reduce the computational complexity of the hierarchical fuzzy inference system, namely the simplified fuzzification-defication method. In this method, only the inference engine in the central layer is added, and the fuzzification and defuzzification modules have been removed. The method has been applied to two conventional hierarchical fuzzy logic methods for efficiency assessment of the proposed model. Cheong et al. [36] suggested an approach based on a hierarchical fuzzy inference system and differential evolution. Two levels of hierarchical fuzzy inference system have been built to control a cart-pole having four stages.
In recent times extensive efforts have been carried out in which mass DIY in the field of electronic device design, creation and programming have been focused. The present Makers Revolution has introduced a new DIY culture along with the DIY Driver, motivation. The Internet is a bridge between the creators and the public. People can communicate and share their ideas and can assist each other on a huge scale [37]. DiYSE [38] grants a platform of 13 statements dedicated to the developers who carried out the designing and implementation of digital creation systems for end-users. The relationship of DIY IoT to the maker movement has also been stated in the manifesto.
SAM is a Kickstarter [39] project which grants electronic modules in which no skill is required for creation, inventions, designing, and so forth. The integration of hardware, software and the Internet is the fundamental purpose of the SAM project. Python is the programming language of the SAM project modules. It is stated in [40] that in the future, DIY will be used to develop IoT. Chin et al. [41] suggested a method which exhibits the application of the DIY method to develop IoT. Shabir et al. [42] proposed a DIY method to enable masses to remotely customize the behavior of IoT devices by using a visual interface as well as to make sure of the availability of configuration everywhere by using the cloud-platforms. The physical embedded resources have been represented as visual resources in the form of graphical objects. The interface enables the masses to create the service, the service design by a simple drag-and-drop operation and the setting properties. The resulted configuration can be stored in an XML file, and then the XML file is used by the cloud platform. Hence it can be used everywhere. The HTTP protocol has been used for communication between the cloud and the IoT toolbox, and for the communication between the toolbox and actual resources, they have used the CoAP protocol.
DIY platforms called Node-RED [43] are developed to minimize the coding effort and for the developers. The Node-RED users chain together the graphical nodes obtained from the graphical panel to create flows and then to demonstrate those flows to receive the results. The node in Node-RED indicates devices, software platforms and web services [43]. The method applied by Node-RED is an efficient solution to enable public involvement in the realization of the IoT, particularly from the creator’s viewpoint. However, these struggles have made simple designing and creating things for the users, but still, up to some extent, the experience is obligatory. Some other DIY approaches have also been developed in different areas, such as Glue.things [44], Super Stream Collider (SSC) [45], OPEL software platform [46], ThingWork [47], Particle.IO [48], Dweet. IO, and many more.

3. Proposed Methodology

The proposed method can be categorized into two main parts, where the first part involves the hierarchical fuzzy logic models, and the second is the DIY system. First, we will describe the proposed SHFL model in detail and then the DIY system for these models. Researchers have applied the fuzzy logic (FL) method to assess the risk index in numerous areas for different purposes. The critical issue of traditional fuzzy logic (TFL) is rule eruption (explosion) as factors are added to the system. Rules-eruption grows the computation time of the system, and also it is very difficult to make a large set of rules with accuracy. Herein, we have designed a fuzzy logic model based on hierarchical fuzzy logic to handle the issues of the TFL methods. The proposed SHFL model is a binary tree model. The model has consisted of three sub-fuzzy logics modules, and each module has two inputs; this SHFL model immensely shrinks the rules in rules-base. The proposed SHFL model has four input variables as inputs: depth (X1), length (X2), age (X3) and leakage (X4), and the output is the risk of the WS pipeline. The proposed model has three layers (input, middle, output). The input, middle and output layers have consisted of input parameters (X1, X2, X3 and X4), two sub fuzzy logic modules (M1_FL and M2_FL) and one out fuzzy logic module (M3_FL), respectively. The proposed model has been applied to real data provided by the Electronics and Telecommunications Research Institute (ETRI) organization working on the underground project. The data have been gathered from 1989 to 2010 for water supply pipelines installed at different points in Seoul, South Korea. Only for the above-discussed parameters, the data have been collected. The traditional and proposed fuzzy logic models can be seen in Figure 1 and Figure 2, respectively.
The descriptions of the abbreviation that are used throughout the paper are given in Table 1.
There are many types of FLC systems; among them, the most essential FLS systems are Mamdani, Tsukamoto, Sugeno and Larsen. The most extensively used and common fuzzy inference method is Mamdani [49].
In literature, several types of membership functions (MFs), such as triangular, trapezoidal, bell-shaped and many more, have been used in the Mamdani fuzzy logic. Among these, the simplest and frequently used are triangular types of MFs. Therefore in the proposed work, we have used the triangular MFs [50]. Equation (1) represents the formulas for triangle MFs. Triangular membership functions are defined by a lower limit q and an upper limit s, where q < r < s, and x is the actual value.
( a , b , c ) = { 0 ,   q     r q r s r   q     r     s q p s   s     x     p 0   p     q }
The complete set of rules used in the SHFL model can be specified by using Equation (2), and for the TFL model, Equation (3) can be used.
S HFLR = L = 1 H t = 1 | M L | ( i = 1 | M L ( t ) | M L ( t ) A i   )
TR   = MF A 1 × MF A 2 × MF A 1   × MF A 1 . .   ×   MF A n   )
where H is the height of the hierarchical structure (input layer is not considered), | M L | is the number of fuzzy logics at a particular level,   M ( t ) A i is the number of membership functions of the ith variable of the fuzzy logic. In the conventional fuzzy logic model, there is only one layer (input layer is not considered) having one fuzzy logic and all the inputs are direct inputs to that fuzzy logic. Hence, MF A 1 MF A 2 , MF A 3 and MF A n are membership functions of input variables A1, A2, A3 and An, respectively.
Four input parameters are used as inputs to the proposed simplified hierarchical fuzzy logic model, as shown in Figure 2. Three sub fuzzy modules logics, namely M1_FL, M2_FL and M3_FL, have been used in the proposed model. Two inputs parameters, X1 and X2, have been used as inputs to the M1_FL, and we have defined seven and five membership functions for X1 and X2, respectively. The output of the M1_FL is partial risk 1 (PR1), for which we have defined five membership functions. Hence, 7 × 5 = 35, the number of feasible rules that can be defined for M1_FL.
Similarly, two input variables X3 and X4 are used as inputs to the M2_FL; we have defined seven and five membership functions for input variables X3 and X4. respectively. The M2_FL has one output variable partial risk 2 (PR2), for which we have defined five membership functions. The number of feasible rules that can be defined for M2_FL is 5 × 7 = 35. Further, PR1 and PR2 are used as inputs to the M3_FL; five membership functions are defined for each input variable. M3_FL has one output variable, namely WSPRI, for which five membership functions have been defined. Hence, 5 × 5 = 25 feasible rules which can be defined for M3_FL. Therefore, adding the total number of rules of each sub fuzzy logic of the proposed model are 95 to implement the full structure fuzzy logic model.
The same four parameters have been used as inputs with the same membership functions to the conventional fuzzy logic model, as shown in Figure 1. Hence a total number of rules to build a complete fuzzy inference system are 7 × 5 × 7 × 5 = 1225.
In Equation (2), H = 2 (input layer is not considered), | M L |   = 2, | M L |   = 2, | M 1 | = 1, | M 2 | = 2, | M 1 ( 1 ) | = 2, | M 2 ( 1 ) | = 2, | M 2 ( 2 ) | = 2, M 1 ( 1 ) A 1 = 5, M 1 ( 1 ) A 2 = 5, M 2 ( 1 ) A 1 = 7, M 2 ( 1 ) A 2 = 5, M 2 ( 2 ) A 1 = 7 and M 2 ( 2 ) A 2 = 5. By putting the above values in Equation (2):
SHFLR   =   M 1 ( 1 ) A 1 ×   M 1 ( 1 ) A 2 +   M 2 ( 1 ) A 1 × M 2 ( 1 ) A 2   +   M 2 ( 2 ) A 1 ×   M 2 ( 2 ) A 2
PFLR = 5 × 5 + 7 × 5 + 7 × 5 = 25 + 35 + 35 = 95
In order to find complete fuzzy logic rules for the conventional fuzzy inference system Equation (2) can be used. By putting MF A 1 = 7, MF A 2 = 5, MF A 3 = 7, MF A 4 = 5 into Equation (3):
TR   =   MF A 1 × MF A 2 × MF A 1   ×   MF A n     =   7   ×   5   ×   7   ×   5   =   1225
Hence, the number of rules to build a complete fuzzy logic system, the proposed model and the conventional fuzzy logic model require 95 and 1225 rules, respectively. Consequently, it proves that a dramatic reduction occurs in the rules by using the proposed SHFL model.
We have defined different labels for different membership functions in order to exhibit the MFs contributions. For input variable depth (X1) of M1_FL, seven MFs have been specified. The labels assigned to these MFs of variable depth are ENG, NG, N, ND, D, DR and DT. The ST, S, M, L and LT are specified for the input variable Length (X2) of M1_FL. The linguistic terms VLR, LR, MR, HR and VHR have been defined for M1_FL. Similarly, for input leakage (X3) of the input variable M2_FL, the labels ELLP, VLLP, LLP, ILP, HLP, VHLP and EHLP have been assigned to MFs. Similarly, VO, O, IA, N and BN have been specified for input variable age (X4). For output variables of M1_FL and M2_FL, the labels VLR, LR, IR, HR and VHR are assigned to MFs, while these labels, VLLR, LLR, MLR, HLR and VHLR are assigned to the MFs of each variable of M3_FL module. The details of these abbreviations can be seen in the Table 1. In Table 2, Table 3 and Table 4, rules have been defined for M1_FL, M2_FL and M3_FL, respectively.
The proposed DIY and service composition system, as illustrated in Figure 3, is comprised of the virtual and physical domain. The virtual domain facilitates the user by providing the graphical interface for the customization of IoT applications in an intuitive way. The representation of the physical devices in the physical domain is carried out as virtual objects which capture the behaviors of physical devices. The combination of these virtual objects is carried out for the generation of service objects. Users do the utilization of these service objects for the customization of the application process, which will be deployed for physical IoT network control. The physical IoT domain consisted of a leakage sensor, ground state sensor and LED actuator. In the virtual domain, the virtual objects of these physical objects in the physical domain are generated with identical behavior.
Figure 4 shows the detailed design of the proposed fuzzy logic based on the DIY toolbox. The proposed system is comprised of five different layers, i.e.,: the physical network layer, virtual object layer, service logic layer, business process layer and the application layer. The physical network layer consisted of sensors; currently, we have some real data for depth, length, age and leakage. The representation of theses physical sensors and actuators is carried out as virtual objects (VOs) things into the risk cyberspace. The interaction of virtual objects is carried out on the service object layer. This layer has the responsibility to provide a spontaneous and simple to use visual environment where VOs attained from the virtual object manager (VOM) is rendering in graphical form. The drag-drop operation can be performed on the graphical objects to constitute different services. Here we have used fuzzy logic between sensor and actuator to calculate the risk index for the water supply pipeline. Once the composition of the services is carried out, the connection of these services can be made using the BPM editor. The business process layer utilizes the service objects composed at the service composition layer and represents them as business process modeling notations. The application layer specifies the communication protocols and interface methods used by hosts in a physical communication network. The application layer consists of three kinds of nodes, namely the sensor node, proxy node and actuator node. In this work, we have four parameters, namely, depth, length, leakage and age. In this work, we have used the LED as the actuator. Hence the actuator node takes charge of the operation of a physical LED actuator. The proxy node is responsible for supporting communication between sensor nodes and actuator nodes. The logic object in the proposed method is the SHFIS model, which is used to calculate the WSPLs risk index, and the LED actuator operates according to the risk index value.

4. Implementation, Results and Discussion
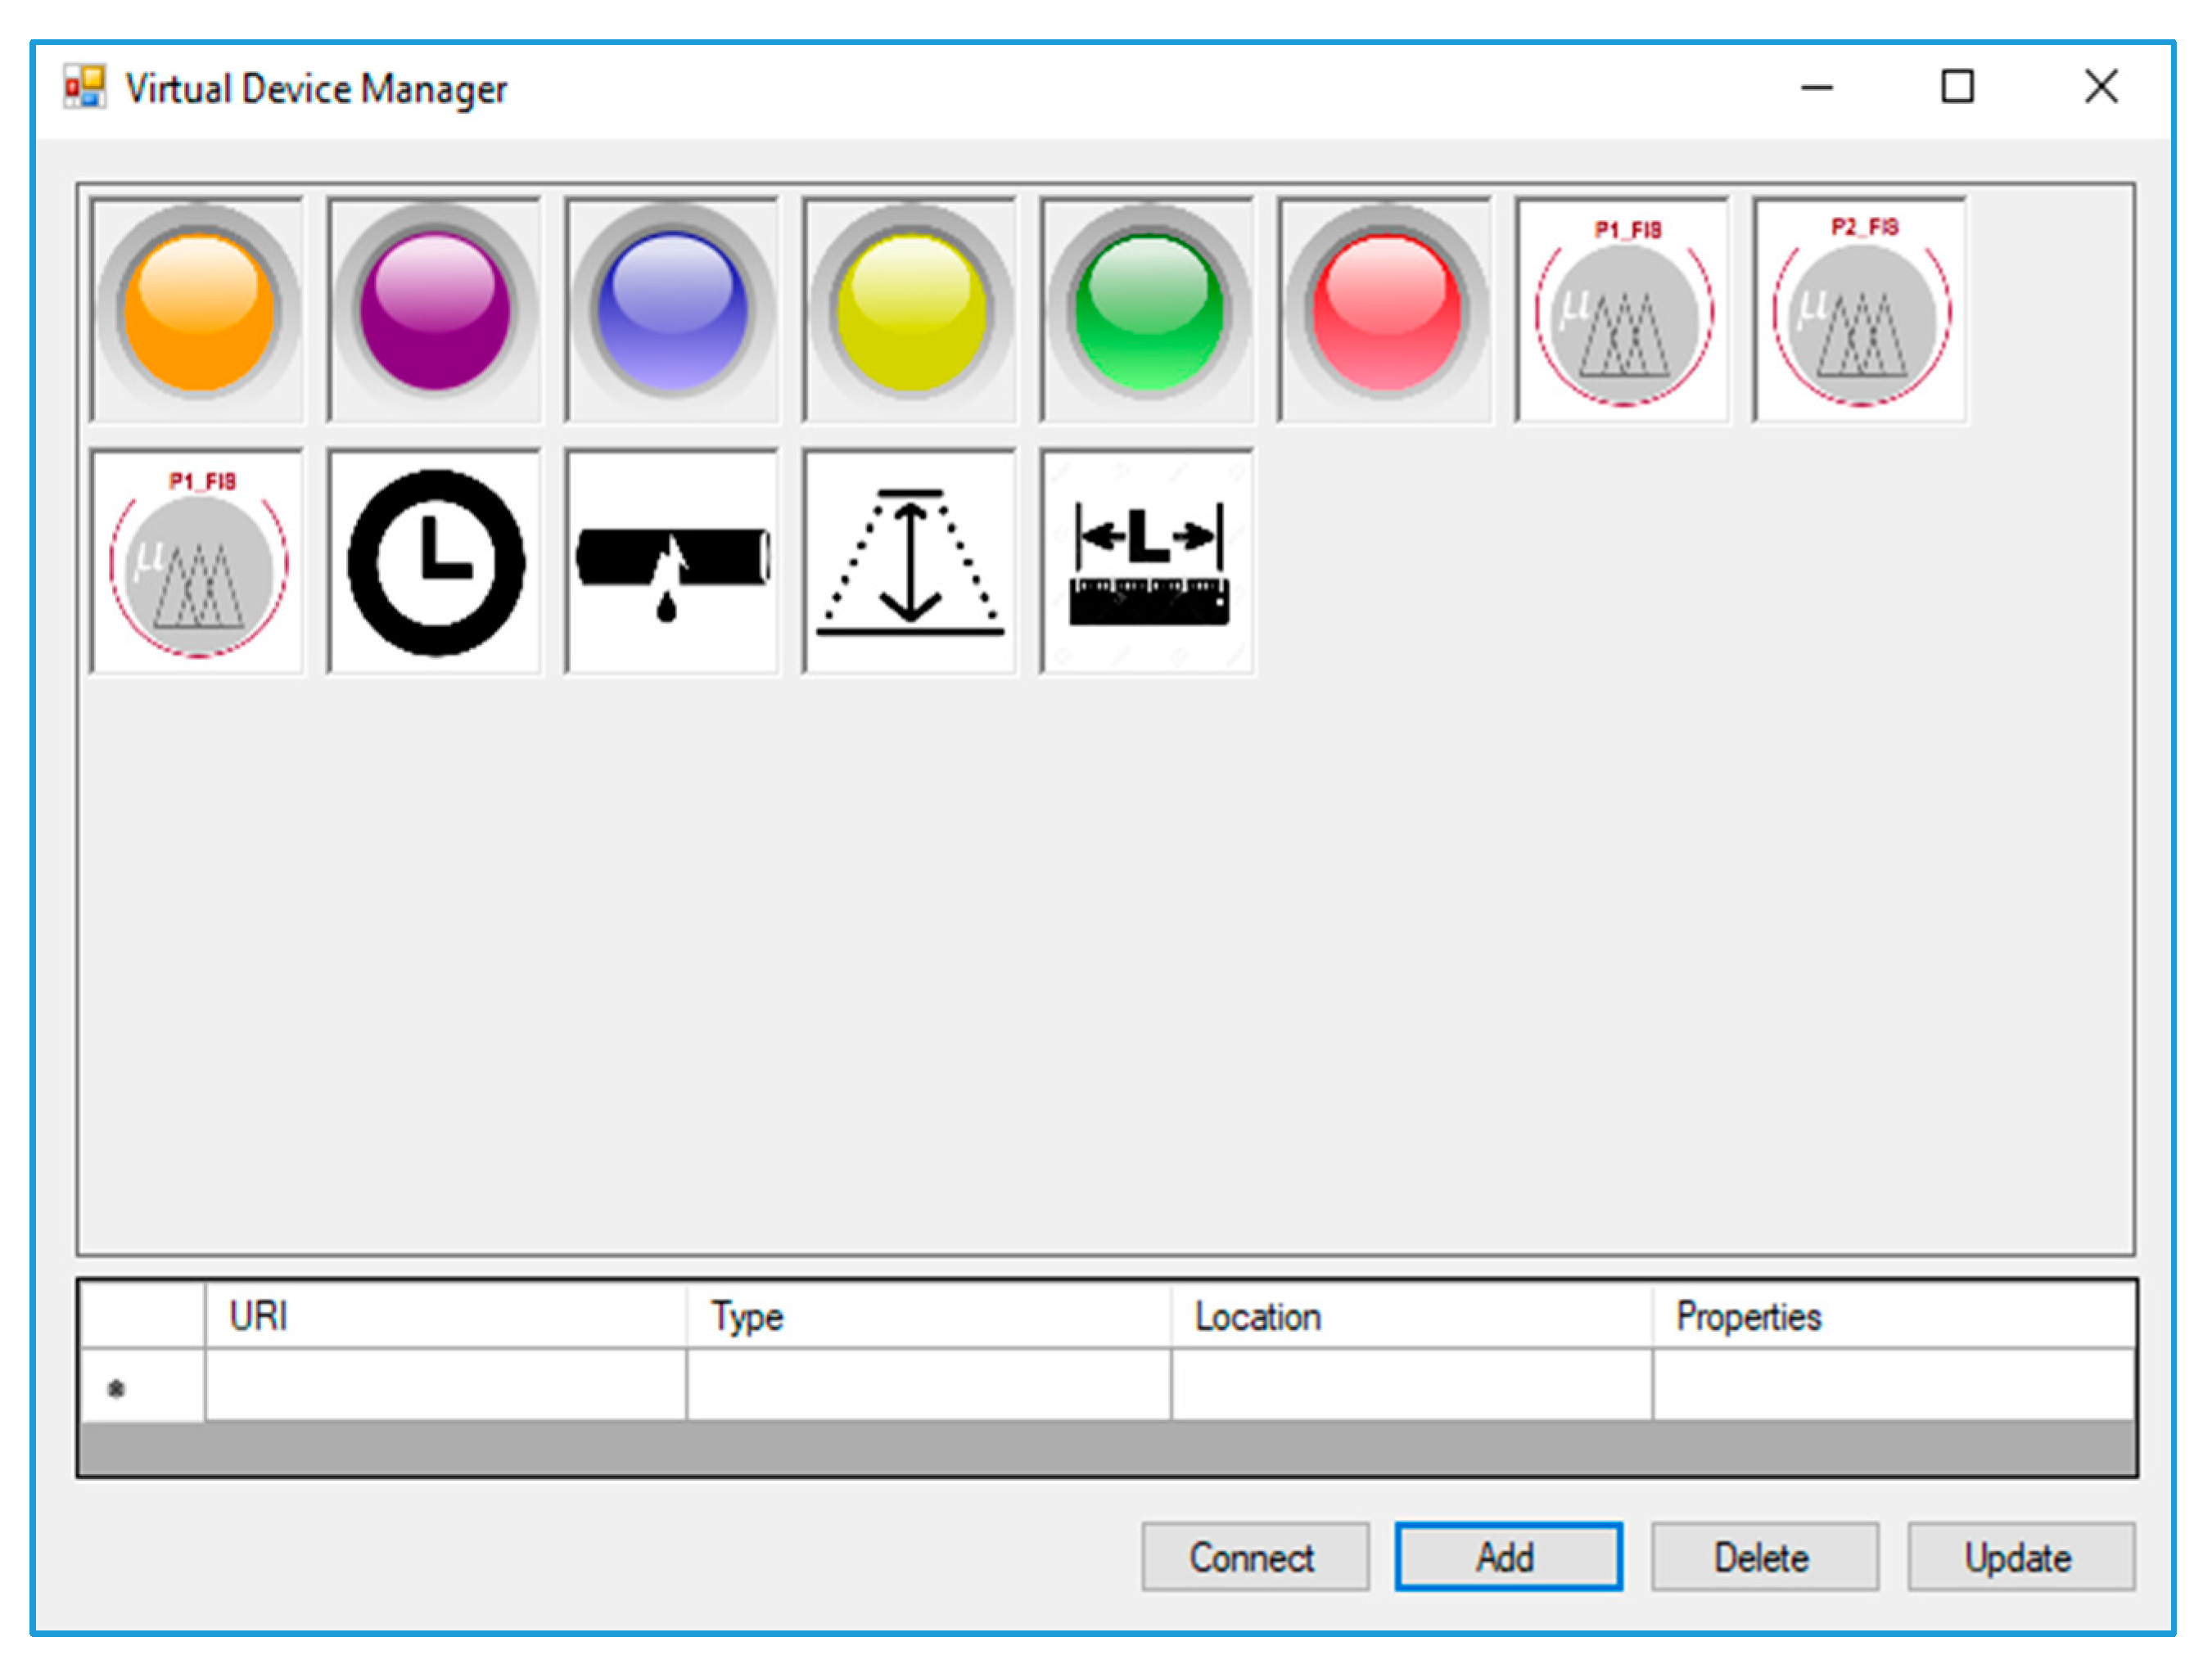
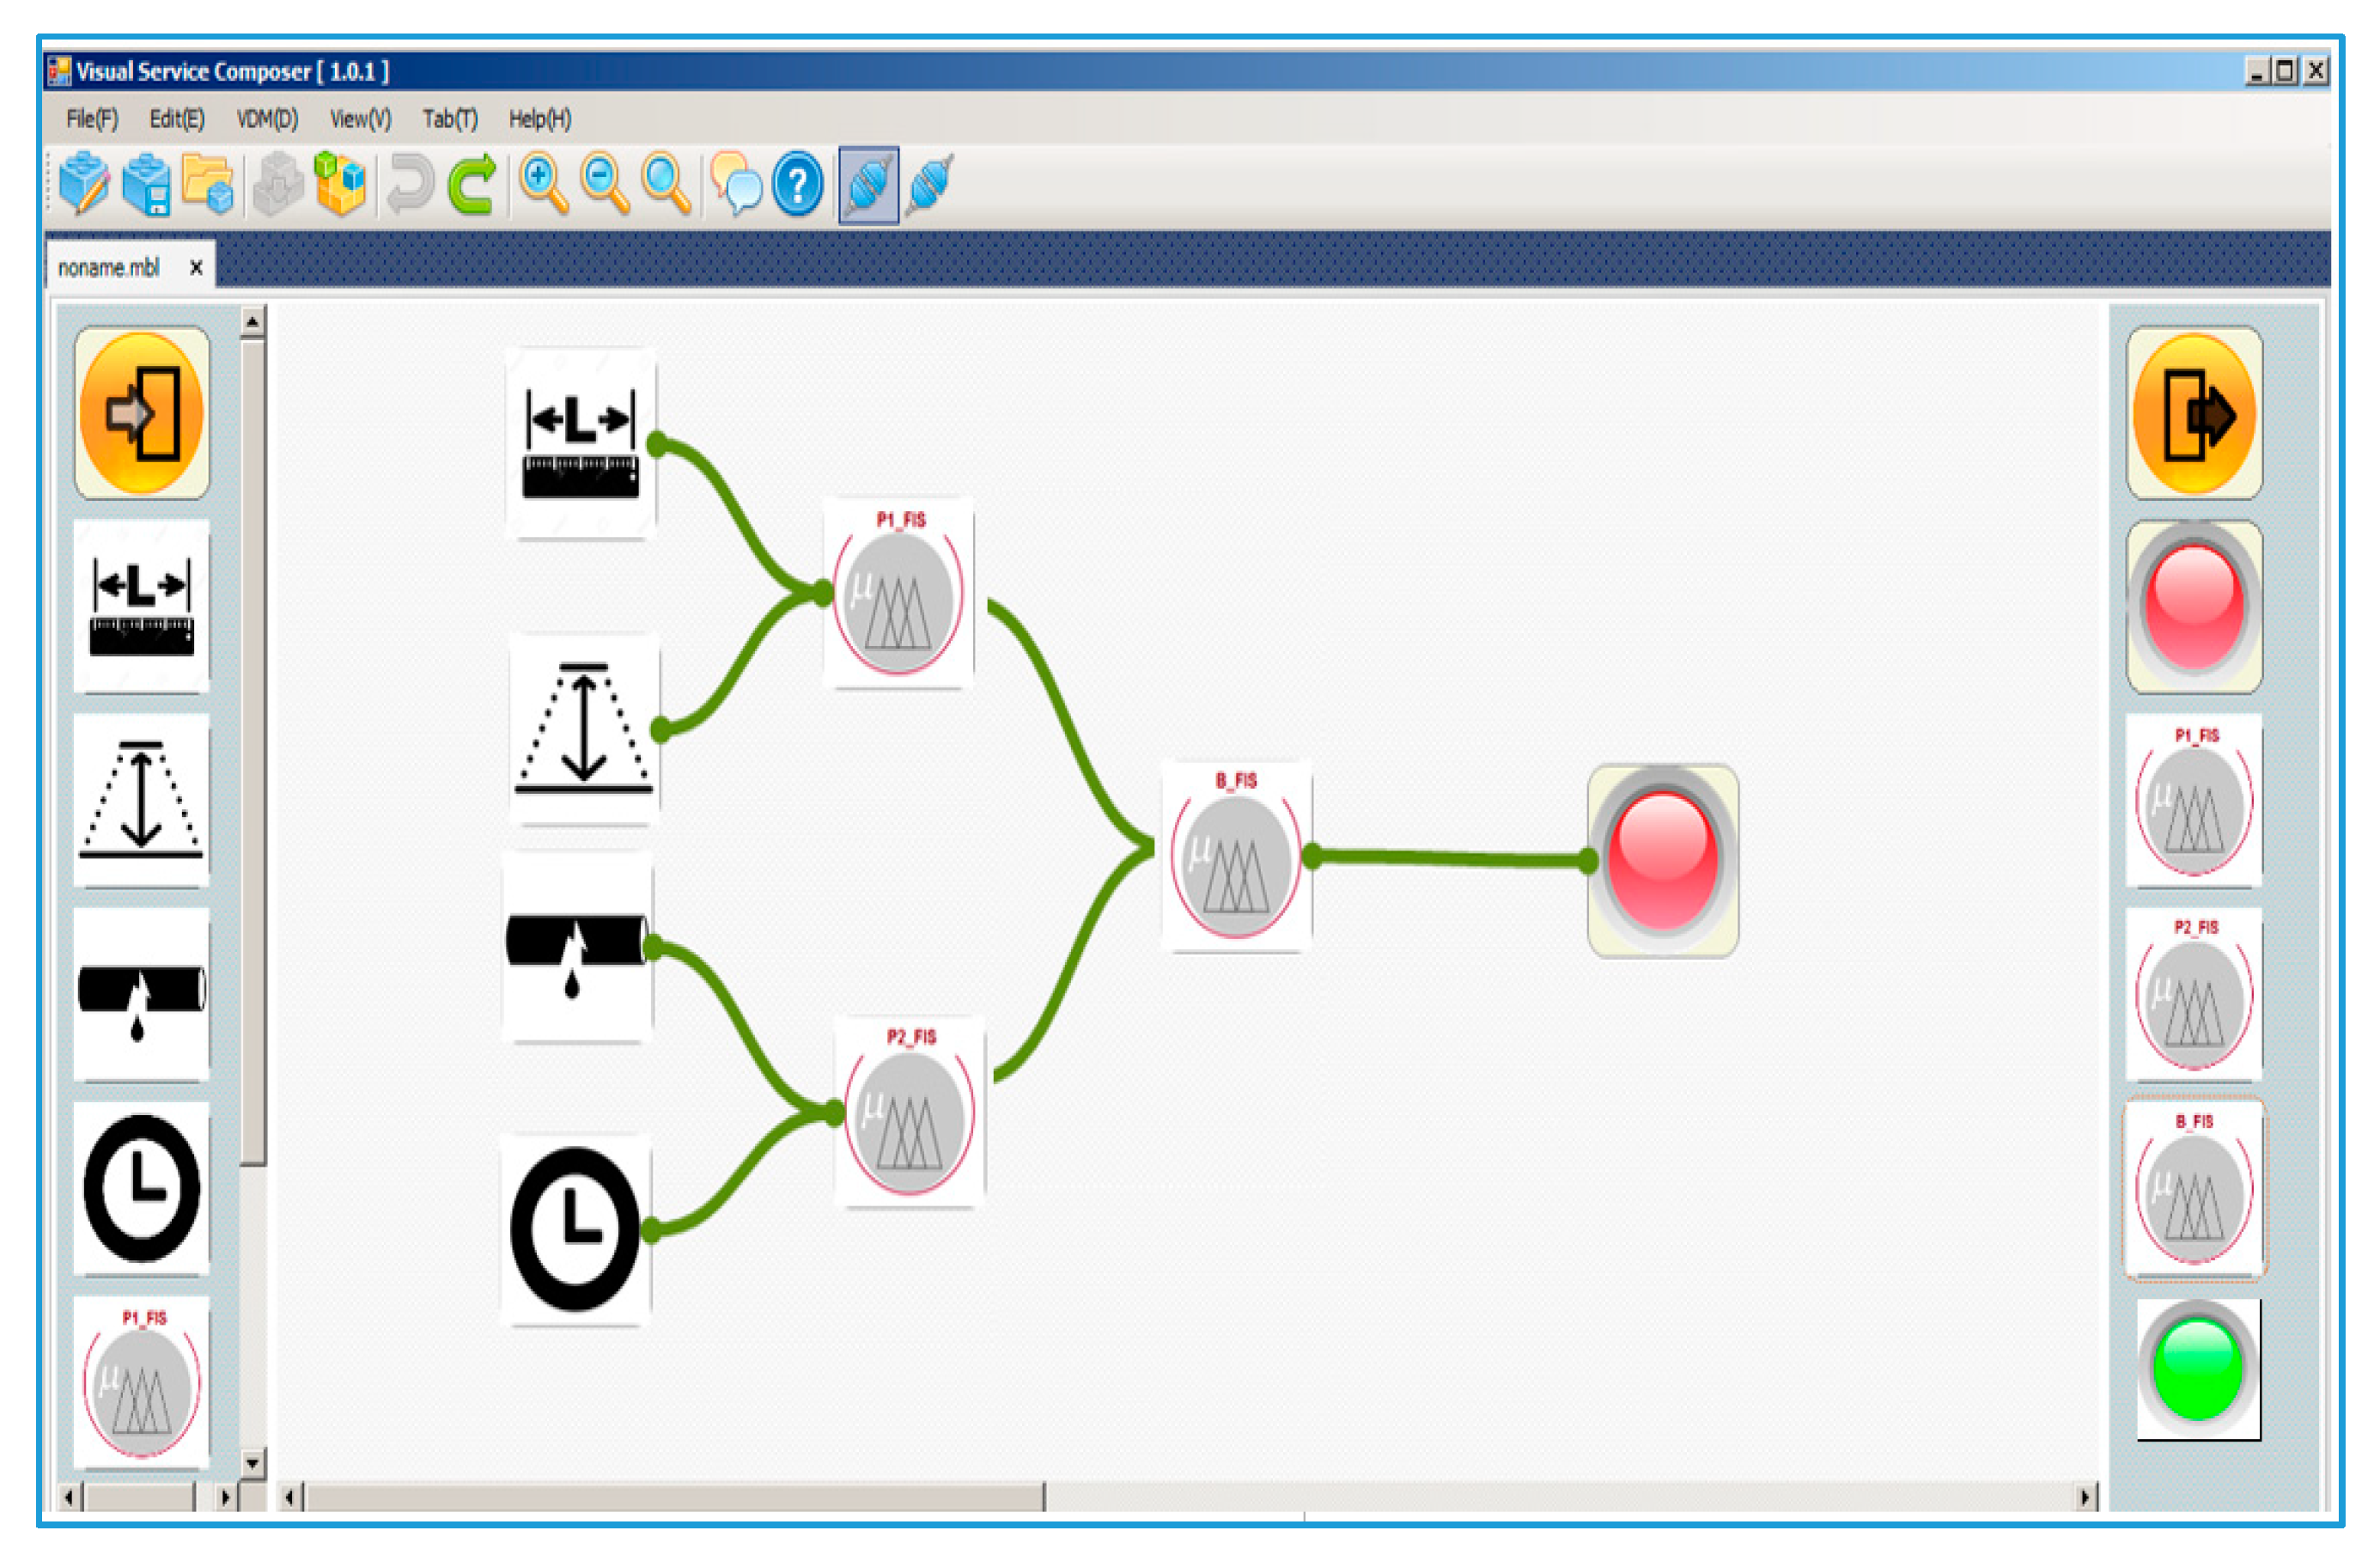
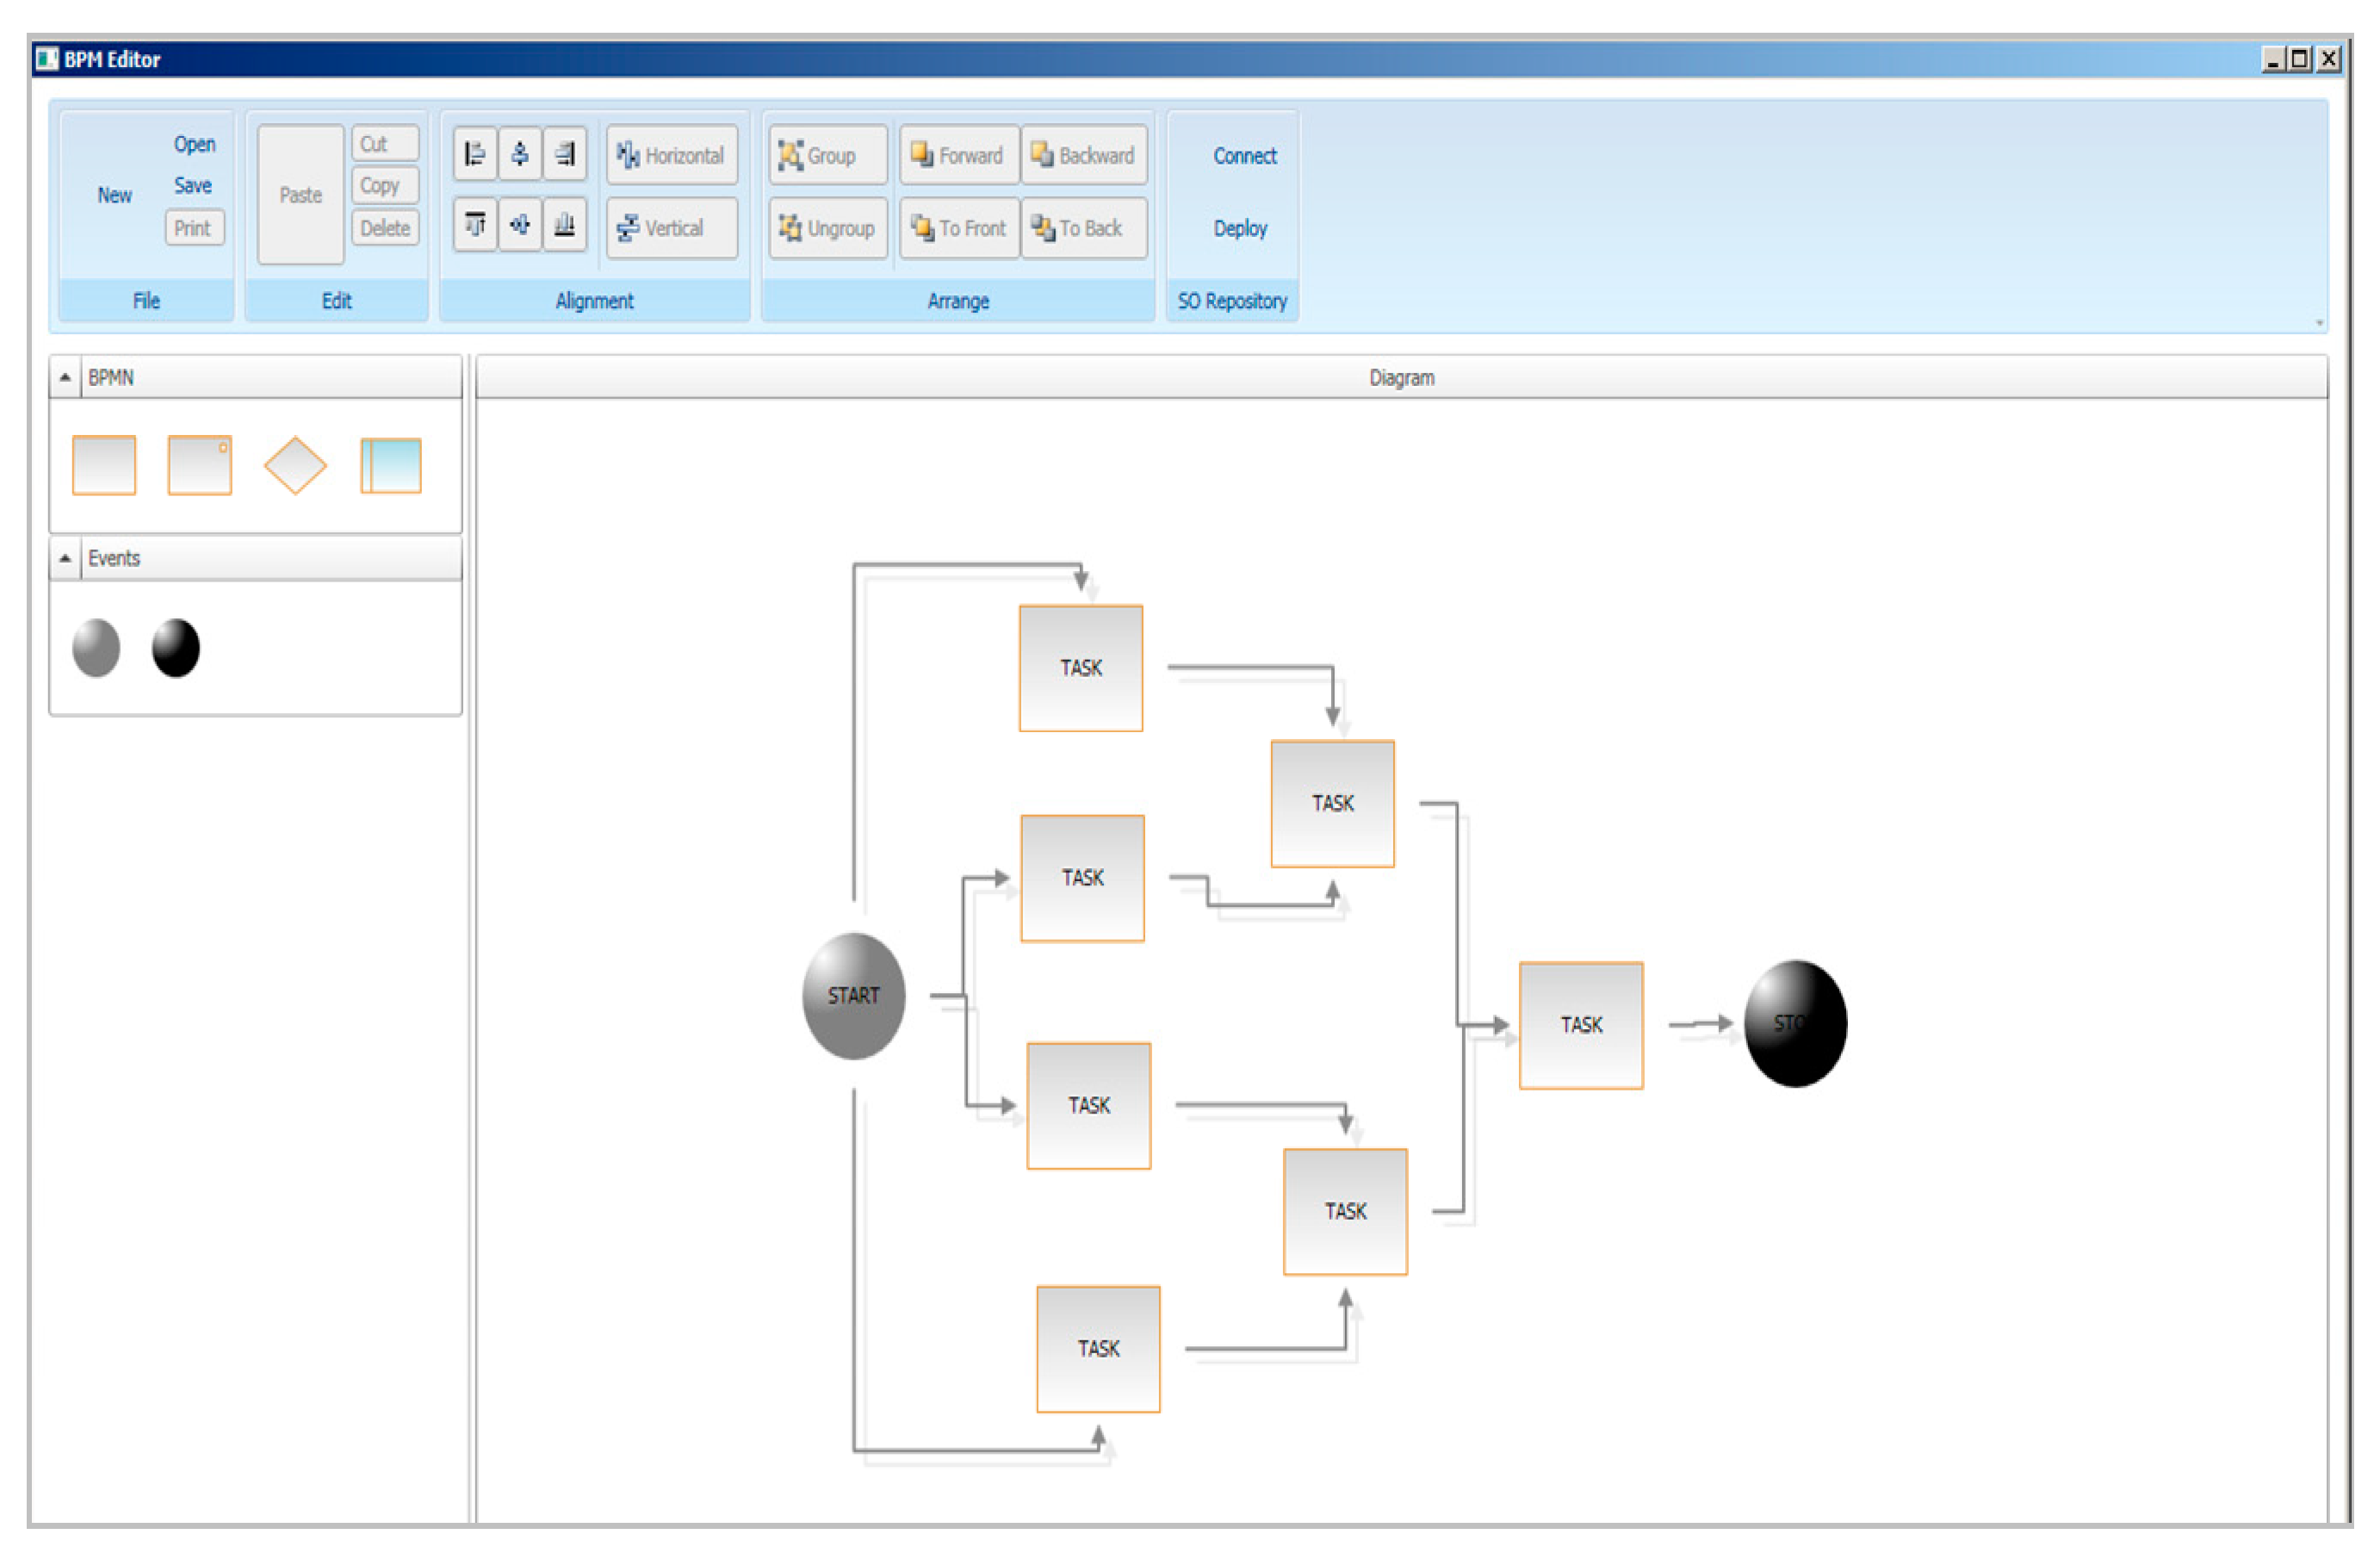
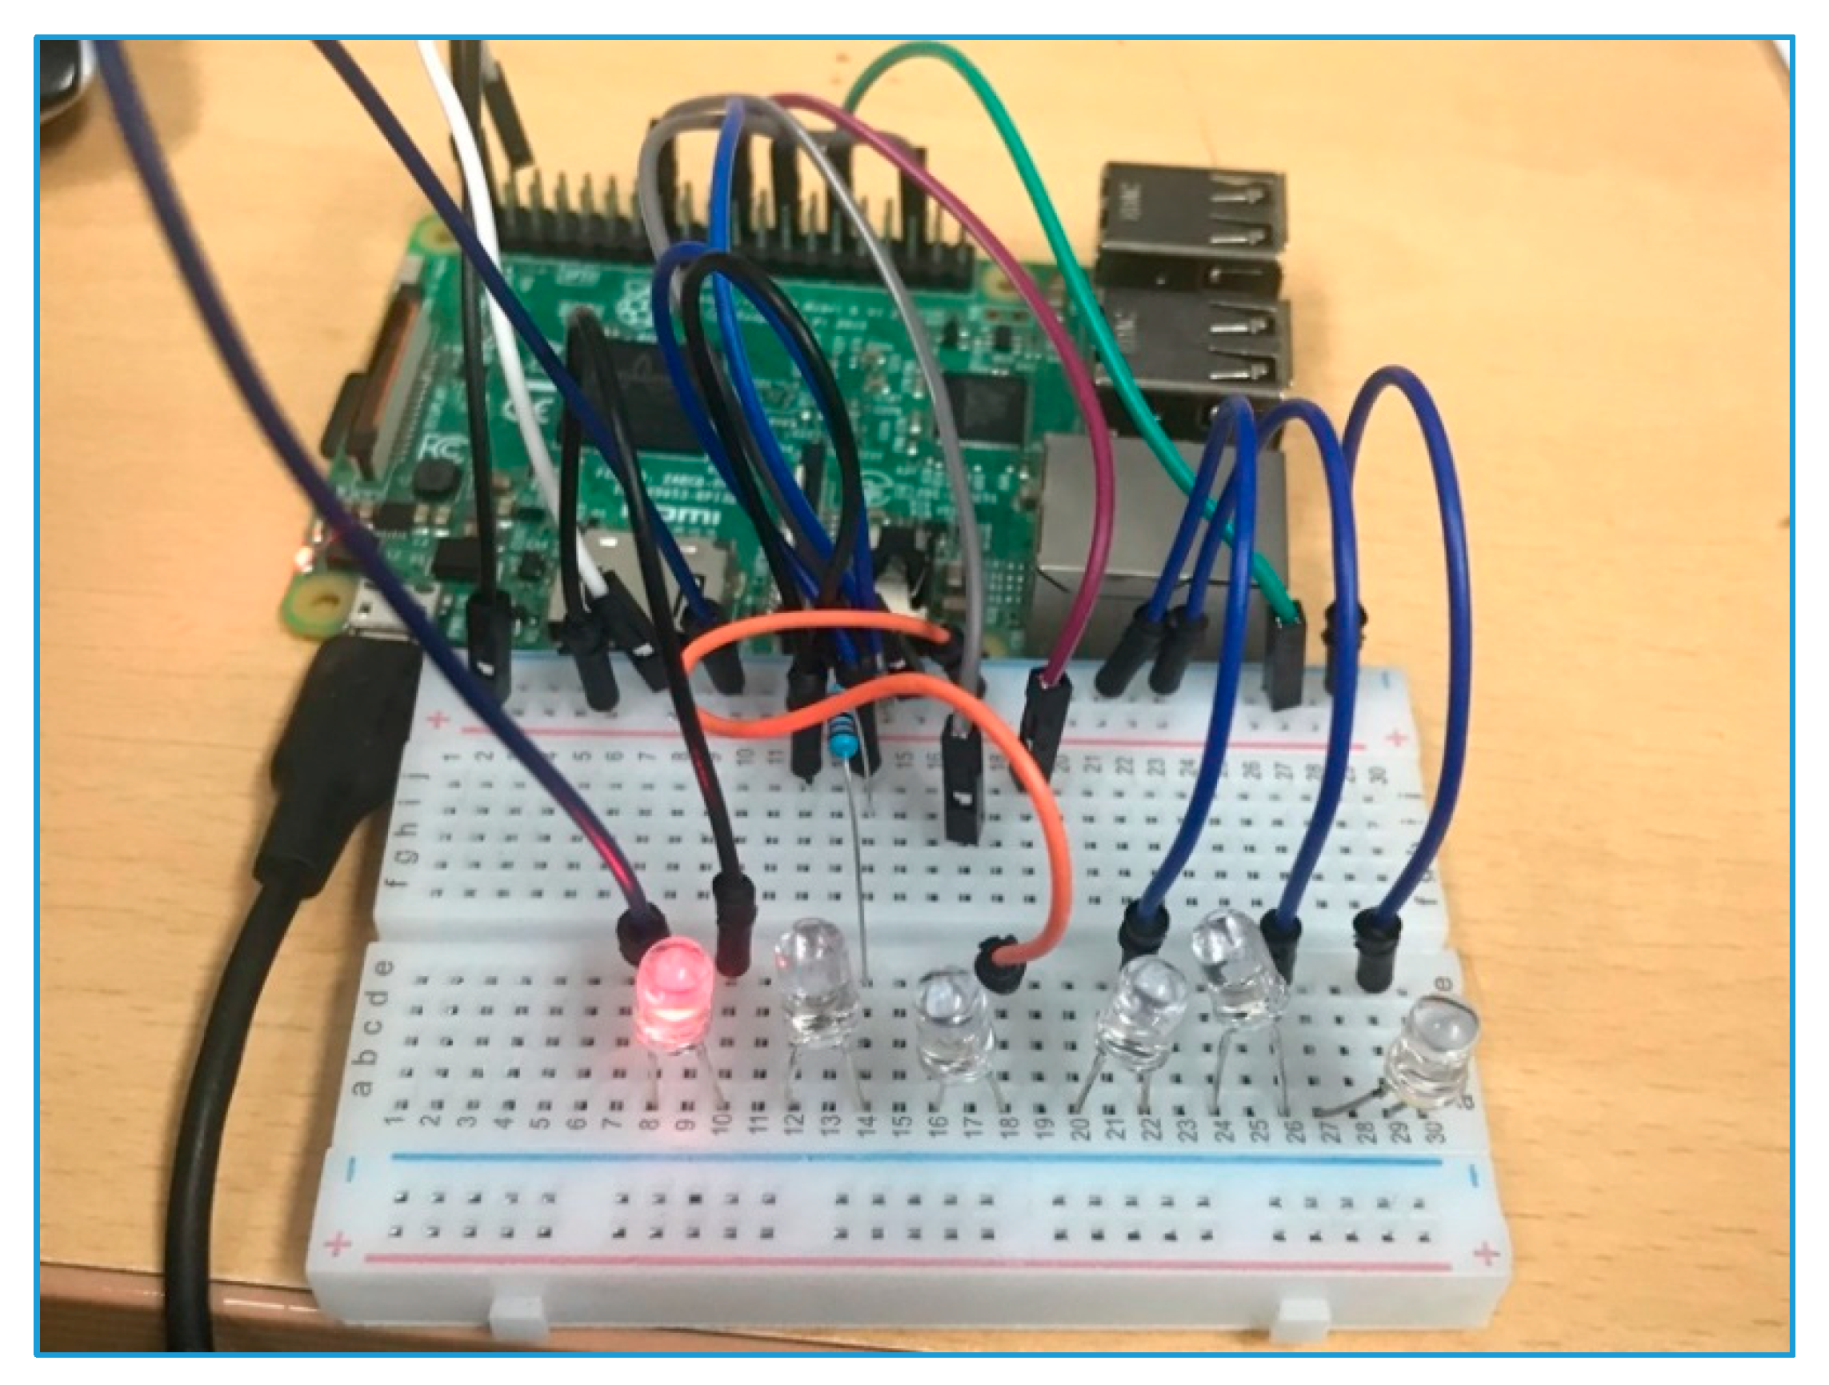
4.1. Implementation

All of the implementation of the proposed SHFL model and DIY system have been carried out in C#. Graphical figures of MFs and rules editor and rules viewer have been done in Matlab to exhibit the working machine of the proposed SHFL model better. The MFs of the input/output variables of the M1_FL are shown in Figure 5 of the M1_FL.
The input/output variables MFs of the second module of the proposed SHFL model are depicted in Figure 6.
In the proposed SHFL model, the outputs of the M1_FL and M2_FL modules are used as inputs to the M3_FL modules, hence identical MFs as defined for input variables in M1_FL and M2_FL modules. For the output variable of the M3_FL module, the MFs are depicted in Figure 7.
For the DIY implementation section, the tools and techniques used have been described in detail. The physical devices have been attached to Raspberry Pi, which acts as an IoT server for the resources connected to it. The resources have been registered on the Raspberry Pi-based IoT server, and Python 3 has been used as a core programming language. The implementation has been carried out using Python 3 of the IoT Server. Frameworks are a design pattern which helps in organizing the overall code structure and speeding up the development process at the same time. We have used a Python-based mini framework called Flask. The reason for the consideration of flask was its inherent structure and the small collection of loosely coupled modules. These qualities make the application runs to be fast, which is of paramount importance, considering the target application to be used/installed on embedded hardware having constrained capabilities. Flask is the preferred option due to its light-weighted nature and less dependency on its main modules.
Moreover, more modules can be added or removed without the need to make any change to the core of the framework. The leakage sensor, ground state sensor and LED actuator have been used in this work as physical resources, and have been registered in Flask application. For every operation on an actual physical resource, a unique URI assignment is carried out by this application so that remote applications can uniquely identify it.
This section offers a summary of the implementation detail of the implementation tools for developing the system. Table 5 illustrates the description of the implementation for the CoAP. The Raspberry Pi model has been equipped with Raspbian OS, which is a lightweight distribution of the Linux operating system. Furthermore, the device used for the implementation of this work has 1 GB of memory.
Additionally, libraries like GPIO and XMLParser have been used to interact with the input–output serial ports and XML parsing, respectively. It is worth noting that direct coding on the Raspberry Pi device is not feasible due to its slow nature; therefore, researchers prefer to connect the device using some remote access tools like SSH and Putty. For coding PyCharm, IDE has been used, which also provides the ability to access the Raspberry Pi remotely. The remote access mitigates the need to work directly on the hardware. The implementation of the virtual device manager, service composition manager and BPM editor has been carried in C# as summarized in Table 6. The basic purpose of this module is to offer a graphical DIY interface for the programming functionality for the CoAP client to control the CoAP devices.

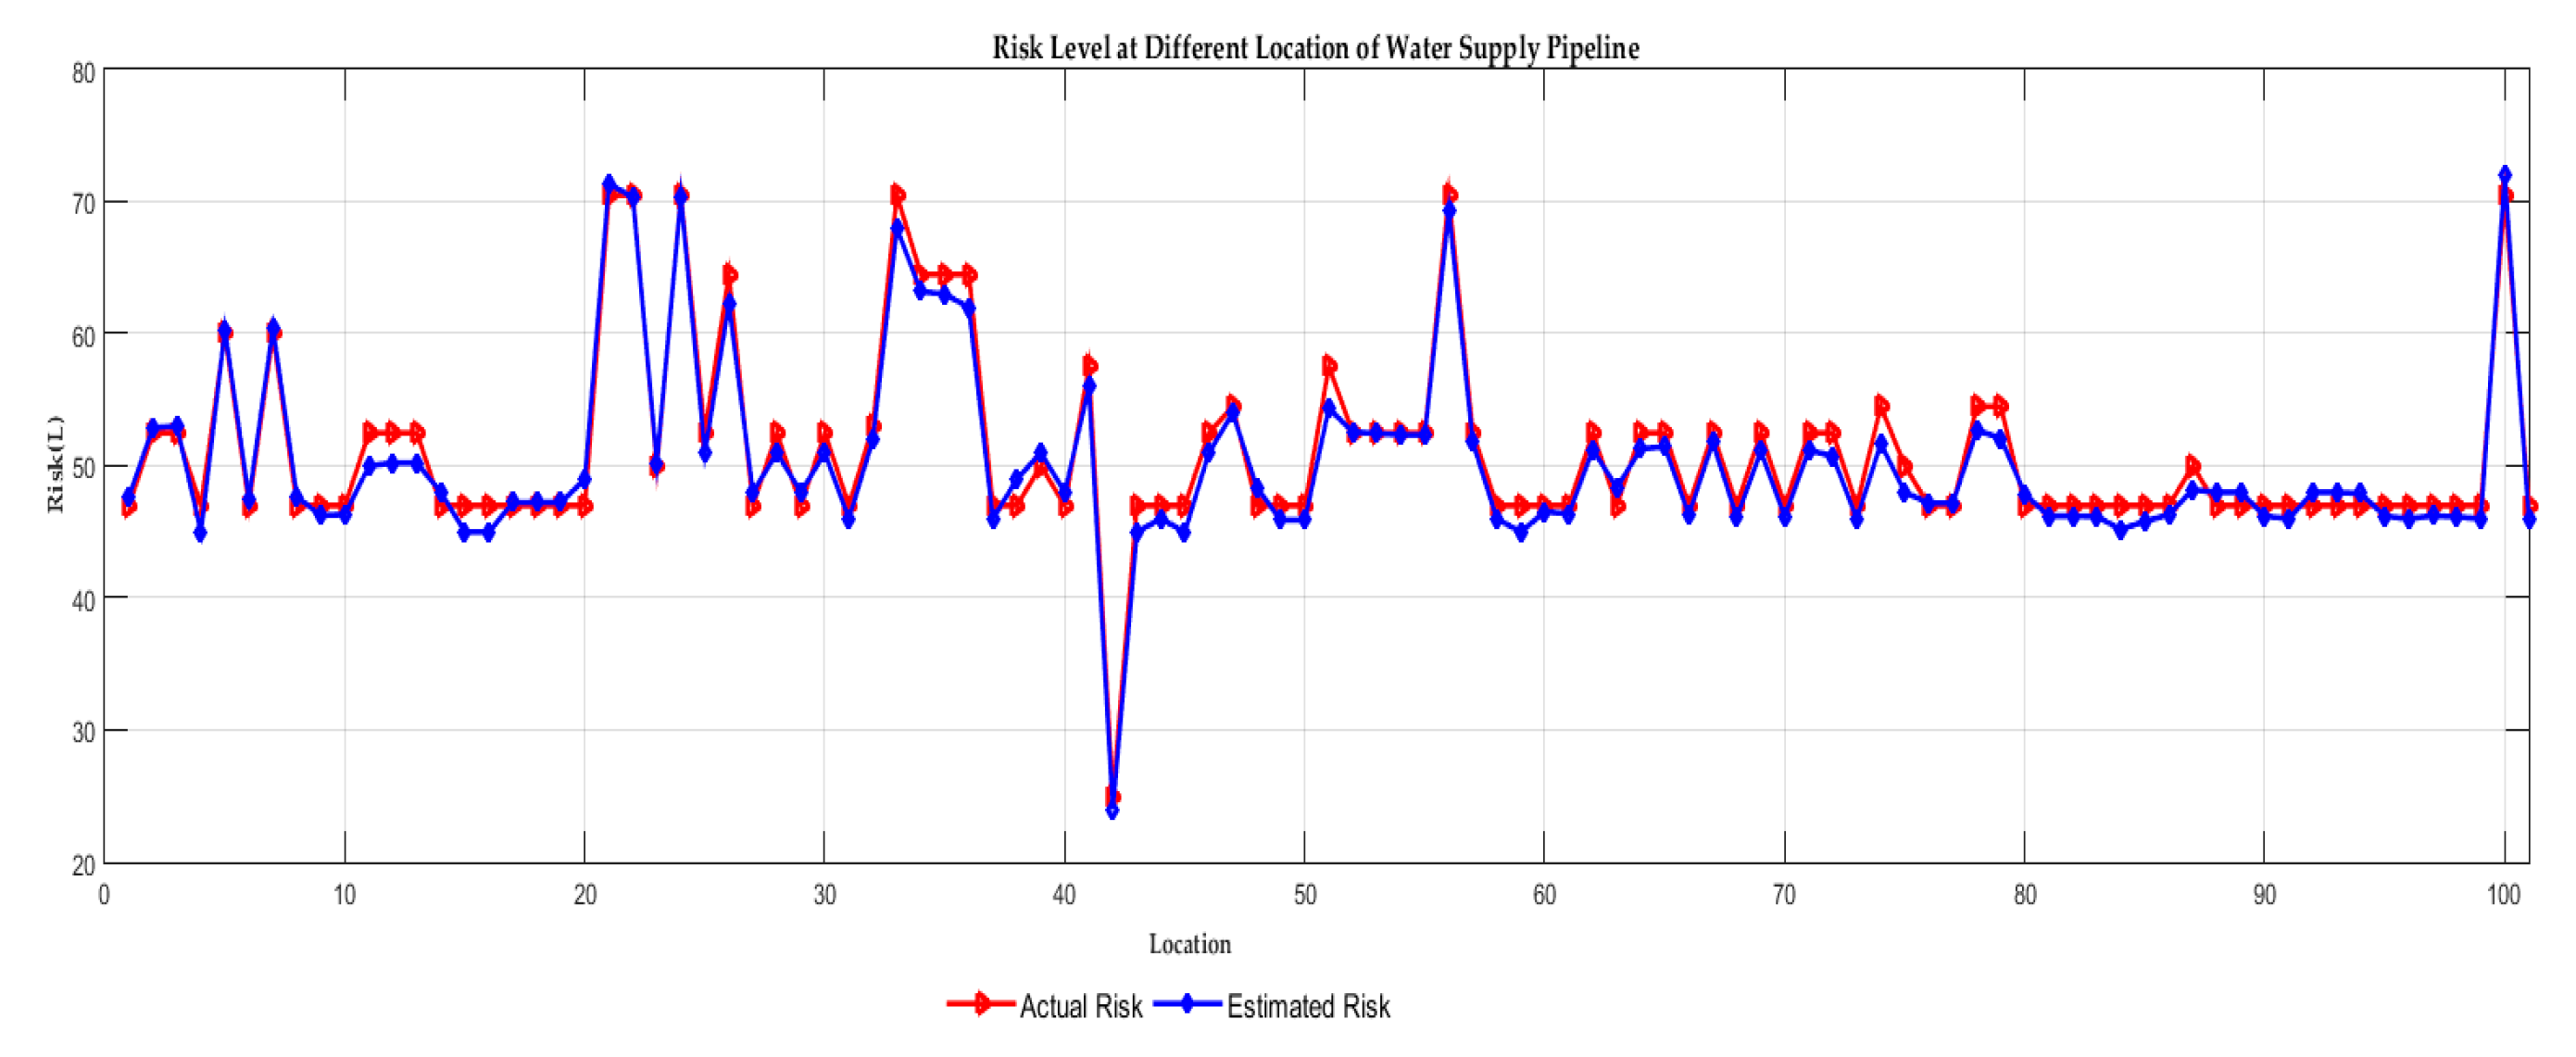
4.2. Results of SHFL Model and Execution Results of DIY

In this work, four significant factors have been taken into account to calculate the risk index by using the SHFL model for the PRI of water supply pipelines. The data have been provided by the Electronics and Telecommunications Research Institute (ETRI) organization for these factors (depth, length, age, leakage). The data have been gathered from 1989 to 2010 concerning pipelines of water supply about different locations of Seoul, Republic of Korea. Data for four parameters (depth, length, age, leakage) is shown in Figure 8.
By using the above four factors as inputs to the SHFL model, and after processing the risk, PRI values delivered using the suggested model is depicted in Figure 9 along with actual risk index values.
For the performance measurement of the proposed method, we calculated the mean square error (MSE) [51] of actual risk index values and the resulted SHFL risk index values. The value (1.729225) of this MSE is smaller, which indicates that the estimated risk index values are near to the actual risk index values.
The virtual device manager of the DIY toolbox has been shown in Figure 10. In the proposed work, we have four input parameters; hence, four VOs have been created for each input parameter. We have three fuzzy logic modules; hence, for each logical object, a separate fuzzy logic has been created. We have categorized the pipeline risk in five categories, namely very high, high, medium, low and very low; hence for each risk level a different light emitting diode (LED) color has been assigned. In the DIY, after clicking, these VOs are added to the system, which can be used in the service composition manager to compose different services.
Figure 11 illustrates the service composition manager (SCM). The SCM is the main component of the service composition layer. All the other components at the service composition layer have been implemented as part of the SCM. The SCM is a DIY graphical designer that is used to compose service objects (SO) from the virtual objects (VO) and the associated information received from the virtual object layer. As SCM is designed to be a DIY service composer interface, the users perform simple drag-n-drop, click and double-click operations using a mouse pointer to compose a design on the Work Panel, which acts as the main drawing canvas. The service composition process includes joining the input and output modules and setting up rules for their interaction and operation. The services composition manager has a window form canvas where the user can drag and drop virtual devices to compose services. Arrows represent the connection between devices. The devices on both sides of the arrow are virtual devices which reflect the physical devices. Once the services are composed, the configuration setting has been stored in XML format. In this work, we have used fuzzy logic where the leakage sensor and ground state sensor are the input VOs, and the LED is the output VO. The joining between input VOs and output VO then specifies the fuzzy logic operations. The fuzzy logic has been used to assess the risk index for water supply pipeline based on ground state and leakage of water supply pipeline.
When the fuzzy logic gets the leakage and ground state values, it applies fuzzification, inferencing and defuzzification operations for risk index (RI) calculation of WS pipelines. Once the service composition has been completed, the visual SO converts it into XML data and stores it at the SO repository.
Figure 12 shows the BPM manager; the business process model editor is responsible for the representation of the service objects (SOs) composed at the SCM as a business process modeling notations (BPMN). The aim of providing a BPMN-based representation of the service objects is to provide a DIY interface for anyone with the basic knowledge of the notations to create and deploy their IoT applications. It also eliminates the requirement of any programming skills because the user has to create a graphical model, and it can be directly deployed as an IoT application. The user creates rules and applies various scripts according to the conventions of the BPM. The BPM model created by the users via the BPM editor is stored as an XML file. This file is the direct serialization of graphical notation and the associated information such as location on the canvas, identifiers, and so forth. If the user chooses to reload a previously created BPM into the editor for updates or changes, the file contains all the information to enable the BPM editor to load and re-render the same graphical model as created by the user.
The experimental environment of the suggested work is shown in Figure 13. Raspberry Pi works as an IoT gateway. The Raspberry Pi also carries out the hosting of the IoT server; its responsibilities are listing, processing and performing actions correspondingly. To visualize the risk index calculated by this SHFL model, six LED actuators have been utilized; these indicate different risk levels. We have assigned a different risk level to different colors, such as the red color illustrates a high-risk index level. Hence, by using these colors, anyone can quickly realize the situation.

5. Conclusions

In this paper, a novel model based on a hierarchical fuzzy inference system has been suggested to assess the risk index of water supply pipelines. The suggested model is called a simplified hierarchical fuzzy logic (SHFL). The primary motivation behind the designing of this model was to decrease the set of rules. Hence in the proposed work, we have designed a model called SHFL, and the suggested model has significantly reduced the number of rules.
We have applied the proposed model on real data to test its accuracy, and the mean squared error (MSE) values indicate that the proposed model performed well. Another purpose was to develop a DIY system to facilitate a user to design a model according to his or her need and do the assessment of the WS pipelines risk index. By using the DIY system, the user can design different models according to their needs. The DIY model is comprised of five layers, namely: the physical network layer, virtual object network layer, service object layer, business process and the application layer. The representation of the risk index values of the SHFL model using a DIY system is carried out through different LED actuator colors. The risk index visualization on LEDs is necessary to trace the risk index and to take quick measurements before any accident. The novel method greatly reduces the implementation time and rule design sets that are extremely time-consuming to develop and difficult to maintain. To implement full structure, fuzzy logic 95 rules are required in the proposed SHFL model as compared to the TFL model that needs 1225 rules. Hence, the proposed model significantly reduces the time of designing rules and improves accuracy because an expert can easily design a small set of rules with more concentration. The real data that has been used in this work is provided by the Electronics and Telecommunications Research Institute (ETRI) organization. In the proposed work, the DIY system has also been proposed; the purpose of the DIY is to facilitate caretaker to design a fuzzy logic model of their own choice.
In the future, we would like to consider more parameters and different aspects related to water supply pipelines. We would also like to design more models and compare them to the existing model on the basis of accuracy and simplicity.

Author Contributions

Conceptualization, M.F. and Q.B.P.; methodology, M.F., Q.B.P., M.S.Q., D.N.K. and A.S.S.; software, M.F., N.T.T.L., M.S.Q., P.T.T.N., A.S.S. and S.K.; validation, M.F., N.T.T.L., M.S.Q., P.T.T.N., D.N.K., A.S.S. and S.K.; formal analysis, M.F. and Q.B.P.; investigation, M.F., Q.B.P., M.S.Q., D.N.K. and A.S.S.; resources, M.F., N.T.T.L., M.S.Q., P.T.T.N., D.N.K. and A.S.S.; data curation, M.F. and Q.B.P.; writing—original draft preparation, M.F., N.T.T.L. and M.S.Q.; writing—review and editing, M.F., N.T.T.L., P.T.T.N., D.N.K. and S.K.; visualization, M.F., N.T.T.L., M.S.Q., P.T.T.N., D.N.K., A.S.S. and S.K.; supervision, M.F., M.S.Q., P.T.T.N. and S.K.; project administration, M.F., M.S.Q., P.T.T.N. and S.K.; funding acquisition, M.F. and Q.B.P. All authors have read and agreed to the published version of the manuscript.

Funding

The authors would like to appreciate the financial support received from Bold 2025 grant coded RJO:10436494 by Innovation & Research Management Center (iRMC), Universiti Tenaga Nasional (UNITEN), Malaysia.

Acknowledgments

The authors would like to appreciate the financial support received from the Institute of Postgraduate Studies and Research (IPSR) of Universiti Tunku Abdul Rahman.

Conflicts of Interest

The authors declare no conflict of interest.

References

  1. Kiefner, J.F.; Rosenfeld, M.J. The Role of Pipeline Age in Pipeline Safety; INGAA Foundation, INC: Worthington, DC, USA, 2012. [Google Scholar]
  2. Christodoulou, S.E. Water network assessment and reliability analysis by use of survival analysis. Water Resour. Manag. 2011, 25, 1229–1238. [Google Scholar] [CrossRef]
  3. Inanloo, B.; Tansel, B.; Shams, K.; Jin, X.; Gan, A. A decision aid gis-based risk assessment and vulnerability analysis approach for transportation and pipeline networks. Saf. Sci. 2016, 84, 57–66. [Google Scholar] [CrossRef]
  4. Christodoulou, S.; Aslani, P.; Deligianni, A. Integrated Gis-Based Management of Water Distribution Networks. In Proceedings of the International Conference on Computing and Decision Making in Civil and Building Engineering, Montreal, QC, Canada, 14–16 June 2006; pp. 14–16. [Google Scholar]
  5. Caleyo, F.; Velázquez, J.C.; Valor, A.; Hallen, J.M. Probability distribution of pitting corrosion depth and rate in underground pipelines: A monte carlo study. Corros. Sci. 2009, 51, 1925–1934. [Google Scholar] [CrossRef]
  6. Tang, X.; Liu, Y.; Zheng, L.; Ma, C.; Wang, H. Leak Detection of Water Pipeline Using Wavelet Transform Method. In Proceedings of the 2009 International Conference on Environmental Science and Information Application Technology, Wuhan, China, 4–5 July 2009; Volume 2, pp. 217–220. [Google Scholar]
  7. Kleiner, Y.; Rajani, B. Considering Time-Dependent Factors in the Statistical Prediction of Water Main Breaks. In Proceedings of the American Water Works Association Infrastructure Conference, Baltimore, MD, USA, 12–15 March 2000; pp. 12–15. [Google Scholar]
  8. Kleiner, Y.; Rajani, B. Forecasting variations and trends in water-main breaks. J. Infrastruct. Syst. 2002, 8, 122–131. [Google Scholar] [CrossRef]
  9. Zadeh, L.A. Fuzzy sets. Inf. Control 1965, 8, 338–353. [Google Scholar] [CrossRef] [Green Version]
  10. Lee, M.-L.; Chung, H.-Y.; Yu, F.-M. Modeling of hierarchical fuzzy systems. Fuzzy Sets Syst. 2003, 138, 343–361. [Google Scholar] [CrossRef]
  11. Fayaz, M.; Ullah, I.; Park, D.-H.; Kim, K.; Kim, D. An integrated risk index model based on hierarchical fuzzy logic for underground risk assessment. Appl. Sci. 2017, 7, 1037. [Google Scholar] [CrossRef] [Green Version]
  12. Fayaz, M.; Ahmad, S.; Ullah, I.; Kim, D. A blended risk index modeling and visualization based on hierarchical fuzzy logic for water supply pipelines assessment and management. Processes 2018, 6, 61. [Google Scholar] [CrossRef] [Green Version]
  13. Chang, C.-W.; Tao, C.-W. A simplified implementation of hierarchical fuzzy systems. Soft Comput. 2019, 23, 4471–4481. [Google Scholar] [CrossRef]
  14. Roelands, M.; Claeys, L.; Godon, M.; Geerts, M.; Feki, M.A.; Trappeniers, L. Enabling the masses to become creative in smart spaces. In Architecting the Internet of Things; Springer: Berlin, Germany, 2011; pp. 37–64. [Google Scholar]
  15. Coetzee, L.; Eksteen, J. Internet of things—Promise for the Future? An Introduction. In Proceedings of the IST Africa 2011 Conference & Exhibition, Gaborone, Botswana, 11–13 May 2011; p. 9. [Google Scholar]
  16. Khan, M.S.; Kim, D. DIY interface for enhanced service customization of remote IoT devices: A coap based prototype. Int. J. Distrib. Sens. Netw. 2015, 11, 542319. [Google Scholar] [CrossRef]
  17. Hamm, S. The Internet of Things. Available online: https://www.ibm.com/ibm/history/ibm100/us/en/ideas/sep2011china.html (accessed on 11 November 2019).
  18. Atzori, L.; Iera, A.; Morabito, G. The internet of things: A survey. Comput. Netw. 2010, 54, 2787–2805. [Google Scholar] [CrossRef]
  19. Gubbi, J.; Buyya, R.; Marusic, S.; Palaniswami, M. Internet of things (IoT): A vision, architectural elements, and future directions. Future Gener. Comput. Syst. 2013, 29, 1645–1660. [Google Scholar] [CrossRef] [Green Version]
  20. LeHong, H.; Fenn, J. Hype cycle for emerging technologies 2011. Available online: https://www.gartner.com/en/documents/1754719/hype-cycle-for-emerging-technologies-2011 (accessed on 23 October 2019).
  21. Miorandi, D.; Sicari, S.; De Pellegrini, F.; Chlamtac, I. Internet of things: Vision, applications and research challenges. Ad Hoc Netw. 2012, 10, 1497–1516. [Google Scholar] [CrossRef] [Green Version]
  22. Ventura, D.; Casado-Mansilla, D.; López-de-Armentia, J.; Garaizar, P.; López-de-Ipiña, D.; Catania, V. Ariima: A real IoT implementation of a machine-learning architecture for reducing energy consumption. In Ubiquitous Computing and Ambient Intelligence. Personalisation and User Adapted Services; Hervás, R., Lee, S., Nugent, C., Bravo, J., Eds.; Springer International Publishing: Cham, Switzerland, 2014; pp. 444–451. [Google Scholar]
  23. Kelly, S.D.T.; Suryadevara, N.K.; Mukhopadhyay, S.C. Towards the implementation of IoT for environmental condition monitoring in homes. IEEE Sens. J. 2013, 13, 3846–3853. [Google Scholar] [CrossRef]
  24. Gama, K.; Touseau, L.; Donsez, D. Combining heterogeneous service technologies for building an internet of things middleware. Comput. Commun. 2012, 35, 405–417. [Google Scholar] [CrossRef]
  25. Atzori, L.; Iera, A.; Morabito, G. From “smart objects” to “social objects”: The next evolutionary step of the internet of things. IEEE Commun. Mag. 2014, 52, 97–105. [Google Scholar] [CrossRef]
  26. Xiao, G.; Guo, J.; Da Xu, L.; Gong, Z. User interoperability with heterogeneous IoT devices through transformation. IEEE Trans. Ind. Inform. 2014, 10, 1486–1496. [Google Scholar] [CrossRef]
  27. What Is Raspberry Pi. Available online: https://www.raspberrypi.org/help/what-is-a-raspberry-pi/ (accessed on 11 November 2019).
  28. Kushner, D. The making of Arduino. IEEE Spectr. 2011, 26, 1–7. [Google Scholar]
  29. Li, D.; Yao, W. Risk Assessment of Long-Distance Water Transmission Pipeline Based on Fuzzy Similarity Evaluation Approach. In Proceedings of the 2016 12th International Conference on Natural Computation, Fuzzy Systems and Knowledge Discovery (ICNC-FSKD), Changsha, China, 13–15 August 2016; pp. 1096–1102. [Google Scholar]
  30. Tripathy, D.P.; Ala, C.K. Risk assessment in underground coalmines using fuzzy logic in the presence of uncertainty. J. Inst. Eng. (India): Ser. D 2018, 99, 157–163. [Google Scholar] [CrossRef]
  31. Chen, C.-T.; Lin, C.-T.; Huang, S.-F. A fuzzy approach for supplier evaluation and selection in supply chain management. Int. J. Prod. Econ. 2006, 102, 289–301. [Google Scholar] [CrossRef]
  32. Gul, M.; Guneri, A.F. A fuzzy multi criteria risk assessment based on decision matrix technique: A case study for aluminum industry. J. Loss Prev. Process Ind. 2016, 40, 89–100. [Google Scholar] [CrossRef]
  33. Zhang, J.; Gao, J.; Diao, M.; Wu, W.; Wang, T.; Qi, S. A case study on risk assessment of long distance water supply system. Procedia Eng. 2014, 70, 1762–1771. [Google Scholar] [CrossRef] [Green Version]
  34. Ullah, I.; Fayaz, M.; Kim, D. Analytical modeling for underground risk assessment in smart cities. Appl. Sci. 2018, 8, 921. [Google Scholar] [CrossRef] [Green Version]
  35. Fayaz, M.; Ullah, I.; Kim, D.-H. Underground risk index assessment and prediction using a simplified hierarchical fuzzy logic model and Kalman filter. Processes 2018, 6, 103. [Google Scholar] [CrossRef] [Green Version]
  36. Cheong, F.; Lai, R. Designing a hierarchical fuzzy logic controller using the differential evolution approach. Appl. Soft Comput. 2007, 7, 481–491. [Google Scholar] [CrossRef] [Green Version]
  37. Leadbeater, C.; Miller, P. The Pro-Am Revolution: How Enthusiasts are Changing Our Society and Economy; Demos: London, UK, 2004. [Google Scholar]
  38. Roeck, D.D.; Slegers, K.; Criel, J.; Godon, M.; Claeys, L.; Kilpi, K.; Jacobs, A. I would Diyse for It!: A Manifesto for Do-It-Yourself Internet-of-Things Creation. In Proceedings of the 7th Nordic Conference on Human-Computer Interaction: Making Sense through Design, Copenhagen, Denmark, 14–17 October 2012; ACM: New York, NY, USA, 2012; pp. 170–179. [Google Scholar]
  39. Jin, Z.; Bose, B.K. Evaluation of Membership Functions for Fuzzy Logic Controlled Induction Motor Drive. In Proceedings of the IEEE 2002 28th Annual Conference of the Industrial Electronics Society, IECON 02, Sevilla, Spain, 5–8 November 2002; Volume 1, pp. 229–234. [Google Scholar]
  40. Feki, M.A.; Kawsar, F.; Boussard, M.; Trappeniers, L. The internet of things: The next technological revolution. Computer 2013, 46, 24–25. [Google Scholar] [CrossRef]
  41. Scott, G.; Chin, J. A DIY Approach to Pervasive Computing for the Internet of Things: A Smart Alarm Clock. In Proceedings of the 5th Computer Science and Electronic Engineering Conference (CEEC), Colchester, UK, 17–18 September 2013; pp. 57–60. [Google Scholar]
  42. Ahmad, S.; Hang, L.; Kim, D. Design and implementation of cloud-centric configuration repository for DIY IoT applications. Sensors 2018, 18, 474. [Google Scholar] [CrossRef] [Green Version]
  43. Heath, N. How IBM’s Node-Red is Hacking Together the Internet of Things. Available online: http://www. techrepublic.com/article/node-red (accessed on 12 November 2019).
  44. Kleinfeld, R.; Steglich, S.; Radziwonowicz, L.; Doukas, C. Glue.Things: A Mashup Platform for Wiring the Internet of Things with the Internet of Services. In Proceedings of the 5th International Workshop on Web of Things, Cambridge, MA, USA, 8 October 2014; pp. 16–21. [Google Scholar]
  45. Quoc, H.N.M.; Serrano, M.; Le-Phuoc, D.; Hauswirth, M. Super Stream Collider–Linked Stream Mashups for Everyone. In Proceedings of the Semantic Web Challenge at ISWC 2012, Boston, MA, USA, 11–15 November 2012. [Google Scholar]
  46. Hyemin, L.; Dongig, S.; Eunsoo, P.; Injung, H.; Gyeonghwan, H.; Dongkun, S. Open Software Platform for Companion IoT Devices. In Proceedings of the 2017 IEEE International Conference on Consumer Electronics (ICCE), Las Vegas, NV, USA, 8–10 January 2017; pp. 394–395. [Google Scholar]
  47. PTC. Enterprise IoT Solutions and Platform Technology. Available online: https://www.ptc.com/en/products/iiot/thingworx-platform (accessed on 23 October 2019).
  48. Particle. Connect Your Internet of Things (IoT) Devices. Available online: https://www.particle.io/ (accessed on 23 January 2018).
  49. Klir, G.J.; Yuan, B. Fuzzy Sets and Fuzzy Logic: Theory and Applications; Prentice Hall: Upper Saddle River, NJ, USA, 1995; p. 563. [Google Scholar]
  50. Fayaz, M.; Ullah, I.; Kim, D. An optimized fuzzy logic control model based on a strategy for the learning of membership functions in an indoor environment. Electronics 2019, 8, 132. [Google Scholar] [CrossRef] [Green Version]
  51. Fayaz, M.; Kim, D. A prediction methodology of energy consumption based on deep extreme learning machine and comparative analysis in residential buildings. Electronics 2018, 7, 222. [Google Scholar] [CrossRef]
Figure 1. Traditional fuzzy logic model.
Symmetry 12 00044 g001
Figure 2. Simplified hierarchical fuzzy logic model.
Symmetry 12 00044 g002
Figure 3. Mapping of cyberspace to physical space.
Symmetry 12 00044 g003
Figure 4. The detailed design of the proposed simplified hierarchical fuzzy (SHFIS) model on the Do it Yourself (DIY) toolbox.
Symmetry 12 00044 g004
Figure 5. Input/output membership functions (MFs) of input/output variables of M1_FL. (a) depth; (b) length; (c) risk.
Symmetry 12 00044 g005
Figure 6. Input/output MFs of M2_FL module. (a) leakage; (b) age; (c) risk.
Symmetry 12 00044 g006
Figure 7. MFs for output variable of M3_FL.
Symmetry 12 00044 g007
Figure 8. Input data for (a) depth; (b) length; (c) age and (d) leakage.
Symmetry 12 00044 g008
Figure 9. Actual risk index values provided by the Electronics and Telecommunications Research Institute (ETRI) and the calculated risk index values by using the simplified hierarchical fuzzy logic (SHFL).
Symmetry 12 00044 g009
Figure 10. Virtual device manager of the DIY toolbox.
Symmetry 12 00044 g010
Figure 11. Service composition manager (SCM).
Symmetry 12 00044 g011
Figure 12. Business process manager (BPM).
Symmetry 12 00044 g012
Figure 13. The experimental environment of the proposed DIY-based SHFL model.
Symmetry 12 00044 g013
Table 1. Abbreviations and their Description.
AbbreviationDescriptionAbbreviationDescription
X1DepthNGNear to Ground
X2LengthNNormal
X3AgeNDNear to Deep
X4LeakageDRDeeper
SHFLSimplified Hierarchical Fuzzy LogicDTDeepest
WSPLWater Supply PipelinesSTShortest
BPMBusiness Process ModelingSShort
TFLTraditional Fuzzy LogicMMedium
HFLHierarchical Fuzzy LogicLLong
PFLRProposed Fuzzy Logic RulesLTLongest
TFLRTraditional Fuzzy Logic RulesVLLRVery Low-Level Risk
M1_FLMiddle Layer 1 Fuzzy LogicLLRLow-Level Risk
M2_FLMiddle Layer 2 Fuzzy LogicMLRMedium-Level Risk
M3_FLOut Fuzzy LogicHLRHigh-Level Risk
ELPExtremely Low-level ProbabilityVHLRVery High-Level Risk
VLPVery Low-level ProbabilityFLFuzzy Logic
LPLow-level ProbabilityWSWater Supply
MPIntermediate-level ProbabilityRIRisk Index
HPHigh-level ProbabilityDTDeepest
VHPVery High-level ProbabilitySTShortest
EHPExtremely High-level ProbabilitySShort
VOVery OldMMedium
OOldLLong
IAIntermediate AgeLRLonger
NNormalFLFuzzy Logic
BNBrand NewWSWater Supply
ENGExtremely Near to GroundRIRisk Index
DDeep
Table 2. Rules designed for M1_FL.
X1ENGNGNNDDDRDT
X2
STVHLRVLLRVLLRLLRMLRMLRVHLR
SVHLRLLRLLRILRMLRHLRLLR
MVHLRLLRMLRILRHLRVHLRLLR
LVHLRILRILRHLRVHLRVHLRILR
LTVHLRILRHLRVHLRVHLRVHLRHLR
Table 3. Rules design for M2_FL.
X3ELLPVLLPLLPILPHLPVHLPEHLP
X4
VOVLLRVLLRLLRILRILRVHLRVHLR
OVLLRLLRILRILRHLRVHLRVHLR
IALLRILRILRHLRVHLRVHLREHLR
NILRILRHLRVHLRVHLRVHLREHLR
BNILRHLRVHLRVHLRVHLRVHLREHLR
Table 4. Rules designed for M3_FL.
PR1VLRLRIRHRVHR
PR2
VLRVLLRVLLRLLRILRILR
LRVLLRLLRILRILRHLR
IRLLRILRILRHLRVHLR
HRILRILRHLRVHLRVHLR
VHRILRHLRVHLRVHLRVHLR
Table 5. Raspberry Pi components decription.
ComponentDescription
HardwareRaspberry Pi 3 Model B
Operating SystemRaspbian
Memory1GB Resources
ActuatorsLEDs
IDEVim, PyCharm (Remote Access)
Programming LanguagePython 3
Table 6. Development environment for virtual device manager, service composition manager and Business Process Modeling (BPM) manager.
ComponentDescription
Operation SystemWindow 7 64 bits
CPUIntel Xeon E3-1230 V2 @ 3.3 Ghz × 2
Memory8GB
Development environmentEclipse Luna
CoAP PlatformCalifornium

