Bilateral and Unilateral Asymmetries of Strength and Flexibility in Young Elite Sailors: Windsurfing, Optimist and Laser Classes


Abstract
1. Introduction
2. Material and Methods
2.1. Participants
2.2. Hand Dynamometry
2.3. Straight Leg Lift Test (SLL)
2.4. Symmetry Index (SI)
2.5. Functional Asymmetry of Compression Force (FACF)
2.6. Statistical Analyses
3. Results
4. Discussion
5. Conclusions
Author Contributions
Funding
Conflicts of Interest
References
- Castagna, O.; Vaz, C.; Brisswalter, J. The assessment of energy demand in the new Olympic windsurf board: N eilpryde RS: X. Eur. J. Appl. Physiol. 2007, 100, 247–252. [Google Scholar] [CrossRef] [PubMed]
- Callewaert, M.; Geerts, S.; Lataire, E.; Boone, J.; Vantorre, M.; Bourgois, J. Development of an upwind sailing ergometer. Int. J. Sports Physiol. Perform. 2013, 8, 663–670. [Google Scholar] [CrossRef] [PubMed][Green Version]
- Pulur, A. Determination of physical and physiological profiles of international elite sailors. Afr. J. Bus. Manag. 2010, 5, 3071–3075. [Google Scholar]
- Vogiatzis, I.; De Vito, G.; Rodio, A.; Madaffari, A.; Marchetti, M. The physiological demands of sail pumping in Olympic level windsurfers. Eur. J. Appl. Physiol. 2002, 86, 450–454. [Google Scholar]
- Guével, A.; Hogrel, J.Y.; Marini, J.F. Fatigue of elbow flexors during repeated flexion-extension cycles: Effect of movement strategy. Int. J. Sports Med. 2000, 21, 492–498. [Google Scholar] [CrossRef]
- Castagna, O.; Brisswalter, J.; Lacour, J.R.; Vogiatzis, J. Physiological demands of different sailing techniques of the new Olympic windsurfing class. Eur. J. Appl. Physiol. 2008, 104, 1061–1067. [Google Scholar] [CrossRef]
- Nadler, S.F.; Malanga, G.A.; DePrince, M.; Stitik, T.P.; Feinberg, J.H. The relationship between lower extremity injury, low back pain, and hip muscle strength in male and female collegiate athletes. Clin. J. Sport Med. 2000, 10, 89–97. [Google Scholar] [CrossRef]
- Grygorowicz, M.; Kubacki, J.; Pilis, W.; Gieremek, K.; Rzepka, R. Selected isokinetic test in knee injury prevention. Biol. Sport 2010, 27, 47–51. [Google Scholar] [CrossRef]
- Mathiowetz, V.; Kashman, N.; Volland, G.; Weber, K.; Dowe, M.; Rogers, S. Grip and pinch strength: Normative data for adults. Arch. Phys. Med. Rehabil. 1985, 66, 69–74. [Google Scholar]
- Ramos, D.; González-Montesinos, J.L.; Mora-Vicente, J. Evolution of the articular range in primary and secondary school. Rev. Int. Med. Cienc. Act. Fis. Deporte 2007, 7, 144–157. [Google Scholar]
- Svantesson, U.; Norde, M.; Svensson, S.; Brodin, E. A comparative study of the Jamar (R) and the Grippit (R) for measuring handgrip strength in clinical practice. Isokinet. Exerc. Sci. 2009, 17, 85–91. [Google Scholar] [CrossRef]
- Daneshjoo, A.; Rahnama, N.; Mokhtar, A.H.; Yusof, A. Bilateral and unilateral asymmetries of isokinetic strength and flexibility in male young professional soccer players. J. Hum. Kinet. 2013, 36, 45–53. [Google Scholar] [CrossRef] [PubMed]
- Stöggl, T.; Hébert-Losier, K.; Holmberg, H.C. Do anthropometrics, biomechanics, and laterality explain V1 side preference in skiers? Med. Sci. Sports Exerc. 2013, 45, 1569–1576. [Google Scholar] [CrossRef] [PubMed]
- Bell, D.R.; Sanfilippo, J.L.; Binkley, N.; Heiderscheit, B.C. Lean mass asymmetry influences force and power asymmetry during jumping in collegiate athletes. J. Strength Cond. Res. 2014, 28, 884–891. [Google Scholar] [CrossRef] [PubMed]
- Czuba, M.; Maszczyk, A.; Gerasimuk, D.; Rocziniok, R.; Fidos-Czuba, O.; Zajac, A.; Golas, A.; Mostowik, A.; Langfort, J. The effects of hypobaric hypoxia on erythropoiesis, maximal oxygen uptake and energy cost of exercise under normoxia in elite biathletes. J. Sports Sci. Med. 2014, 13, 912–920. [Google Scholar]
- Evershed, J.; Burkett, B.; Mellifont, R. Musculoskeletal screening to detect asymmetry in swimming. Phys. Ther. Sport 2014, 15, 33–38. [Google Scholar] [CrossRef]
- Björklund, G.; Alricsson, M.; Svantesson, U. Using bilateral functional and anthropometric test to define symmetry in cross-country skiers. J. Hum. Kinet. 2017, 60, 9–18. [Google Scholar] [CrossRef][Green Version]
- Castro, J. Assement of Physical Fitness in Children Aged 6 to 17 Years. Proposal of Health-Related Fitness Test Battery; The Alpha Study. Ph.D. Thesis, Cádiz University, Cádiz, Spain, 2009. [Google Scholar]
- Ferrer, V. Repercusiones de la Cortedad Isquiosural Sobre la Pelvis y el Raquis Lumbar. Ph.D. Thesis, Murcia University, Murcia, Spain, 1998. [Google Scholar]
- Robinson, R.O.; Herzog, W.; Nigg, B.M. Use of force platform variables to quantify the effects of chiropractic manipulation on gait symmetry. J. Manip. Phsyiol. Ther. 1987, 10, 172–176. [Google Scholar]
- Herzog, W.; Nigg, B.M.; Read, L.J.; Olsson, E. Asymmetries in ground reaction force patterns in normal human gait. Med. Sci. Sports Exerc. 1989, 21, 110–114. [Google Scholar] [CrossRef]
- Tourny-Chollet, C.; Seifert, L.; Chollet, D. Effect of force symmetry on coordination in crawl. Int. J. Sports Med. 2009, 30, 182–187. [Google Scholar] [CrossRef]
- Shadrina, E.; Vol´pert, Y. Functional asymmetry and fingerprint features of left-handed and right-handed young yakuts (Mongoloid Race, North-Eastern Siberia). Symmetry 2018, 10, 728. [Google Scholar] [CrossRef]
- Castro-Piñero, J.; Ortega, F.B.; Artero, E.G.; Girela-Rejón, M.J.; Mora, J.; Sjöström, M.; Ruiz, J.R. Assessing muscular strength in youth: Usefulness of standing long jump as a general index of muscular fitness. J. Strength Cond. Res. 2010, 24, 1810–1817. [Google Scholar] [CrossRef] [PubMed]
- Castro-Piñero, J.; Girela-Rejón, M.J.; González-Montesinos, J.L.; Mora, J.; Conde-Caveda, J.; Sjöström, M.; Ruiz, J. Percentile values for flexibility test in youths aged 6 to 17 years: Influence of weight status. Eur. J. Sport Sci. 2011, 13, 139–148. [Google Scholar] [CrossRef]
- Callewaert, M.; Boone, J.; Celie, B.; De Clercq, D.; Bourgois, J.G. Indicators of sailing performance in youth dinghy sailing. Eur. J. Sport Sci. 2015, 15, 213–219. [Google Scholar] [CrossRef] [PubMed]
- Vila, H.; Fernández-Romero, J.J.; Rodríguez-Guisado, F.A. Physical fitenss evolution of infantile, cadet and junior female handball players. Apunts. Educ. Fís. Deportes 2007, 87, 99–106. [Google Scholar]
- Zverev, Y.; Kamadyaapa, D. Lateral asymmetry in grip strength: Utility of the ten per cent rule. East Afr. Med. J. 2001, 78, 611–615. [Google Scholar] [CrossRef]
- Akif, M.; Gursoy, R.; Dane, S.; Türkmen, M.; Çebi, M. Effects of handedness on the hand grip strength asymmetry in Turkish athletes. Compr. Psychol. 2015, 4, 1–7. [Google Scholar]
- Malina, R.M.; Buschang, P.H. Antrhopometric asymmetry in normal and mentally retarded males. Ann. Hum. Biol. 1984, 11, 515–531. [Google Scholar] [CrossRef]


| All (n = 33) | Girls (n = 10) | Boys (n = 23) | |
|---|---|---|---|
| Age (years) | 13.7 ± 1.3 (12–16) | 13.7 ± 1.4 (12–16) | 13.2 ± 1.2 (12–16) |
| Height (cm) | 160.3 ± 9.6 (146–197.5) | 154.4 ± 4.8 (151.5–165.5) | 161.3 ± 10.9 (146–179.5) |
| Weight (kg) | 51.7 ± 10.2 (35.5–72.2) | 51.7 ± 8.2 (35.5–64) | 51.7 ± 11.1 (36.5–72.2) |
| Right hand dynamometry (kg) | 28.2 ± 8 (18–51) | 24.8 ± 5.3 (18–35) | 29.8 ± 8.6 (19–51) |
| Left hand dynamometry (kg) | 27.1 ± 7.2 (15–45) | 24.4 ± 4.5 (18–30) | 28.6 ± 7.9 (15–45) |
| Dominant hand dynamometry (kg) | 29.1 ± 7.9 (18–51) | 26.1 ± 5.1 (18–35) | 30.4 ± 8.6 (19–51) |
| Non-dominant hand dynamometry (kg) | 26.3 ± 7.1 (15–45) | 23.1 ± 4.2 (18–30) | 27.1 ± 7.7 (15–45) |
| Hand dynamometry SI (%) | 4.2 ± 11.9 (−29.8–27) | 1.1 ± 15.6 (−29.8–15.4) | 5.6 ± 10 (−10.8–27) |
| Asymmetry coefficient (kg) | 0.02 ± 0.05 (−0.14–0.13) | 0.005 ± 0.07 (−0.14–0.07) | 0.02 ± 0.05 (−0.05–0.13) |
| Right SLL test (°) | 85.8 ± 8.9 (68–100) | 90.4 ± 7.4 (77–100) | 83.8 ± 9 (68–100) |
| Left SLL test (°) | 84.1 ± 8.3 (63–99) | 86.8 ± 7.7 (74−99) | 82.9 ± 8.4 (63–99) |
| Dominant SLL test (°) | 87.5 ± 8.1 (69–100) | 91.2 ± 7.3 (77–100) | 85.9 ± 8.1 (69–100) |
| Non-dominant SLL test (°) | 82.4 ± 8.4 (63–98) | 86 ± 7.2 (74–95) | 80.8 ± 8.5 (63–98) |
| SLL test SI (%) | 2.01 ± 8.1 (−20.4–21.3) | 4.11 ± 6.6 (−4.8–16.2) | 1.1 ± 8.6 (−20.4–21.3) |
| Windsurfing (n = 10) | Optimist (n = 16) | Laser (n = 7) | |
|---|---|---|---|
| Age (years) | 13.7 ± 1.1 (12–15) | 13 ± 0.6 (12–14) | 15.7 ± 0.4 ** (15–16) |
| Height (cm) | 163.6 ± 8.2 * (151.5–179.5) | 153.7 ± 6.2 (146–166) | 170.5 ± 6 ** (162–178) |
| Weight (kg) | 55.4 ± 6.1 ** (47.7–65) | 43.5 ± 5.2 (35.5–52.1) | 65.2 ± 4.3 ** (60.6–72.2) |
| Right hand dynamometry (kg) | 28.9 ± 8.8 (20–44) | 24.3 ± 4.7 (18–34) | 36.6 ± 6.9 ** (29.5–51) |
| Left hand dynamometry (kg) | 28.2 ± 6.6 (19–40) | 22.8 ± 4.4 (15–32) | 35.2 ± 6.2 ** (30–45) |
| Dominant hand dynamometry (kg) | 30.4 ± 8 (21–44) | 24.6 ± 4.5 (18–34) | 37.5 ± 7 ** (30–51) |
| Non-dominant hand dynamometry (kg) | 26.7 ± 7.1 (19–40) | 22.5 ± 4.4 (15–32) | 34.3 ± 5.8 ** (29.5–45) |
| Hand dynamometry SI (%) | 1 ± 16.9 (−29.8–27) | 6.5 ± 9 (−9.5–23.5) | 3.7 ± 9.7 (−10.8–15.4) |
| Asymmetry coefficient (kg) | 0.00 ± 0.08 (−0.14–0.13) | 0.03 ± 0.04 (−0.04–0.11) | 0.01 ± 0.04 (−0.05–0.07) |
| Right SLL test (°) | 91.2 ± 8.1* (80–100) | 85.1 8 ± 8.8 (68–95) | 79.7 ± 6.4 (73–89) |
| Left SLL test (°) | 89.1 ± 6.4* (80–99) | 83.2 ± 9 (63–99) | 78.8 ± 5.1 (72–85) |
| Dominant SLL test (°) | 92.6 ± 7 ** (80–100) | 87.1 ± 7.9 (69–99) | 81 ± 5.8 (75–89) |
| Non-dominant SLL test (°) | 87.7 ± 6.9 (80–98) | 81.2 ± 8.9 (63–95) | 77.5 ± 5.2 (72–85) |
| SLL test SI (%) | 2.2 ± 7.5 (–9.3–16.2) | 2.3 ± 9.6 (–20.4–21.3) | 0.9 ± 5.2 (–8.9–5.8) |
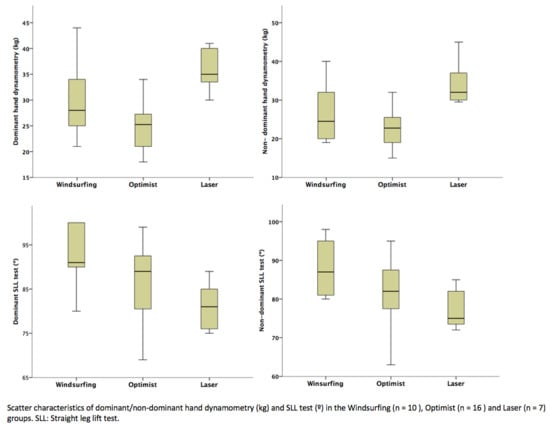
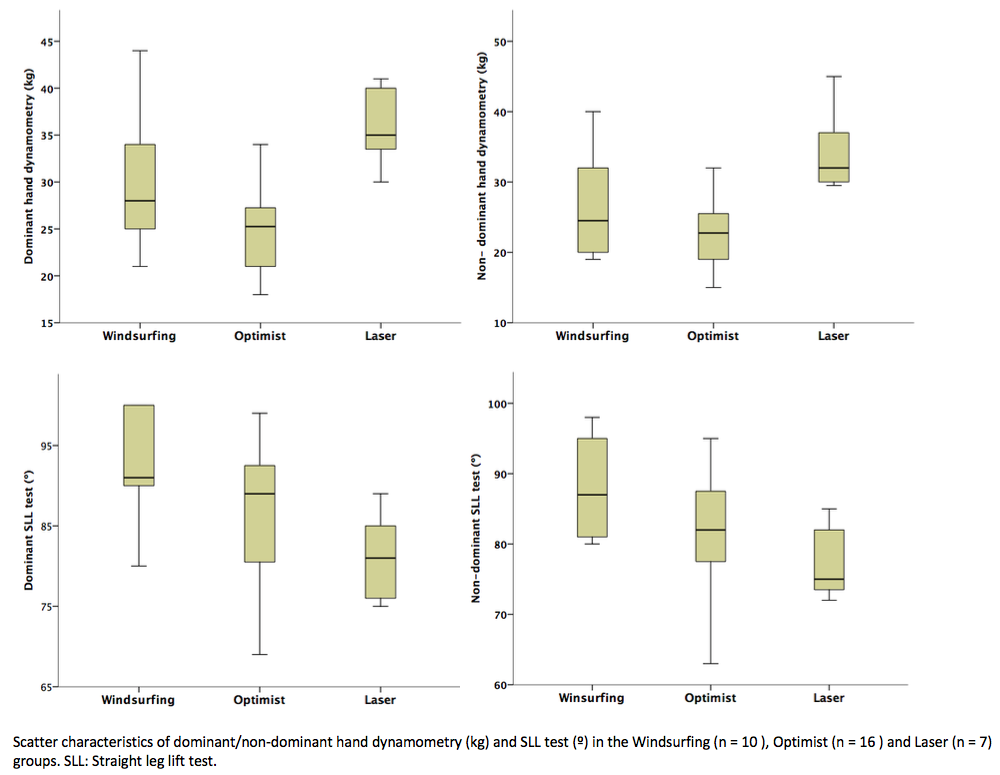
| Dominant Hand Dynamometry (kg) | Non-Dominant Hand Dynamometry (kg) | Dominant SLL Test (°) | Non-Dominant SLL Test (°) | |
|---|---|---|---|---|
| All (n= 33) | 29.1 ± 7.9 (18–51) | 26.3 ± 7.1 (15–45) | 87.5 ± 8.1 (69–100) | 82.4 ± 8.4 (63–98) |
| Girls (n= 10) | 26.1 ± 5.1 (18–35) | 23.1 ± 4.2 (18–30) | 91.2 ± 7.3 (77–100) | 86 ± 7.2 (74–95) |
| Boys (n= 23) | 30.4 ± 8.6 (19–51) | 27.1 ± 7.7 (15–45) | 85.9 ± 8.1 (69–100) | 80.8 ± 8.5 (63–98) |
| Windsurfing (n= 10) | 30.4 ± 8 (21–44) | 26.7 ± 7.1 (19–40) | 92.6 ± 7 (80–100) | 87.7 ± 6.9 (80–98) |
| Optimist (n= 16) | 24.6 ± 4.5 (18–34) | 22.5 ± 4.4 (15–32) | 87.1 ± 7.9 (69–99) | 81.2 ± 8.9 (63–95) |
| Laser (n= 7) | 37.5 ± 7 (30–51) | 34.3 ± 5.8 (29.5–45) | 81 ± 5.8 (75–89) | 77.5 ± 5.2 (72–85) |
| All | Girls | Boys | Windsurf | Optimist | Laser | |
|---|---|---|---|---|---|---|
| Positive hand dynamometry SI | 33% | 40% | 34.4% | 30% | 37.8% | 28.6% |
| Negative hand dynamometry SI | 12% | 20% | 8.6% | 20% | 0% | 14.3% |
| Total hand dynamometry SI | 45% | 60% | 43% | 50% | 37.8% | 42.9% |
| Positive Kas | 63.9% | 70% | 69.9% | 60% | 81.8% | 57.2% |
| Negative Kas | 36.1% | 30% | 30.1% | 40% | 18.2% | 42.8% |
| Positive SLL SI | 15% | 20% | 12.9% | 20% | 20% | 0% |
| Negative SLL SI | 6% | 0% | 8.6% | 0% | 12.6% | 0% |
| Total SLL SI | 21% | 20% | 21.5% | 20% | 32.6% | 0% |
© 2020 by the authors. Licensee MDPI, Basel, Switzerland. This article is an open access article distributed under the terms and conditions of the Creative Commons Attribution (CC BY) license (http://creativecommons.org/licenses/by/4.0/).
Share and Cite
Caraballo, I.; González-Montesinos, J.L.; Alías, A. Bilateral and Unilateral Asymmetries of Strength and Flexibility in Young Elite Sailors: Windsurfing, Optimist and Laser Classes. Symmetry 2020, 12, 184. https://doi.org/10.3390/sym12010184
Caraballo I, González-Montesinos JL, Alías A. Bilateral and Unilateral Asymmetries of Strength and Flexibility in Young Elite Sailors: Windsurfing, Optimist and Laser Classes. Symmetry. 2020; 12(1):184. https://doi.org/10.3390/sym12010184
Chicago/Turabian StyleCaraballo, Israel, José Luis González-Montesinos, and Antonio Alías. 2020. "Bilateral and Unilateral Asymmetries of Strength and Flexibility in Young Elite Sailors: Windsurfing, Optimist and Laser Classes" Symmetry 12, no. 1: 184. https://doi.org/10.3390/sym12010184
APA StyleCaraballo, I., González-Montesinos, J. L., & Alías, A. (2020). Bilateral and Unilateral Asymmetries of Strength and Flexibility in Young Elite Sailors: Windsurfing, Optimist and Laser Classes. Symmetry, 12(1), 184. https://doi.org/10.3390/sym12010184