Article

Weakly Supervised and Semi-Supervised Semantic Segmentation for Optic Disc of Fundus Image

College of Information Science and Engineering, Heping District, Northeastern University, Shenyang 110819, China
*
Author to whom correspondence should be addressed.
Symmetry 2020, 12(1), 145; https://doi.org/10.3390/sym12010145
Submission received: 16 December 2019 / Revised: 3 January 2020 / Accepted: 8 January 2020 / Published: 10 January 2020

Abstract

:
Weakly supervised and semi-supervised semantic segmentation has been widely used in the field of computer vision. Since it does not require groundtruth or it only needs a small number of groundtruths for training. Recently, some works use pseudo groundtruths which are generated by a classified network to train the model, however, this method is not suitable for medical image segmentation. To tackle this challenging problem, we use the GrabCut method to generate the pseudo groundtruths in this paper, and then we train the network based on a modified U-net model with the generated pseudo groundtruths, finally we utilize a small amount of groundtruths to fine tune the model. Extensive experiments on the challenging RIM-ONE and DRISHTI-GS benchmarks strongly demonstrate the effectiveness of our algorithm. We obtain state-of-art results on RIM-ONE and DRISHTI-GS databases.

1. Introduction

Fundus retinal examination has been widely used in the prevention, diagnosis, and treatment of diabetic retinopathy, glaucoma, senile maculopathy, and other ophthalmic disease. The fundus image includes the main structures such as optic disc, macula, and vessels. The characteristic analysis of these structures is to judge foundation of fundus diseases. As one of the important structures of fundus image, the size and shape of the optic disc is the main auxiliary parameter to judge various ophthalmic diseases, which is often used as an index to judge retinopathy. The optic disc is also a key part of detecting other retinal structures. The distance between the optic disc and the macular area is generally fixed, so the information of the central position of the optic disc can be used as a prior knowledge to assist the selection of the macular area; the optic disc is the starting point of the fundus blood vessels, in which the blood vessels can be used as the starting seed point of the blood vessel tracking algorithm; the optic disc can also assist the establishment of the fundus image coordinate system to determine the location of other retinal abnormalities, such as microaneurysms and bleeding points hard exudation and hyaline verruca, etc. Therefore, retinal optic disc analysis in fundus images is a very important research issue [1,2,3,4,5,6,7,8].
Traditional optic disc segmentation can be divided into three categories: (1) A method based on morphology, contour lines can be found. The typical method is a watershed algorithm. The process of watershed calculation is an iterative labeling process, which has a good response to the weak edge. However, the noise in the image and the subtle gray changes of the object surface will produce the phenomenon of over-segmentation. Walter et al. [9] is the representative of this algorithm, the edge of the optic disc is not smooth and the accuracy is not very high. (2) A method based on the Hough transform, it mainly aims at the optic disc outline. The transformation of ellipse is to project two-dimensional points to five-dimensional parameters space, and circle is a special form of ellipse, only two-dimensional point projection is needed to the parameter space of 3D. Because the disc is not a standard circle, the split result is not as high as that of the ellipse, but because of the complexity of calculation, the circle increases exponentially, so the Hough circle changes becomes the key method of optic disc segmentation in algorithm [10,11]. The results of the algorithm can be straight used to segment the optic disc, but the accuracy is not high. The common method is to take the circle as the initial outline of the optic disc to assist other methods (such as activity Model method) to further improve the accuracy of segmentation. (3) A method based on the active contour model, the method of optic disc segmentation is to make the contour approach the edge automatically. In this algorithm, the curve on the image domain approaches to the edge of the object under the combined action of the internal force related to the curve itself and the external force defined by the image data. The main classifications are parametric active contour model and geometric active contour model. The former is an active contour model based on the variational method, which directly expresses the evolution of the curve in the parametric form. It constructs a specific energy function for a given model, and then uses the variational method to minimize the energy function, and obtains the partial differential equation of model evolution, which makes the contour automatically stop when it reaches the target boundary because the energy function reaches the minimum value. The latter is driven by the geometric characteristics of the contour to move towards the edge of the target, but has nothing to do with the parametric characteristics of the contour, which avoids the problem that the parametric active contour must repeat the parametric curve. The algorithm proposed by osareh et al. [12] is the representative of the former. It automatically initializes the contour by matching the template, transforms the color optic disc into LAB space, and removes the blood vessels, so as to obtain a higher segmentation effect. The algorithm proposed by Kande et al. [13] is the representative of the latter, which also needs to remove blood vessels in LAB space. The feature of this algorithm is to find the edge position of energy balance iteratively, so the calculation complexity is relatively high, and the average processing time of each image is more than ten seconds or even several minutes.
In recent years, deep learning has been widely used in the field of computer vision, which benefits from the rapid development of convolutional neural network. The method based on deep learning has been successfully applied in some medical image processing. Sevastopolsky [14] proposed an optic disc segmentation algorithm based on U-net. Tan et al. [15] developed a convolutional neural network to automatically and simultaneously segment optic disc. All these methods have achieved good results, the key to their successes is the strong learning ability of fully supervised deep convolutional neural networks (DCNN) models and the availability of large scale labeled databases. However, the labeling process is time-consuming and expensive, especially for medical data, which requires at least two medical experts to label. To tackle this issue, some weakly supervised learning methods and semi-supervised learning methods have been proposed one after another. Weakly supervised learning methods only use image-level labels or bounding-box to train models without using groundtruth to train, the semi-supervised learning methods only need a small amount of groundtruths to segment image, both of which can greatly save the human and material resources consumption caused by making labels (In order to better understand the differences between these labels, we compare them in Figure 1). Kolesnikov et al. [16] designed a loss function in their weakly supervised semantic segmentation algorithm, and the whole network only used image-level labels to train. Alexander et al. [17] proposed a maximum expected agreement model selection principle to perform a segmentation task based on image-level labels. All of these methods have achieved good results, this is the reason why weakly and semi-supervised learning are becoming more and more popular.
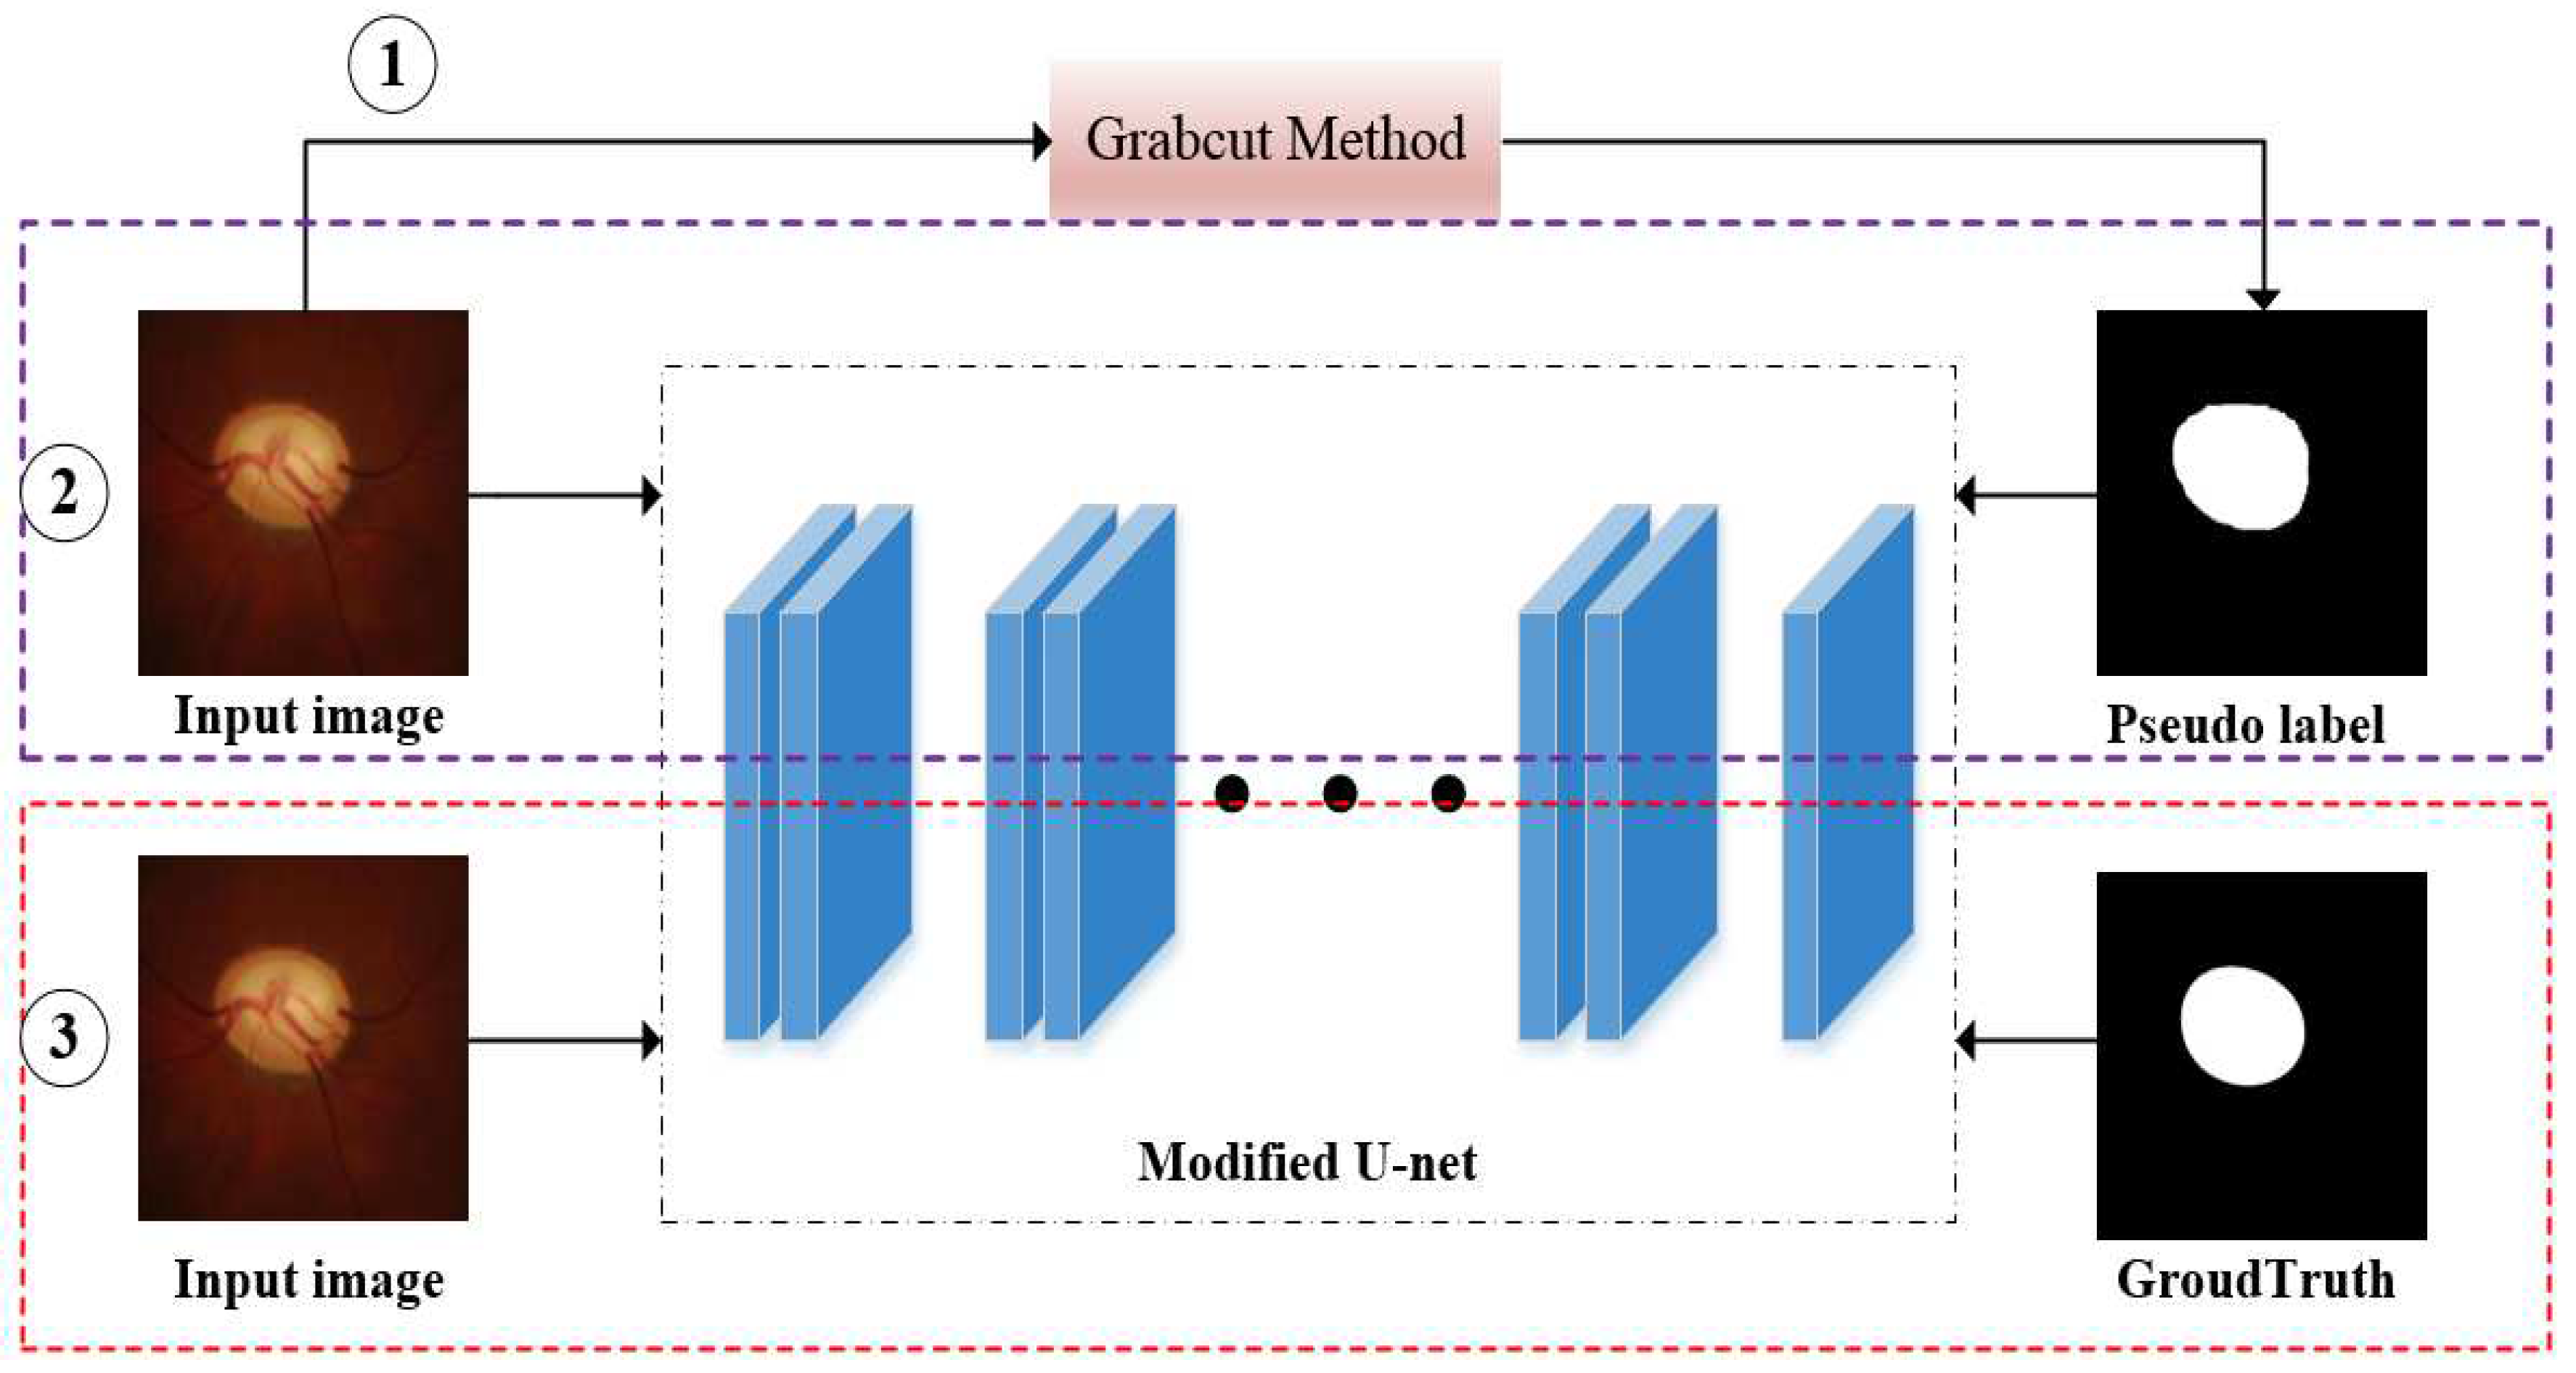
However, most of the current weakly supervised segmentation algorithms and semi-supervised segmentation methods are about the traditional image, and there are few methods about the medical image, especially the optic disc. Therefore, in this paper, we propose a weakly supervised and semi-supervised semantic segmentation algorithm for retinal optic disc images. First, we use the grabcut method as a baseline method to generate pseudo groundtruths, which only use bounding-box level labels as input. Then, we utilize the pseudo groundtruths as groundtruths to train the new model based on a modified U-net. Finally, a little groundtruths are used to fine-tune the model that has been trained in previous step. The experimental results on RIM-ONE and DRISHTI-GS databases prove the effectiveness and superiority of our algorithm. The overview of the proposed general framework has been shown in Figure 2.
To sum up, the main contributions of this paper are:
  • In this paper, we propose a new method of optic disc segmentation based on weakly supervised learning and semi-supervised learning. The whole method only utilizes the bounding-box level labels and a few groundtruths to train the model. However, it takes a lot of manpower to annotate groundtruth in fully supervised semantic segmentation, and our final experimental results are close to the fully supervised method. This is the main contribution of this paper. We summarize the comparison between our method and the existing methods in Table 1.
  • We crop the original image into dozens of patches to train the network, which increases the amount of data so that the network can learn the features of the optic disc more accurately. We improve the U-net model, by reducing the original U-shape structure, and add a convolutional layer with dimension 2 at the end of the convolutional layer, so that we can reduce the amount of calculation and make full use of the low-level features in training and get better segmentation results.

2. Method

2.1. The Grabcut Baseline

Grabcut [18] is the established technique to estimate an object segment from its bounding box. Users only need to select the target in the box, and then all the pixels outside the box are taken as the background. At this time, a Gaussian mixture model (GMM) can be modeled and well-segmented. The segmentation process of the algorithm is divided into the following steps:
Initialization
  • The user only provides T B to initialize trimap T . The foreground and background are set to T F = ; T U = T ¯ B respectively. The trimap is specified by the user, T = { T B , T U , T F } , where T B are the marked background regions, T F are the marked foreground regions, T U are the remaining regions.
  • Initialize a n = 1 when n T U , initialize a n = 0 when n T B . Each pixel in the image is segmented and represented by ‘opacity’ values a = ( a 1 , , a n , , a N ) . Where N is the number of pixels in the image, n is index which represents a specified pixel and a n is the corresponding ‘opacity’ value.
  • Initialize foreground GMMs and background GMMs with sets a n = 0 and a n = 1 respectively.
Iterative minimization
  • (1) For every n in T U , pixels are assigned by GMM components:
    k n : = arg min k n D n ( a n , k n , θ , z n ) .
    The vector k = { k 1 , , k n , , k N } is a component of the GMM model, in order to process GMM in a traceable way. The parameters θ describe image foreground and background grey-level distributions, and the image is an array z = ( z 1 , , z n , , z N ) of grey values, indexed by the index n. Function D n is one of the components of Gibbs function E.
  • (2) Using data z to learn GMM parameters:
    θ ¯ : = arg min θ ¯ U ( a , k , θ ¯ , z ) ,
    where θ ¯ are the parameters of the GMM model, function U is the data term, and it is one of the components of Gibbs energy function E, the meaning of other variables has been described above.
  • (3) Use the min cut to solve the following expression: min a n : n T U min k E ( a , k , θ ¯ , z ) .
  • (4) Repeat steps 1 to 3 until the above expression convergence.
  • (5) Apply border matting.
User editing
  • Edit: fix some pixels either to a n = 0 or a n = 1 ; update T at the same time. Execute step 3 above one time in the end.
  • Execute the entire iterative minimisation algorithm to refine, and this operation is optional.
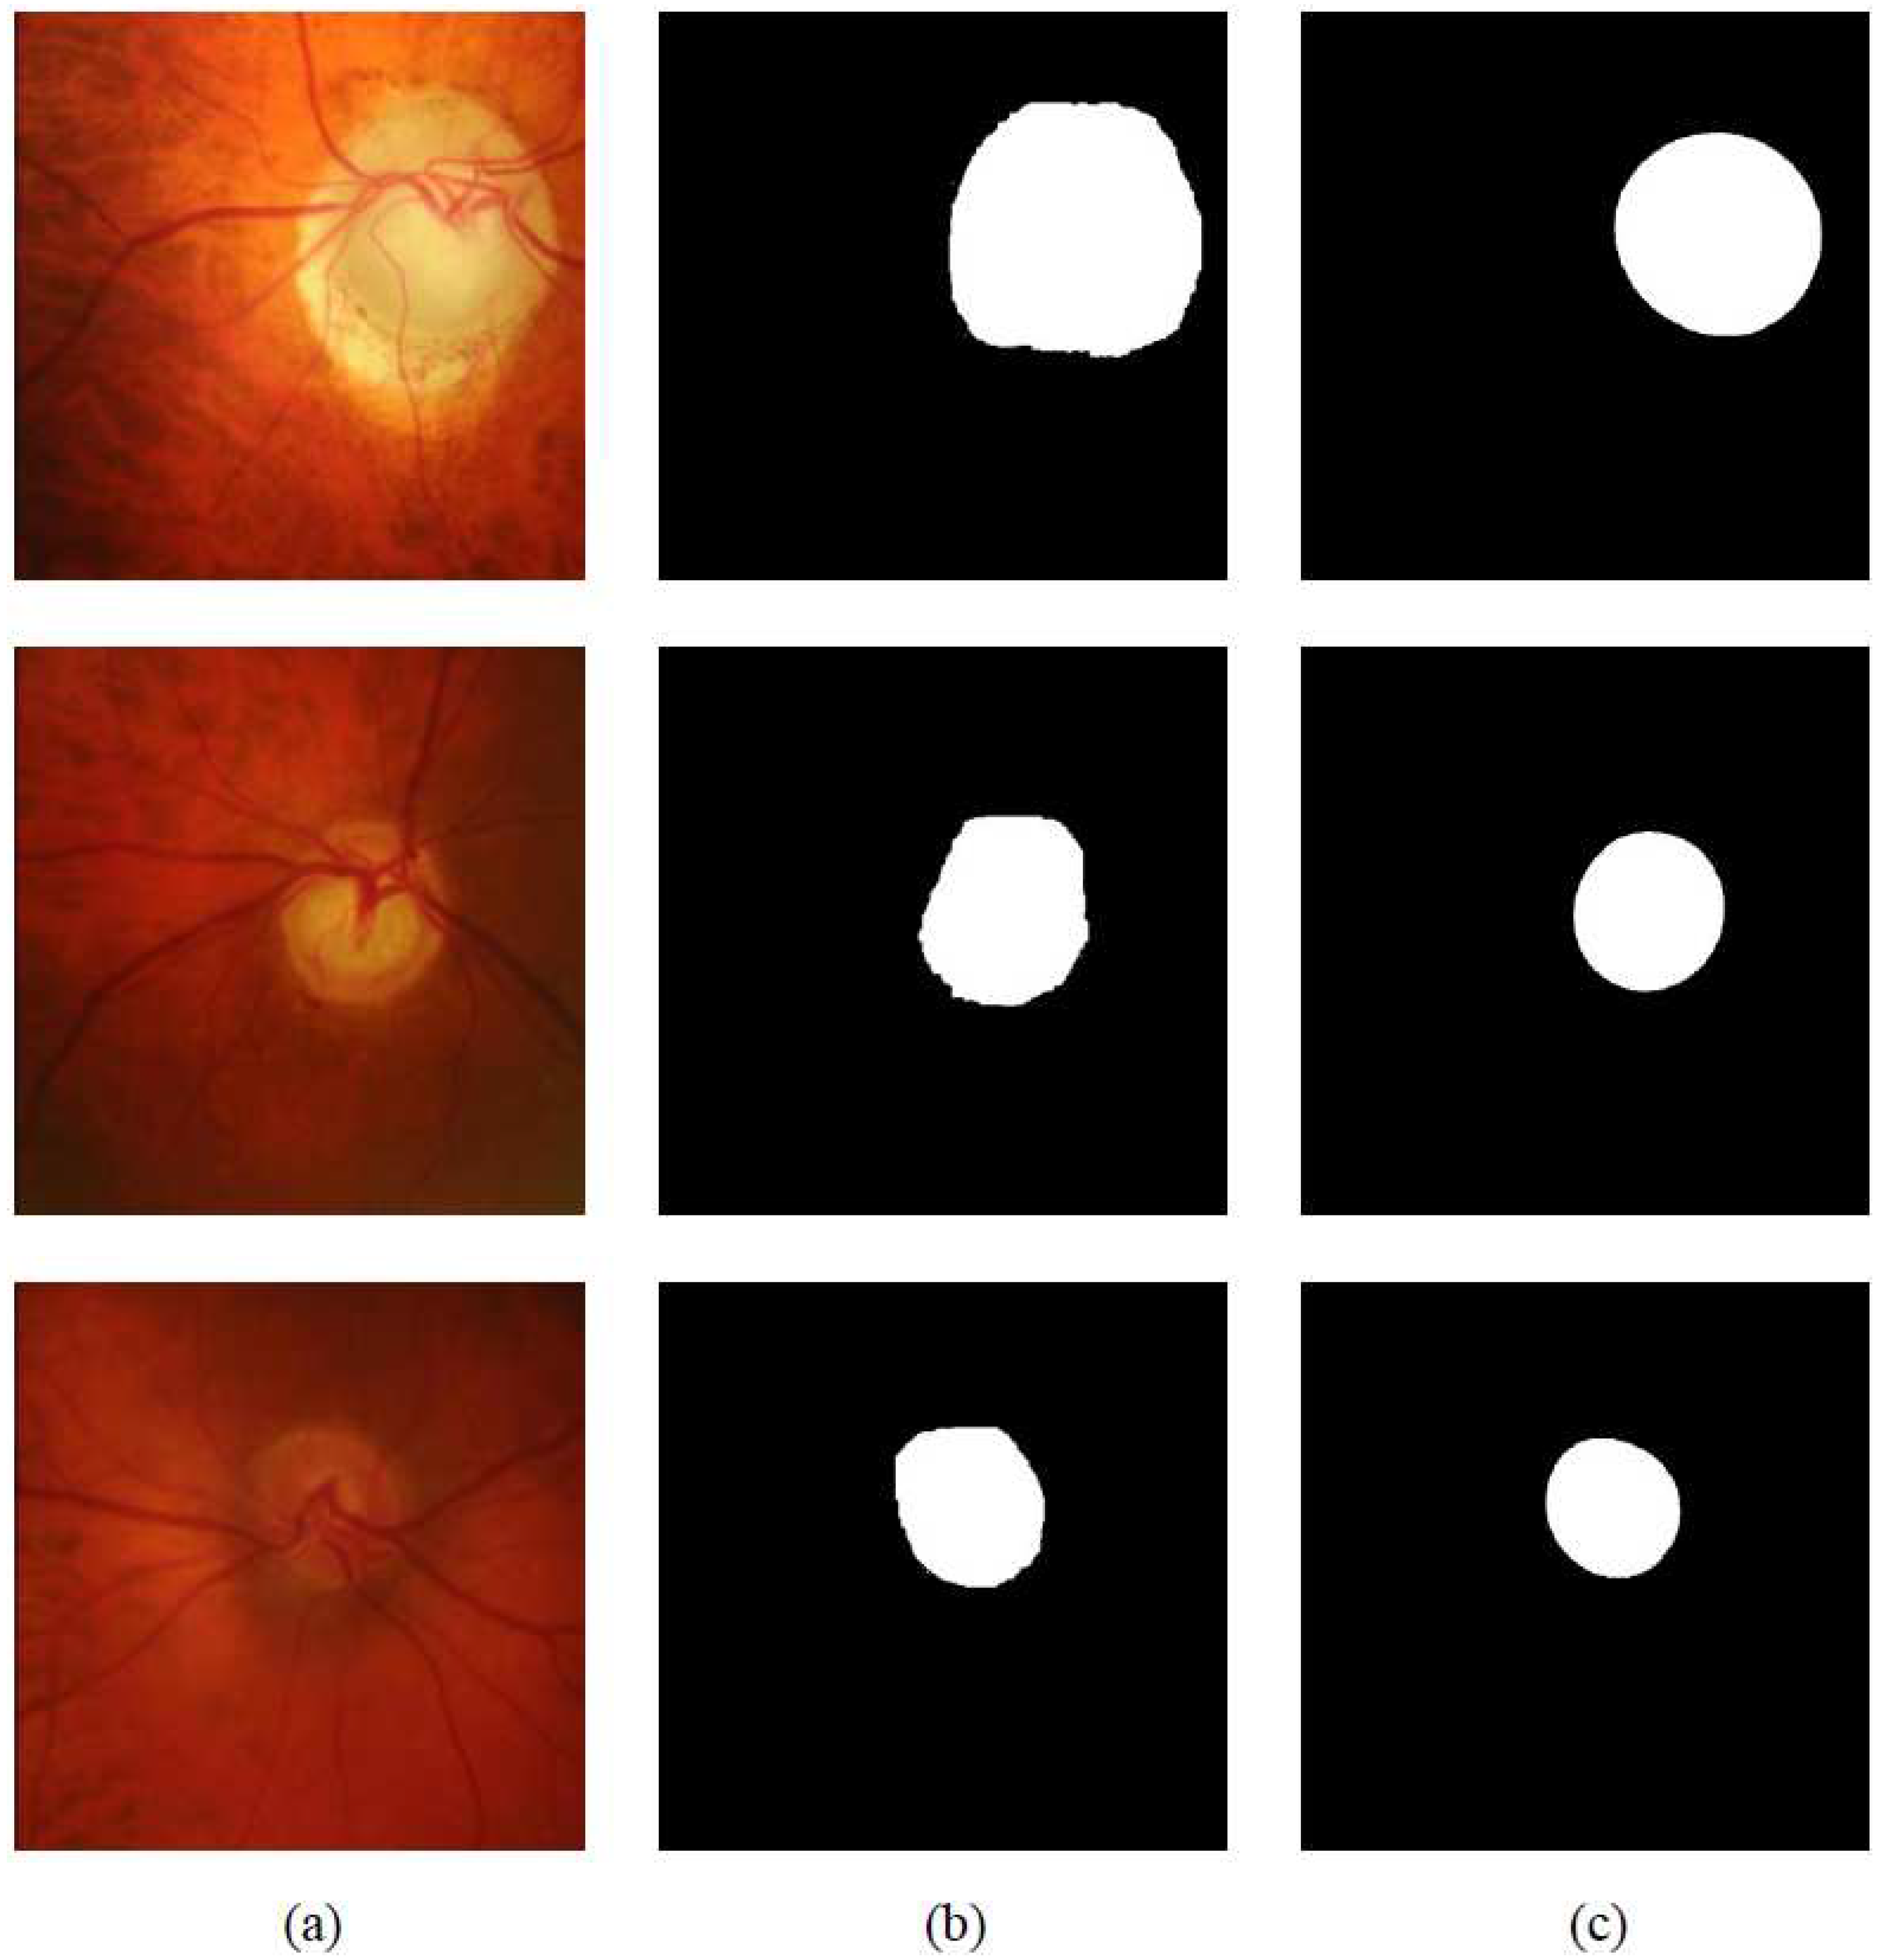
The grabcut algorithm’s overall thinking is as above. For more details, readers can refer to the original text [18]. Then we utilize this algorithm to generate pseudo groundtruths. Figure 3 shows some segmentation results based on RIM-ONE database.
From Figure 3, we can see that the grabcut method has been able to segment the approximate contour of the optic disc, but it is not good at the details of the edge of the optic disc, because of the pixels near the contour of the optic disc are very close. Therefore, there is still a lot of room for improvement. In the next section, we will train the model by using the pseudo groundtruths as groundtruth based on the improved U-net model to get better segmentation results.

2.2. Weakly Supervised and Semi-Supervised Optic Disc Segmentation

After we get the pseudo groundtruths, we do the following steps to realize our weakly supervised and semi-supervised optic disc segmentation:
Preprocessing
Deep learning architecture can learn features from raw data effectively. Usually, proper preprocessing can facilitate segmentation. This paper studies retinal image based on the green channel, this is because the green channel of RGB optic disc image shows higher contrast between the optic disc and the background. Besides, when we train neural networks, one of the most popular and effective ways to accelerate training is to normalize the input. We use the following formula to normalize the green channels of images:
I P G = I G u σ ,
where I G is the original green channel input, σ and μ represent standard deviation and the mean of the image data respectively.
In general, contrast enhancement can be achieved by stretching the gray value of low-contrast images. We use CLAHE operator [19] to get a local contrast enhanced optic disc image. After adaptive histogram equalization with limited contrast, gamma adjustment [20] is used for further image processing. Gamma adjustment is a method to correct the image and improve the contrast.
Frame structure
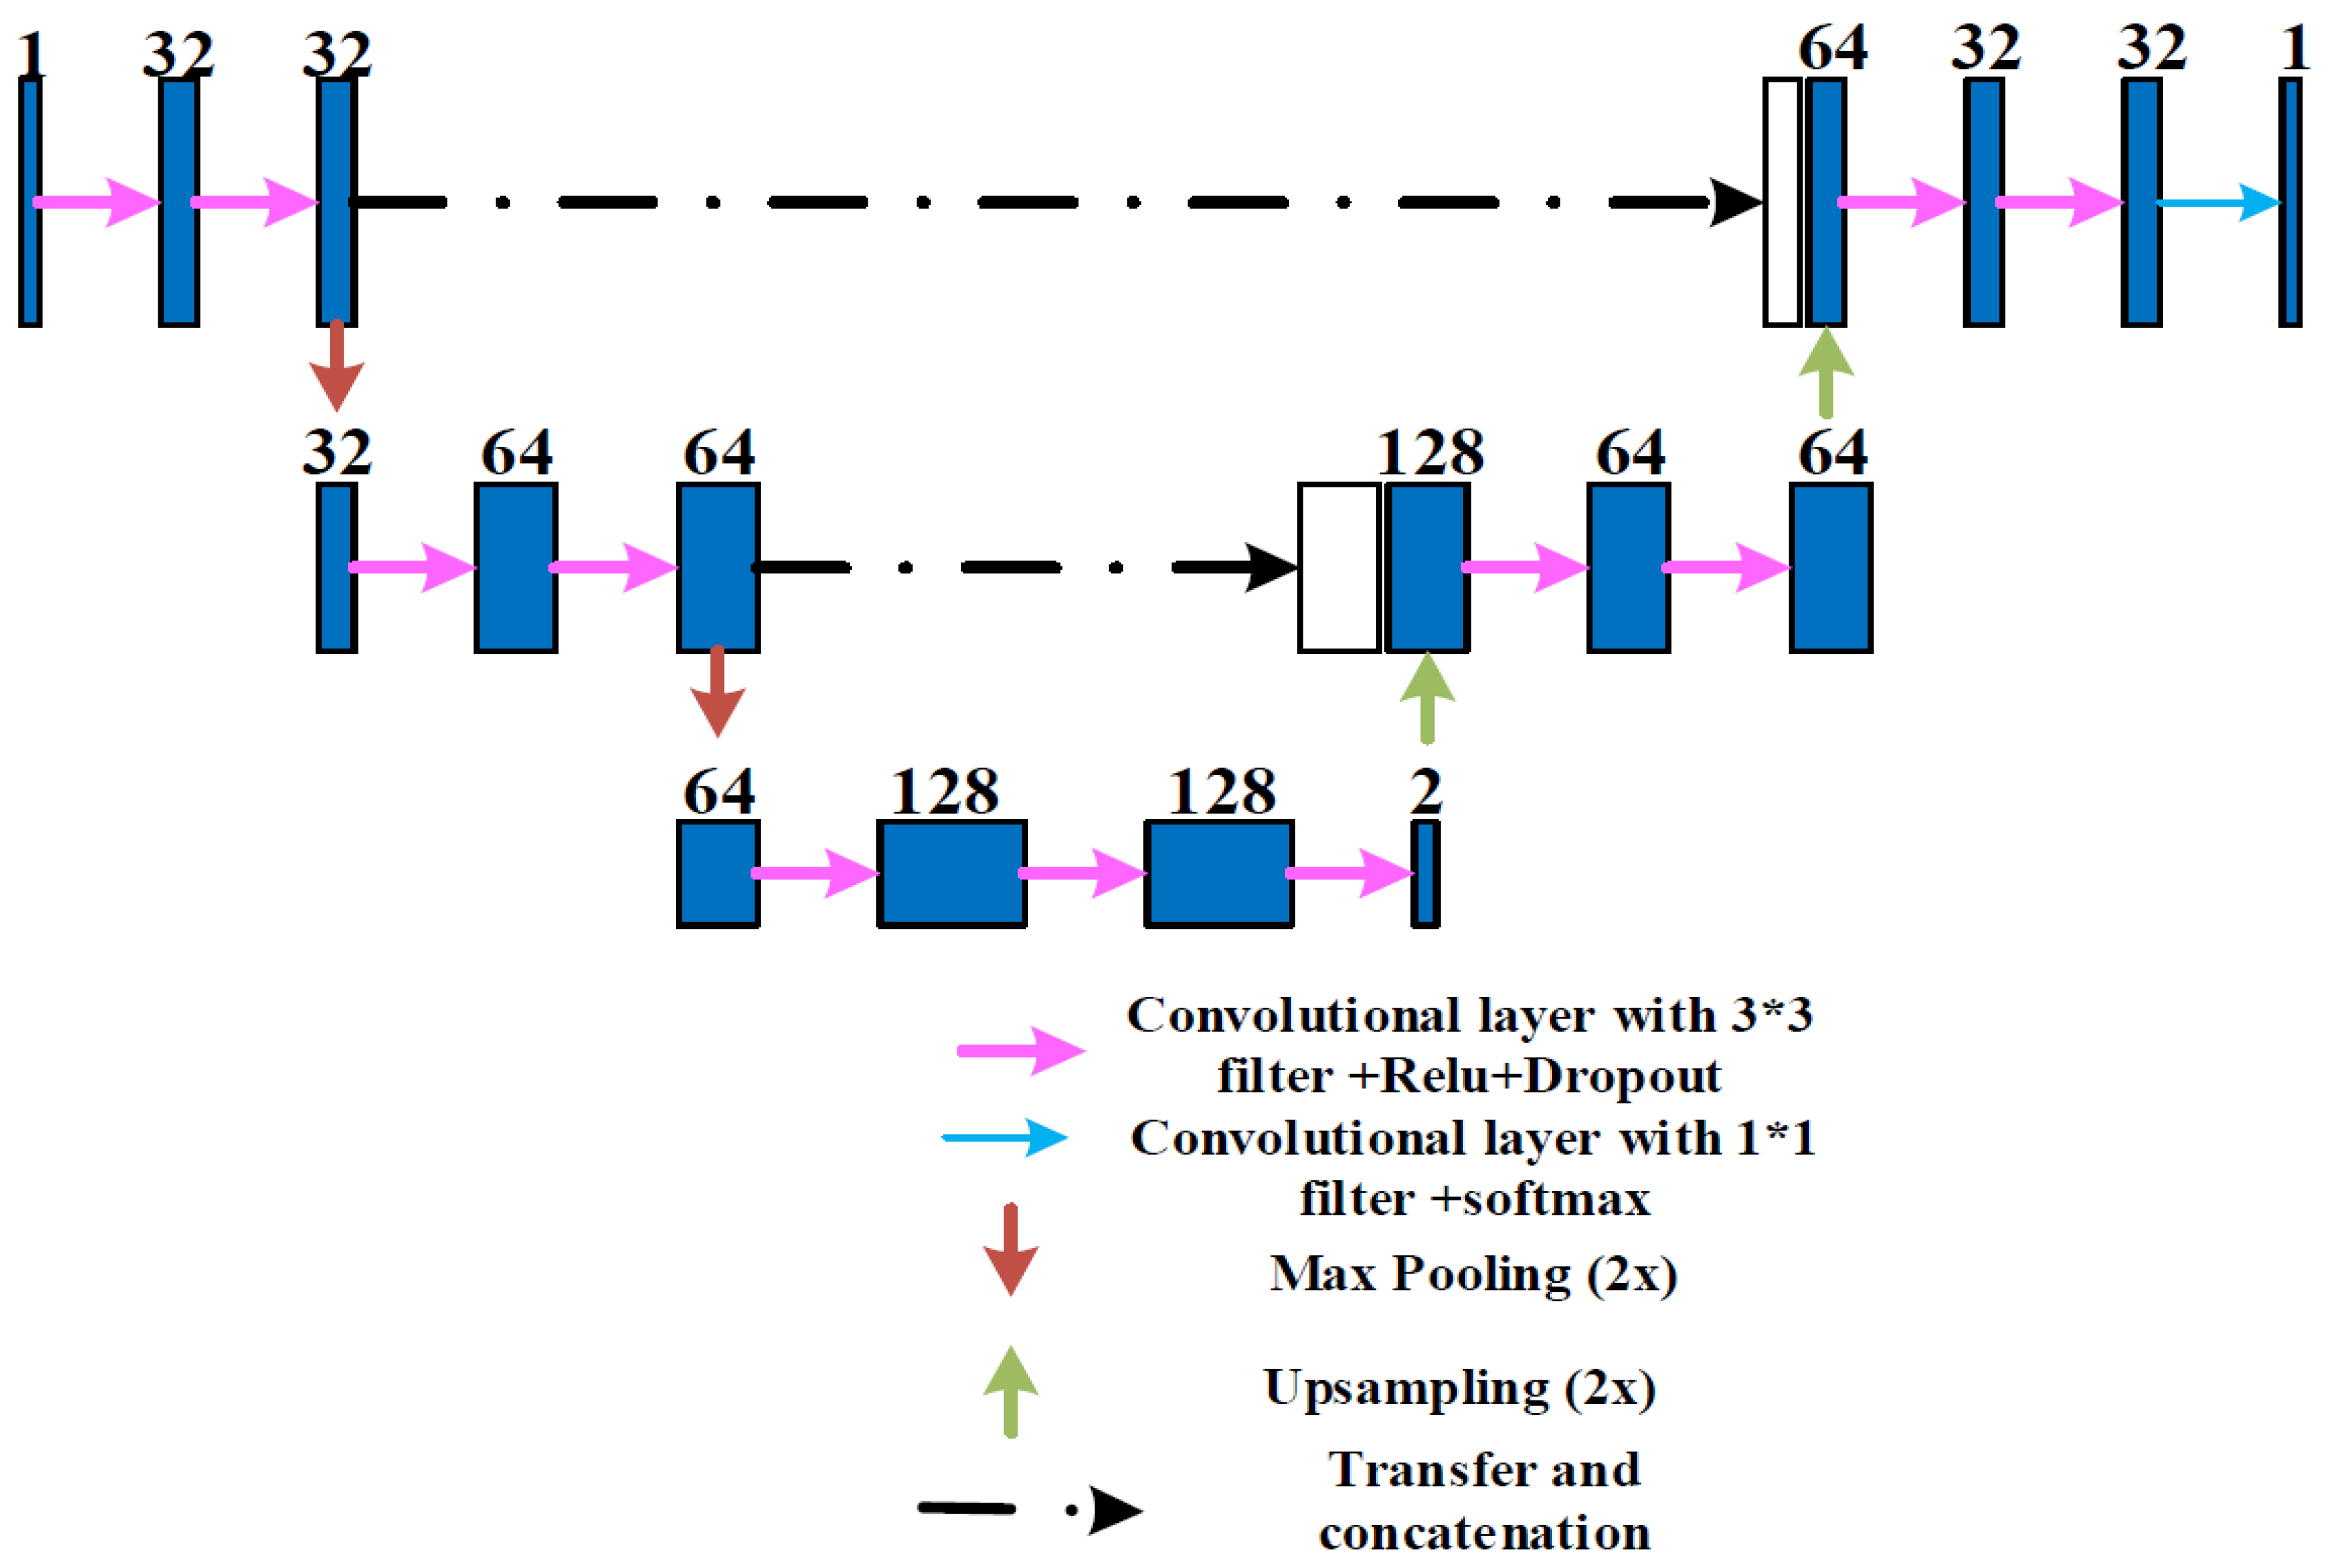
The framework uses cropped input which effectively expands the amount of data and makes the model learn the low-level features of the optic disc more accurately. Figure 4 shows the improved U-net structure used in this paper.
The training of the model is performed on patches of the preprocessed full images. The dimension of each patch is 300 × 300, which is obtained by randomly selecting its central position in the whole image. The first 90% of the dataset is used for training and the last 10% for validation.
In the test stage of the experiment, in order to get a complete result map, we must sew the predicted patches into a complete image. For each pixel, the optic disc probability is obtained by averaging the probability of all prediction patches covering the pixel. This strategy uses context information to help eliminate unexpected errors caused by a few patches.
The proposed neural network model is derived from U-net architecture, but we have improved its model structure. We simplify the U-net by reducing layers, because the optic disc features are relatively less diversified when compared with other databases. Similar to the middle layer of fully convolutional neural network (FCN), we choose to decrease the last dimension from 32 to 1, which is the number of classes of optic disc segmentation-optic disc. During the training stage, the loss function can be formulated as following:
L ( y i , y i , θ ) = β i Y + log y i ( 1 β ) i Y log ( 1 y i ) ,
where y i { 0 , 1 } is the pseudo groundtruths generated in Section 2.1, y i is the predicted results. θ is the network parameter. The coefficient β is used to balance background pixels and foreground pixels. In this article, we set β to 0.9. Y + and Y represent the foreground and background sets.
The overview of the proposed method has been shown in Figure 2, and we have described the pseudo code in Algorithm 1.
Algorithm 1 Weakly- and semi-supervised segmentation for optic disc of fundus image
Input: 
Datasets D = X 1 , X 2 , X n , X i = x 1 , x 2 , x m , where m represents the total number of pixels of image X i , and the modified U-net parameters θ , a small number of groundtruths are used for the final semi-supervised learning, y = { y 1 , , y k } , where k is the number of groundtruths, in this paper we set k to k = 0.1 × n . The modified U-net model y = f ( X , θ ) . Grabcut baseline model y g = f g ( X , θ ¯ ) , where θ ¯ is the parameter of the model in grabcut method.
1:
Step1:
2:
for i = 1 , 2 , , n do
3:
y g ( i ) = f g ( X i , θ ¯ )
4:
end for
5:
return y g = { y g ( 1 ) , y g ( 2 ) , , y g ( n ) }
6:
Step2:
7:
Random initialize θ
8:
L ( y g , y i , θ ) = β i Y + log y i ( 1 β ) i Y log ( 1 y i )
9:
θ w = arg min θ L ( θ )
10:
return θ w
11:
Step3:
12:
Initialize θ = θ w
13:
L ( y , y i , θ w ) = β i Y + log y i ( 1 β ) i Y log ( 1 y i )
14:
θ s = arg min θ w L ( θ w )
Output: 
θ s

3. Experiments

We experimented with the proposed algorithm and compared it with the current state-of-the-art algorithm. The experimental results show that our algorithm is effective.

3.1. Datasets

In the experiment of this paper, we use the public dataset RIM-ONE [21] and DRISHTI-GS [22] to evaluate the feasibility and effectiveness of the proposed algorithm. RIM-ONE is an open retinal image database for optic nerve evaluation, as it contains 159 images of the optic nerve head. Each image corresponds to the results of manual segmentation by more than two medical experts. DRISHIT-GS database contains 50 full fundus images. Each fundus image has an optic disc segmentation map and optic cup segmentation map.

3.2. Implementation Details

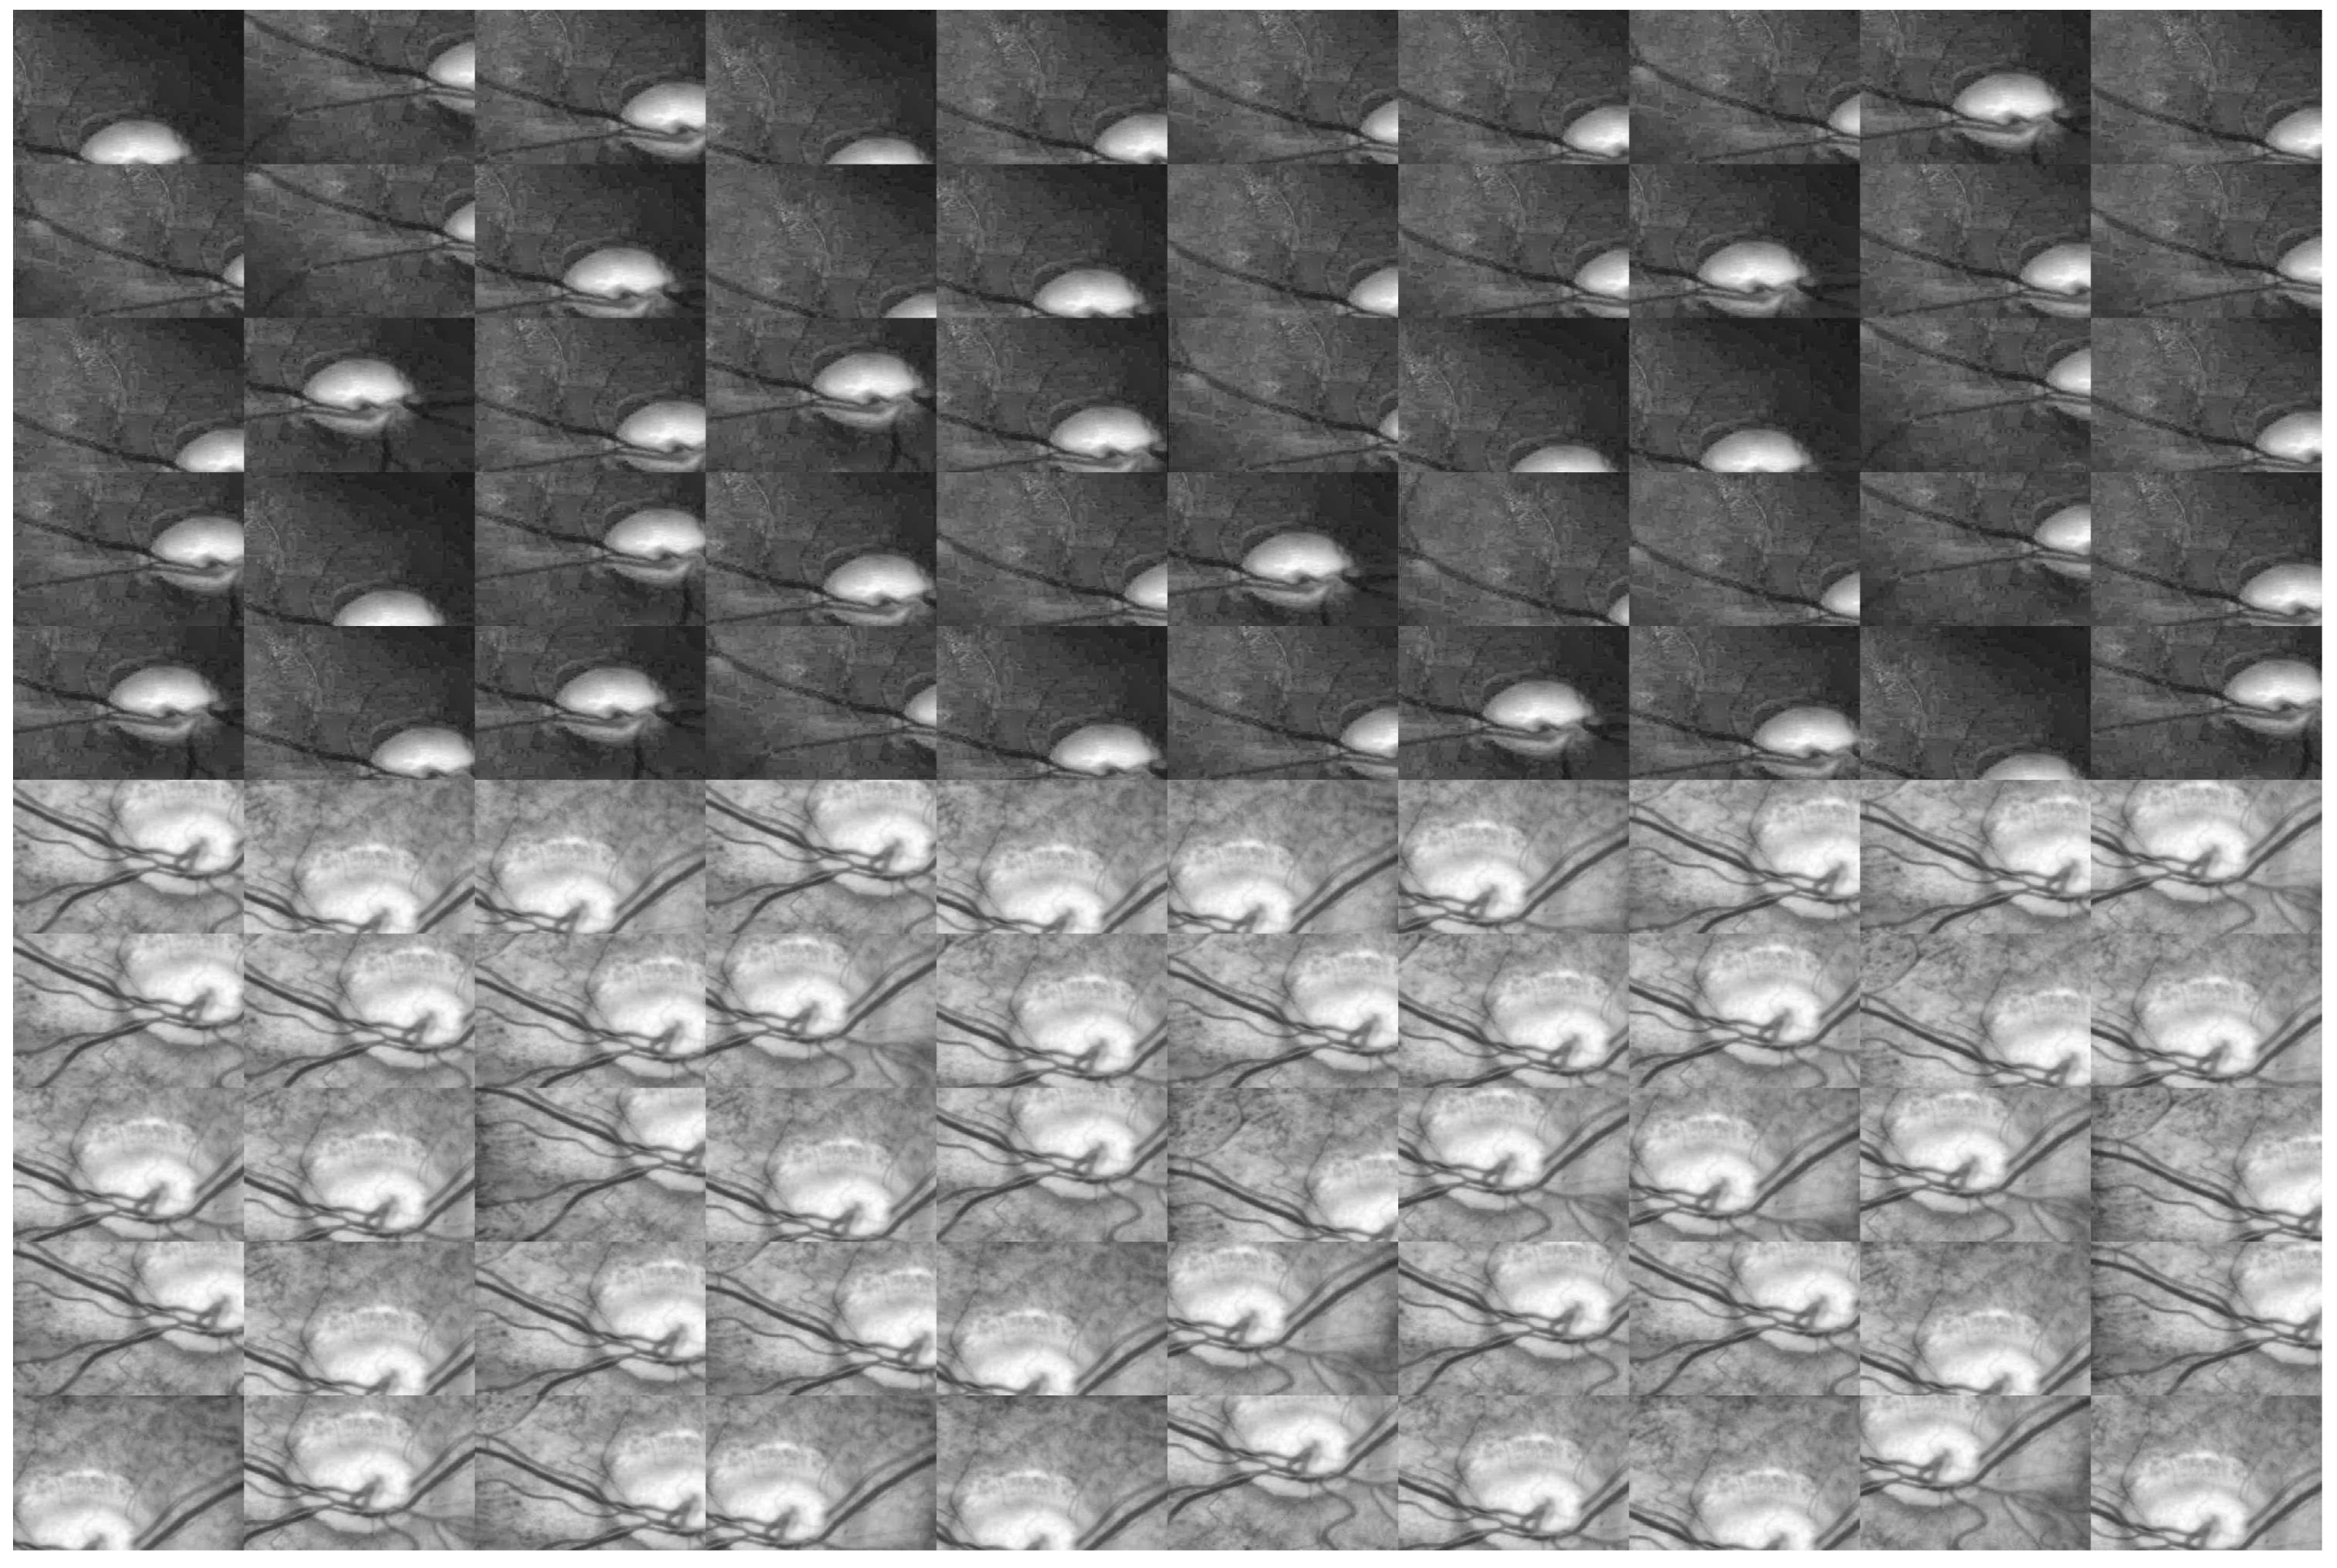
Our framework is based on the convolutional neural network architecture U-net. We first simplified it by reducing the layers. The modified architectures is shown in Figure 4. Every input image was cropped into 50 300 × 300 patches, we have shown some examples based on RIM-ONE dataset in Figure 5. The weights were initialized according X Glorot’s method [23]. Then, we used Adam optimization to train the network, the learning rate and the batch size were set to 0.001 and 32, respectively. The total number of iterations was 30 epochs, the RIM-ONE and DRISHTI-GS datasets were split randomly into 80% training, 20% testing sets. At inference stage, a fully connected condition random field model [24] was applied to optimize the result. The implementation of the proposed paper is based on the Keras framework, which performs all computation on GPUs in single precision arithmetic. We perform all of our experiments on an NVIDIA GTX TITAN Xp GPU (memory Clock Rate (GHz) 1.582) with 48 GB of memory.

3.3. Evaluations

We evaluate the prediction results with intersection over union (IoU), accuracy (Acc), and sensitivity (Sen). They are defined as follows:
I o U = T P T P + F P + F N ,
A c c = T P + T N T P + T N + F P + F N ,
S e n = T P T P + F N ,
S p e = T N T N + F P ,
where TP (true positive) represents the positive cases judged to be positive, FN (false negative) represents the positive cases judged to be negative, TN (true negative) represents the negative cases judged to be negative, and FP (false positive) represents the negative cases judged to be positive.

4. Results and Discussion

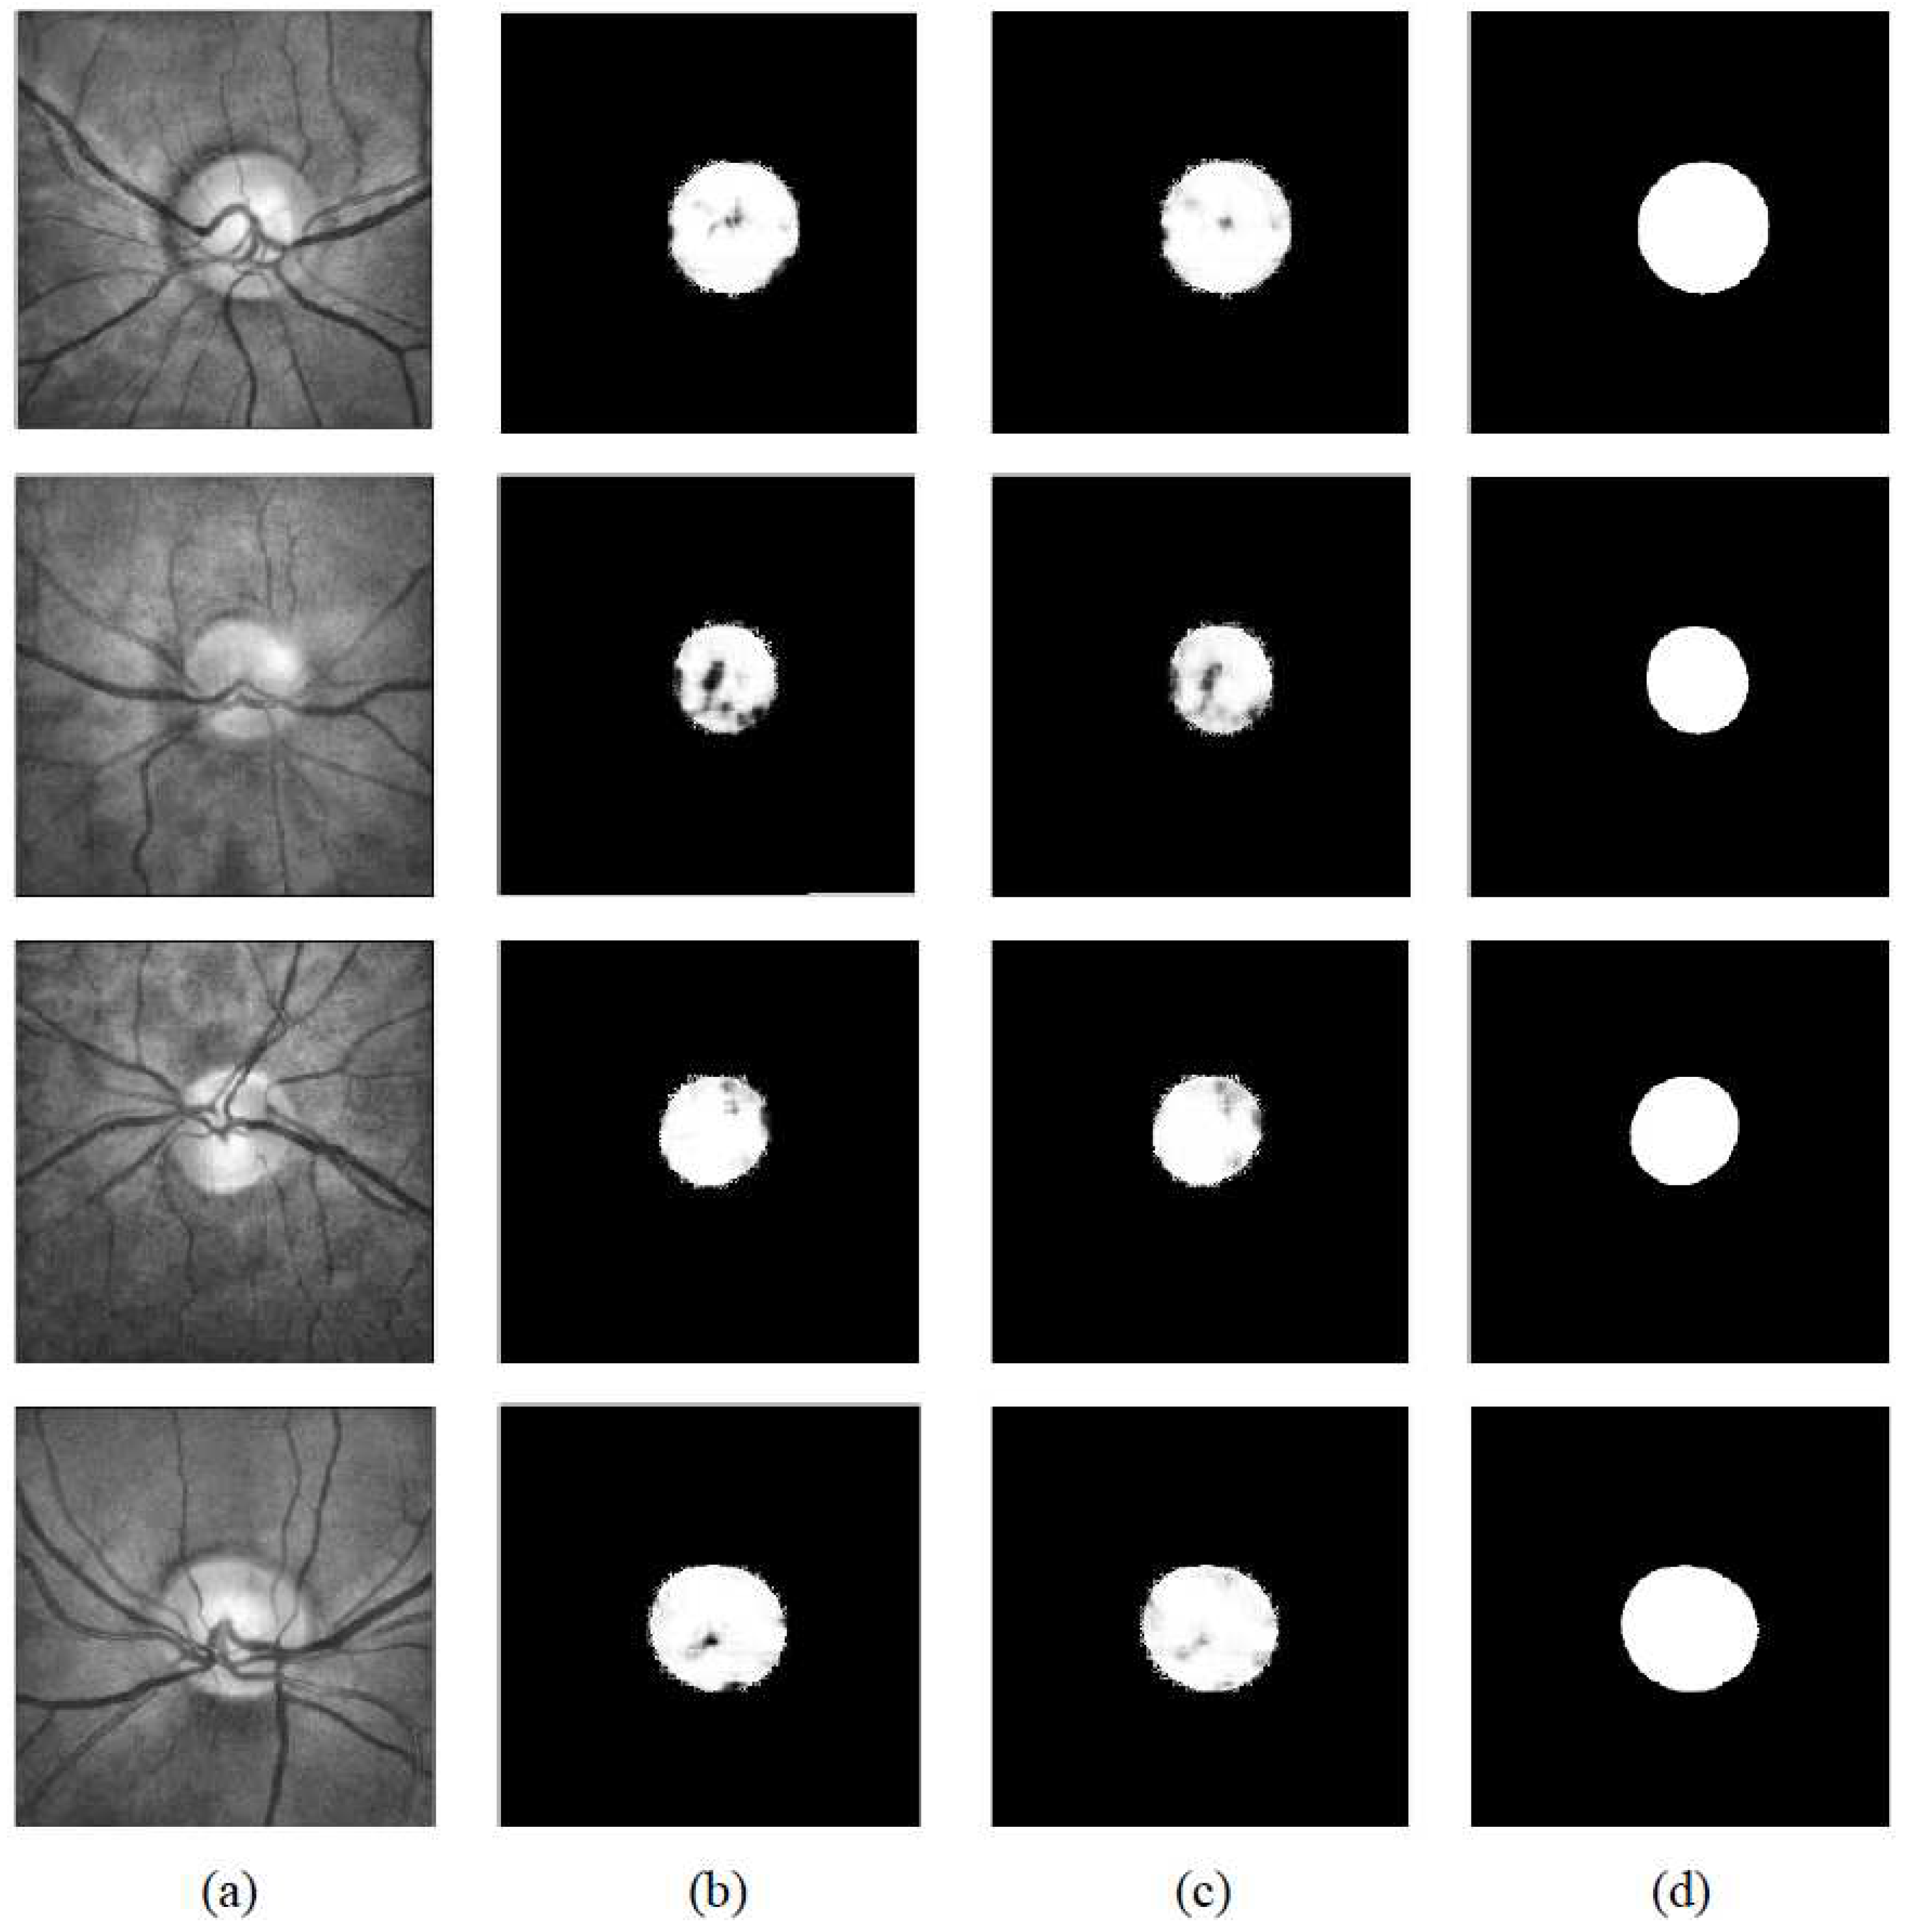
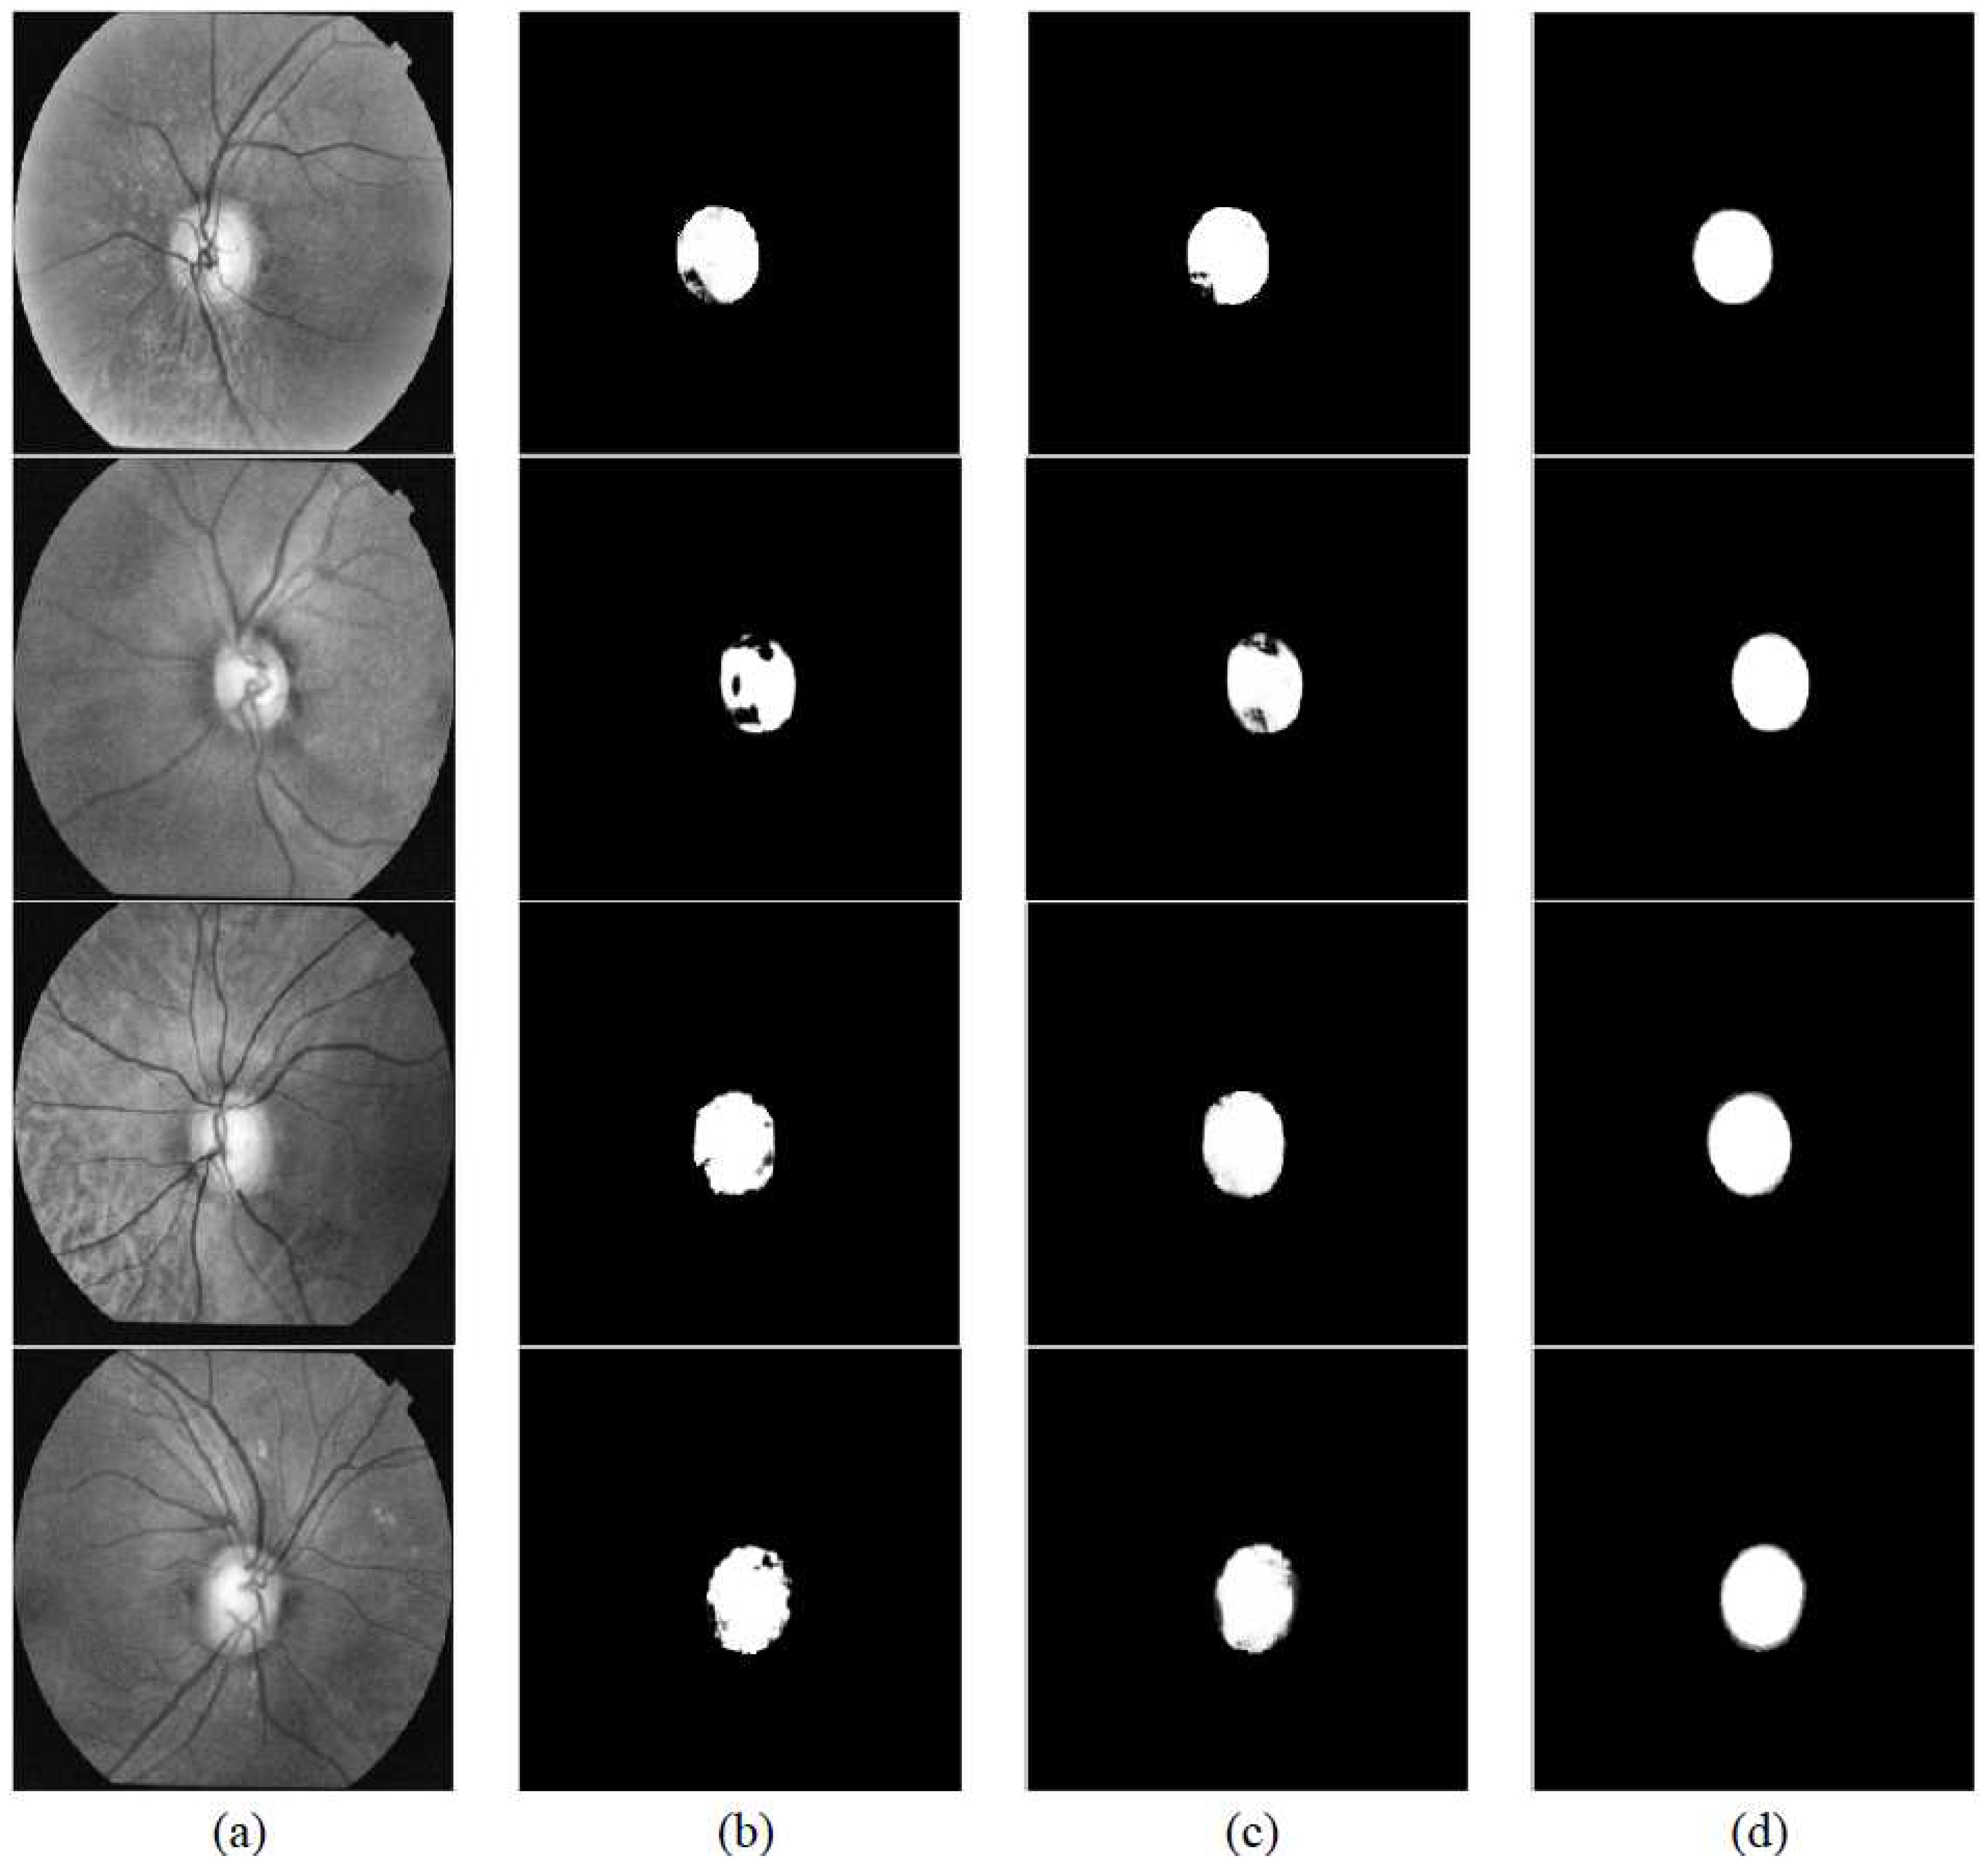
In order to prove the effectiveness of our weakly- and semi-supervised segmentation method, we carried out a verification experiment on the database RIM-ONE and DRISHTI-GS. In this paper, we only randomly selected 10% groundtruths from the training set to implement our semi-supervised method. The Linux operating system version used in this paper is Ubuntu 16.04. We perform all of our experiments on an NVIDIA GTX TITAN Xp GPU (memory Clock Rate (GHz) 1.582) with 48 GB of memory, and the implementation is based on the Keras framework with Python 3.6 programming language. Figure 6 and Figure 7 show the partial segmentation results of the proposed algorithm. From Figure 6 and Figure 7, we can see that our weakly supervised and semi-supervised optic disc segmentation algorithm can segment the contour of the optic disc image very well. Although without groundtruth training (the proposed weakly supervised method) or just using a few groundtruths to train (the proposed semi-supervised method), the proposed method can still segment the optic disc accurately, and the result is very close to that of groundtruth. At the same time, we describe the changes of loss in the training stage of the two methods in Figure 8 and Figure 9.
Because there are very few algorithms about the weakly- and semi- supervised segmentation of optic disc, we compare the proposed algorithm with the fully supervised segmentation method. Some comparisons between our method and other fully supervised methods are described in Table 2 and Table 3. From Table 2 and Table 3, we can know that without groundtruth training or just using a few groundtruths to train, our segmentation results have achieved good results and exceeded the partial fully supervised algorithm. However, compared with Zahoor’s method and Zilly’s method, the proposed method still has a very small gap, which is due to the lack of groundtruth for training and the poor segmentation in some details of the optic disc. This shows that our weakly- and semi-supervised method still has great room for progress. At the same time, we use the proposed framework to conduct a fully supervised experiment (here we use all groundtruths for training). The experimental results show that our fully supervised method exceeds the current state-of-the-art method in terms of IoU indicators. To sum up, the methods proposed in this paper, whether based on weakly supervised learning or fully supervised learning, have achieved results close to or beyond the state-of-the-art method. We also compare the prediction time per image. From the Table 2 and Table 3, we can see that the prediction time of our method is longer than Sevastopolsky’s method. This is mainly because each input image is cropped into 50 300 × 300 patches in our method, which is equivalent to that Sevastopolsky’s method predicts one image in 0.1 s, while our method predicts 50 300 × 300 patches in 4.49 s, and then sew them into a complete image (The resolution of a complete image used in this paper is 500 × 500). In fact, the real-time performance of the two methods is almost the same.

5. Conclusions

This paper solves the problem of groundtruth annotation in medical image segmentation, we present a new weakly- and semi-supervised segmentation method of optic disc, which can segment the optic disc without the training of groundtruth marked by medical experts, so a lot of manpower is saved to mark samples. The proposed algorithm has achieved good segmentation results on RIM-ONE and DRISHTI-GS databases, which proves the effectiveness of our method.

Author Contributions

Conception of project, D.C. and Z.L.; execution, D.C. and Z.L.; manuscript preparation, Z.L. and D.C.; writing of the first draft, Z.L. All authors have read and agreed to the published version of the manuscript.

Funding

This research was funded by the National Natural Science Foundation of China grant number 61773104.

Conflicts of Interest

The authors declare no conflict of interest.

References

  1. Maninis, K.K.; Pont-Tuset, J.; Arbeláez, P.; Van Gool, L. Deep retinal image understanding. In Proceedings of the Medical Image Computing and Computer-Assisted Intervention—MICCAI 2016, Athens, Greece, 17–21 October 2016; pp. 140–148. [Google Scholar]
  2. Datt, J.G.; Jayanthi, S.; Krishnadas, S.R. Optic disk and cup segmentation from monocular color retinal images for glaucoma assessment. IEEE Trans. Med. Imaging 2011, 30, 1192–1205. [Google Scholar]
  3. Mittapalli, P.S.; Kande, G.B. Segmentation of optic disk and optic cup from digital fundus images for the assessment of glaucoma. Biomed. Signal Process. Control 2016, 24, 34–46. [Google Scholar] [CrossRef]
  4. Saleh, M.D.; Salih, N.D.; Eswaran, C.; Abdullah, J. Automated segmentation of optic disc in fundus images. In Proceedings of the 2014 IEEE 10th International Colloquium on Signal Processing and Its Applications (CSPA 2014), Kuala Lumpur, Malaysia, 7–9 March 2014; pp. 145–150. [Google Scholar]
  5. Cheng, J.; Liu, J.; Xu, Y.; Yin, F.; Wong, D.W.; Tan, N.M.; Tao, D.; Cheng, C.Y.; Aung, T.; Wong, T.Y. Superpixel classification based optic disc and optic cup segmentation for glaucoma screening. IEEE Trans. Med. Imaging 2013, 32, 1019–1032. [Google Scholar] [CrossRef] [PubMed]
  6. Mahapatra, D.; Buhmann, J.M. A field of experts model for optic cup and disc segmentation from retinal fundus images. In Proceedings of the 2015 IEEE 12th International Symposium on Biomedical Imaging (ISBI), New York, NY, USA, 16–19 April 2015; pp. 218–221. [Google Scholar]
  7. Yu, H.; Barriga, E.S.; Agurto, C.; Echegaray, S.; Pattichis, M.S.; Bauman, W.; Soliz, P. Fast localization and segmentation of optic disk in retinal images using directional matched filtering and level Sets. IEEE Trans. Inf. Technol. Biomed. 2012, 16, 644–657. [Google Scholar] [CrossRef] [PubMed]
  8. Zheng, S.H.; Chen, J.; Pan, L.; Yu, L. Optic disc detection on retinal images based on directional local contrast. Chin. J. Biomed. Eng. 2014, 33, 289–296. [Google Scholar]
  9. Walter, T.; Klein, J.C.; Massin, P.; Erginay, A. A contribution of image processing to the diagnosis of diabetic retinopathy—Detection of exudates in color fundus images of human retina. IEEE Trans. Med. Imaging 2002, 21, 1236–1243. [Google Scholar] [CrossRef] [PubMed]
  10. Abdullah, M.; Fraz, M.M.; Barman, S.A. Localization and segmentation of optic disc in retinal images using Circular Hough transform and Grow Cut algorithm. Peerj 2016, 4, e2003. [Google Scholar] [CrossRef] [PubMed]
  11. Adam, H.; Michael, G. Locating the optic nerve in a retinal image using the fuzzy convergence of the blood vessels. IEEE Trans. Med. Imaging 2003, 22, 951–958. [Google Scholar]
  12. Osareh, A.; Mirmehdi, M.; Thomas, B.; Markham, R. Comparison of Colour Spaces for Optic Disc Localisation in Retinal Images. In Proceedings of the 16th International Conference on Pattern Recognition, Quebec City, QC, Canada, 11–15 August 2002. [Google Scholar]
  13. Kande, G.B.; Savithri, T.S.; Subbaiah, P.V.; Tagore, M.R. Automatic detection and boundary estimation of optic disc in fundus images using geometric active contours. J. Biomed. Sci. Eng. 2009, 2, 90–95. [Google Scholar] [CrossRef]
  14. Sevastopolsky, A. Optic disc and cup segmentation methods for glaucoma detection with modification of U-net convolutional neural network. Pattern Recognit. Image Anal. 2017, 27, 618–624. [Google Scholar] [CrossRef] [Green Version]
  15. Tan, J.H.; Acharya, U.R.; Bhandary, S.V.; Chua, K.C.; Sivaprasad, S. Segmentation of optic disc, fovea and retinal vasculature using a single convolutional neural network. J. Comput. Sci 2017, 20, 70–79. [Google Scholar] [CrossRef] [Green Version]
  16. Kolesnikov, A.; Lampert, C.H. Seed, Expand and Constrain: Three Principles for Weakly-Supervised 4Image Segmentation. In Proceedings of the 14th European Conference on Computer Vision (ECCV), Amsterdam, The Netherlands, 11–14 October 2016. [Google Scholar]
  17. Vezhnevets, A.; Ferrari, V.; Buhmann, J.M. Weakly Supervised Structured Output Learning for Semantic Segmentation. In Proceedings of the IEEE Conference on Computer Vision and Pattern Recognition (CVPR), Providence, Rhode Island, 16–21 June 2012. [Google Scholar]
  18. Rother, C.; Kolmogorov, V.; Blake, A. Grabcut: Interactive foreground extraction using iterated graph cuts. ACM Trans. Graph. 2004, 23, 309–314. [Google Scholar] [CrossRef]
  19. Pizer, S.M.; Amburn, E.P. Adaptive histogram equalization and its variations. Comput. Vis. Graph. Image Process 1987, 39, 355–368. [Google Scholar] [CrossRef]
  20. Tseng, C.Y.; Wang, S.J.; Lai, Y.Y.; Zhou, Y.C. Image Detail and Color Enhancement Based on Channel-Wise Local Gamma Adjustment. SID Symp. Dig. Tech. Pap. 2009, 40, 1022–1025. [Google Scholar] [CrossRef]
  21. Fumero, F.; Alayón, S.; Sanchez, J.L.; Sigut, J.; Gonzalez-Hernandez, M. RIM-ONE: An open retinal image database for optic nerve evaluation. In Proceedings of the 24th IEEE International Symposium on Computer-Based Medical Systems, Bristol, UK, 27–30 June 2011. [Google Scholar]
  22. Sivaswamy, J.; Krishnadas, S.; Chakravarty, A.; Joshi, G.; Tabish, A.S. A comprehensive retinal image dataset for the assessment of glaucoma from the optic nerve head analysis. JSM Biomed. Imaging Data Pap. 2015, 2, 1004. [Google Scholar]
  23. Glorot, X.; Bengio, Y. Understanding the difficulty of training deep feedforward neural networks. J. Mach. Learn. Res. 2010, 9, 249–256. [Google Scholar]
  24. Krizhevsky, A.; Sutskever, I.; Hinton, G.E. ImageNet classification with deep convolutional neural networks. In Proceedings of the Neural Information Processing Systems, Lake Tahoe, Spain, 3–6 December 2012; pp. 1097–1105. [Google Scholar]
  25. Zahoor, M.N.; Fraz, M.M. Fast optic disc segmentation in retina using polar transform. IEEE Access 2017, 5, 12293–12300. [Google Scholar] [CrossRef]
  26. Zilly, J.; Buhmann, J.M.; Mahapatra, D. Glaucoma detection using entropy sampling and ensemble learning for automatic optic cup and disc segmentation. Comput. Med. Imaging Graph. 2017, 55, 28–41. [Google Scholar] [CrossRef] [PubMed]
Figure 1. Comparison of several different labels: (a) The original image; (b) the image-level label; (c) the bounding-box label; (d) groundtruth.
Symmetry 12 00145 g001
Figure 2. The overview of the proposed general framework. As shown in the figure, it composed of three parts. The first part uses the grabcut method to generate pseudo groundtruths, the second part uses the generated groundtruths to train the network based on the modified U-net (this part belongs to the weakly supervised learning method), and the third part uses a little groundtruths to fine-tune the network (This part belongs to the semi-supervised learning method).
Symmetry 12 00145 g002
Figure 3. The pseudo groundtruths generated by the grabcut method based on RIM-ONE database: (a) The original input images; (b) the pseudo groundtruths; (c) groundtruths.
Symmetry 12 00145 g003
Figure 4. The modified U-net structure.
Symmetry 12 00145 g004
Figure 5. Samples of input after preprocessing and cropping based on RIM-ONE database. The input samples are cropped into 50 patches respectively.
Symmetry 12 00145 g005
Figure 6. The segmentation results by the proposed method based on RIM-ONE dataset. (a) The original input images after preprocessing. (b) Segmentation results by the weakly supervised method. (c) Segmentation results by the semi-supervised method. (d) Groundtruths.
Symmetry 12 00145 g006
Figure 7. The segmentation results by the proposed method based on DRISHTI-GS dataset. (a) The original input images after preprocessing. (b) Segmentation results by the weakly supervised method. (c) Segmentation results by the semi-supervised method. (d) Groundtruths.
Symmetry 12 00145 g007
Figure 8. Comparison of loss between two methods in the training stage based on RIM-ONE database.
Symmetry 12 00145 g008
Figure 9. Comparison of loss between twomethods in the training stage based on DRISHTI-GS database.
Symmetry 12 00145 g009
Table 1. Comparison of existing methods and our method for optic disc segmentation.
TraditionalFully SupervisedWeakly SupervisedOurs
Field of methodtraditional methoddeep learningdeep learningdeep learning
Using groundtruth to trainyesyesnono
Involving optic disc imageyesyesnoyes
Segmentation resultgoodvery good-very good
Table 2. Comparison of fully supervised methods and our method for optic disc segmentation based on RIM-ONE database.
AccSenSpeIoUPrediction Time
Sevastopolsky [14]---0.890.1 s
DRIU [1]---0.890.13 s
Walter [9]0.96890.67150.97940.6227-
Abdullah [10]0.99890.85080.99660.8510-
Zahoor [25]0.99860.93840.99940.8860-
ours(weakly supervised)0.99180.91240.99710.87194.49 s
ours(semi-supervised)0.99200.90150.99740.87624.49 s
ours(fully-supervised)0.99320.90380.99940.89584.49 s
Table 3. Comparison of fully supervised methods and our method for optic disc segmentation based on DRISHTI-GS database.
AccSenSpeIoUPrediction Time
Sevastopolsky [14]---0.900.1 s
Zilly [26]---0.915.3 s
ours(weakly supervised)0.99560.89170.99890.86374.49 s
ours(semi-supervised)0.99620.91490.99880.88254.49 s
ours(fully-supervised)0.99720.92870.99960.91874.49 s