Path Mapping Approach for Network Function Virtualization Resource Allocation with Network Function Decomposition Support

 ,
,  , ,
, ,  and
and
Abstract
1. Introduction
2. Related Works
3. The Proposed Exact Scheme
3.1. Modeling of Physical Network
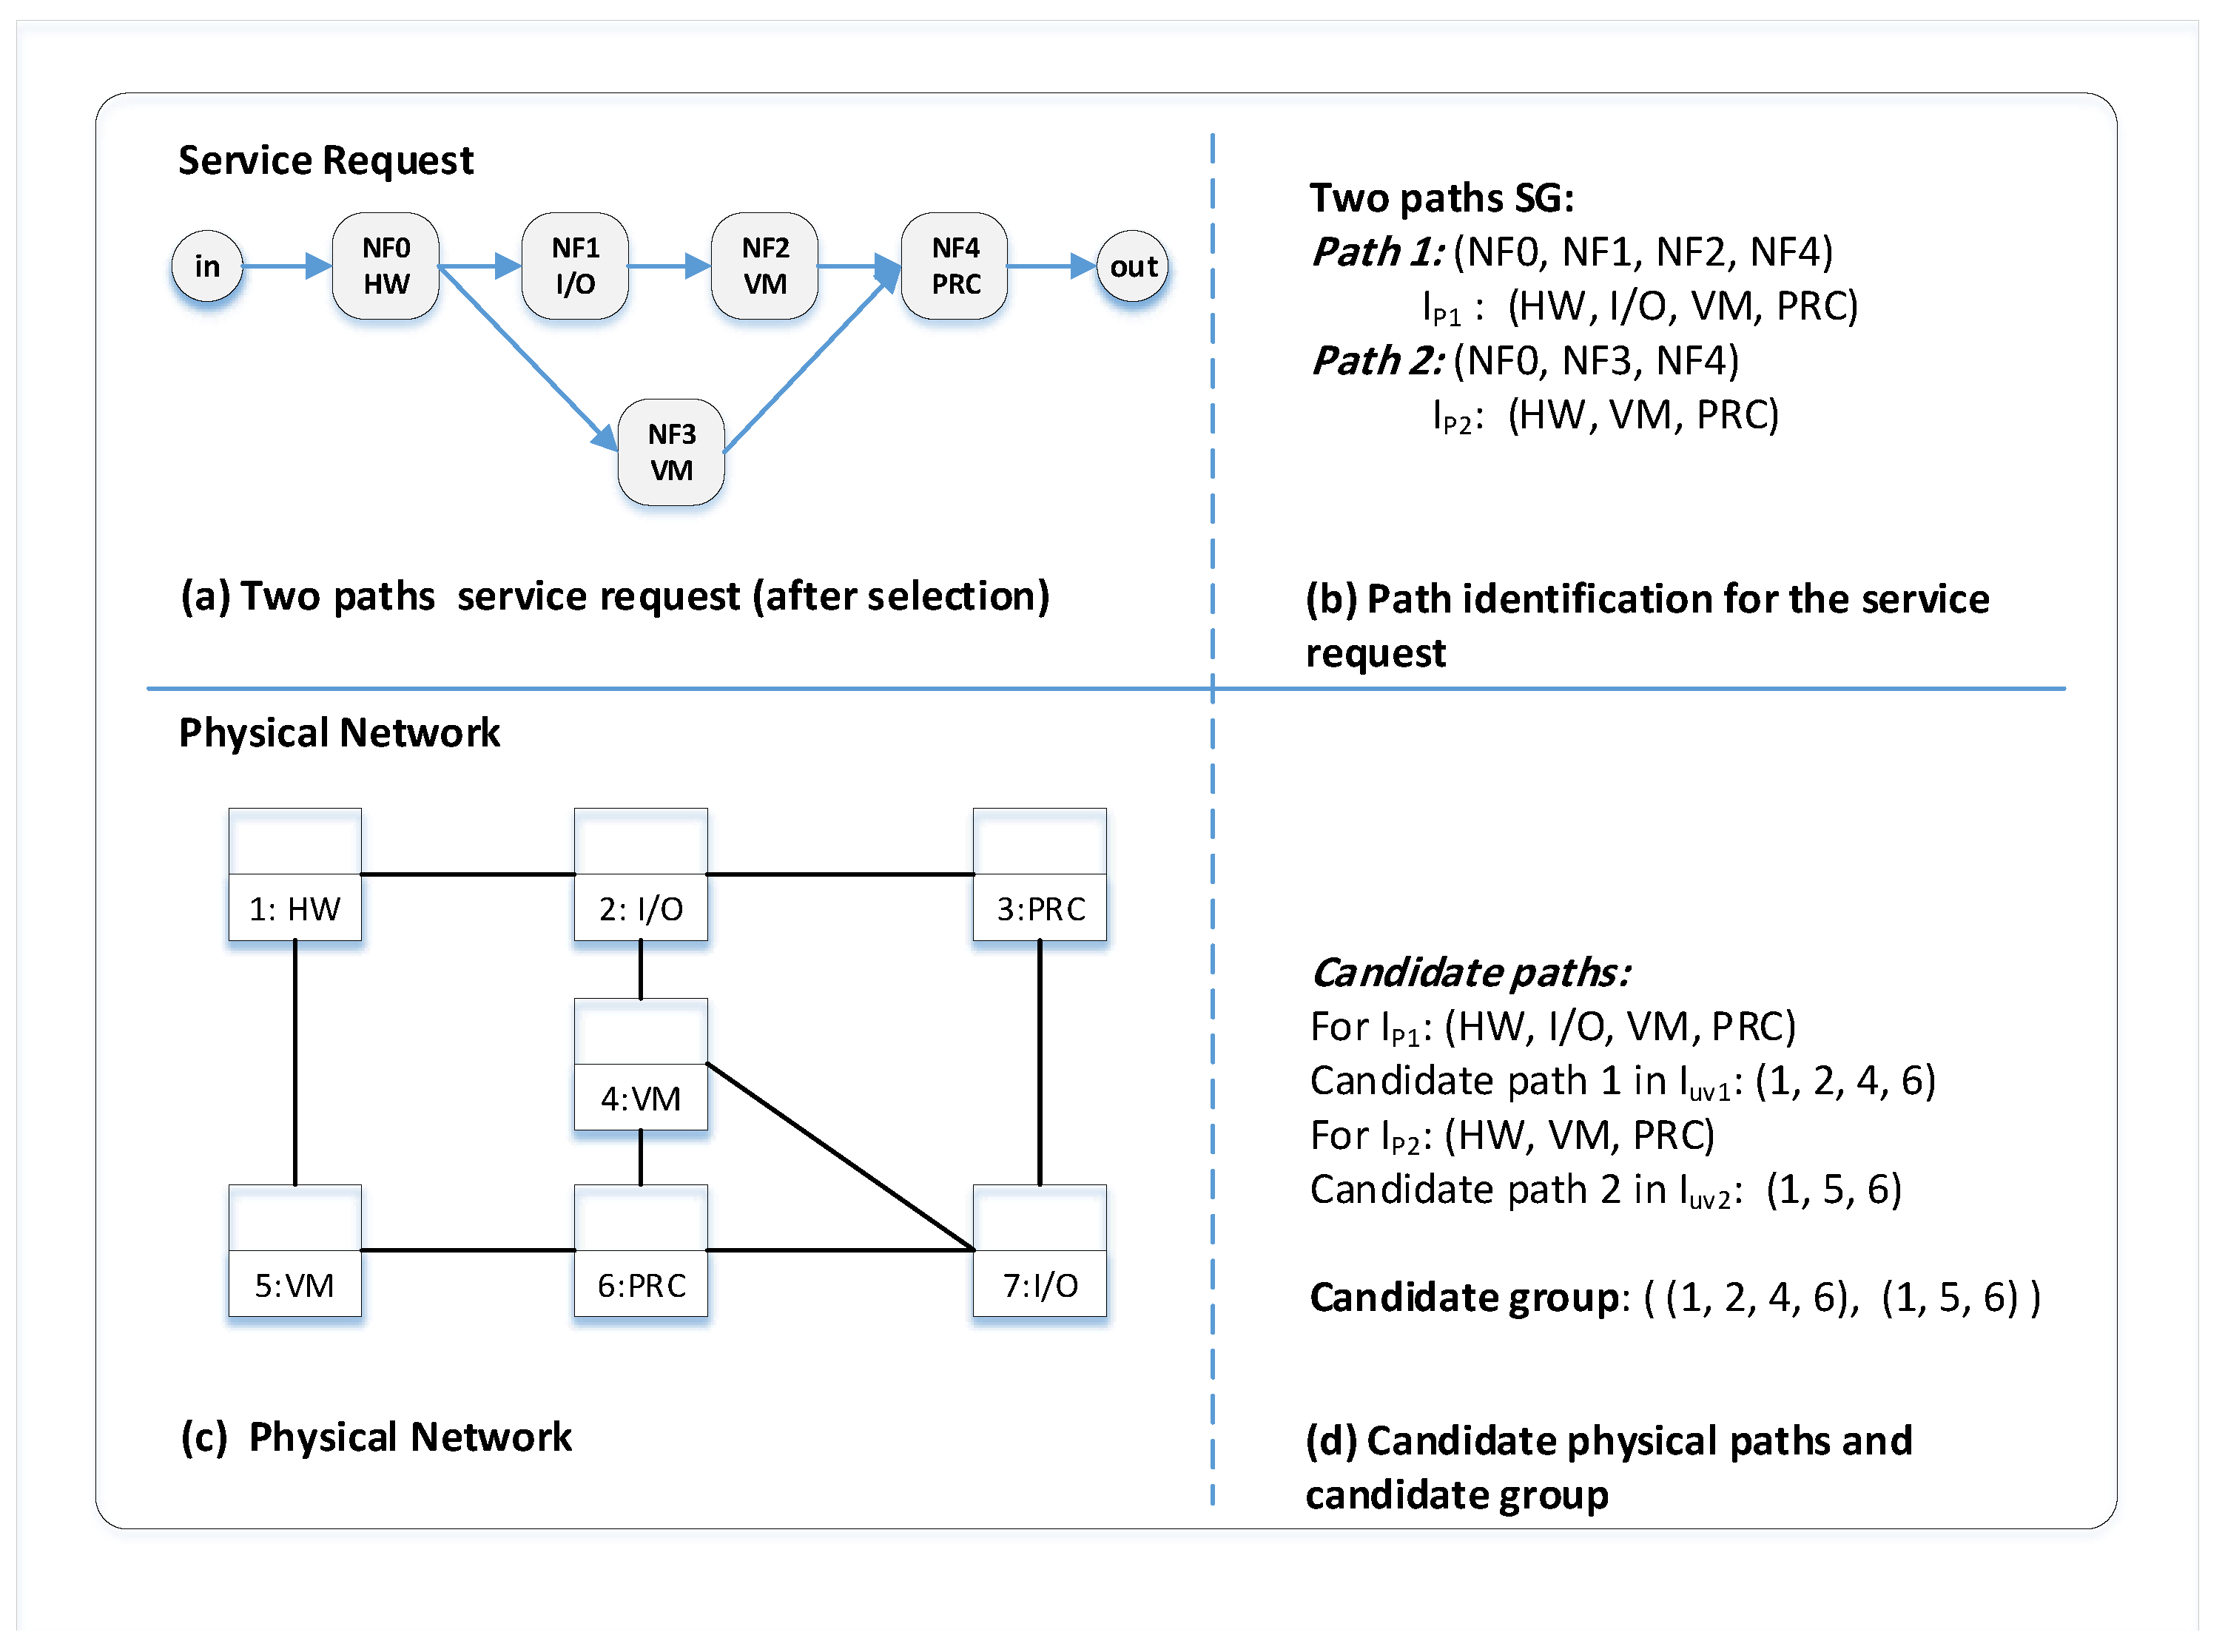
3.2. Path Identification
3.3. Service Requests
3.4. Problem Formulation
3.4.1. Variables of the Problem
3.4.2. Objective Function
3.4.3. Constraints of the Problem
4. The Proposed Heuristic Scheme
4.1. Decomposition Selection Algorithm
| Algorithm 1: Decomposition Selection Algorithm |
 |
4.2. Service Mapping Algorithm
| Algorithm 2: Service Mapping Algorithm |
 |
4.3. Path Mapping Algorithm
| Algorithm 3: Path Mapping Algorithm |
 |
5. Performance Evaluation
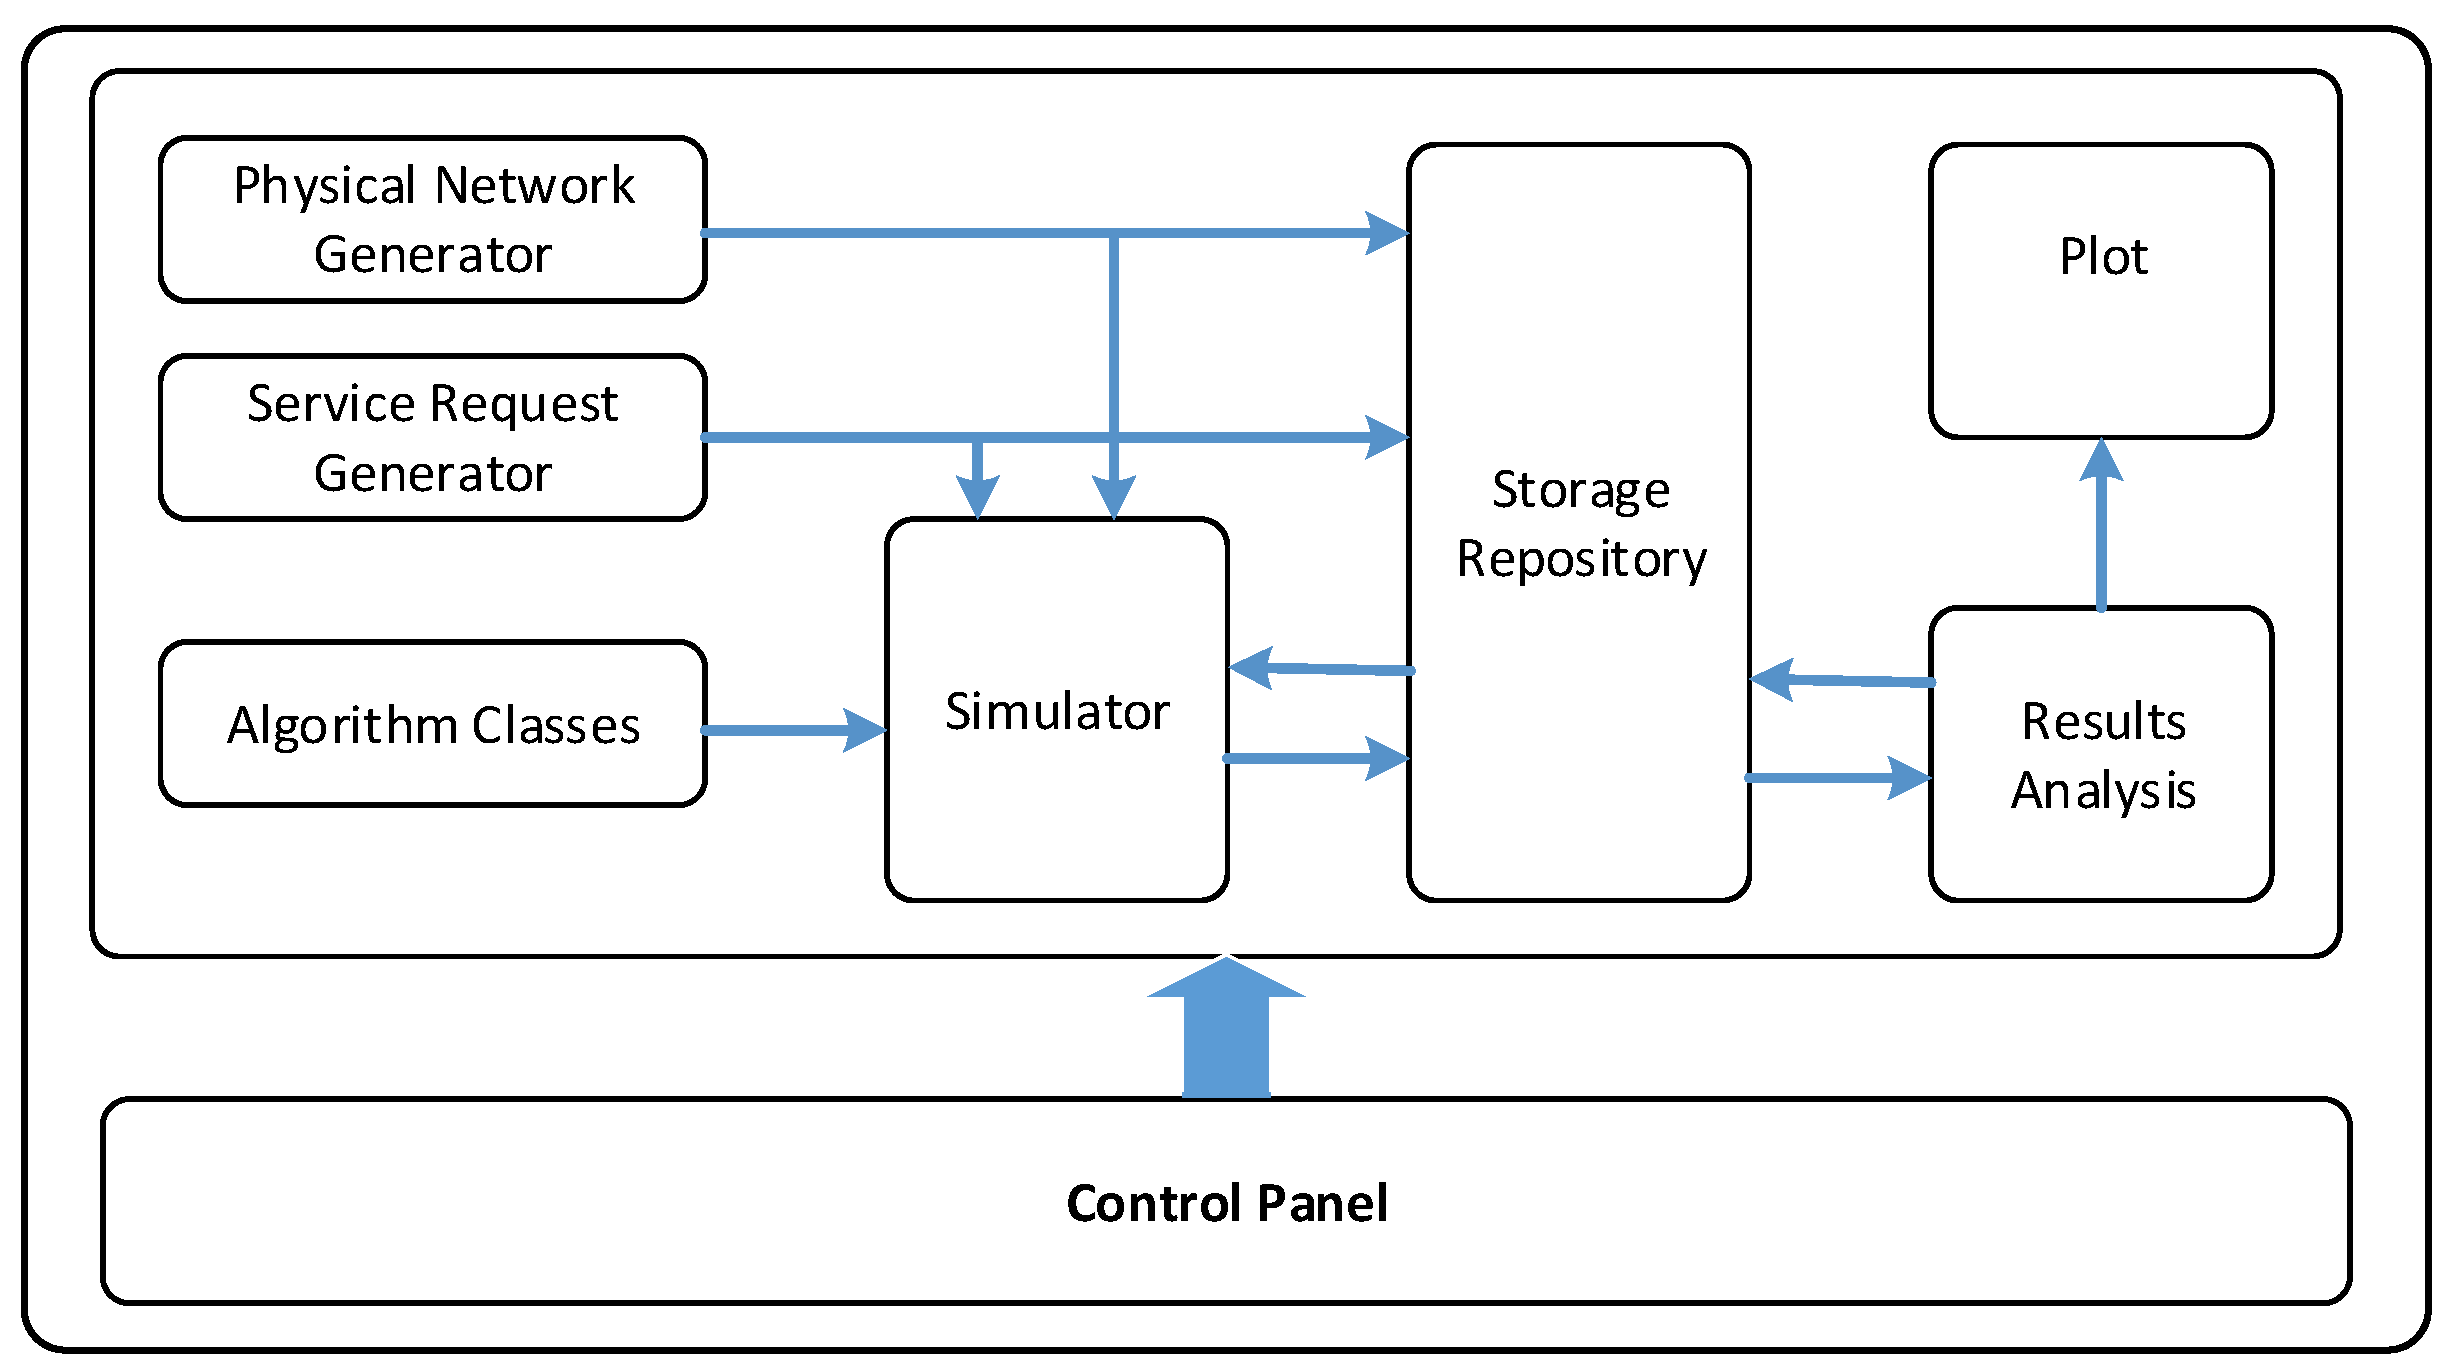
5.1. Simulation Environment
5.2. Performance Metrics
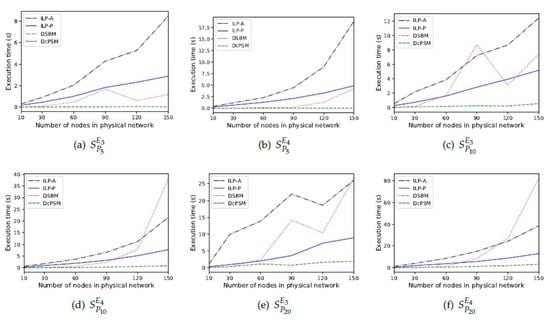
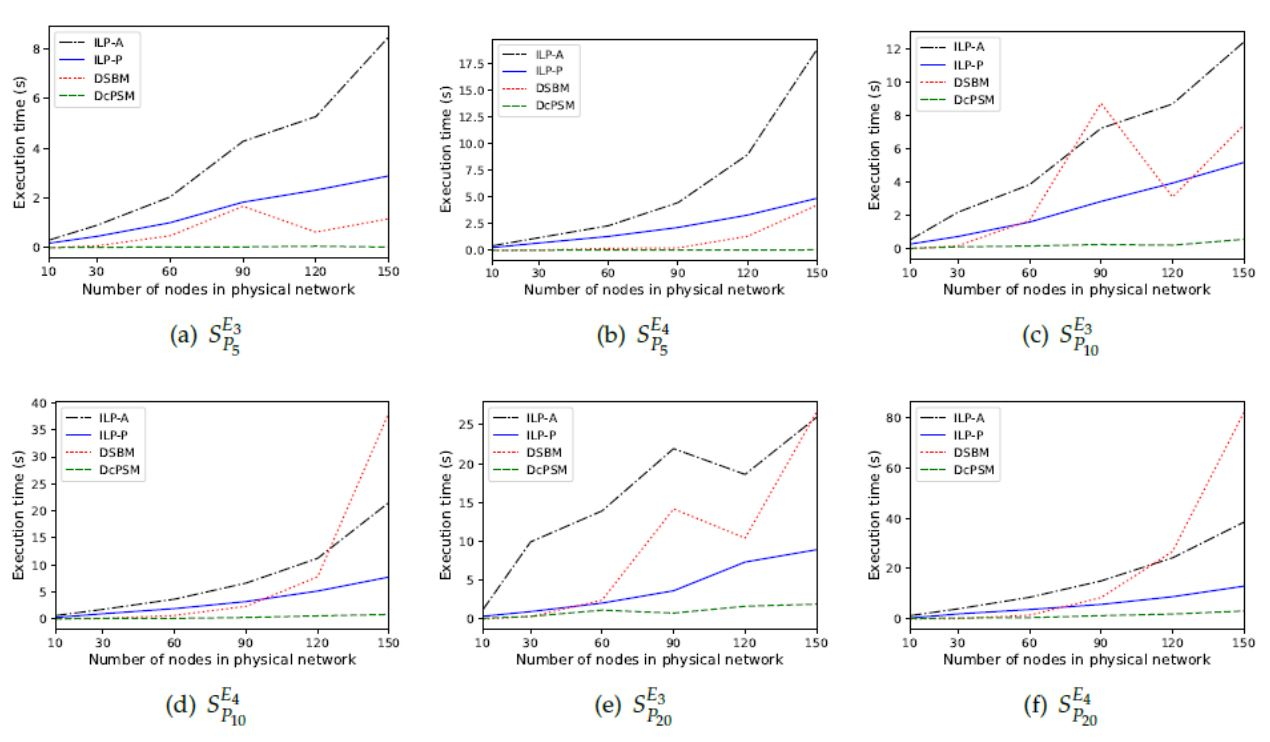
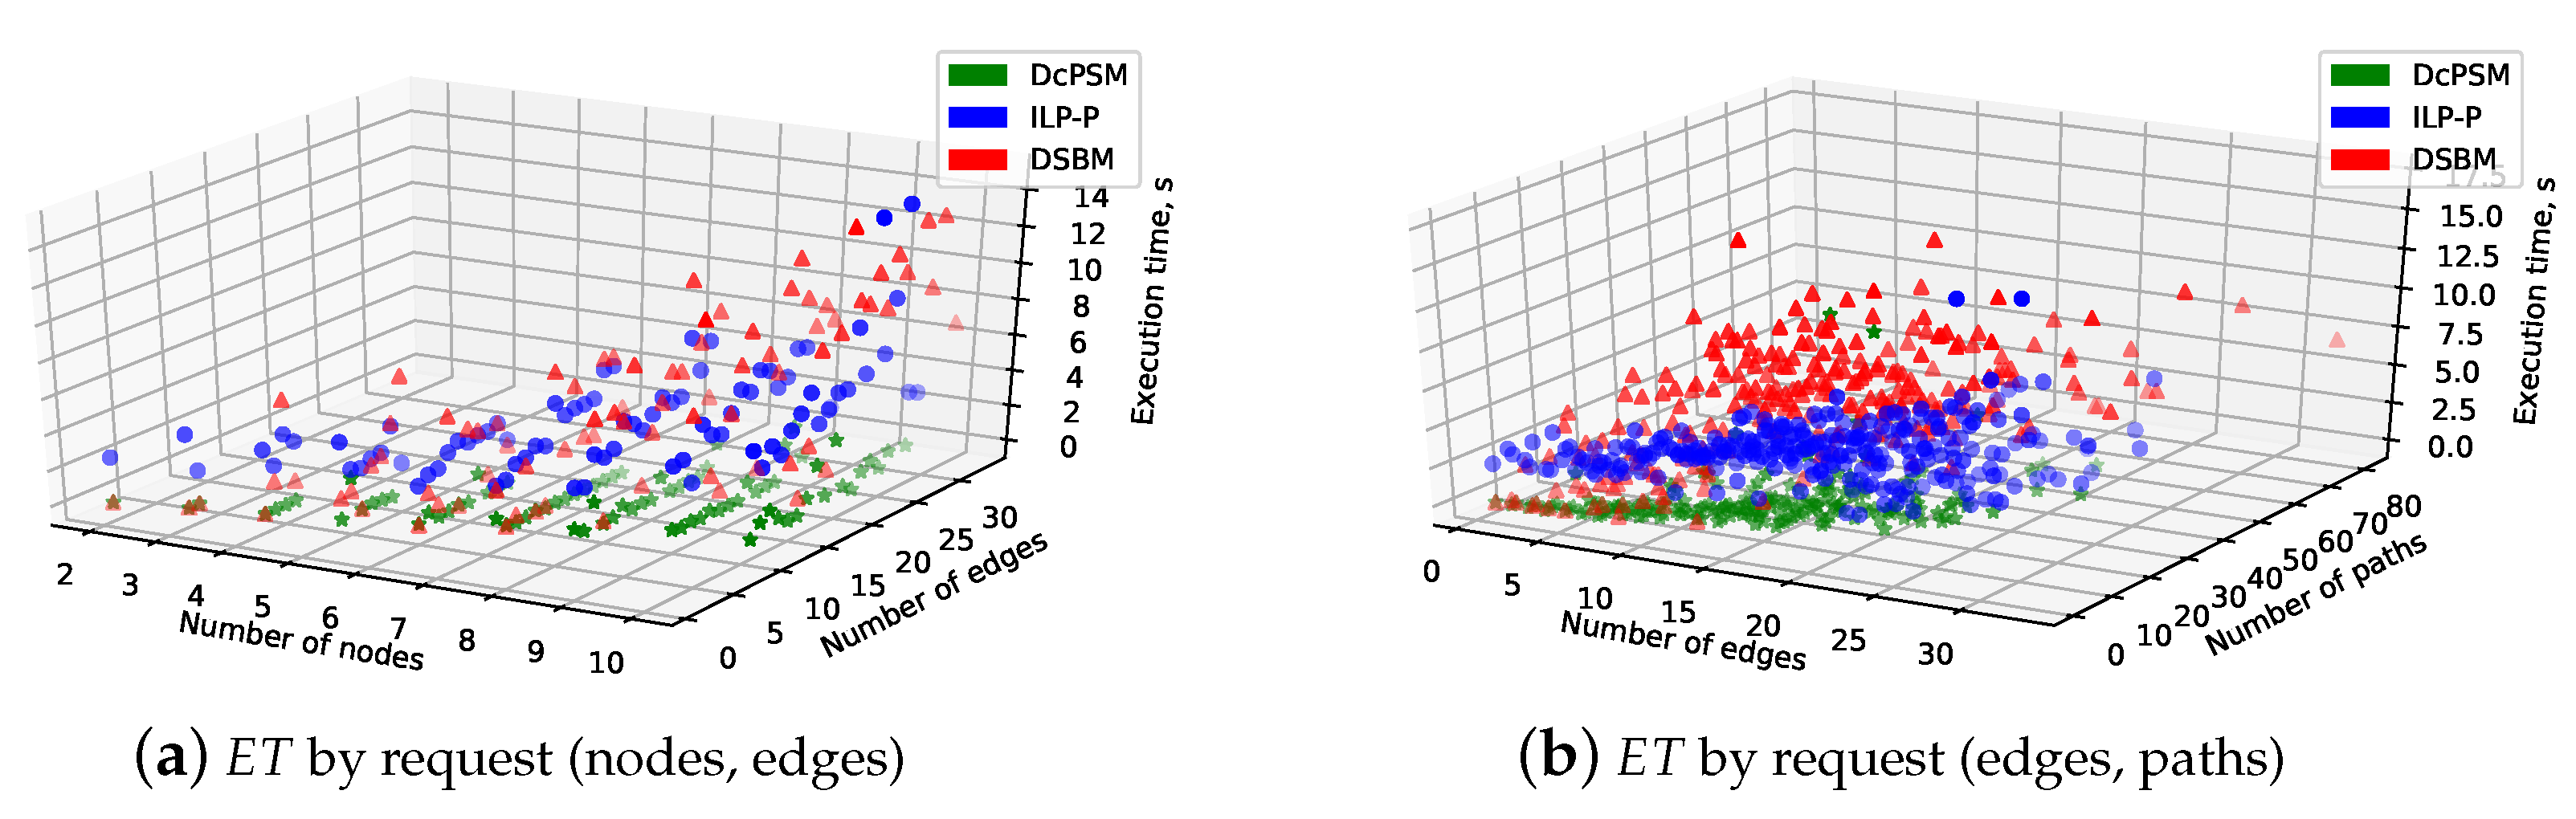
- Execution time (): measures the time consumed by an algorithm to find the embedding solution.
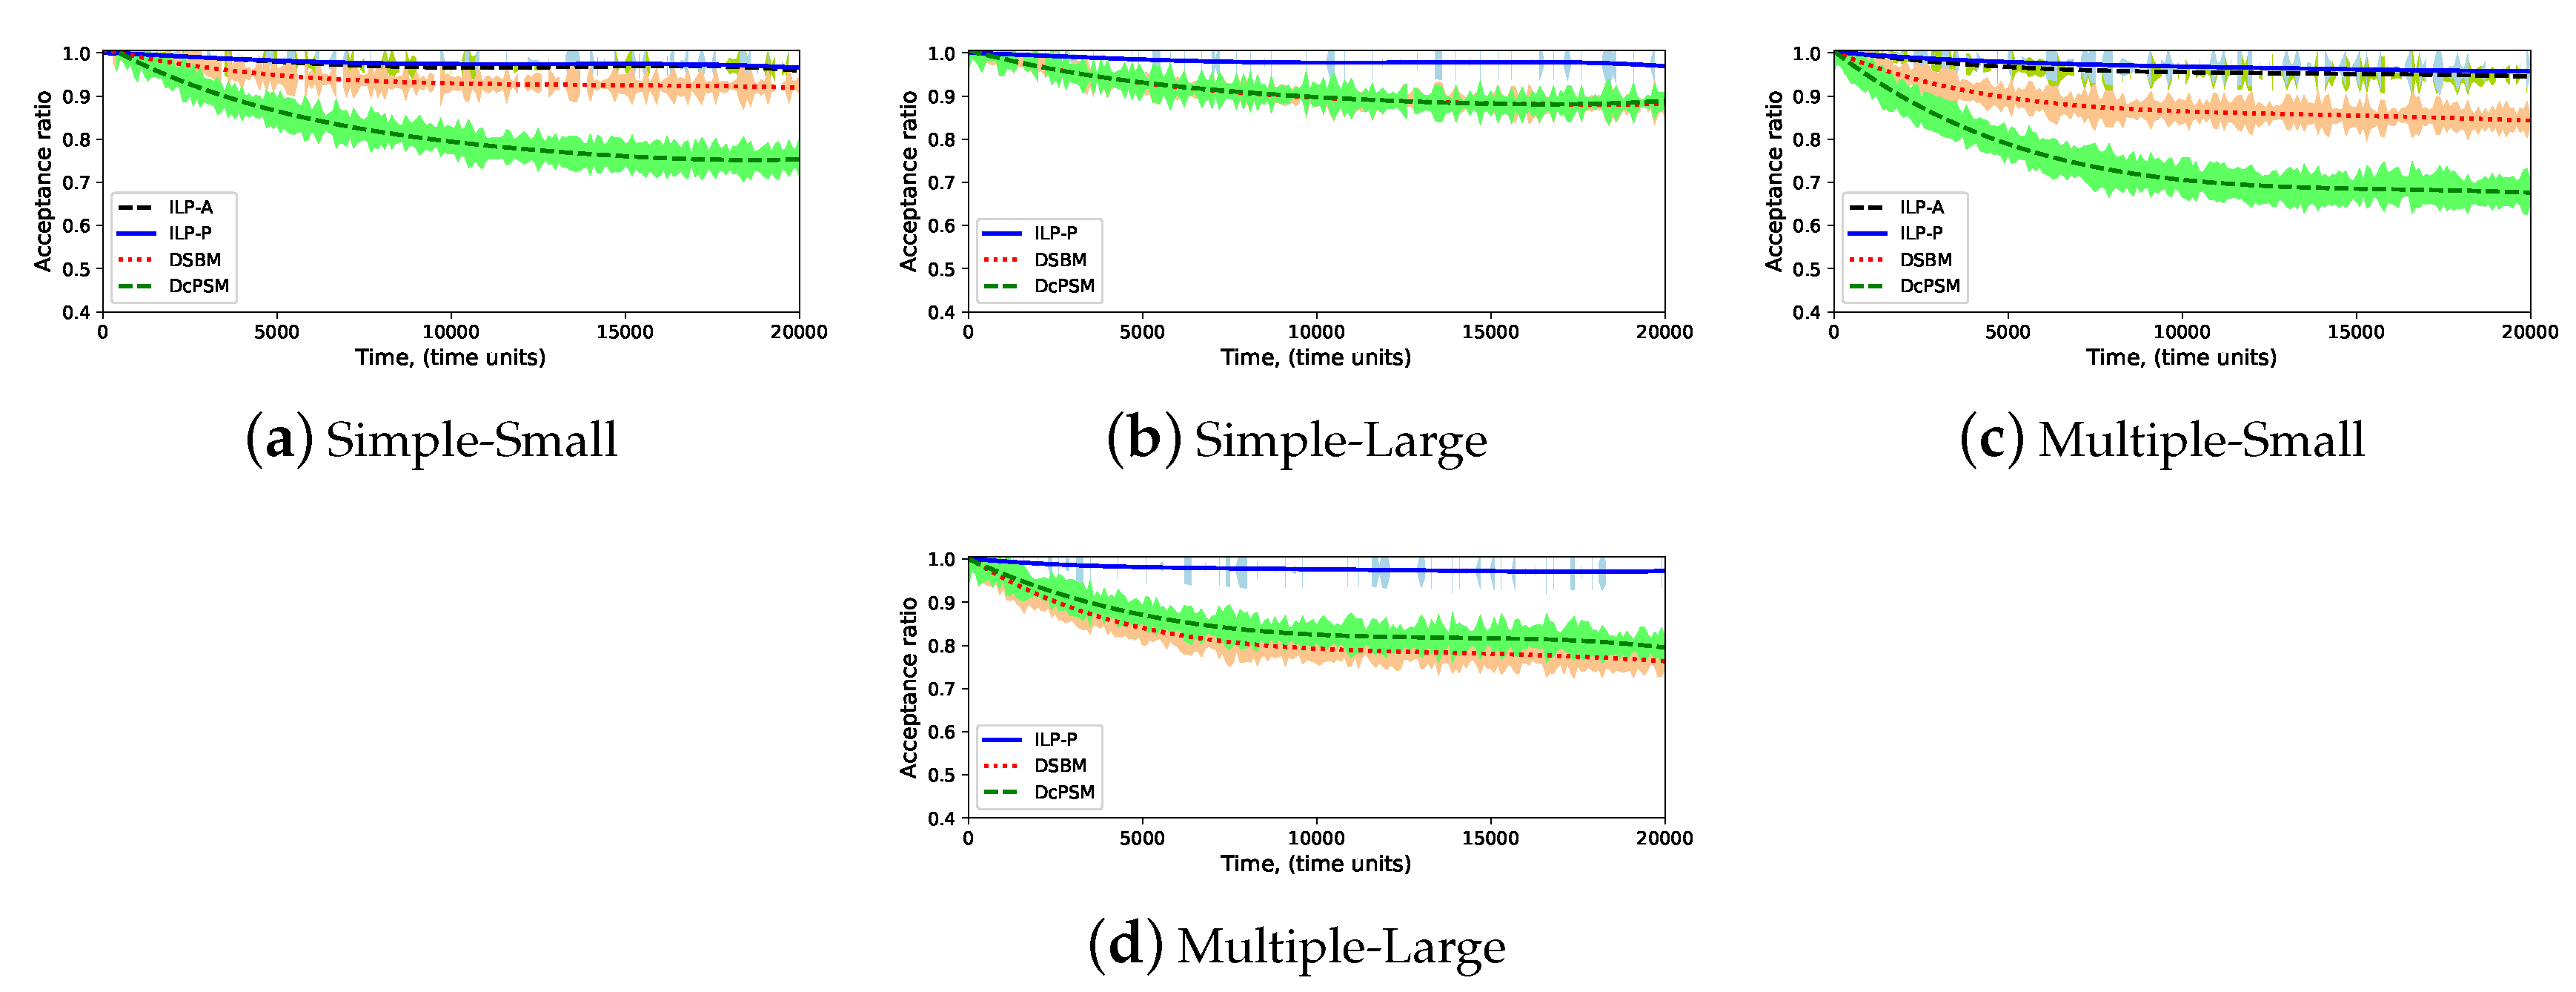
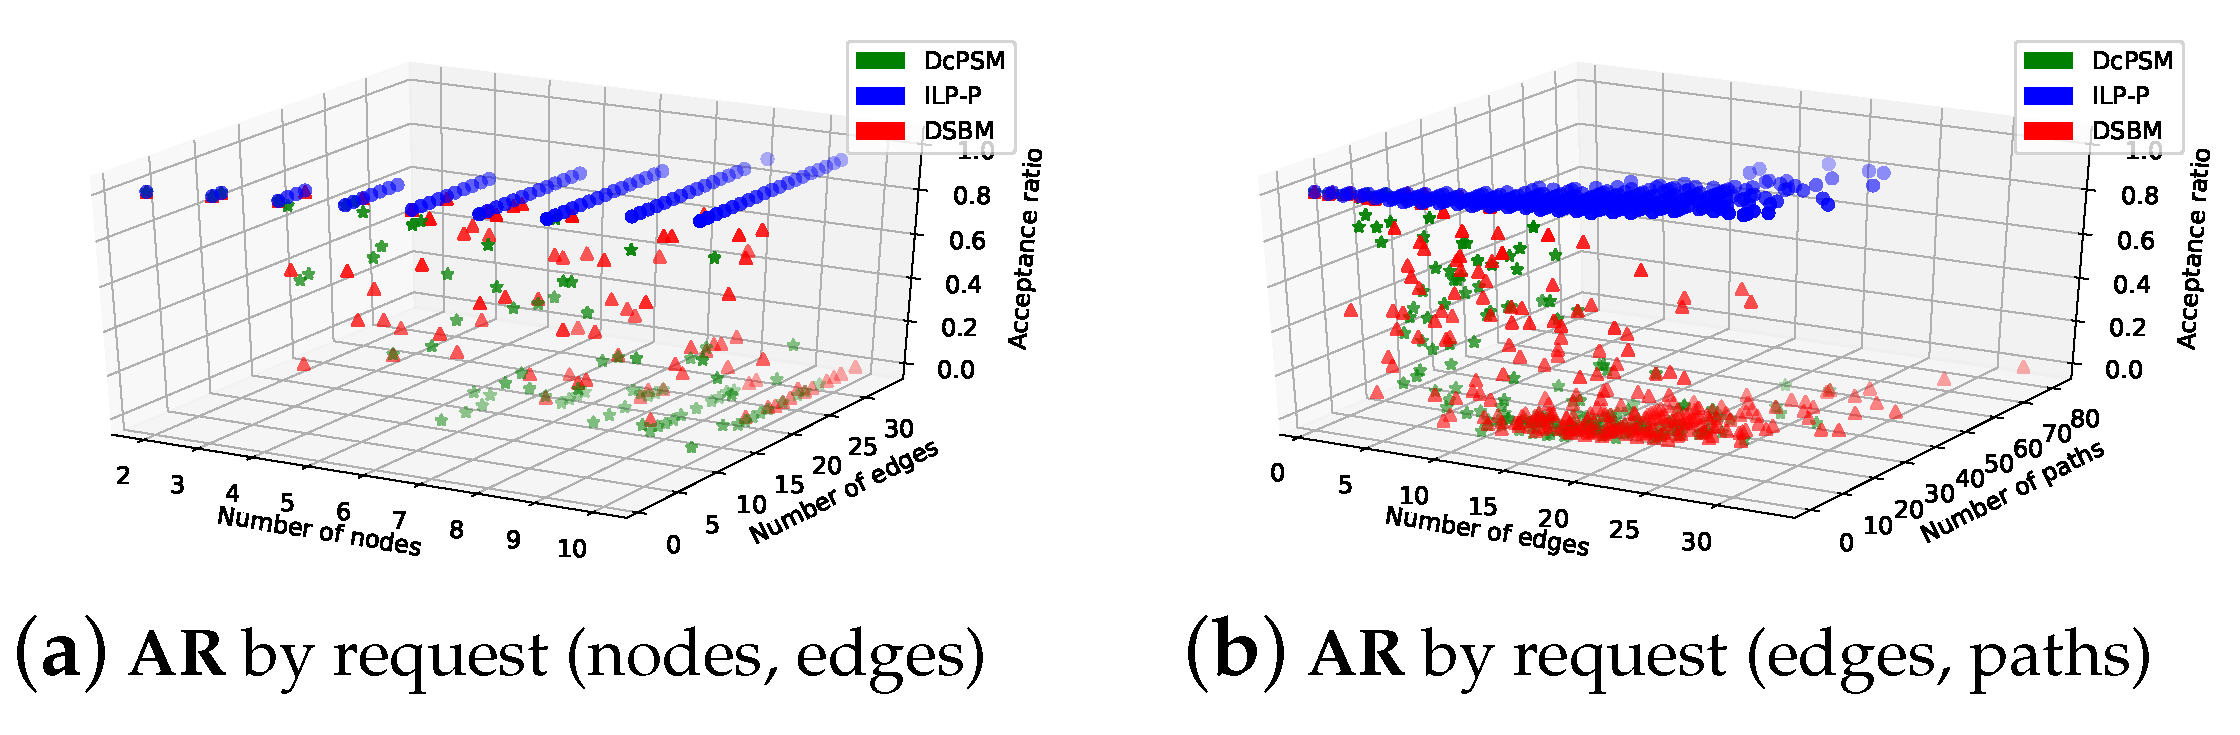
- Acceptance ratio (): measures the accepted service requests (), which are successfully mapped to the total number of arrived requests ().
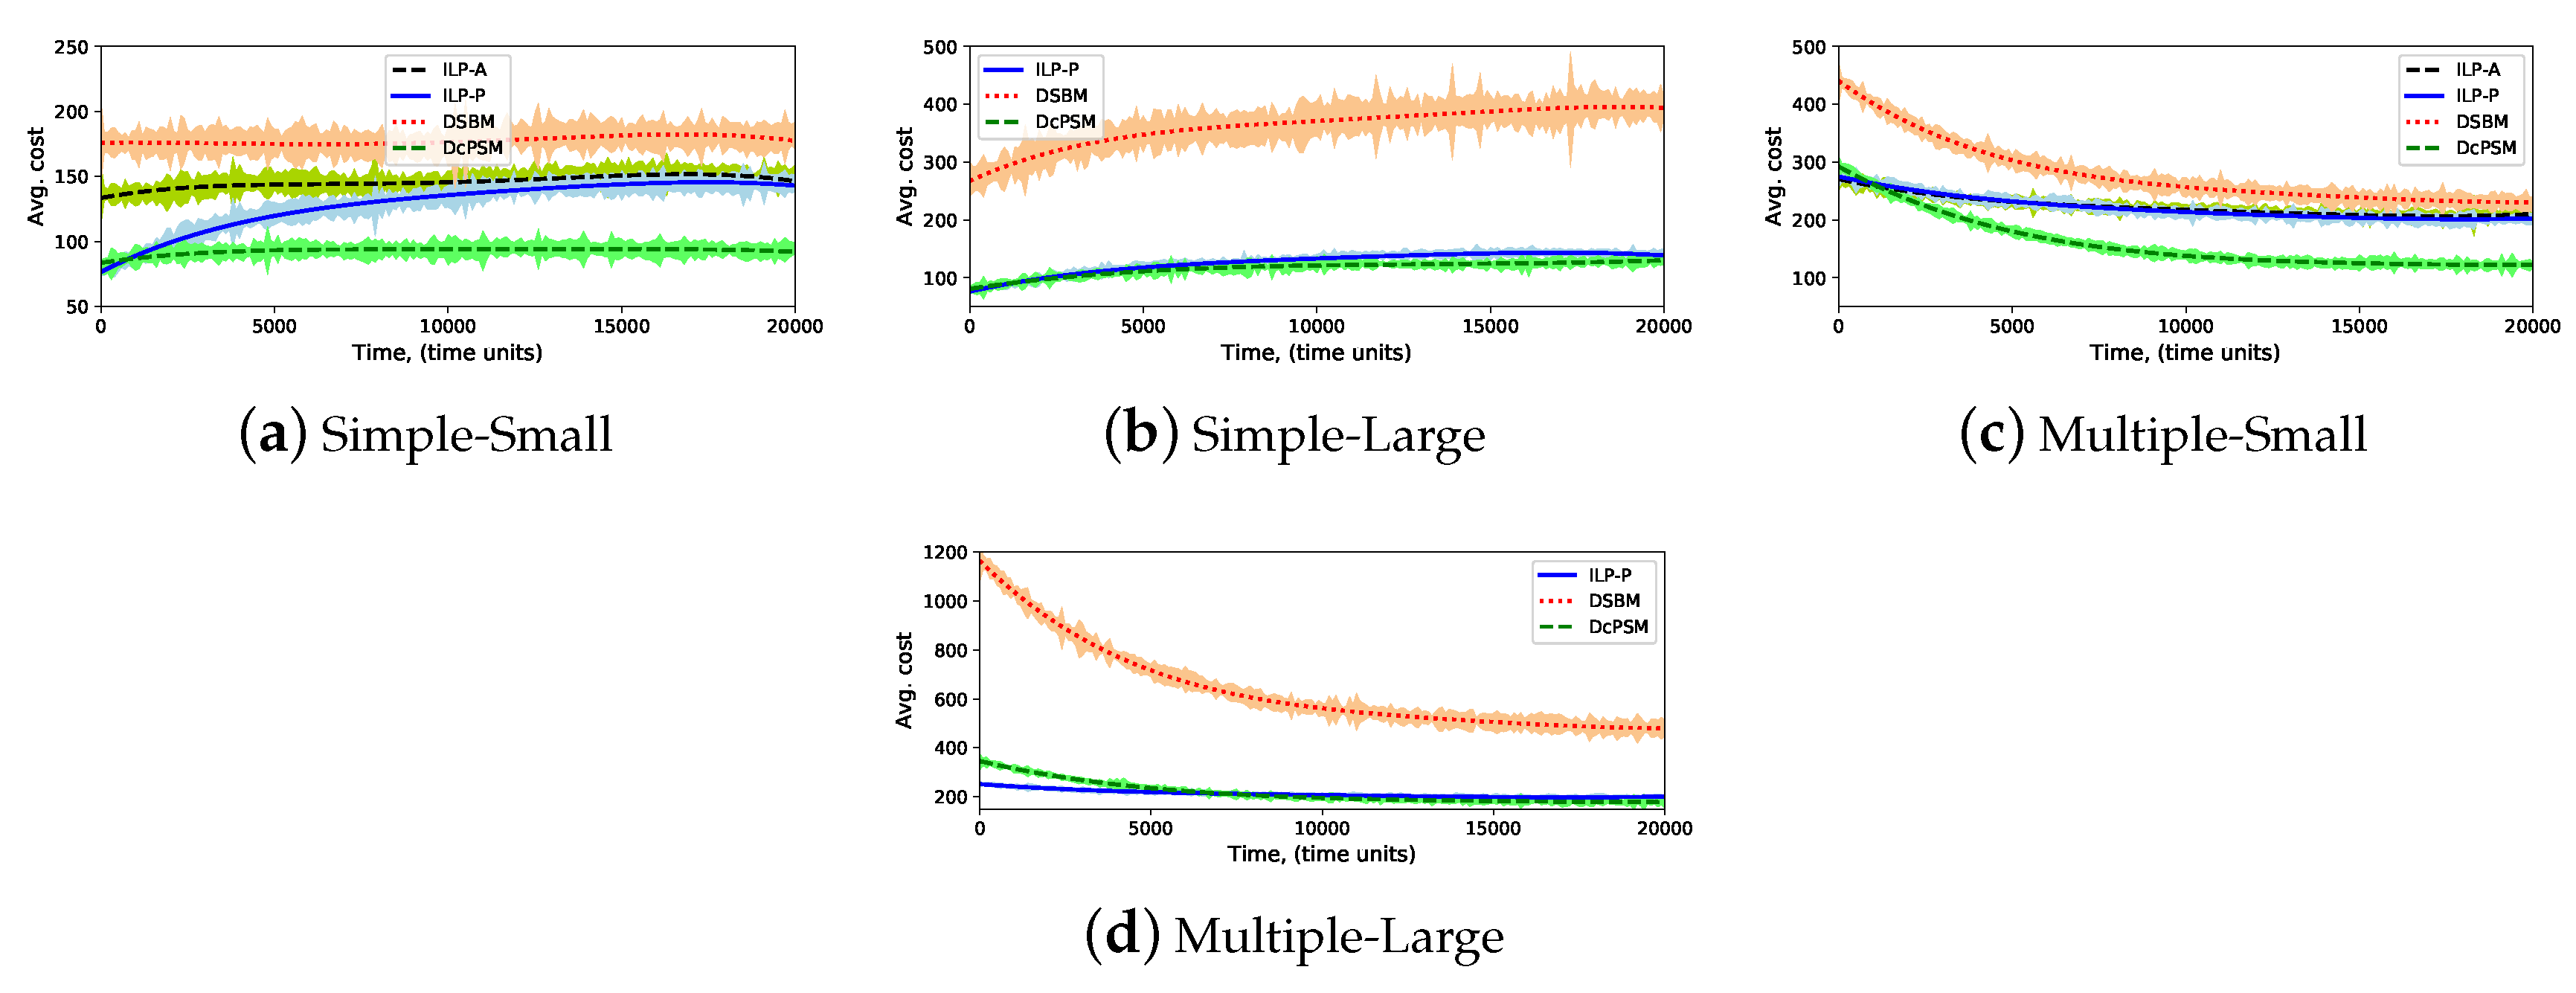
- Embedding cost (): it is the average of total used resources for mapping service requests over 100 time unit. It is calculated based on the objective Equation (11).
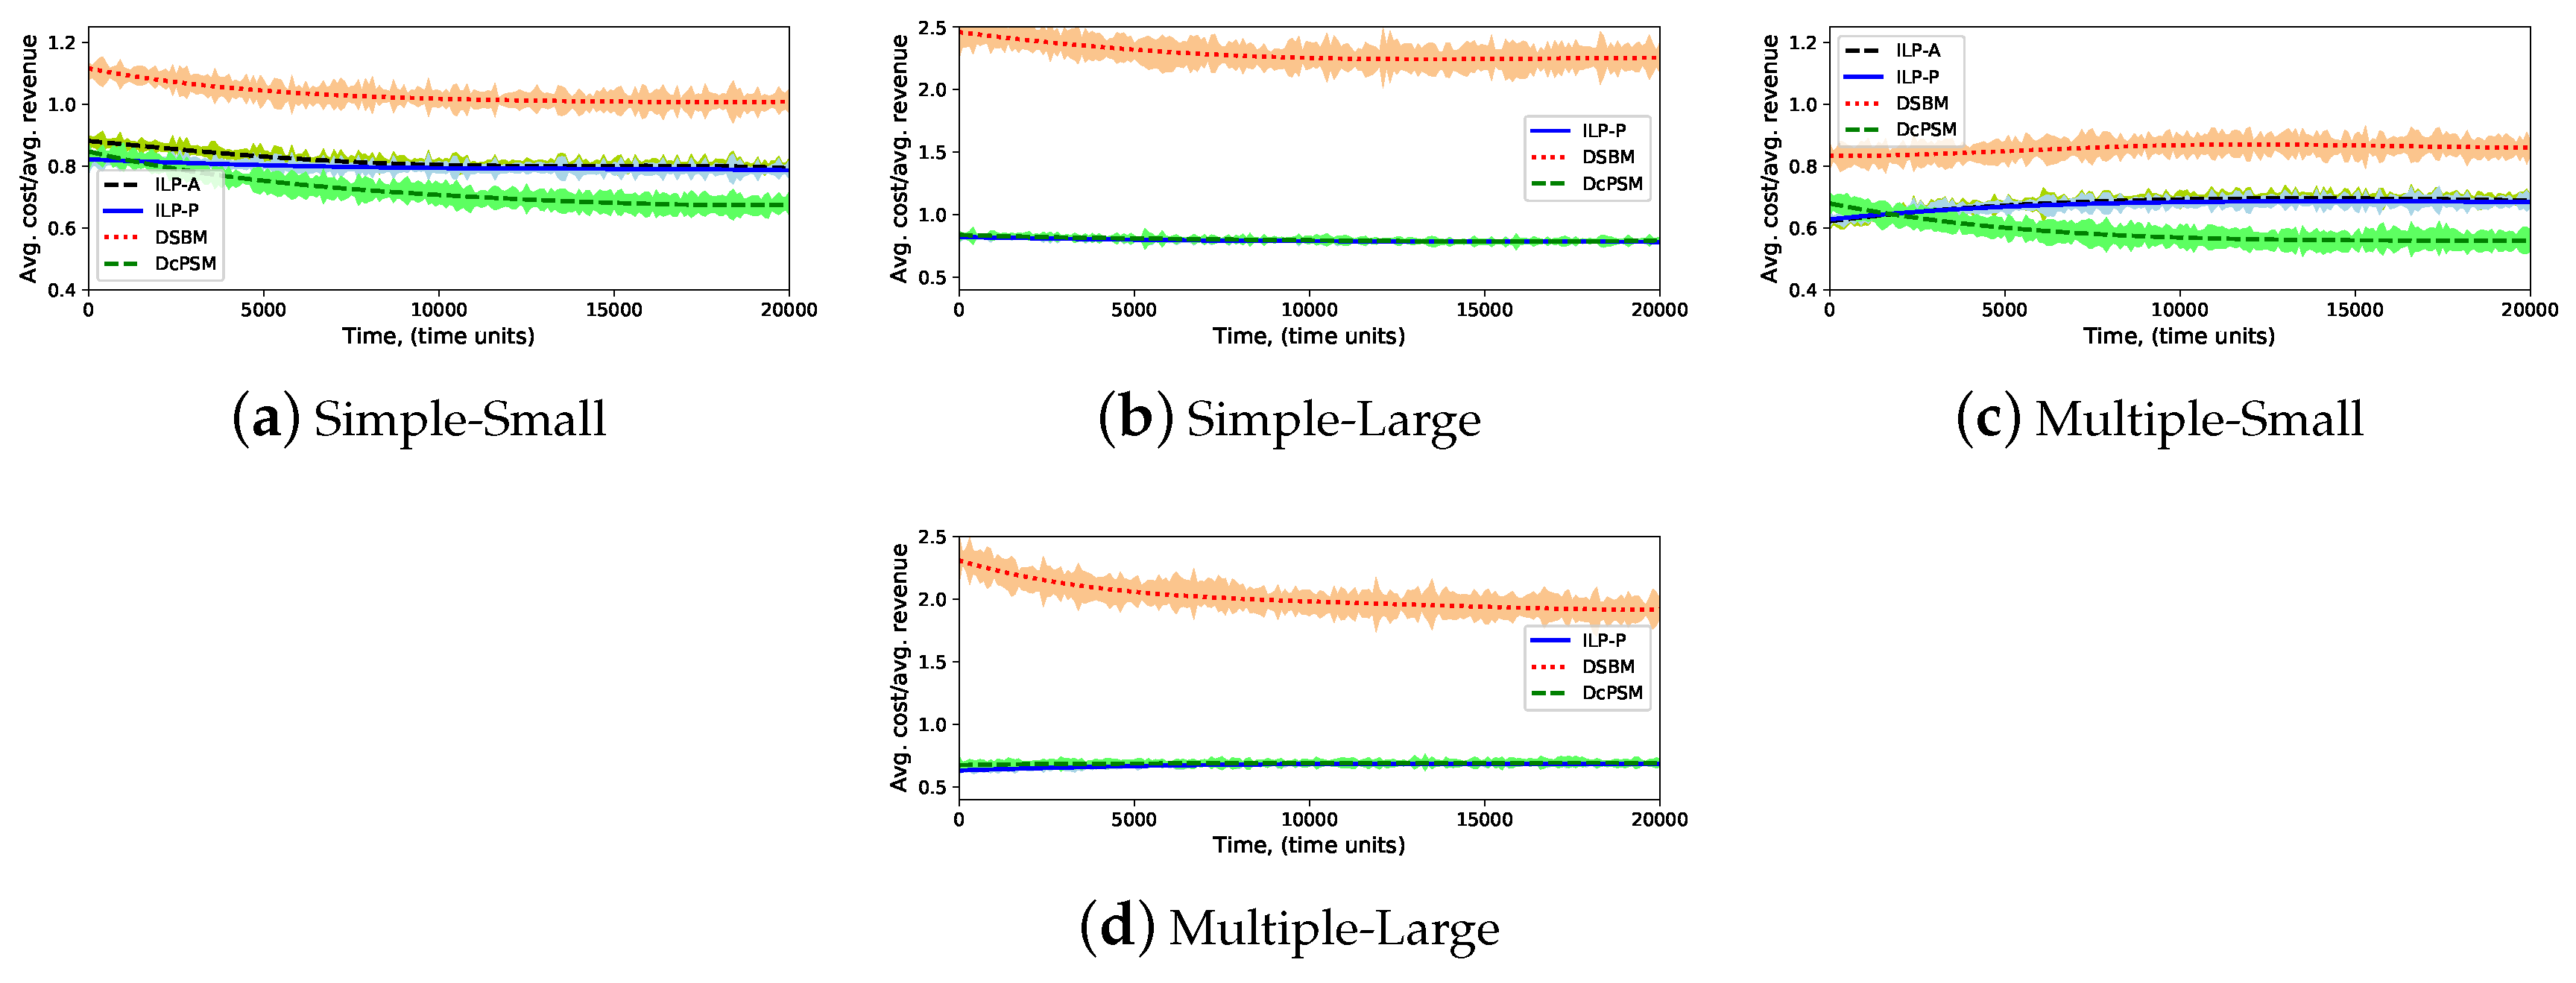
- Average embedding cost/average revenue (): it is the ratio between the average embedding cost and the average revenue of a service requests over 100 time units. The revenue of a service request is calculated as the product of the total resources of virtual nodes and the average physical nodes cost, plus the product of the total bandwidth of virtual links and the average cost of physical links.
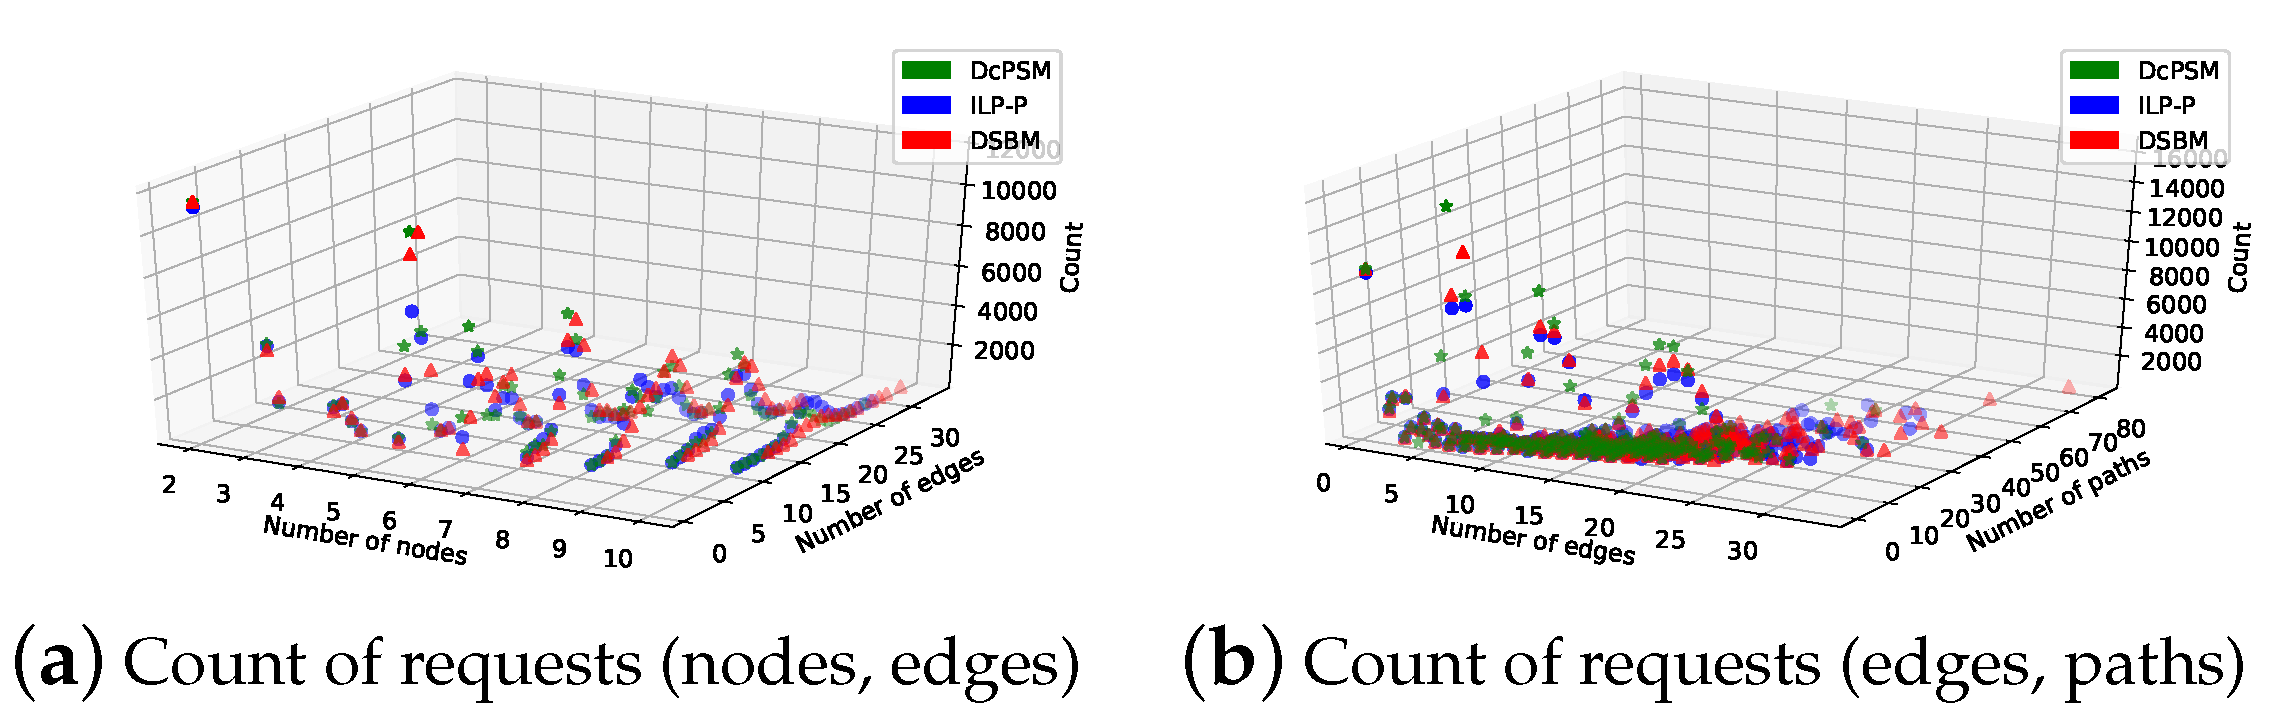
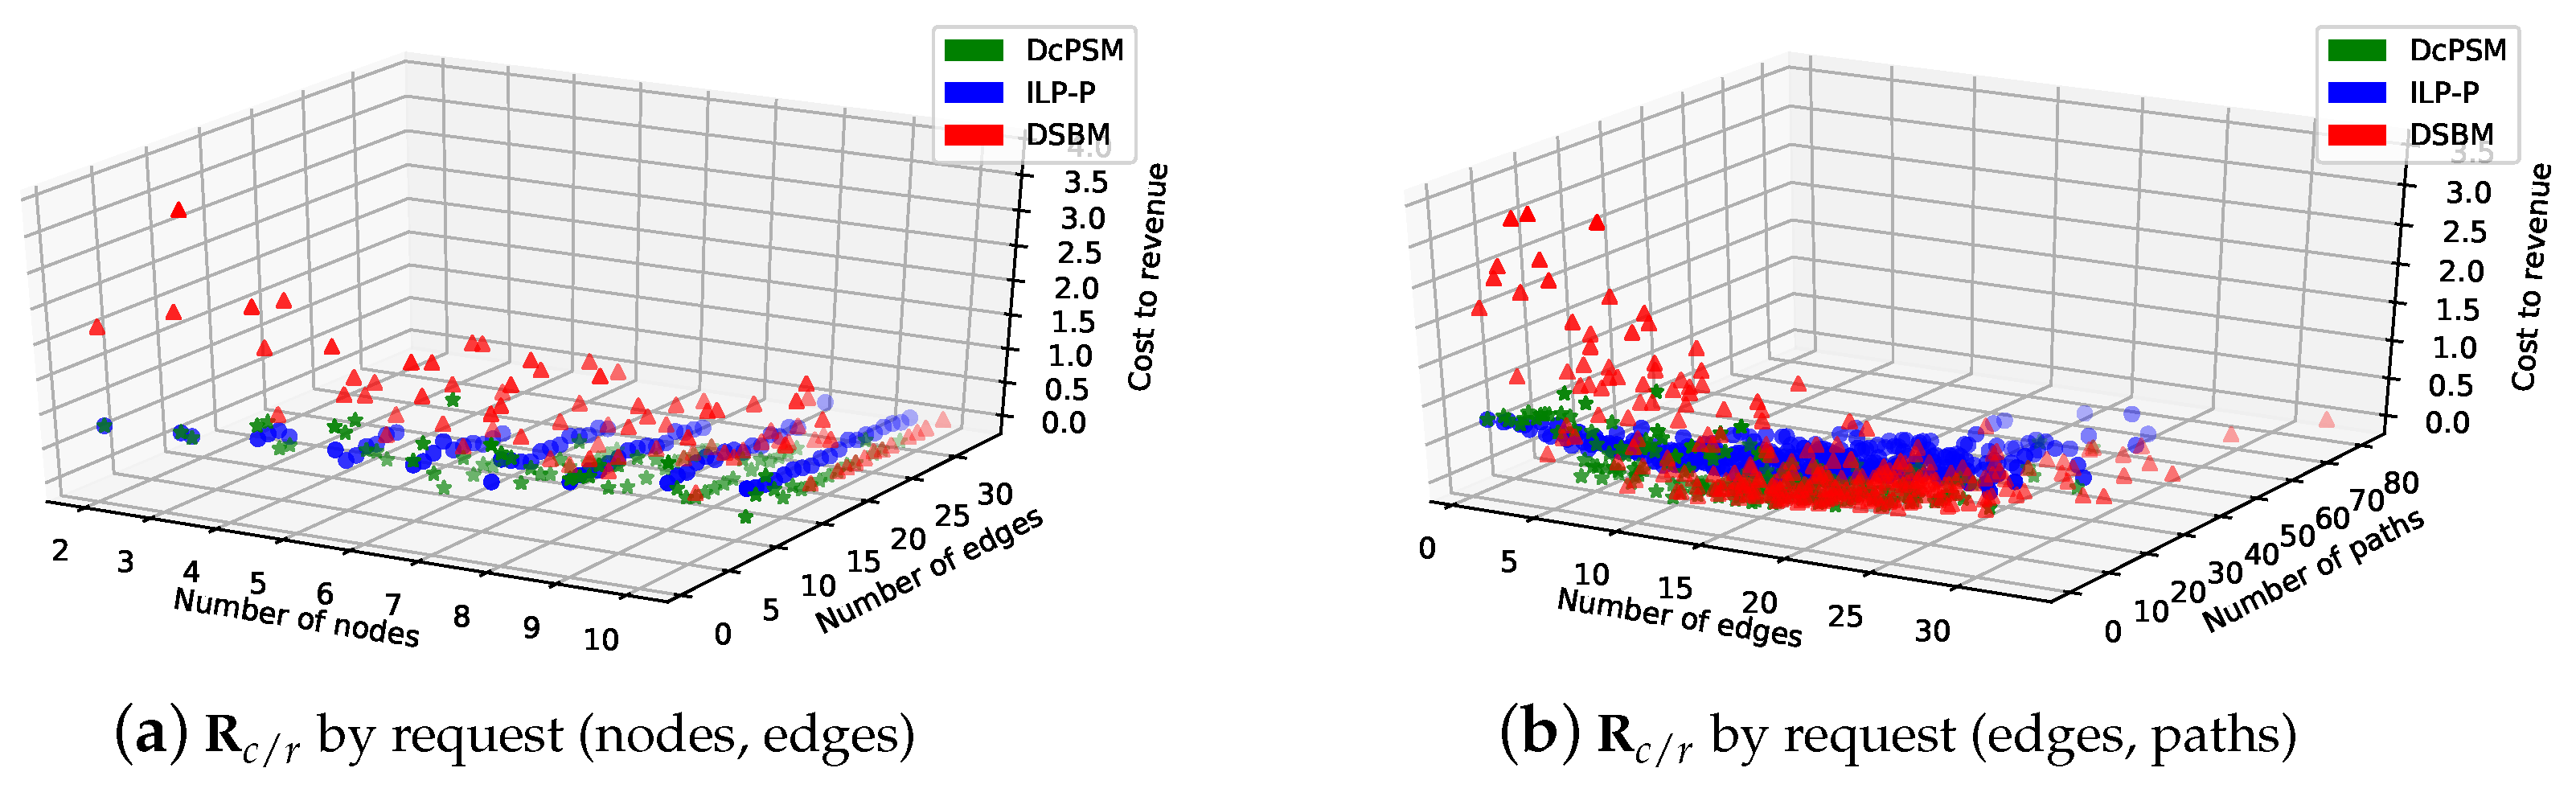
Distribution of Mapped Service Requests
5.3. Results
5.3.1. Execution Time
5.3.2. Acceptance Ratio
5.3.3. Embedding Cost
5.3.4. Ratio of Average Cost to Average Revenue
5.3.5. The Impact of Decomposition Selection Cost Parameters
6. Conclusions and Future work
Author Contributions
Funding
Acknowledgments
Conflicts of Interest
References
- ETSI. 5G. Available online: https://www.etsi.org/technologies/5g (accessed on 1 August 2019).
- Nguyen, V.G.; Brunstrom, A.; Grinnemo, K.J.; Taheri, J. SDN/NFV-Based Mobile Packet Core Network Architectures: A Survey. IEEE Commun. Surv. Tutor. 2017, 19, 1567–1602. [Google Scholar] [CrossRef]
- ETSI. Network Functions Virtualisation. 2012. Available online: https://www.etsi.org/technologies/nfv (accessed on 1 August 2019).
- Akyildiz, I.F.; Nie, S.; Lin, S.C.; Chandrasekaran, M. 5G roadmap: 10 key enabling technologies. Comput. Netw. 2016, 106, 17–48. [Google Scholar] [CrossRef]
- Mijumbi, R.; Serrat, J.; Gorricho, J.L.; Bouten, N.; Turck, F.D.; Boutaba, R. Network Function Virtualization: State-of-the-Art and Research Challenges. IEEE Commun. Surv. Tutor. 2016, 18, 236–262. [Google Scholar] [CrossRef]
- Kreutz, D.; Ramos, F.M.V.; Veríssimo, P.E.; Rothenberg, C.E.; Azodolmolky, S.; Uhlig, S. Software-Defined Networking: A Comprehensive Survey. Proc. IEEE 2015, 103, 14–76. [Google Scholar] [CrossRef]
- Schmitt, P.; Landais, B.; Yang, F.Y. Control and User Plane Separation of EPC nodes (CUPS); Technical Report; 3rd Generation Partnership Project (3GPP): Valbonne, France, 2017. [Google Scholar]
- Sama, M.R.; An, X.; Wei, Q.; Beker, S. Reshaping the Mobile core network via function decomposition and network slicing for the 5G era. In Proceedings of the 2016 IEEE Wireless Communications and Networking Conference Workshops (WCNCW), Doha, Qatar, 3–6 April 2016; pp. 90–96. [Google Scholar]
- Taleb, T.; Corici, M.; Parada, C.; Jamakovic, A.; Ruffino, S.; Karagiannis, G.; Magedanz, T. EASE: EPC as a service to ease mobile core network deployment over cloud. IEEE Netw. 2015, 29, 78–88. [Google Scholar] [CrossRef]
- Droste, H.; Rost, P.; Doll, M.; Berberana, I.; Mannweiler, C.; Breitbach, M.; Banchs, A.; Puente, M.A. An adaptive 5G multiservice and multitenant radio access network architecture. Trans. Emerg. Telecommun. Technol. 2016, 27, 1262–1270. [Google Scholar] [CrossRef]
- Sahhaf, S.; Tavernier, W.; Rost, M.; Schmid, S.; Colle, D.; Pickavet, M.; Demeester, P. Network Service Chaining with Optimized Network Function Embedding Supporting Service Decompositions. Comput. Netw. 2015, 93 Pt 3, 492–505. [Google Scholar] [CrossRef]
- Yi, B.; Wang, X.; Huang, M. Design and evaluation of schemes for provisioning service function chain with function scalability. J. Netw. Comput. Appl. 2017, 93, 197–214. [Google Scholar] [CrossRef]
- Ochoa-Aday, L.; Cervelló-Pastor, C.; Fernández-Fernández, A.; Grosso, P. An Online Algorithm for Dynamic NFV Placement in Cloud-Based Autonomous Response Networks. Symmetry 2018, 10, 163. [Google Scholar] [CrossRef]
- Sun, J.; Huang, G.; Sun, G.; Yu, H.; Sangaiah, A.K.; Chang, V. A Q-Learning-Based Approach for Deploying Dynamic Service Function Chains. Symmetry 2018, 10, 646. [Google Scholar] [CrossRef]
- Mijumbi, R.; Serrat, J.; Gorricho, J.L.; Latre, S.; Charalambides, M.; Lopez, D. Management and orchestration challenges in network functions virtualization. IEEE Commun. Mag. 2016, 54, 98–105. [Google Scholar] [CrossRef]
- Herrera, J.G.; Botero, J.F. Resource Allocation in NFV: A Comprehensive Survey. IEEE Trans. Netw. Serv. Manag. 2016, 518–532. [Google Scholar] [CrossRef]
- Halpern, J.; Pignataro, C. Service Function Chaining (SFC) Architecture; draft-merged-sfc-architecture-00; Internet-Draft; Internet Engineering Task Force (IETF): Fremont, CA, USA, 2014. [Google Scholar]
- ETSI NFV ISG. GS NFV 001 V1.1.1 Network Functions Virtualisation (NFV); Use Cases; Technical Report; European Telecommunication Standards Institute: Valbonne, France, 2013. [Google Scholar]
- Nabi, M.; Toeroe, M.; Khendek, F. Availability in the cloud: State of the art. J. Netw. Comput. Appl. 2016, 60, 54–67. [Google Scholar] [CrossRef]
- Colman-Meixner, C.; Develder, C.; Tornatore, M.; Mukherjee, B. A Survey on Resiliency Techniques in Cloud Computing Infrastructures and Applications. IEEE Commun. Surv. Tutor. 2016, 18, 2244–2281. [Google Scholar] [CrossRef]
- ETSI NFV ISG. GS NFV-REL 003 V1.1.2 Network Functions Virtualisation (NFV); Reliability; Report on Models and Features for End-to-End Reliability Disclaimer; Technical Report; European Telecommunication Standards Institute: Valbonne, France, 2016. [Google Scholar]
- ETSI NFV ISG. GS NFV-REL 001 V1.1.1 Network Functions Virtualisation (NFV); Resiliency Requirements; Technical Report; European Telecommunication Standards Institute: Valbonne, France, 2015. [Google Scholar]
- Amaldi, E.; Coniglio, S.; Koster, A.M.; Tieves, M. On the Computational Complexity of the Virtual Network Embedding Problem. Electron. Notes Discret. Math. 2016, 52, 213–220. [Google Scholar] [CrossRef]
- Khan, A.; An, X.; Iwashina, S. Virtual Network Embedding for Telco-Grade Network Protection and Service Availability. Comput. Commun. 2016, 84, 25–38. [Google Scholar] [CrossRef]
- Pires, F.L.; Barán, B. A Virtual Machine Placement Taxonomy. In Proceedings of the 2015 15th IEEE/ACM International Symposium on Cluster, Cloud and Grid Computing (CCGrid), Shenzhen, China, 4–7 May 2015; pp. 159–168. [Google Scholar]
- Fischer, A.; Botero, J.F.; Beck, M.T.; de Meer, H.; Hesselbach, X. Virtual Network Embedding: A Survey. IEEE Commun. Surv. Tutor. 2013, 15, 1888–1906. [Google Scholar] [CrossRef]
- Nonde, L.; Elgorashi, T.E.H.; Elmirgahni, J.M.H. Virtual Network Embedding Employing Renewable Energy Sources. In Proceedings of the 2016 IEEE Global Communications Conference (GLOBECOM), Washington, DC, USA, 4–8 December 2016. [Google Scholar]
- Truong-Huu, T.; Gurusamy, M. Markov Chain Based Algorithm for Virtual Network Embedding in Optical Data Centers. In Proceedings of the 2016 IEEE 18th International Conference on High Performance Computing and Communications; IEEE 14th International Conference on Smart City; IEEE 2nd International Conference on Data Science and Systems (HPCC/SmartCity/DSS), Sydney, Australia, 12–14 December 2016; pp. 899–906. [Google Scholar]
- Li, Y.; Li, Y.; Shu, M.; Tang, J.; Peng, Y. An Efficient VNE Algorithm via Preferentially Mapping Important Nodes. In Proceedings of the 2016 IEEE 41st Conference on Local Computer Networks Workshops (LCN Workshops), Dubai, UAE, 7–10 November 2016; pp. 34–41. [Google Scholar]
- Haeri, S.; Trajković, L. Virtual Network Embedding via Monte Carlo Tree Search. IEEE Trans. Cybern. 2017. [Google Scholar] [CrossRef]
- Fajjari, I.; Aitsaadi, N.; Dab, B.; Pujolle, G. Novel adaptive virtual network embedding algorithm for Cloud’s private backbone network. Comput. Commun. 2016, 84, 12–24. [Google Scholar] [CrossRef]
- Moens, H.; Turck, F.D. VNF-P: A model for efficient placement of virtualized network functions. In Proceedings of the 10th International Conference on Network and Service Management (CNSM) and Workshop, Rio de Janeiro, Brazil, 17–21 November 2014; pp. 418–423. [Google Scholar]
- Mijumbi, R.; Serrat, J.; Gorricho, J.L.; Bouten, N.; Turck, F.D.; Davy, S. Design and evaluation of algorithms for mapping and scheduling of virtual network functions. In Proceedings of the 2015 1st IEEE Conference on Network Softwarization (NetSoft), London, UK, 13–17 April 2015; pp. 1–9. [Google Scholar]
- Qu, L.; Assi, C.; Shaban, K. Network function virtualization scheduling with transmission delay optimization. In Proceedings of the NOMS 2016—2016 IEEE/IFIP Network Operations and Management Symposium, Istanbul, Turkey, 25–29 April 2016; pp. 638–644. [Google Scholar]
- Qu, L.; Assi, C.; Shaban, K. Delay-Aware Scheduling and Resource Optimization with Network Function Virtualization. IEEE Trans. Commun. 2016. [Google Scholar] [CrossRef]
- Riggio, R.; Bradai, A.; Harutyunyan, D.; Rasheed, T.; Ahmed, T. Scheduling Wireless Virtual Networks Functions. IEEE Trans. Netw. Serv. Manag. 2016, 13, 240–252. [Google Scholar] [CrossRef]
- Bari, F.; Chowdhury, S.R.; Ahmed, R.; Boutaba, R.; Duarte, O.C.M.B. Orchestrating Virtualized Network Functions. IEEE Trans. Netw. Serv. Manag. 2016, 13, 725–739. [Google Scholar] [CrossRef]
- Taleb, T.; Bagaa, M.; Ksentini, A. User Mobility-Aware Virtual Network Function placement for Virtual 5G Network Infrastructure. In Proceedings of the 2015 IEEE International Conference on Communications (ICC), London, UK, 8–12 June 2015; pp. 3879–3884. [Google Scholar]
- ETSI NFV ISG. GS NFV-MAN 001 V1.1.1 Network Functions Virtualisation (NFV); Management and Orchestration; Technical Report; European Telecommunications Standards Institute: Valbonne, France, 2014. [Google Scholar]
- Mehraghdam, S.; Karl, H. Placement of services with flexible structures specified by a YANG data model. In Proceedings of the 2016 IEEE NetSoft Conference and Workshops (NetSoft), Seoul, Korea, 6–10 June 2016; pp. 184–192. [Google Scholar]
- Bouten, N.; Claeys, M.; Mijumbi, R.; Famaey, J.; Latré, S.; Serrat, J. Semantic validation of affinity constrained service function chain requests. In Proceedings of the 2016 IEEE NetSoft Conference and Workshops (NetSoft), Seoul, Korea, 6–10 June 2016; pp. 202–210. [Google Scholar]
- Eramo, V.; Miucci, E.; Ammar, M.; Lavacca, F.G. An Approach for Service Function Chain Routing and Virtual Function Network Instance Migration in Network Function Virtualization Architectures. IEEE/ACM Trans. Netw. 2017, 25, 2008–2025. [Google Scholar] [CrossRef]
- Scheid, E.J.; Machado, C.C.; dos Santos, R.L.; Schaeffer-Filho, A.E.; Granville, L.Z. Policy-based dynamic service chaining in Network Functions Virtualization. In Proceedings of the 2016 IEEE Symposium on Computers and Communication (ISCC), Messina, Italy, 27–30 June 2016; pp. 340–345. [Google Scholar]
- Wen, T.; Yu, H.; Sun, G.; Liu, L. Network function consolidation in service function chaining orchestration. In Proceedings of the 2016 IEEE International Conference on Communications (ICC), Kuala Lumpur, Malaysia, 22–27 May 2016; pp. 1–6. [Google Scholar]
- Lin, T.; Zhou, Z.; Tornatore, M.; Mukherjee, B. Demand-Aware Network Function Placement. J. Light. Technol. 2016, 34, 2590–2600. [Google Scholar] [CrossRef]
- Pham, C.; Tran, N.H.; Ren, S.; Saad, W.; Hong, C.S. Traffic-aware and Energy-efficient vNF Placement for Service Chaining: Joint Sampling and Matching Approach. IEEE Trans. Serv. Comput. 2017. [Google Scholar] [CrossRef]
- Wang, L.; Lu, Z.; Wen, X.; Knopp, R.; Gupta, R. Joint Optimization of Service Function Chaining and Resource Allocation in Network Function Virtualization. IEEE Access 2016, 4, 8084–8094. [Google Scholar] [CrossRef]
- Moens, H.; Turck, F.D. Customizable Function Chains: Managing Service Chain Variability in Hybrid NFV Networks. IEEE Trans. Netw. Serv. Manag. 2016, 13, 711–724. [Google Scholar] [CrossRef]
- Khan, M.M.A.; Shahriar, N.; Ahmed, R.; Boutaba, R. Multi-Path Link Embedding for Survivability in Virtual Networks. IEEE Trans. Netw. Serv. Manag. 2016, 13, 253–266. [Google Scholar] [CrossRef]
- Mechtri, M.; Ghribi, C.; Zeghlache, D. A Scalable Algorithm for the Placement of Service Function Chains. IEEE Trans. Netw. Serv. Manag. 2016. [Google Scholar] [CrossRef]
- Beck, M.T.; Botero, J.F. Scalable and coordinated allocation of service function chains. Comput. Commun. 2017, 102, 78–88. [Google Scholar] [CrossRef]
- Internet Topology Zoo. 2010. Available online: http://www.topology-zoo.org (accessed on 1 August 2019).


| Ref# | Strategy | Scenario | Contribution |
|---|---|---|---|
| Virtual Network Embedding (VNE) | |||
| [27] | Exact | Cloud | Introduced a Green Virtual Network Embedding (GVNE) framework to minimize energy consumption. |
| [28] | Heuristic | Data center | Proposed Markov Chain-based Algorithm for VNE (MCA-VNE) to minimizerequest rejection and maximize revenues. |
| [29] | Heuristic | Cloud | Proposed SR-VNE algorithm to maximize revenue and acceptance in long term. |
| [30] | Heuristic | Service provider network | Proposed MaVEn-M and MaVEn-S algorithms using the multi-commodity flow and Markov decision processes to maximize revenue. |
| [31] | heuristic | Cloud | proposed Adaptive-VNE algorithm to maximize revenue, acceptance, and end-user satisfaction. |
| Virtual Network Function Placement (VNF-P) | |||
| [33] | Heuristic, Metaheuristic | Operator network | Proposed three greedy and a tabu search-based algorithms for VNF embedding and process scheduling to maximize revenue. |
| [34,35] | Exact, Metaheuristic | Operator network | Formulated VNFs chaining scheduling as problem as a series of scheduling decisions for services to minimize scheduling latency. |
| [36] | Exact, Heuristic | Mobile network | Proposed a proof of concept that NFV management can be extended to the radio segment of mobile network. |
| [37] | Exact, Heuristic | Operator network | Proposed an ILP formulation for VNF orchestration problem and a dynamic programming heuristic to minimize the operational cost and physical resource fragmentation. |
| [38] | Heuristic | Operator cloud | Proposed a placement algorithms with two objectives and used bargaining Nash theory to find a fair trade-off between them to minimize end-to-end path and user’s mobility. |
| Service Function Chaining Placement Problem (SFC-PP) | |||
| [24] | Heuristic | Operator network | Proposed a primary backup redundant scheme mapping to maximize the service continuity. |
| [11] | Exact, Heuristic | Service provider network | Proposed NF decomposition selection based on VNF clustering using virtualization technique type to minimize mapping cost. |
| [12] | Exact, Heuristic | Operator network | Proposed a SFC placement with function scalability to realize the dynamic operations on NFV. |
| [42] | Heuristic | Operator network | Proposed a consolidation algorithm based on migration policy to reduce the cost of QoS degradation during VNF migration. |
| [43] | Heuristic | NFV network | Presented an automatic policy-based approach to solve service chain composition on NFV ot reduce operational cost. |
| [44] | Exact, Heuristic | Operator network | Proposed a NF Consolidation on NFV to minimize resource occupation by reducing the number of VNF. |
| [45] | Exact, Heuristic | Optical network | Proposed placement algorithm based on game theory to minimize mapping cost. |
| [46] | Heuristic | Data center | Optimized VNF placement and service chaining using a Markov approximation with many-to-one matching theory in coordinated approach to minimize the cost. |
| [47] | Exact, Heuristic | NFVI | Proposed a coordinated approach to jointly optimize NFV-RA in the three stages of the problem. |
| [48] | Exact | Hybrid network | Proposed a customizable SFC composition to minimize the mapping and the management cost. |
| [49] | Exact, Heuristic | Service provider network | Proposed a survivability for SFC with multi-path link mapping in order to maximize survivability and minimize resource redundancy |
| [50] | Heuristic | Cloud | Proposed an eigen-decomposition based approach to maximize revenues. |
| [51] | Heuristic | NFV network | Proposed a coordinated placement algorithm that solves service chain composition and embedding with reasonable execution time in large-scale physical networks. |
| Notation | Description |
|---|---|
| ILP-A | ILP-based scheme of the benchmark. |
| DSBM | Heuristic scheme of the benchmark. |
| ILP-P | Proposed optimal implementation of path mapping, which is ILP-based scheme. |
| DcPSM | Proposed heuristic implementation of path mapping approach. |
| Topology | Nodes | Links | |
|---|---|---|---|
| BT Europe | 24 | 37 | |
| Interout | 110 | 148 | |
| BT | 24 | 65 | |
| Int | 110 | 180 | |
| Topology | Nodes | ||
| Synthetic | 10 | 14 | 21 |
| 30 | 50 | 64 | |
| 60 | 98 | 133 | |
| 90 | 156 | 198 | |
| 120 | 227 | 265 | |
| 150 | 265 | 333 |
| Run | Scenario | Request Type | Topology |
|---|---|---|---|
| Long | Simple-Small | Simple/Forking | BT Europe |
| Multiple-Small | Multiple | BT Europe | |
| Simple-Large | Simple/Forking | Interout | |
| Multiple-Large | Multiple | Interout | |
| , , | , , | BT Europe | |
| , , | , , | BT | |
| , , | , , | Interout | |
| , , | , , | Int | |
| Short | , | Synthetic | |
| , | Synthetic | ||
| , | Synthetic |
| Scheme | Total Number of Solved Requests | ||
|---|---|---|---|
| DcPSM | 128,528 | 47.46% | 0.3629 |
| DSBM | 128,528 | 56.21% | 1.0775 |
| ILP-A | 59,639 | 100% | 0.5461 |
| ILP-P | 122,417 | 100% | 0.5299 |
© 2019 by the authors. Licensee MDPI, Basel, Switzerland. This article is an open access article distributed under the terms and conditions of the Creative Commons Attribution (CC BY) license (http://creativecommons.org/licenses/by/4.0/).
Share and Cite
Raddwan, B.; AL-Wagih, K.; Al-Baltah, I.A.; Alrshah, M.A.; Al-Maqri, M.A. Path Mapping Approach for Network Function Virtualization Resource Allocation with Network Function Decomposition Support. Symmetry 2019, 11, 1173. https://doi.org/10.3390/sym11091173
Raddwan B, AL-Wagih K, Al-Baltah IA, Alrshah MA, Al-Maqri MA. Path Mapping Approach for Network Function Virtualization Resource Allocation with Network Function Decomposition Support. Symmetry. 2019; 11(9):1173. https://doi.org/10.3390/sym11091173
Chicago/Turabian StyleRaddwan, Basheer, Khalil AL-Wagih, Ibrahim A. Al-Baltah, Mohamed A. Alrshah, and Mohammed A. Al-Maqri. 2019. "Path Mapping Approach for Network Function Virtualization Resource Allocation with Network Function Decomposition Support" Symmetry 11, no. 9: 1173. https://doi.org/10.3390/sym11091173
APA StyleRaddwan, B., AL-Wagih, K., Al-Baltah, I. A., Alrshah, M. A., & Al-Maqri, M. A. (2019). Path Mapping Approach for Network Function Virtualization Resource Allocation with Network Function Decomposition Support. Symmetry, 11(9), 1173. https://doi.org/10.3390/sym11091173