Article

Path Mapping Approach for Network Function Virtualization Resource Allocation with Network Function Decomposition Support

by
Basheer Raddwan
1,
Khalil AL-Wagih
2,
Ibrahim A. Al-Baltah
3,
Mohamed A. Alrshah
4,* and
Mohammed A. Al-Maqri
5
1
Faculty of Engineering & Information Technology, University of Modern Sciences, 85RC+6V Sana’a, Yemen
2
Faculty of Computer science & Information System, Thamar University, H9HG+H5 Thamar, Yemen
3
Department of Information Technology, Faculty of Computer Science & IT, Sana’a University, 85XR+C5 Sana’a, Yemen
4
Department Communication Technology & Network, Faculty of Computer Science & IT, Universiti Putra Malaysia, Serdang 43400, Malaysia
5
Department of Information Technology, Faculty of Engineering & Information Technology, Azal University for Human Development, 954F+PW Sana’a, Yemen
*
Author to whom correspondence should be addressed.
Symmetry 2019, 11(9), 1173; https://doi.org/10.3390/sym11091173
Submission received: 11 July 2019 / Revised: 5 August 2019 / Accepted: 7 August 2019 / Published: 16 September 2019

Abstract

:
Recently, Network Function Virtualization (NFV) and Software Defined Networking (SDN) have attracted many mobile operators. For the flexible deployment of Network Functions (NFs) in an NFV environment, NF decompositions and control/user plane separation have been introduced in the literature. That is to map traditional functions into their corresponding Virtual Network Functions (VNFs). This mapping requires the NFV Resource Allocation (NFV-RA) for multi-path service graphs with a high number of virtual nodes and links, which is a complex NP-hard problem that inherited its complexity from the Virtual Network Embedding (VNE). This paper proposes a new path mapping approach to solving the NFV-RA problem for decomposed Network Service Chains (NSCs). The proposed solution has symmetrically considered optimizing an average embedding cost with an enhancement on average execution time. The proposed approach has been compared to two other existing schemes using 6 and 16 scenarios of short and long simulation runs, respectively. The impact of the number of nodes, links and paths of the service requests on the proposed scheme has been studied by solving more than 122,000 service requests. The proposed Integer Linear Programming (ILP) and heuristic schemes have reduced the execution time up to 39.58% and 6.42% compared to existing ILP and heuristic schemes, respectively. Moreover, the proposed schemes have also reduced the average embedding cost and increased the profit for the service providers.

Graphical Abstract

1. Introduction

Network Function Virtualization (NFV) and Software Defined Networking (SDN) are two important key-enablers for future mobile core network infrastructure that is commercially known as the Fifth Generation (5G) [1,2]. In 2012, the European Telecommunication Standards Institute (ETSI) has been selected by seven leading telecom network operators to be the home of Industry Specification Group (ISG) for NFV [3]. Thereafter, NFV has attracted many mobile operators and vendors due to its promising advantages such as flexible management, agile development of new services with faster time-to-market, potential cut down in Capital Expense (CAPEX) and Operational Expense (OpEx) [4,5]. In the context of this new paradigm, Network Functions (NFs) were decoupled from their traditional physical equipment in order to implement them in general purpose high-volume servers. That decoupling has enforced a new re-implementation of NFs into their Virtual Network Functions (VNFs).
In general, two methods were proposed in the literature for mapping traditional NFs into their VNFs. The first is decoupling of control plane from user plane which was introduced in SDN [6]. The 3rd Generation Partnership Project (3GPP) has proposed a functional separation of control plane from user plane for the re-implementation of the Evolved Packet Core (EPC) [7]. The second proposed method was mapping traditional NFs to a pool like sub-functions, which were called NF decompositions [8]. Authors of [9] claimed that EPC components as one to many VNFs would enhance scalability, flexibility and load balancing. The work in Reference [10] introduced a future-proof 5G mobile network architecture, which uses the function decomposition to locate mobile NFs based on the end-user requirements and infrastructure capabilities. They suggested a geographical perspective to locate control plane in the central office while user plane can be located in the edge near to the user equipment.
The distributed characteristic of a mobile network usually increases the deployment and operational costs, especially for transmission. Function decomposition might generate large number of links between NF sub-functions as shown in Figure 1. In the literature, in works such as References [11,12,13,14], only simple and forking paths were tested for developed algorithms. We believe that this paper presents the first effort to test the proposed algorithms on large multi-path services. Testing placement algorithms in a high number of physical nodes and a high number of virtual links is important for evaluating the possibility of using the algorithm for mobile NFVI networks, which is required to minimize costs and execution time.
However, the authors of Reference [15] claimed that the function placement on NFV Infrastructure (NFVI) is still a research opportunity, and the success of NFV is due to the fact that the full automation of NFV Management and Orchestration (MANO) during VNF life-cycle operations and fault management depends on developing rapid placement algorithms. The work in Reference [16] surveyed the placement on NFV as NFV Resource Allocation (NFV-RA) problem and the similarities and differences to/from Virtual Network Embedding (VNE) problem and Virtual Network Function problem (VNF-P). Unlike the VNE and/or VNF-P, the NVF-RA considers the placement of end-to-end Service Function Chains (SFCs) of the VNFs that works together to provide a service. The Service Function (SF) was defined in Reference [17] as a function that is responsible for the specific treatment of received packets where the service function can work at any layer of the OSI layers while the network functions are related to the network layer. Also, the network service was defined as a service function that is provided by a network operator. In this paper, the term Network Service (NS) is used as the same meaning of SFC to describe the mobile core network services, as one of the ETSI NFV use cases [18].
As known, the placement algorithms are used in high-availability mechanisms [19] and in the resiliency techniques of cloud computing [20]. This approach is also considered in NFV where placement algorithms were suggested within the proposed methods of by ETSI NFV reliability and availability group [21] in order to fulfill the NFV resiliency requirements [22]. Despite the fact that the VNE problem was proved to be strong NP-hard even with special cases that obtained by fixing one of the problem’s dimensions to one [23]. However, realizing the one-to-many mapping of traditional core mobile network function into a VNF Forwarding Graph (VNF-FG) is expected to increase the complexity of solving the VNF-FG embedding (VNF-FGE) stage of NFV-RA problem. Additionally, the authors of Reference [24] claimed that embedding primary-backup redundant scheme protection for the service requests would result in mapping the backup links to long physical paths. Therefore, it is important to develop placement algorithms that have a short response time (within milliseconds) to meet carrier-grade requirements regardless of the physical network size or the service request size.
The contribution: The goal of this study is to develop a new placement algorithm that can meet a rapid response time to avoid high embedding cost, which might occur due to mapping multiple paths of service requests to long physical paths. Thus, we propose a path mapping approach, which uses path identification to reduce the number of candidate physical nodes and links. The proposed path identification can be realized in the NFV repository while it can also consider the use of different virtualization techniques to enhance the resiliency. To realize the path mapping approach, we formulate the NFV-RA problem as an Integer Linear Programming (ILP), then, we solve it with ILP-based and heuristic schemes. These two solutions—namely ILP-P and DcPSM—are the main contribution of this work; where ILP-P is an Integer Linear Programming for Path mapping based on an exact scheme, while DcPSM is a Decomposition Path Selection Mapping based on a heuristic scheme.
Both schemes have been evaluated in small- and large-scale physical networks using a simulation. Twenty-two experimental scenarios were simulated using five types of service requests in order to evaluate the impact of multiple paths in the service request on the execution time and embedding cost. Furthermore, the proposed schemes are evaluated in short and long simulation scenarios; where the impact of service request attributes such as number of nodes, edges and paths are studied. The results of our proposed schemes were compared to the results of the work proposed in Reference [11].
The remainder of this paper is organized as follows: The related works are presented and discussed in Section 2. Then, the proposed exact scheme (ILP-P) and heuristic scheme (DcPSM) are explained in Section 3 and Section 4, respectively. As for Section 5, it demonstrates the performance evaluation process including the experiments, simulation environment, scenarios, results, and discussion. Finally, the conclusion and future works are presented in Section 6.

2. Related Works

Given that the literature of the NFV-RA problem contains hundreds of published works, we tried our best to summarize the most recent and important ideas in the literature. In general, the NFV-RA problem evolved from the Virtual Network Embedding (VNE) problem, which focuses on the placement of NFs on physical network. Then, the placement problem was studied for the chains of NFs and the scheduling of the tasks on virtual networks, which was known as Virtual Network Function Problem (VNF-P). After that, the placement of service function chains was studied in three stages, namely the composition stage (VNF-FG), embedding stage (VNF-FGE) and scheduling stage (VNF-SCH) [16]. The NFV-RA inherited the embedding stage from the VNE and the scheduling from the VNF-P while the composition of service function in their VNF Forwarding Graphs (VNF-FG) was influenced by the policy-based requirements for different parties, such as the infrastructure provider, network operator and/or tenants/users (For further details on the literature of NFV-RA, we suggest reading reference [16]). Table 1 presents a brief comparison of the most recent work.
A basic form of the placement (resource allocation) problem has been introduced in the form of embedding Virtual Machines (VM) on cloud, which has been surveyed in Reference [25]. The placement of a collection of VMs and the interconnection between them was introduced in SDNs and named a Virtual Network Embedding (VNE), as surveyed in Reference [26]. In the VM and VNE placement problems, the main target is to find the optimal location to place the VMs and the required link to steer the traffic demand between VMs of the service requests. However, the main objective of solving the VNE problem in the recent literature was to maximize the revenues. The work in Reference [27] introduced a framework for Green Virtual Network Embedding (GVNE) in order to minimize energy consumption on cloud computing. Maximizing revenues in Reference [28] was expressed in terms of minimizing the service request rejection on optical data center by a Markov chain model that computes the ranking of Top-of-the-Rack switches. The objective of maximizing revenue was also targeted in References [29,30,31], while Reference [29] proposed a sum of virtual node resources algorithm and Reference [30] proposed two algorithms based on multi-commodity flow and a Markov decision processes framework. In Reference [31], the VNE was formulated as a K-supplier optimization problem and an adaptive heuristic algorithm was proposed to solve the formulated problem.
Moreover, VNF-P was formulated in Reference [32], where the VM embedding requests were separated from the resource allocation of the service requests in order to share virtual networks between multiple tenants/users. Then, solving this VNF-P as two separated problems, the mapping of VNFs and then scheduling tasks from different service requests over the mapped VNFs, was proposed in References [33,34,35,36]. In Reference [33], the objective was to maximize the revenues, while References [34,35] aimed at minimizing the transmission latency and the scheduling delay, respectively. A proof of the concept that NFV management can be extended to the radio segment of mobile network was introduced in Reference [36], while minimizing the operational cost and physical resource fragmentation was considered in Reference [37]. The work in Reference [38] solved the VNF-P for two conflicting objectives on mobile network, to minimize end-to-end path length between evolved NodeB (eNB) and respective data anchor gateway and also to optimize users sessions’ mobility by minimizing the re-placement of mobility anchor according to users’ mobility behaviors. It is worth to mention that VNF-P was studied as a service chain on NFV with applying the ordering constraint of the chain and the possibility of mapping n VNFs on one physical node [12].
In NFV, the policy requirements were considered in the literature on the NFV-RA problem because of the Quality of Service (QoS) constraints, such as the latency, or because of the operator and/or regulatory requirements. The ETSI-MANO framework suggested to implement the policy constraints within the formulation of the descriptors of VNF-FG [39] while the authors of Reference [40] proposed YANG model to describe the service request structure for SDN/NFV networks. For regulatory or geographical redundancy reasons, the work in Reference [41] proposed an ontology modeling of physical network and service requests to solve the affinity and anti-affinity conflicts for the service requests with the placement restrictions. The placement with policy was studied for migration policy in Reference [42] and network management during run time in Reference [43]. Similar to the VNE and VNF-P, the NFV-RA was also optimized: (1) to minimize the operational cost as in References [42,43]; (2) to minimize the embedding cost as in References [44,45,46]; and (3) to minimize both as in References [47,48]. Additionally, the work in Reference [47] proposed a coordinated approach to solve the three stages of the NFV-RA problem, while the work in Reference [48] introduced a customizable function chains by selecting service chain variability at runtime.
Moreover, the placement technique was considered to enhance the service continuity as proposed in Reference [24], which maps the service chains with primary-backup redundant scheme in the telecom operator network to avoid large-scale network failures. Similarly, the work in Reference [49] exploited path diversity in the physical network to enhance the survivability of service chains with minimum redundancy by multi-path link embedding. Further, deploying the service requests with protection schemes was proved to increase the embedding cost where the case in Reference [24] was mapping longer paths. In addition, the authors of Reference [49] claimed that mapping more than 5 paths to protect one virtual node and one virtual link increases the embedding cost. In this paper we considered this issue and studied the impact of increasing the number of paths in the service request on the performance the deployed schemes.
Furthermore, the complexity of NFV-RA problem has affected the proposed strategies to solve the problem, where heuristic solutions were proposed for small and large scale physical networks while the exact (mathematical) solutions were proposed to solve the problem in small scale physical and simple service requests. For example exact solutions (such as ILP) were proposed in Reference [11] to find the optimal solutions in small-scale physical networks and simple/forking service requests while large-scale only solved in heuristic. In the exact schemes, the placement problems were formulated as ILP as in References [11,12,36,37,49] and even more, a Mixed ILP were formulated in References [27,34,35,45,47]. Mathematical based solution also used within heuristic solutions, for example, Reference [50] used matrix based method and Reference [38] used Linear Programs (LP) method in their heuristic solutions. It is worth to mention that the best average execution time for the ILP in large scale physical network (with 110 nodes) was 459.519 s as in Reference [12]. The embedding cost of the heuristic scheme was 1.25 of the optimal solution in Reference [47] in which we got a better ratio. Furthermore, the proposed path mapping approach has reduced the ratio between heuristic scheme execution time and exact scheme execution time compared to the reported ratio in Reference [37], which was from 65 to 3500.

3. The Proposed Exact Scheme

The first contribution of this work is the Integer Linear Programming for Path mapping (ILP-P). It is an exact scheme that uses end-to-end paths or path segments to identify paths, which aims at reducing the generated variables during run-time. ILP-P formally formulates the problem of network service resource allocation with service decomposition support using path identification. In this section we describe our proposed ILP-P that solves the NFV-RA problem for network services with NF decomposition support. The upcoming subsections present a mathematical model for the physical network, service request and path identification, and then present the formulations of problem and mapping constraints.

3.1. Modeling of Physical Network

The physical network is formulated as undirected graph denoted by G = ( N , L ) , where N is the physical nodes set and L is the physical links (edge) set. Each node is denoted as N u N , u [ 1 , m ] , and m is the number of nodes in N. Each node has a set of resources K, such as CPU, memory, and storage. Given that NFVI should contain no single point of failure, ETSI NFV framework recommends different types of hypervisors that provide different types of virtualization techniques [22]. Thus, each N u supports one virtualization technique { t T } , where T is the set of virtualization technique types (hypervisors) in NFVI. Each node N u has a set of resources { R N u t , k | t T and k K } . The embedding cost of a resource unit of type k and N u with a virtualization type t is denoted by C N u t , k . Each physical link between N u and N v is denoted by L u v L , where u , v [ 1 , m ] . L u v has a bandwidth B L u v and a propagation delay D L u v . The embedding cost of a bandwidth unit is denoted as C L u v .

3.2. Path Identification

Path identification has two purposes: (1) to minimize the number of candidate physical links in the input of the placement algorithm in order to enhance the execution time; and (2) to avoid mapping virtual links to long physical paths in order to minimize and control the embedding cost. Therefore, path identification is formulated as follows.
A physical edge between two adjacent nodes N u and N v , where u , v m is denoted by E u v . Then, a simple path between N u and N v is denoted by P u v . If N v is not adjacent to N u , the path between them will be a sequence of edges from source to destination as expressed in Equation (1) below:
P u v = [ E u x 1 , E x 1 x 2 , , E x n 1 x n , E x n v ] ,
where u , x 1 , x 2 , x n 1 , x n , v m . While the edge E u v can be expressed as a tuple of nodes at both ends of the edges, so it can be expressed by E u v = ( N u , N v ) and P u v as in Equation (2).
P u v = [ N u , N x 1 , N x 2 , , N x n 1 , N n , N v ] .
Whenever physical nodes have constant attributes, it is possible to identify simple paths using those constant attributes. One of the attributes (that are shared between physical nodes and virtual nodes of service requests) is the virtualization technique type. Thus, the virtualization technique type of each node in path P u v as expressed in Equation (2) is used to identify that path, which is denoted by I u v and expressed as in Equation (3).
I u v = [ t u , t x 1 , t x 2 , , t x n 1 , t n , t v ] ,
where t u , t x 1 , t x 2 , t x n 1 , t n , and t v are the virtualization technique types of N u , N x 1 , N x 2 , N x n 1 , N n , and N v , respectively.
It is important to know that the path identification is a unique entry while the contents of those unique entries are not, where one identification can retrieve a set of all simple paths that have the same path length and the same ordered sequence of virtualization technique types. For example, the identification I P a t h = [ t 1 , t 2 , t 3 ] can be an address in a data set for many simple physical paths P 1 , P 2 , , P n that have the length of three nodes, which have the same sequence of virtualization types t 1 , t 2 , t 3 in the same order.
The data set of path identifications is denoted by C P . Each entry of C P contains a data set of all paths, which have the same path identification of the entry as expressed in Equation (4) below:
C P ( I p a t h ) = C P ( [ t 1 , t 2 , t 3 ] ) = [ P 1 , P 2 , , P n ] ,
where I p a t h can be any unique sequence of available virtualization types with variable length in the range of 2 nodes to the number of nodes in the longest simple path in the physical network. If a is the maximum number of available unique path identifications, the data set of C P is expressed as in Equation (5):
C P = ( I P a t h 1 , I P a t h 2 , , I P a t h a )
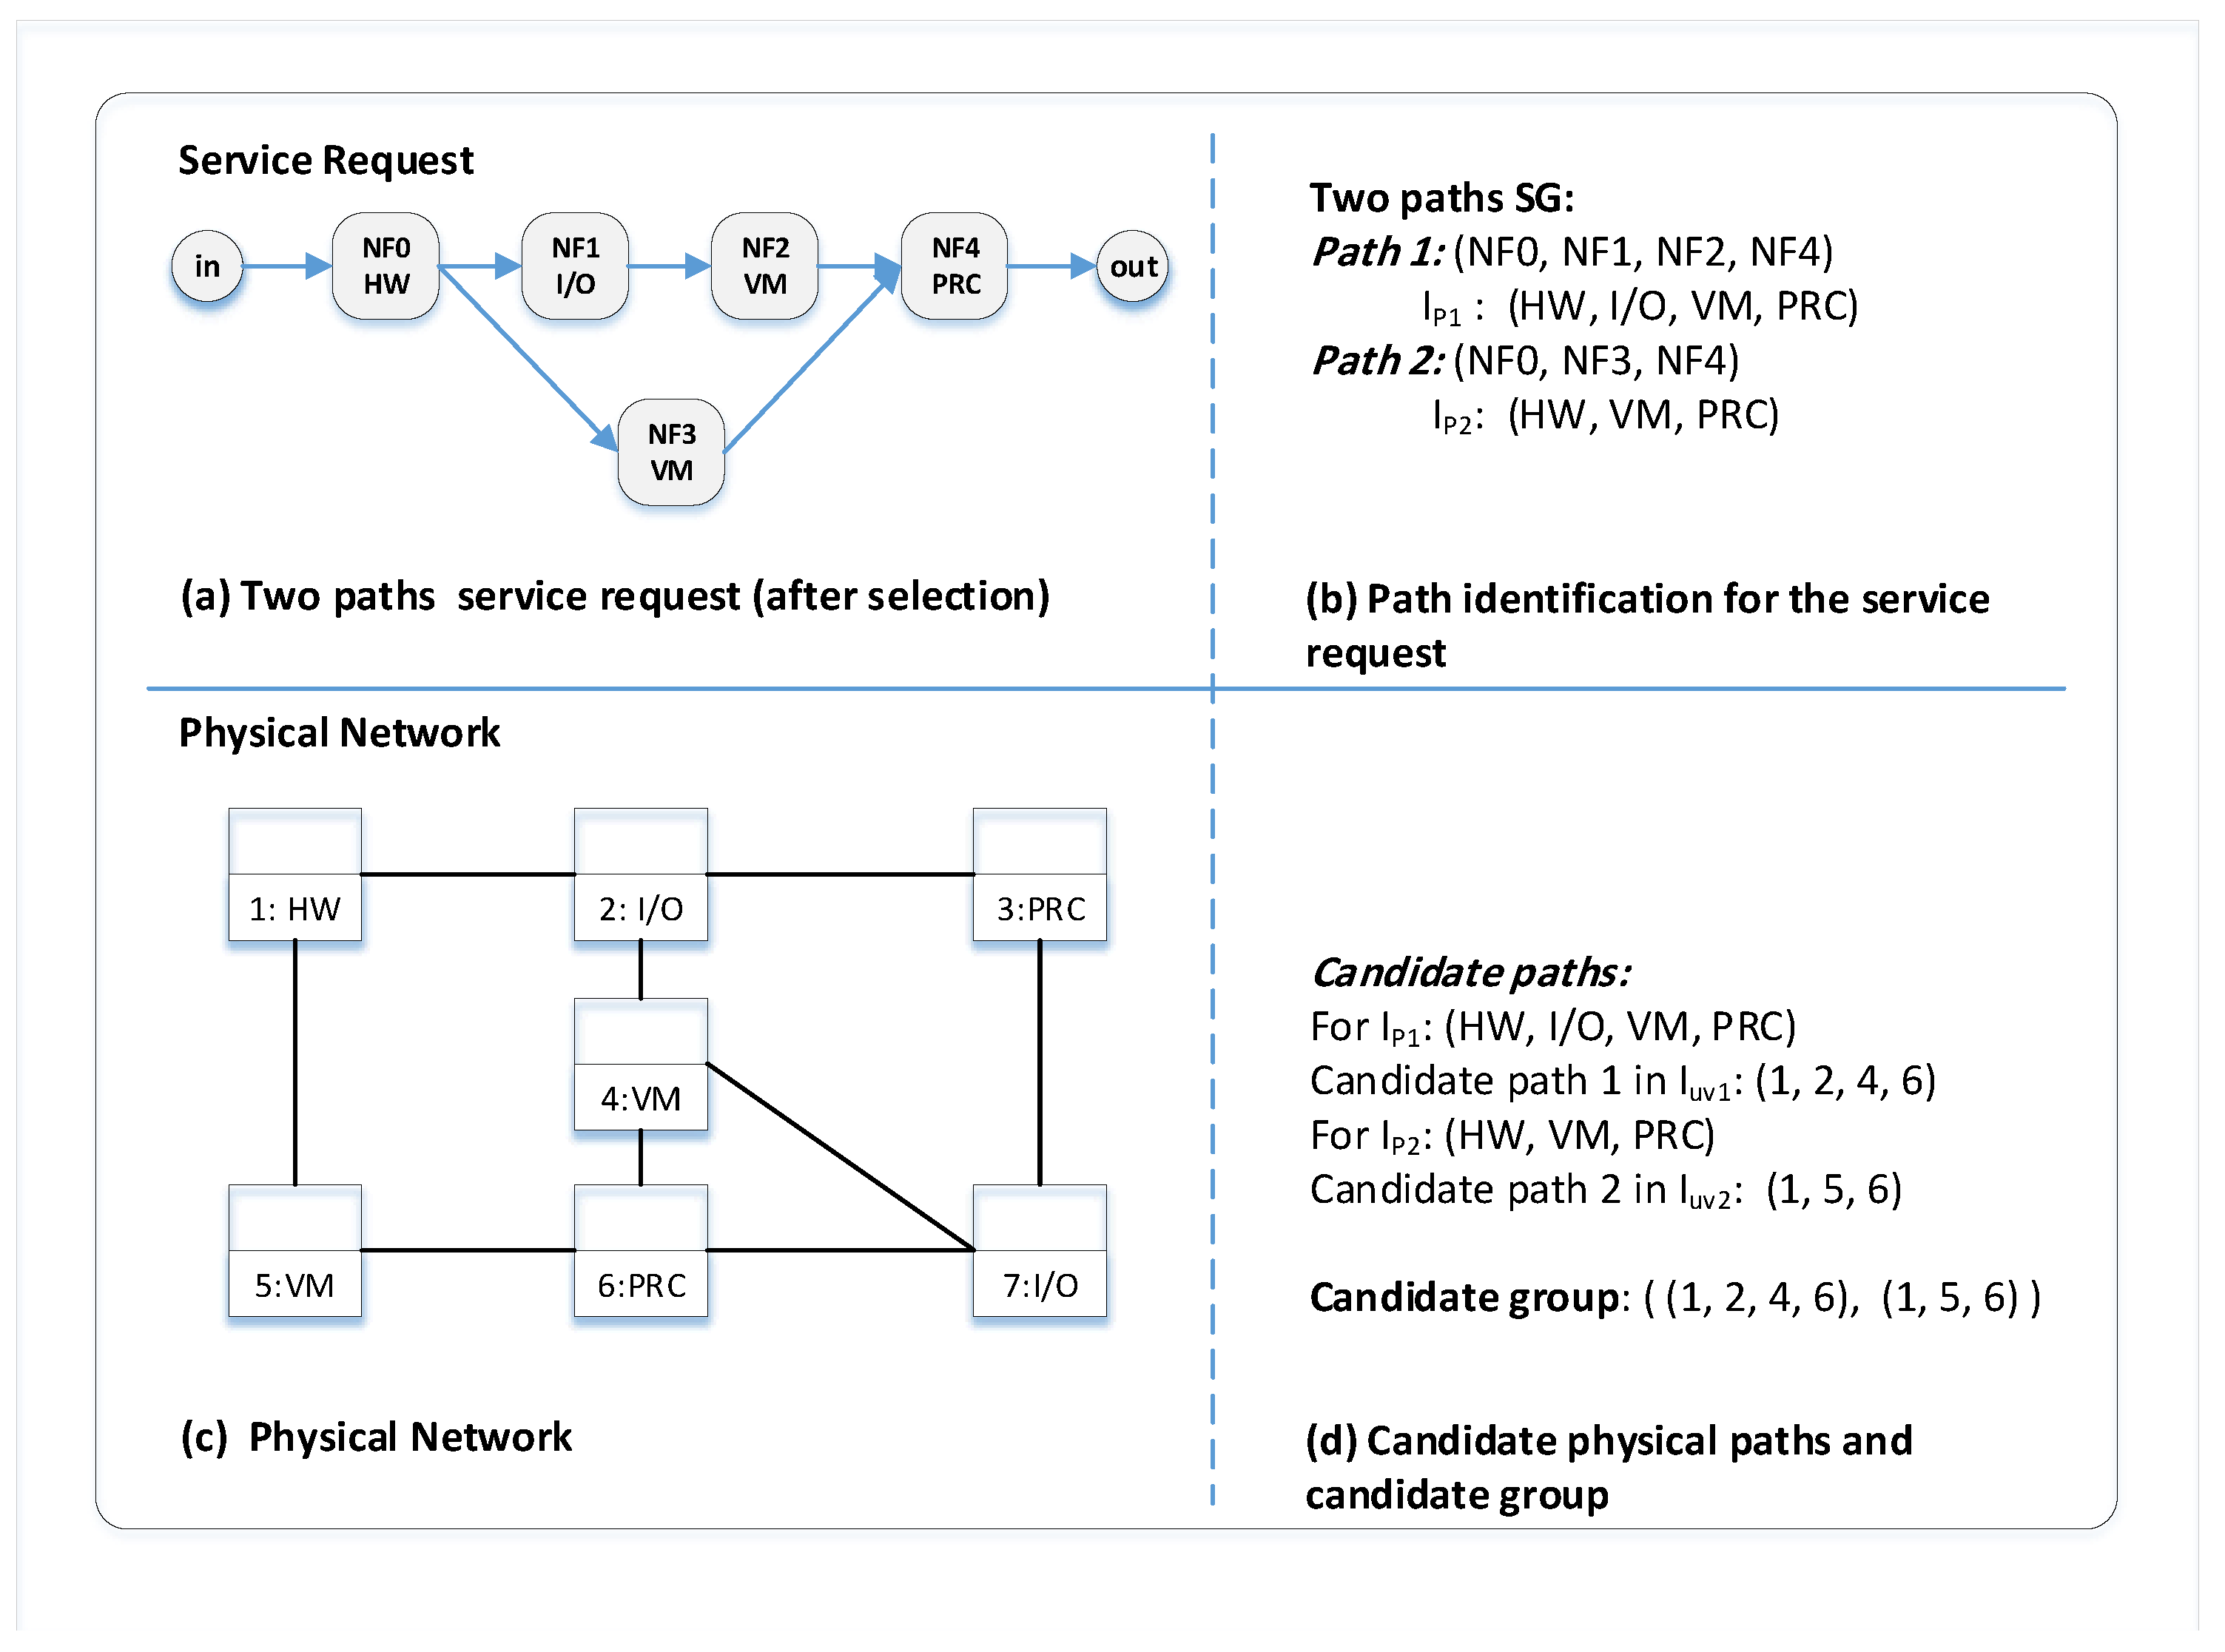
To realize the proposed path mapping approach on NFV, we suggest to implement C P as a catalogue in the NFVI repository under the name of “catalogue of physical paths.” Figure 2 shows an example of implementing I p 1 and I p 2 , which are used to get the path list by calling Equation (4). Then, a candidate group is built by selecting one path P x from each list we retrieved from Equation (4).

3.3. Service Requests

Given that traditional network functions can be mapped to one VNF or VNFs chain, where those VNFs might be implemented with different virtualization technique types. As well, it is possible to compose several combinations of the service chains. In addition, the service request might contain further policy-based constraints, such as the life time of the service or affinity and anti-affinity constraints. Therefore, the service request is denoted by S, which can be expressed as in Equation (6) below:
S = { r i d , s d c , Ψ } ,
where r i d is the service request identification, s d c is the set of possible service decompositions, s d c = ( d c 1 , d c 2 , , d c x ) , x N , and Ψ is a set of policy constraints. In this work, we implemented one constraint, which is the life time of the service request denoted by τ .
However, each service decomposition is a VNF-FG for a service chain. The service chain is modeled as a directed graph G s = ( F , E ) , where F is the set of virtualized network functions and E is the set of links between them. Each network function { f | f F } has a resource set denoted by { R f t , k | k K and t T } , where K is a resource set and the function f is implemented by a virtualization technique type t. Each virtual link between two functions i and j is denoted by e i j E and i , j F . The e i j requires a bandwidth resource, which denoted by B e i j and it has a maximum allowed delay that denoted by D e i j .
The service chain may contain one end-to-end path or more. Each end-to-end path starts at a source function and ends at a destination one. End-to-end virtual path is denoted by p and the set of all end-to-end paths in the service chains is denoted by P e 2 e . A network function in p is denoted by { f n p | n m } and m is the number of network functions in p. The virtualization technique type of the f n p is denoted by t f n p . All paths of the service is identified by an ordered set of types of functions in paths. Path identification was denoted by I p = ( t f 1 p , t f 2 p , , t f n p ) . I p is a unique identification and it is possible to address more than one end-to-end virtual paths that have the same length and order of virtualization type.

3.4. Problem Formulation

The upcoming subsections describes variables of the problem, objective function, and the constraints of the problem.

3.4.1. Variables of the Problem

During the embedding stage of NFV-RA problem, only one service decomposition is selected to be mapped on the physical network. A binary variable X d c is used to indicate whether a decomposition is mapped or not. The X d c is expressed as:
X d c = 1 if d c is mapped . 0 otherwise . ; d c s d c .
The binary variable Y N u f indicates if network function f is mapped on physical node N u . The Y N u f is expressed as:
Y N u f = 1 if f is mapped on N u . 0 otherwise . ; d c s d c , f G d c , N u N .
The binary variable Z L u v e i j indicates if the virtual link e i j is mapped on physical link L u v . For the best of our knowledge, this variable was expressed in the literature as:
Z L u v e i j = 1 if e i j is mapped on L u v . 0 otherwise . ; d c s d c , e i j E , L u v L .
In large physical networks, the Equation (9) would generate large number of variables, which consequently increases the execution time. In order to minimize the number of variables, the path identifications I p of end-to-end paths of the service request is used to retrieve possible candidate physical paths. Then, the Z L u v e i j is expressed again as in Equation (10):
Z L u v e i j = 1 if e i j is mapped on L u v . 0 otherwise . ; d c s d c , p P e 2 e , e i j p , L u v P u v , P u v C P ( I p ) .

3.4.2. Objective Function

Assuming that different resource type has different embedding cost. Therefore, the amount of required resource type k to embed f on N u is denoted by R f N u t , k , where f and N u have the same virtualization technique t.
The main objective of this work is to minimize the embedding cost c o s t as expressed in the equation below:
Minimize c o s t ,
where the c o s t is calculated as in Equation (11) below:
c o s t = A + B ,
where
A = d c s d c f F N u N t T k K ( C N u t , k R f N u t , k X d c Y N u f ) ,
and
B = d c s d c p P e 2 e e i j p P u v C P ( I p ) L u v P u v C L u v B e i j X d c Z L u v e i j

3.4.3. Constraints of the Problem

1. Decomposition Constraint: Only one decomposition of the service request should be embedded as expressed in Equation (12) below:
d c s d c X d c = 1
2. Virtual Network Function Constraint: The constraint in Equation (13) is to prevent embedding virtual network functions more than once. It also guarantees that only the nodes from the selected decomposition will be embedded.
f F Y N u f = X d c .
3. Physical Node Constraint: If there are two virtualization types t , t 1 T in the network, then it is not allowed to map a virtual function f t of the type t 1 on physical node N u t 1 if t t 1 . In addition, the sum of allocated resources R f k of the type k for all virtual functions f that are mapped on N u must be less than, or equal to, the available resources R N u k in N u .
The constraints in (14) and (15) express that, it is possible to embed any number of virtual functions f t on physical node N u t 1 only if N u has enough resources and the function has the same virtualization type of the physical node t = t 1 .
f t F Y N u t 1 f t = 0 ; t t 1 . f t F Y N u t 1 f t 0 ; t = t 1 . ; N u t 1 N , d c s d c , t , t 1 T .
f F R f k × Y N u f R N u k ; N u N , d c s d c , k K .
4. Path Length Constraint: For mobile network, the connections between the virtual functions of service might traverse through transmission mediums, which might be with high cost. The path length embedding constraint in Equation (16) determines if it is allowed to embed end-to-end paths on physical paths longer than required. One of the reasons behind high embedding cost is the mapping of virtual links to more than one hub physical link. In the other hand, mapping virtual links to more than one hub physical link might improve the acceptance ratio. This trade-off between the embedding cost and the acceptance ratio can be controlled by the network operator through determining the value of h | h { 0 , 1 , 2 , } in Equation (16), where h value should be equal to the maximum allowed additional hubs to the virtual path length.
e i j p Z L u v e i j l e n ( p ) + h ; d c s d c , p P e 2 e , L u v L
where l e n ( p ) is the number of virtual links in p. In case, there is a link in p where both nodes at the two ends of that link have the same virtualization type, both can be embedded to the same physical node. Then, the embedding will be in number of physical links less than l e n ( p ) .
5. Unsplittable Path Flow Constraint: When a virtual link is mapped to more than one physical link, the traffic on that link should not be split in more than one path. Then, if we assume that the outgoing link from a node to next node has a positive sign and the opposite incoming link has a negative sign. Then, the Unsplittable path flow constraint can be expressed as in Equation (17) below:
L u v L , N u = s r c Z L u v e i j + L u v L , N u = d s t Z L u v e i j = Y N u i Y N u j ; d c s d c , e i j E , N u N .
6. Bandwidth Constraint: The sum of bandwidth for all virtual links that are mapped to a physical link should not exceed the bandwidth capacity of that physical link as expressed in Equation (18) below:
e i j E B e i j × Z L u v e i j B L u v ; L u v L , d c s d c .
7. Path Delay Constraint: The end-to-end delay for all physical links to which a virtual link is mapped to, should not exceed the allowed delay for that virtual link, as in Equation (19) below:
L u v L D L u v × Z L u v e i j D e i j ; d c s d c , e i j E .

4. The Proposed Heuristic Scheme

The second contribution of this work is a new heuristic scheme, namely the Decomposition Path Selection Mapping (DcPSM); which consists of three algorithms, namely (1) decomposition selection, (2) service mapping, and (3) path mapping.

4.1. Decomposition Selection Algorithm

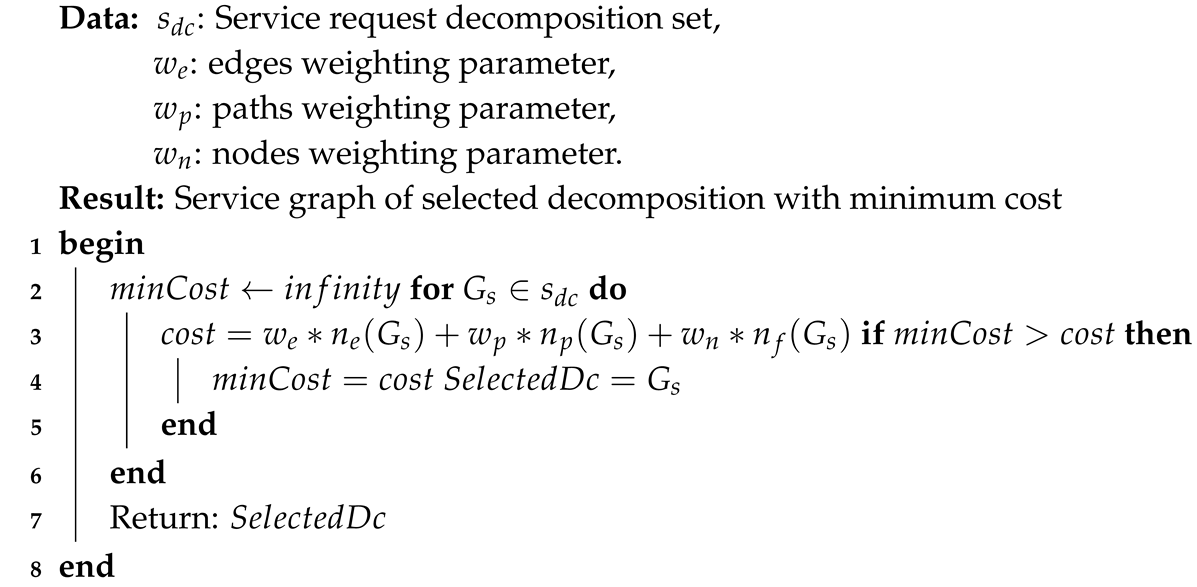
Whenever a service request S arrives, the decomposition selection algorithm selects a decomposition from the decomposition set of services d c = G S s d c . A cost function is used to determine which decomposition is going to be selected, as expressed in Equation (20) below:
c o s t ( d c ) = w e n e ( d c ) + w p n p ( d c ) + w n n f ( d c )
The cost function has three selection factors, which are number of edges n e ( d c ) , number of nodes n f ( d c ) , and number of paths n p ( d c ) . Each factor has a weighting parameter that is used to control the impact of that factor. These weighting parameters, w e , w p , and w n , are used to represent the number of edges, number of paths, and number of nodes, respectively. The pseudo code of the decomposition selection algorithm is illustrated in Algorithm 1.
Algorithm 1: Decomposition Selection Algorithm
Symmetry 11 01173 i001

4.2. Service Mapping Algorithm

This algorithm uses the decomposition selection algorithm to find the decomposition with minimum cost G s . Then, it retrieves end-to-end simple paths of physical network for each virtual p a t h from the catalogue of physical paths C p . Thereafter, the function pathGroupGenerator generates the path group list P a t h G r o u p L i s t , in which each P a t h G r o u p of physical paths contains one candidate path for each path in P e 2 e of the selected decomposition. That candidate group of paths is passed to the path mapping algorithm with P e 2 e . If the path mapping algorithm succeeded in embedding the service, the service mapping algorithm will return a s u c c e s s state, otherwise, it will return a f a i l state. For more details refer to Algorithm 2.
Algorithm 2: Service Mapping Algorithm
Symmetry 11 01173 i002
For example, if the selected G s has two paths p 1 , p 2 P e 2 e and the identification of them I ( p 1 ) and I ( p 2 ) ; and if C p ( I ( p 1 ) ) = ( P a b , P c d ) and C p ( I ( p 2 ) ) = ( P e f , P g h ) . Thus,
C a n d i d a t e P a t h s L i s t = C p ( I ( p 1 ) ) , C p ( I ( p 2 ) )
and,
P a t h G r o u p L i s t = ( P a b , P e f ) , ( P a b , P g h ) , ( P c d , P e f ) , ( P c d , P g h )

4.3. Path Mapping Algorithm

This algorithm tries to map P e 2 e to its candidate physical path group, for better understanding see Algorithm 3. Given that the end-to-end paths in P e 2 e have shared virtual nodes because the service graph G s is connected. Thus, a simple method is used to check if candidate paths have shared physical nodes too. This method compares the number of physical nodes to the number of virtual nodes; If the physical is less or equal to virtual nodes, the algorithm will continue, otherwise, it returns a negative response; as in line 2 of Algorithm 3. This algorithm saves the physical network state to a save point in order to rollback if the mapping fails. Then, it checks the virtualization technique type and the available resources to map f on N u using a validation function, namely CheckNodeValidation . Whenever a new function is processed for mapping the links among the mapped nodes, another validation function is used to check the available bandwidth and end-to-end delay of the links, where this function is named CheckLinksValidation . In fact, checking of available resources, bandwidth, and delay is implemented in a similar way to that in Reference [11].
Algorithm 3: Path Mapping Algorithm
Symmetry 11 01173 i003
This proposed heuristic scheme tests the possibility of mapping end-to-end paths to simple candidate paths of the same path identification. This means that the path length constraints in Equation (16) will not be taken into account, which will negatively affect the acceptance ratio. For this reason, we suggest to retrieve the physical paths based on the path identification of virtual links instead of end-to-end paths in order to improve the acceptance ratio. We also reported the path mapping based on the end-to-end path identification to proof the concept of end-to-end path mapping where the results of this work shows that the performance of the proposed heuristic scheme in large-scale can overcome its weakness in small-scale.

5. Performance Evaluation

This section introduces the simulation environment (as shown in Figure 3) in which it is used to evaluate the proposed path mapping approaches. Additionally, it describes the metrics that are used to measure the performance of the studied schemes and it presents the results and discussion. Table 2 describes the used schemes for the benchmark.

5.1. Simulation Environment

The proposed schemes are evaluated based on real world telecom topologies and synthetic topologies, where real topologies have been obtained from Internet Topology Zoo [52] and they are: (1) the BT Europe (24 nodes and 37 edges) and (2) Interoute (110 nodes and 148 edges). An additional edges were generated for each of them to study the impact of increasing physical links, which results in: (1) BT + (24 nodes and 65 edges) and (2) Int + (110 nodes and 180 edges). Due to the high average execution-time of the ILP-A in long simulation run, twelve synthetic topologies are generated in order to compare the execution times of all schemes in short simulation run. Specifically, six of the synthetic topologies are generated with maximum 3 edges (denoted by E 3 ) attached to each node, while the remaining six are generated with maximum 4 edges (denoted by E 4 ) attached to each node. This configuration is selected to mimic real world networks, where high volume servers are usually equipped with 4 network adapters in average. More details about the used topologies in this work are shown in Table 3.
While many works in the literature have studied the placement problem considering the number of nodes in service requests, this work focuses only on the impact of multi-paths service requests. Thus, five types of service requests are generated to be mapped in these experiments: (1) Simple, (2) Multiple, (3) P 5 , (4) P 10 , and (5) P 20 . Simple indicates to service requests with simple/forking path in each decomposition in the request, while Multiple have multi-paths with multi-starting nodes (Ingress) and multi-ending nodes (Egress), both with a random number of end-to-end paths. P 5 , P 10 , and P 20 are multiple paths service graphs with specific number of paths equal to 5, 10, and 20 paths, respectively. These experimental scenarios represent pairs of request type and physical network. Twenty-two experiments are conducted to evaluate the studied schemes, where six experiments with short simulation runs are used to evaluate all schemes in terms of execution time. See Table 4 for more details about the experimental scenarios.
The resources of physical nodes, such as CPU, memory, and storage, and the bandwidth of physical links, are uniformly distributed between 100 and 150 capacity units. The embedding costs of physical nodes and links are set to 1 cost unit for each. Links between any pair of physical nodes are generated randomly with a chance of (0.5) in the synthetic topologies and additional links are generated for BT + and Int + . The Propagation delay of a physical link is proportional to the real geographical distance between nodes based on the real telecom topologies, which varies from 1 to 30 time units, while it is calculated randomly from the same range for the synthetic topologies. Four virtualization technique types are used in these experiments, which are (1) Virtual Machine (VM), (2) process in a container (PRC), (3) input/output driver (I/O), and (4) hardware appliance (HW). The virtualization technique type of each node is randomly selected from the available virtualization technique types for both physical nodes and virtualized nodes of the service request.
Moreover, the service requests are generated based on Poisson process with an average equals to 4 requests each 100 time units. Each service has a few decompositions that are uniformly distributed between 2 to 5, and the number of virtual nodes in each decomposition is uniformly distributed between 2 and 10, while the required resources for each node are uniformly distributed between 1 and 20 capacity units. The virtual links between every pair of nodes are generated with a chance of (0.5) and the bandwidth of each virtual link is uniformly distributed between 1 and 50 bandwidth units, while the virtual links delays are set to 1000 time units. As for the life time of each service request, it is exponentially distributed with an average equals to 1000 time units.
The decomposition selection is used in ILP-A and DSBM schemes, while the weighting parameters used for the cost are a = 0.25 , b = 0.25 and g = 0.50 as recommended in Reference [11]. The ILP-P is not using any selection function and the DcPSM uses the following weighting parameters w e = 0.60 , w p = 0.30 and w n = 0.10 in the decomposition selection function. The number of allowed additional hubs constraint for Equation (16) is set to h = 1 .

5.2. Performance Metrics

The metrics used in these experiments were also used in previous works such as [11,12], and calculated as:
  • Execution time ( E T ): measures the time consumed by an algorithm to find the embedding solution.
  • Acceptance ratio ( AR = R A / R T ): measures the accepted service requests ( R A ), which are successfully mapped to the total number of arrived requests ( R T ).
  • Embedding cost ( C a v g ): it is the average of total used resources for mapping service requests over 100 time unit. It is calculated based on the objective Equation (11).
  • Average embedding cost/average revenue ( R c / r = C a v g / R a v g ): it is the ratio between the average embedding cost C a v g and the average revenue R a v g of a service requests over 100 time units. The revenue of a service request is calculated as the product of the total resources of virtual nodes and the average physical nodes cost, plus the product of the total bandwidth of virtual links and the average cost of physical links.

Distribution of Mapped Service Requests

To evaluate the impact of attributes of service requests, such as number of virtual nodes, links and paths, we measured the metrics for the studied schemes according to the average at time windows (100 time units) and according to the service request attributes. Evaluating results for the attributes of service requests can show the efficiency of the selection algorithms in DSBM and DcPSM. It might help the designers of service by showing the efficiency of re-implementing services with multiple paths. Another reason is that the measurements for a service request might change by the time depending on the status of the physical network.
Given that long simulation run is selected to be 20,000 time units and each time window of the Poisson process is 100 time units with average 4 requests. The average number of generated service requests in each service request type is 800 in each simulation run while 10 simulation runs are conducted. The total average generated requests for all five service types is 40,000. Each scheme solves those requests on 4 topologies except ILP-A, which is evaluated over BT Europe and BT + because it is expected to show high execution time in large-scale, see Table 4.
The counters of request from specific number of nodes, edges, and paths are distributed as shown in Figure 4. The upcoming Section 5.3 will discuss the performance of the studied schemes based on this distributions of counters.

5.3. Results

This section presents and discusses the results of all experiments including the execution time, acceptance ratio, embedding cost, ratio of average cost to average revenue, and the impact of decomposition selection cost parameters. The overall results show a significant enhancement in execution time for the optimal solution (ILP-P), as shown in Figure 5, compared to average execution time equals to 459.519 s for optimal solution of [12] at 110 nodes. The best gap between heuristic and optimal solutions was in [47] which was equal to 25 % . In our approach, the gap between DcPSM (heuristic) and ILP-P (optimal) was reduced to 9 % which outperforms previous proposed works.

5.3.1. Execution Time

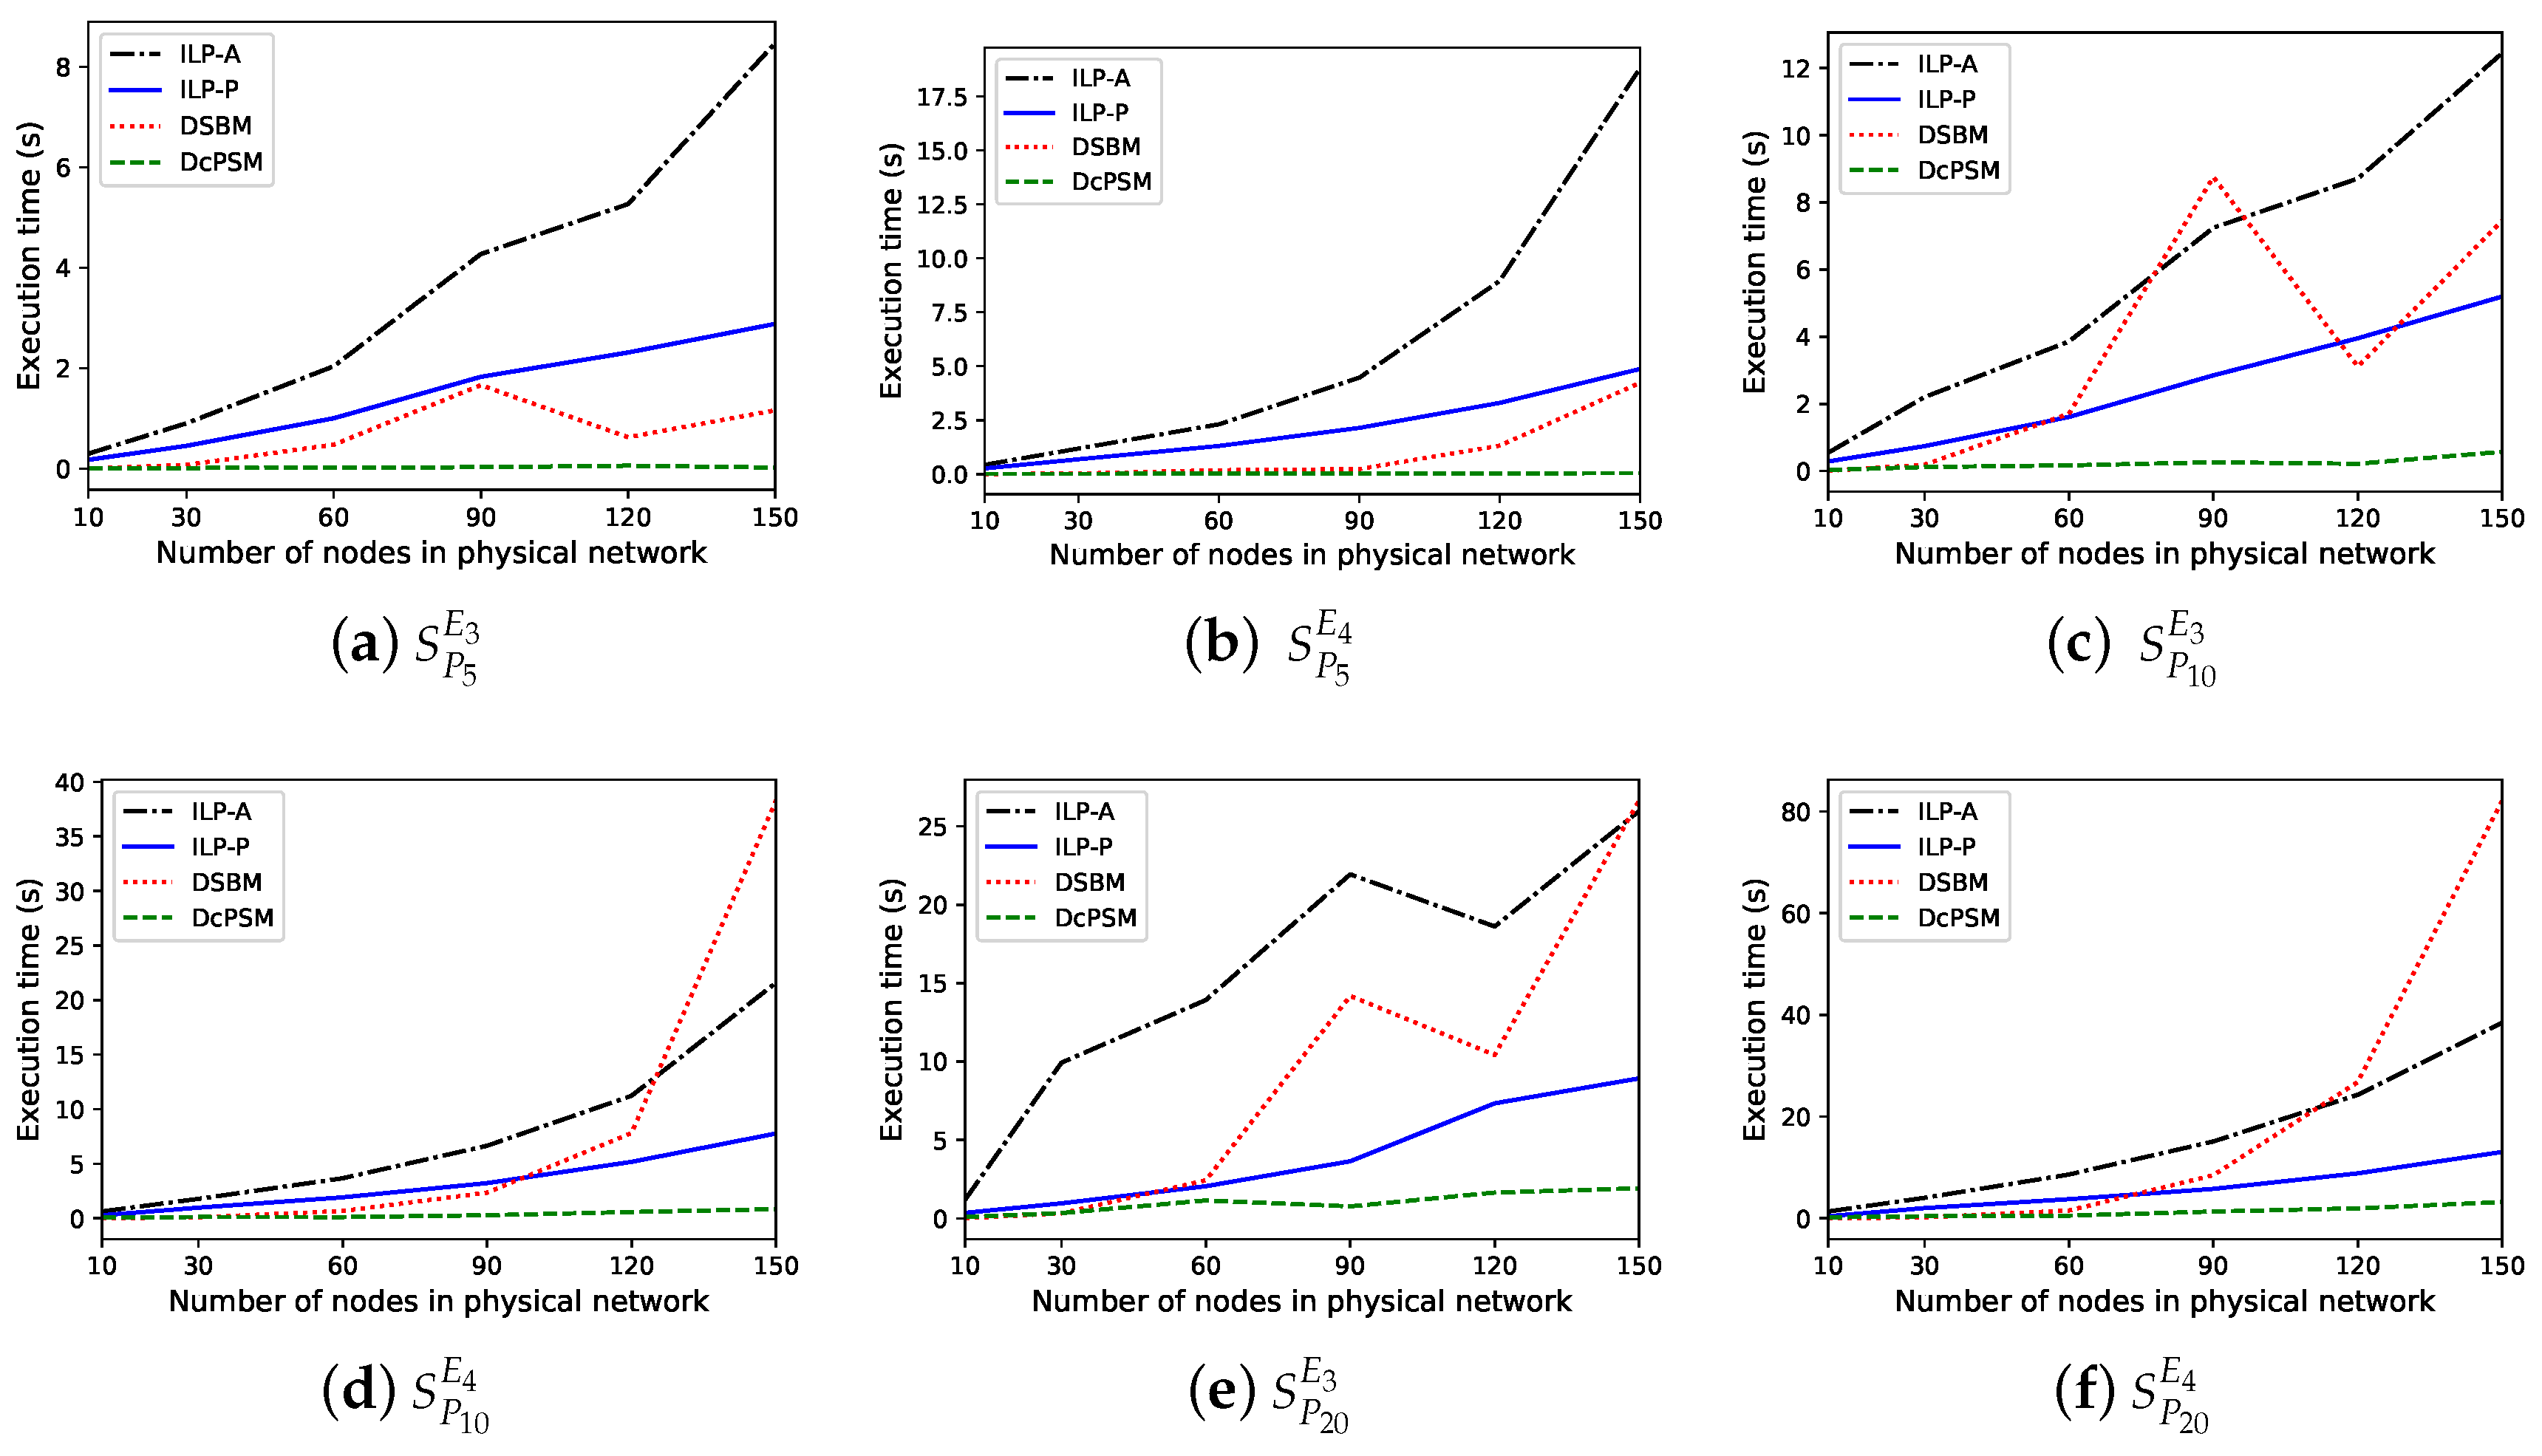
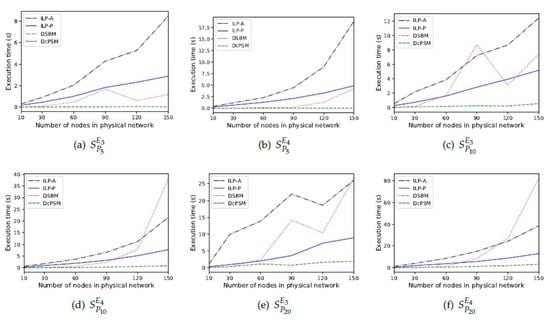
The execution time of the studied schemes over 6 scenarios in short simulation runs has been measured and presented in Figure 5. As well-known, increasing the number of physical nodes increases the execution time for all schemes, however, increasing the number of physical links for the same number of nodes might increase or decrease the execution time. However, the execution time significantly depends on the placement algorithm itself, while increasing the physical links may only increase the possibility of finding faster solutions.
From Figure 5, it is clear that the proposed ILP-P and DcPSM show moderate increase of execution time when the physical nodes number increases, which tells that using the proposed path mapping approach can be more suitable for mapping mobile core network functions. In this experiment, the generated nodes for P 5 , P 10 , and P 20 has been uniformly distributed between 5 and 10, while the other version of service requests for P 5 , P 10 , and P 20 has been generated based on a fixed number of nodes equals to 10 virtual nodes. The results of all 6 scenarios show that the proposed ILP-P and DcPSM reduce the execution time to 39.58% and 6.42% of the execution times of the existing ILP-A and DSBM, respectively.
Figure 6 reports the execution time for ILP-P, DSBM, and DcPSM to show the impact of changing the number of nodes, paths, and edges on the execution time. ILP-A was omitted here because its execution time is very high especially when the number of nodes and edges are increased. For example, the average execution time of ILP-A for requests with 10 virtual nodes, 29 links, 79 paths is about 1247 s in BT Europe topology. For this reason, we think that ILP-A is not suitable any more and it is confirmed that the existing DSBM can overcome the ILP-A in all scenarios. Eventually, we can conclude that the proposed ILP-P and DcPSM can significantly improve the performance by reducing the execution time, especially in the scenarios with large number of virtual nodes, edges, and paths. This improvement is due to the employment of the proposed path mapping approach, which can perform well compared to the state-of-the-art approaches.

5.3.2. Acceptance Ratio

Long simulation runs have been carried out to evaluate the studied schemes in terms of the acceptance ratio over small and large scale networks, while the ILP-A has not been evaluated in the large scale networks due to its large execution time. The acceptance ratios of ILP-P in all scenarios are better than the acceptance ratios of the other schemes, as shown in Figure 7. Moreover, the ILP-P improves the acceptance ratio compared to the ILP-A since the ILP-P minimizes the use of physical links which enhances the acceptance ratio in the long runs.
Unlike the ILP-P, the DcPSM maps virtual paths to the shorter or equal physical paths, where the possibility of finding similar path identification is lower in small-scale. Therefore, the proposed DcPSM shows lower acceptance ratio in Simple-Small and Multiple-Small compared to the other schemes, while it shows higher acceptance ratio compared to the DSBM especially in Simple-Large and Multiple-Large.
As expected, the increase of virtual links and paths has a high impact on the acceptance ratio compared to the increase of nodes. Figure 8 shows that the low acceptance ratios are distributed over the nodes axis and over edges axis for both DSBM and DcPSM. However, the low acceptance ratios are concentrating on the service requests with a high number of edges and paths as shown in Figure 8.

5.3.3. Embedding Cost

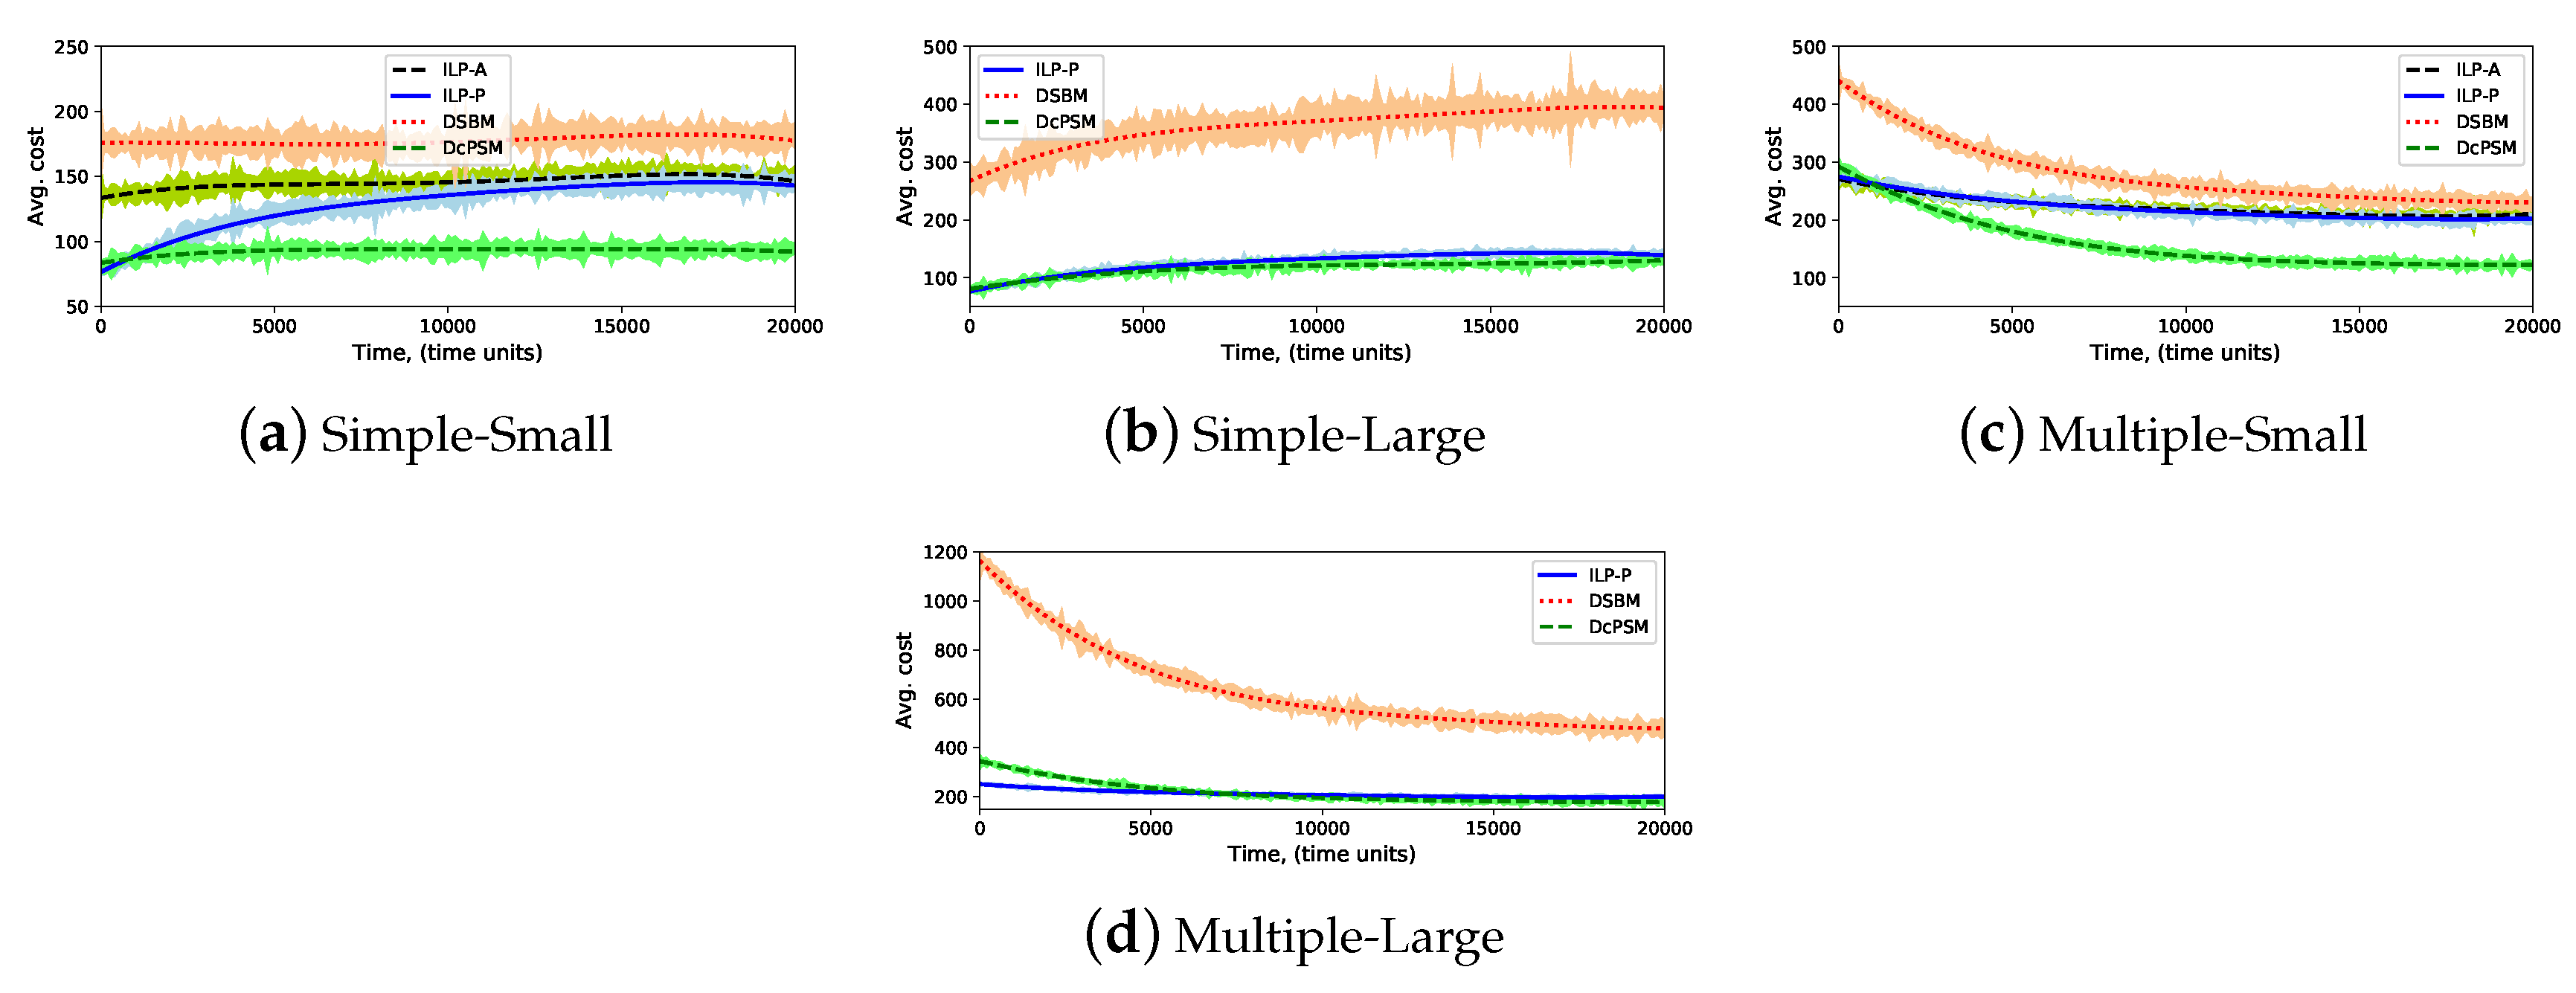
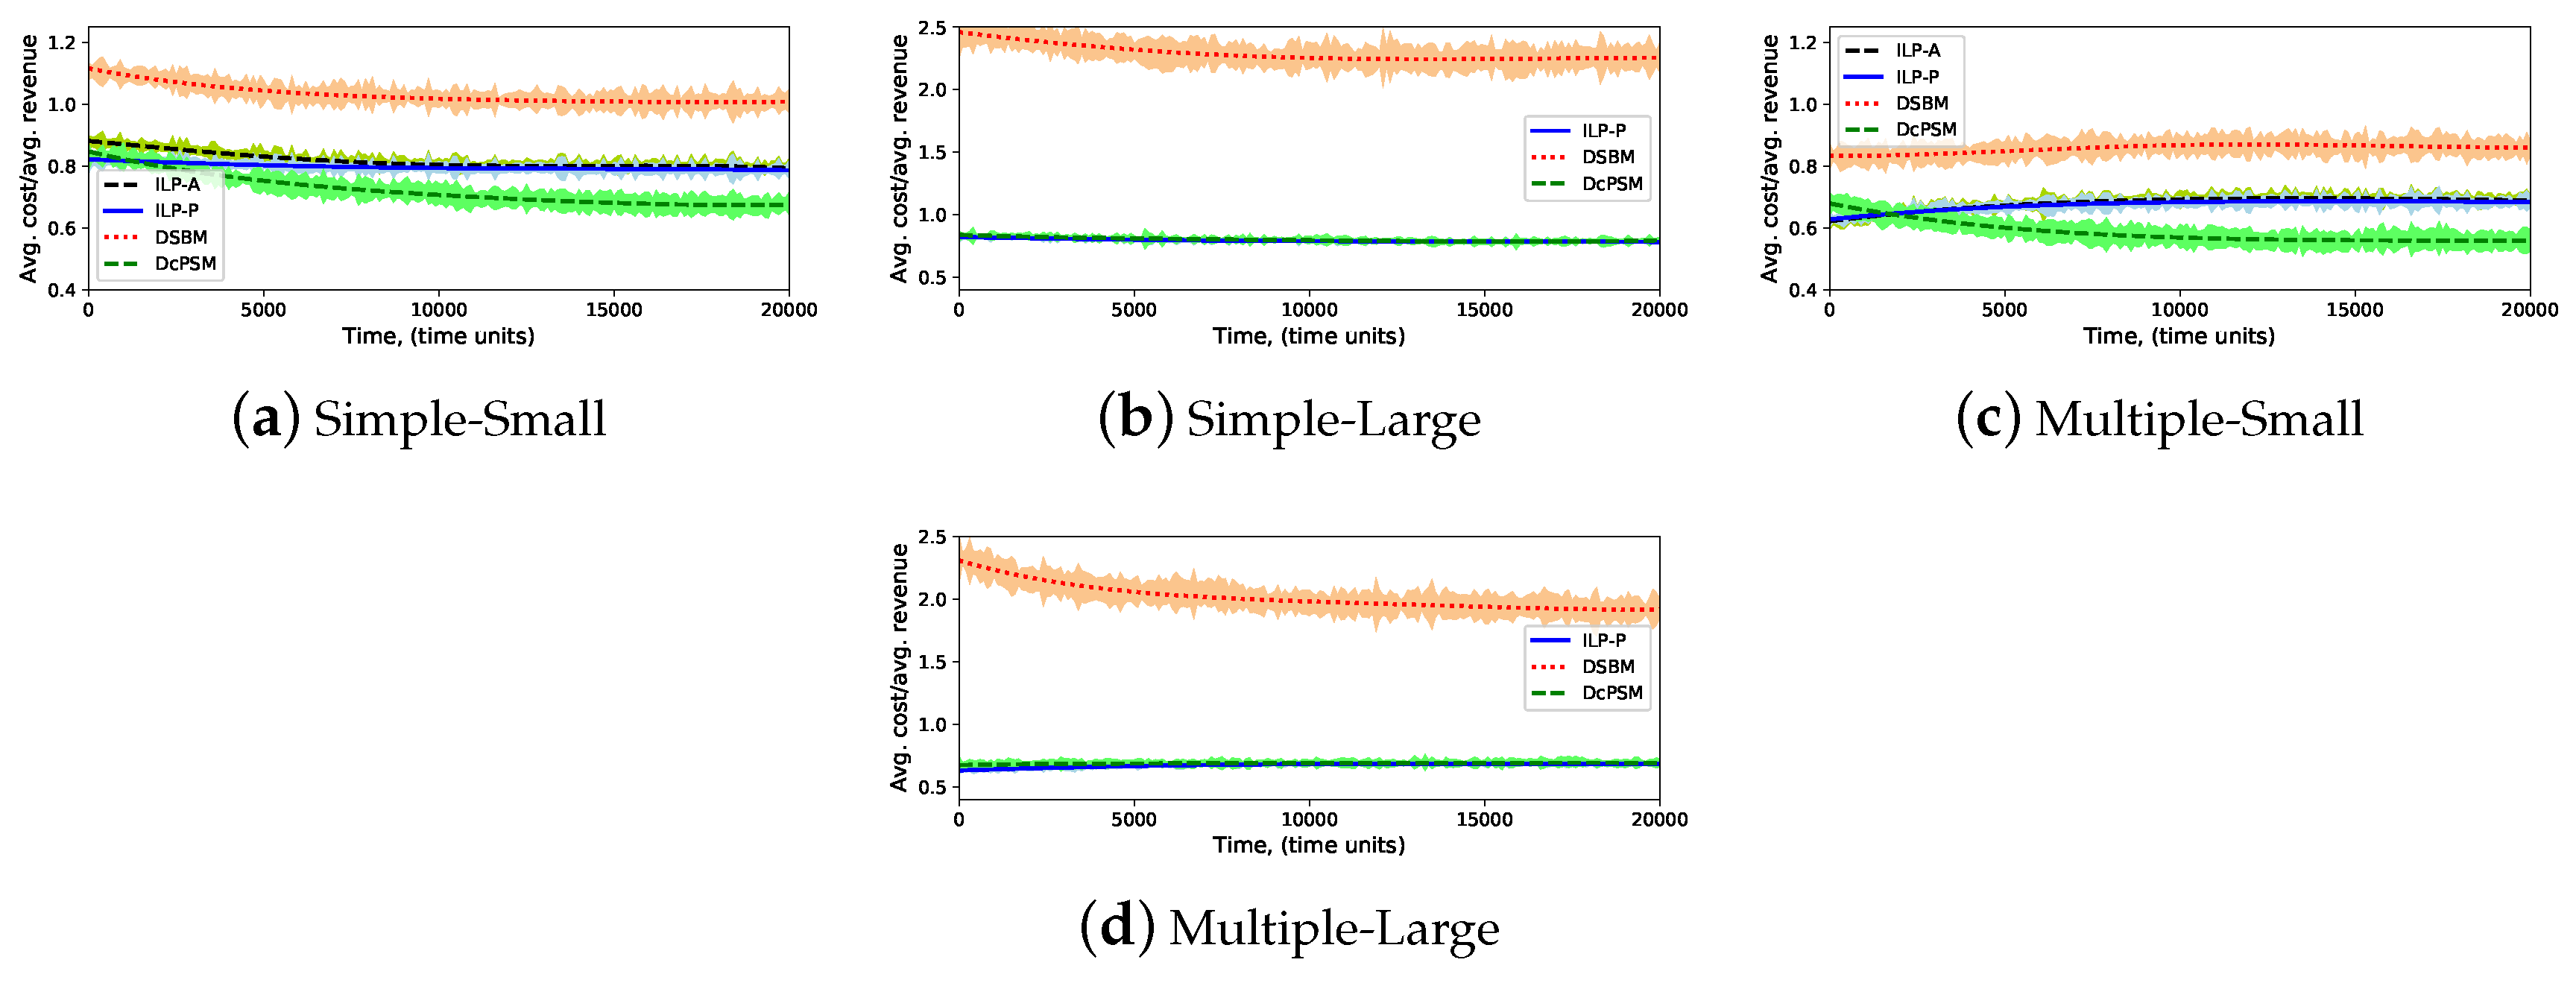
As for the average embedding cost, Figure 9 shows that the proposed ILP-P can perform the embedding process with lower cost compared to the ILP-A, due to the fact that ILP-A maps the selected decomposition based on the clustering selection. As for the multiple-large scenario, both ILP-A and ILP-P achieve almost the same cost because the possible clustering of nodes in this scenario is very high. Thus, the process of clustering nodes is very helpful for both ILP-A and DSBM to reduce the embedding cost.
Figure 9 and Figure 10 show that the proposed ILP-P and DcPSM can perform the embedding process with lower cost compared to DSBM. More specifically, ILP-P reduces the embedding cost by 4% compared to ILP-A in the small-scale networks for all request types, while in the long simulation runs, the average embedding cost of DSBM is 297% and 295% higher than the proposed ILP-P and DcPSM, respectively.

5.3.4. Ratio of Average Cost to Average Revenue

The ratio of average embedding cost to average revenue must be less than 1 in order for the NFVI provider to get the financial benefit. As we can see in Figure 11, the proposed ILP-P and DcPSM show the best ratios of embedding cost to revenue in all scenarios while the DSBM shows the worst ratios. Due to the proposed path mapping approach, ILP-P and DcPSM overcomes all compared schemes in terms of the ratio of average cost to revenue, as shown in Figure 12. As for the DSBM, it shows the worst ratio of average cost to revenue due to the high possibility of clustering virtual nodes. The clustering of nodes might reduce the embedding cost but it might also lead to request rejection since it may select a service decomposition with high number of edges and paths, as in Figure 8.
For all solved service requests, we found that the proposed path mapping schemes are more profitable for the NFVI provider if compared to the state-of-the-art schemes. The total number of solved requests, the total of acceptance ratio and the ratio of average cost to revenue have been compared for the studied schemes as in Table 5. The R c / r for ILP-P was 1.5% better than ILP-A, and ILP-P shows approximately the same ratio in both small and large scales. For the heuristic schemes, DSBM shows a small profit margin equals to 0.09% in small-scale, while in the large-scale, its R c / r ratio is greater than one which means no profit can be achieved. Despite that the DSBM shows higher acceptance ratio (8.75%) compared to the DcPSM; however, the DcPSM shows lower cost to revenue ratio equals to 71.46% compared to the DSBM, which is about 8 folds of the acceptance ratio difference.

5.3.5. The Impact of Decomposition Selection Cost Parameters

The performance of DcPSM has been experimentally tested with three different sets of values for weighting parameters: (1) w e = 1.0 , w p = 0.0 , w n = 0.0 , (2) w e = 0.0 , w p = 1.0 , w n = 0.0 , and (3) w e = 0.0 , w p = 0.0 , w n = 1.0 . It has been found that the worst case is the third set of values when w n = 1.0 , while the first and the second sets perform well with a small advantage for the first where w e = 1.0 . To conclude, less number of edges might lead to less number of paths.

6. Conclusions and Future work

In this paper, we proposed a new path mapping approach that uses path identification for mapping virtual service requests. We formulated the NFV-RA problem to be solved based on path identifications instead of mapping them node by node. Then, the proposed approach was implemented by ILP-based scheme and heuristic scheme—namely ILP-P and DcPSM. Four schemes were simulated in 16 scenarios of long simulation runs and 6 scenarios of short simulation runs. The results show that increasing the number of physical links might reduce the execution time for back track mechanism with low number of physical nodes, however, increasing the number of nodes will always increase the execution time. The proposed ILP-P and DcPSM have overcome the other compared schemes especially in the cost to revenue ratio in most cases. Additionally, the proposed path mapping schemes have efficiently reduced the execution time and embedding cost with high acceptance ratio taking into account the high cost to revenue ratio. As for the number of virtual links (edges) and the number of end-to-end paths, it was found that increasing the number of virtual links and paths might lead to a low acceptance ratio in all of the studied schemes. For this reason, our recommendation for decomposed mobile core network functions is to reduce the cross connections and to relay more on protecting the end-to-end paths, which can be implemented by locating state-full functions or load balancing functions at the beginning or at the end of the chains. Furthermore, it is worth noting that the path mapping approach is more efficient than back-track mechanism and can be deployed for multiple virtualization environment to enhance the resiliency and high availability for mobile networks.
Finally, the performance evaluation that carried out in this paper encourages us to continue the work and to study the path mapping with VNFs life-cycle dynamic operations for scaling and end-to-end path protection and migration. Since the DcPSM is proposed in this work to measure the possibility of mapping virtual paths to exact match of simple physical paths, we think that further efforts to improve the DcPSM could enhance the performance of heuristic schemes based on path mapping which may lead to a highly competitive scheme.

Author Contributions

All authors of this article have contributed to the work as follows: conceptualization, validation, formal analysis, methodology, software, visualization, and original draft preparation have been done by B.R. and K.A.-W.; project administration and supervision have been done by I.A.A.-B.; technical review, writing the final draft and funding acquisition have been done by M.A.A.; proofreading and editing have been done by M.A.A.-M.

Funding

This work is funded by Universiti Putra Malaysia under RMC general grant.

Acknowledgments

This work is supported by Universiti Putra Malaysia and the Ministry of Higher Education—Yemen.

Conflicts of Interest

The authors declare no conflict of interest.

References

  1. ETSI. 5G. Available online: https://www.etsi.org/technologies/5g (accessed on 1 August 2019).
  2. Nguyen, V.G.; Brunstrom, A.; Grinnemo, K.J.; Taheri, J. SDN/NFV-Based Mobile Packet Core Network Architectures: A Survey. IEEE Commun. Surv. Tutor. 2017, 19, 1567–1602. [Google Scholar] [CrossRef] [Green Version]
  3. ETSI. Network Functions Virtualisation. 2012. Available online: https://www.etsi.org/technologies/nfv (accessed on 1 August 2019).
  4. Akyildiz, I.F.; Nie, S.; Lin, S.C.; Chandrasekaran, M. 5G roadmap: 10 key enabling technologies. Comput. Netw. 2016, 106, 17–48. [Google Scholar] [CrossRef]
  5. Mijumbi, R.; Serrat, J.; Gorricho, J.L.; Bouten, N.; Turck, F.D.; Boutaba, R. Network Function Virtualization: State-of-the-Art and Research Challenges. IEEE Commun. Surv. Tutor. 2016, 18, 236–262. [Google Scholar] [CrossRef]
  6. Kreutz, D.; Ramos, F.M.V.; Veríssimo, P.E.; Rothenberg, C.E.; Azodolmolky, S.; Uhlig, S. Software-Defined Networking: A Comprehensive Survey. Proc. IEEE 2015, 103, 14–76. [Google Scholar] [CrossRef]
  7. Schmitt, P.; Landais, B.; Yang, F.Y. Control and User Plane Separation of EPC nodes (CUPS); Technical Report; 3rd Generation Partnership Project (3GPP): Valbonne, France, 2017. [Google Scholar]
  8. Sama, M.R.; An, X.; Wei, Q.; Beker, S. Reshaping the Mobile core network via function decomposition and network slicing for the 5G era. In Proceedings of the 2016 IEEE Wireless Communications and Networking Conference Workshops (WCNCW), Doha, Qatar, 3–6 April 2016; pp. 90–96. [Google Scholar]
  9. Taleb, T.; Corici, M.; Parada, C.; Jamakovic, A.; Ruffino, S.; Karagiannis, G.; Magedanz, T. EASE: EPC as a service to ease mobile core network deployment over cloud. IEEE Netw. 2015, 29, 78–88. [Google Scholar] [CrossRef]
  10. Droste, H.; Rost, P.; Doll, M.; Berberana, I.; Mannweiler, C.; Breitbach, M.; Banchs, A.; Puente, M.A. An adaptive 5G multiservice and multitenant radio access network architecture. Trans. Emerg. Telecommun. Technol. 2016, 27, 1262–1270. [Google Scholar] [CrossRef]
  11. Sahhaf, S.; Tavernier, W.; Rost, M.; Schmid, S.; Colle, D.; Pickavet, M.; Demeester, P. Network Service Chaining with Optimized Network Function Embedding Supporting Service Decompositions. Comput. Netw. 2015, 93 Pt 3, 492–505. [Google Scholar] [CrossRef]
  12. Yi, B.; Wang, X.; Huang, M. Design and evaluation of schemes for provisioning service function chain with function scalability. J. Netw. Comput. Appl. 2017, 93, 197–214. [Google Scholar] [CrossRef]
  13. Ochoa-Aday, L.; Cervelló-Pastor, C.; Fernández-Fernández, A.; Grosso, P. An Online Algorithm for Dynamic NFV Placement in Cloud-Based Autonomous Response Networks. Symmetry 2018, 10, 163. [Google Scholar] [CrossRef]
  14. Sun, J.; Huang, G.; Sun, G.; Yu, H.; Sangaiah, A.K.; Chang, V. A Q-Learning-Based Approach for Deploying Dynamic Service Function Chains. Symmetry 2018, 10, 646. [Google Scholar] [CrossRef]
  15. Mijumbi, R.; Serrat, J.; Gorricho, J.L.; Latre, S.; Charalambides, M.; Lopez, D. Management and orchestration challenges in network functions virtualization. IEEE Commun. Mag. 2016, 54, 98–105. [Google Scholar] [CrossRef]
  16. Herrera, J.G.; Botero, J.F. Resource Allocation in NFV: A Comprehensive Survey. IEEE Trans. Netw. Serv. Manag. 2016, 518–532. [Google Scholar] [CrossRef]
  17. Halpern, J.; Pignataro, C. Service Function Chaining (SFC) Architecture; draft-merged-sfc-architecture-00; Internet-Draft; Internet Engineering Task Force (IETF): Fremont, CA, USA, 2014. [Google Scholar]
  18. ETSI NFV ISG. GS NFV 001 V1.1.1 Network Functions Virtualisation (NFV); Use Cases; Technical Report; European Telecommunication Standards Institute: Valbonne, France, 2013. [Google Scholar]
  19. Nabi, M.; Toeroe, M.; Khendek, F. Availability in the cloud: State of the art. J. Netw. Comput. Appl. 2016, 60, 54–67. [Google Scholar] [CrossRef]
  20. Colman-Meixner, C.; Develder, C.; Tornatore, M.; Mukherjee, B. A Survey on Resiliency Techniques in Cloud Computing Infrastructures and Applications. IEEE Commun. Surv. Tutor. 2016, 18, 2244–2281. [Google Scholar] [CrossRef] [Green Version]
  21. ETSI NFV ISG. GS NFV-REL 003 V1.1.2 Network Functions Virtualisation (NFV); Reliability; Report on Models and Features for End-to-End Reliability Disclaimer; Technical Report; European Telecommunication Standards Institute: Valbonne, France, 2016. [Google Scholar]
  22. ETSI NFV ISG. GS NFV-REL 001 V1.1.1 Network Functions Virtualisation (NFV); Resiliency Requirements; Technical Report; European Telecommunication Standards Institute: Valbonne, France, 2015. [Google Scholar]
  23. Amaldi, E.; Coniglio, S.; Koster, A.M.; Tieves, M. On the Computational Complexity of the Virtual Network Embedding Problem. Electron. Notes Discret. Math. 2016, 52, 213–220. [Google Scholar] [CrossRef]
  24. Khan, A.; An, X.; Iwashina, S. Virtual Network Embedding for Telco-Grade Network Protection and Service Availability. Comput. Commun. 2016, 84, 25–38. [Google Scholar] [CrossRef]
  25. Pires, F.L.; Barán, B. A Virtual Machine Placement Taxonomy. In Proceedings of the 2015 15th IEEE/ACM International Symposium on Cluster, Cloud and Grid Computing (CCGrid), Shenzhen, China, 4–7 May 2015; pp. 159–168. [Google Scholar]
  26. Fischer, A.; Botero, J.F.; Beck, M.T.; de Meer, H.; Hesselbach, X. Virtual Network Embedding: A Survey. IEEE Commun. Surv. Tutor. 2013, 15, 1888–1906. [Google Scholar] [CrossRef]
  27. Nonde, L.; Elgorashi, T.E.H.; Elmirgahni, J.M.H. Virtual Network Embedding Employing Renewable Energy Sources. In Proceedings of the 2016 IEEE Global Communications Conference (GLOBECOM), Washington, DC, USA, 4–8 December 2016. [Google Scholar]
  28. Truong-Huu, T.; Gurusamy, M. Markov Chain Based Algorithm for Virtual Network Embedding in Optical Data Centers. In Proceedings of the 2016 IEEE 18th International Conference on High Performance Computing and Communications; IEEE 14th International Conference on Smart City; IEEE 2nd International Conference on Data Science and Systems (HPCC/SmartCity/DSS), Sydney, Australia, 12–14 December 2016; pp. 899–906. [Google Scholar]
  29. Li, Y.; Li, Y.; Shu, M.; Tang, J.; Peng, Y. An Efficient VNE Algorithm via Preferentially Mapping Important Nodes. In Proceedings of the 2016 IEEE 41st Conference on Local Computer Networks Workshops (LCN Workshops), Dubai, UAE, 7–10 November 2016; pp. 34–41. [Google Scholar]
  30. Haeri, S.; Trajković, L. Virtual Network Embedding via Monte Carlo Tree Search. IEEE Trans. Cybern. 2017. [Google Scholar] [CrossRef]
  31. Fajjari, I.; Aitsaadi, N.; Dab, B.; Pujolle, G. Novel adaptive virtual network embedding algorithm for Cloud’s private backbone network. Comput. Commun. 2016, 84, 12–24. [Google Scholar] [CrossRef]
  32. Moens, H.; Turck, F.D. VNF-P: A model for efficient placement of virtualized network functions. In Proceedings of the 10th International Conference on Network and Service Management (CNSM) and Workshop, Rio de Janeiro, Brazil, 17–21 November 2014; pp. 418–423. [Google Scholar]
  33. Mijumbi, R.; Serrat, J.; Gorricho, J.L.; Bouten, N.; Turck, F.D.; Davy, S. Design and evaluation of algorithms for mapping and scheduling of virtual network functions. In Proceedings of the 2015 1st IEEE Conference on Network Softwarization (NetSoft), London, UK, 13–17 April 2015; pp. 1–9. [Google Scholar]
  34. Qu, L.; Assi, C.; Shaban, K. Network function virtualization scheduling with transmission delay optimization. In Proceedings of the NOMS 2016—2016 IEEE/IFIP Network Operations and Management Symposium, Istanbul, Turkey, 25–29 April 2016; pp. 638–644. [Google Scholar]
  35. Qu, L.; Assi, C.; Shaban, K. Delay-Aware Scheduling and Resource Optimization with Network Function Virtualization. IEEE Trans. Commun. 2016. [Google Scholar] [CrossRef]
  36. Riggio, R.; Bradai, A.; Harutyunyan, D.; Rasheed, T.; Ahmed, T. Scheduling Wireless Virtual Networks Functions. IEEE Trans. Netw. Serv. Manag. 2016, 13, 240–252. [Google Scholar] [CrossRef] [Green Version]
  37. Bari, F.; Chowdhury, S.R.; Ahmed, R.; Boutaba, R.; Duarte, O.C.M.B. Orchestrating Virtualized Network Functions. IEEE Trans. Netw. Serv. Manag. 2016, 13, 725–739. [Google Scholar] [CrossRef]
  38. Taleb, T.; Bagaa, M.; Ksentini, A. User Mobility-Aware Virtual Network Function placement for Virtual 5G Network Infrastructure. In Proceedings of the 2015 IEEE International Conference on Communications (ICC), London, UK, 8–12 June 2015; pp. 3879–3884. [Google Scholar]
  39. ETSI NFV ISG. GS NFV-MAN 001 V1.1.1 Network Functions Virtualisation (NFV); Management and Orchestration; Technical Report; European Telecommunications Standards Institute: Valbonne, France, 2014. [Google Scholar]
  40. Mehraghdam, S.; Karl, H. Placement of services with flexible structures specified by a YANG data model. In Proceedings of the 2016 IEEE NetSoft Conference and Workshops (NetSoft), Seoul, Korea, 6–10 June 2016; pp. 184–192. [Google Scholar]
  41. Bouten, N.; Claeys, M.; Mijumbi, R.; Famaey, J.; Latré, S.; Serrat, J. Semantic validation of affinity constrained service function chain requests. In Proceedings of the 2016 IEEE NetSoft Conference and Workshops (NetSoft), Seoul, Korea, 6–10 June 2016; pp. 202–210. [Google Scholar]
  42. Eramo, V.; Miucci, E.; Ammar, M.; Lavacca, F.G. An Approach for Service Function Chain Routing and Virtual Function Network Instance Migration in Network Function Virtualization Architectures. IEEE/ACM Trans. Netw. 2017, 25, 2008–2025. [Google Scholar] [CrossRef]
  43. Scheid, E.J.; Machado, C.C.; dos Santos, R.L.; Schaeffer-Filho, A.E.; Granville, L.Z. Policy-based dynamic service chaining in Network Functions Virtualization. In Proceedings of the 2016 IEEE Symposium on Computers and Communication (ISCC), Messina, Italy, 27–30 June 2016; pp. 340–345. [Google Scholar]
  44. Wen, T.; Yu, H.; Sun, G.; Liu, L. Network function consolidation in service function chaining orchestration. In Proceedings of the 2016 IEEE International Conference on Communications (ICC), Kuala Lumpur, Malaysia, 22–27 May 2016; pp. 1–6. [Google Scholar]
  45. Lin, T.; Zhou, Z.; Tornatore, M.; Mukherjee, B. Demand-Aware Network Function Placement. J. Light. Technol. 2016, 34, 2590–2600. [Google Scholar] [CrossRef]
  46. Pham, C.; Tran, N.H.; Ren, S.; Saad, W.; Hong, C.S. Traffic-aware and Energy-efficient vNF Placement for Service Chaining: Joint Sampling and Matching Approach. IEEE Trans. Serv. Comput. 2017. [Google Scholar] [CrossRef]
  47. Wang, L.; Lu, Z.; Wen, X.; Knopp, R.; Gupta, R. Joint Optimization of Service Function Chaining and Resource Allocation in Network Function Virtualization. IEEE Access 2016, 4, 8084–8094. [Google Scholar] [CrossRef]
  48. Moens, H.; Turck, F.D. Customizable Function Chains: Managing Service Chain Variability in Hybrid NFV Networks. IEEE Trans. Netw. Serv. Manag. 2016, 13, 711–724. [Google Scholar] [CrossRef]
  49. Khan, M.M.A.; Shahriar, N.; Ahmed, R.; Boutaba, R. Multi-Path Link Embedding for Survivability in Virtual Networks. IEEE Trans. Netw. Serv. Manag. 2016, 13, 253–266. [Google Scholar] [CrossRef] [Green Version]
  50. Mechtri, M.; Ghribi, C.; Zeghlache, D. A Scalable Algorithm for the Placement of Service Function Chains. IEEE Trans. Netw. Serv. Manag. 2016. [Google Scholar] [CrossRef]
  51. Beck, M.T.; Botero, J.F. Scalable and coordinated allocation of service function chains. Comput. Commun. 2017, 102, 78–88. [Google Scholar] [CrossRef]
  52. Internet Topology Zoo. 2010. Available online: http://www.topology-zoo.org (accessed on 1 August 2019).
Figure 1. (a) Decomposition main types: decomposition into sub-functions or control/user planes. (b) Example of independent scaling of one sub-function in the decomposed user plane. (c) Example of path types, which might be generated after decomposing a single NF.
Symmetry 11 01173 g001
Figure 2. An example of building path identity and catalogue of physical paths.
Symmetry 11 01173 g002
Figure 3. Experiment frame work design.
Symmetry 11 01173 g003
Figure 4. The counters for service requests with: (a) specific number of nodes and specific number of edges; (b) specific number of virtual edges and specific number of paths.
Symmetry 11 01173 g004
Figure 5. Average execution time of 10 simulation runs vs. the number of physical nodes over 6 scenarios with 3 types of service requests and 2 types of physical networks.
Symmetry 11 01173 g005
Figure 6. Average execution time for service requests vs. (a) the number of nodes and edges; (b) the number of edges and paths.
Symmetry 11 01173 g006
Figure 7. Average acceptance ratio for: (a) Simple-Small, (b) Simple-Large, (c) Multiple-Small, and (d) Multiple-Large scenarios. The shaded background behind each curve represents the 95% confidence interval on the reported average values.
Symmetry 11 01173 g007
Figure 8. Average acceptance ratio for service requests vs. (a) the number of nodes and edges; (b) the number of paths and edges.
Symmetry 11 01173 g008
Figure 9. Average embedding cost for: (a) Simple-Small, (b) Simple-Large, (c) Multiple-Small, and (d) Multiple-Large scenarios. The shaded background behind each curve represents the 95% confidence interval on the reported average values.
Symmetry 11 01173 g009
Figure 10. Average embedding cost for service requests with: (a) specific number of nodes and specific number of edges; (b) specific number of paths and specific number of edges.
Symmetry 11 01173 g010
Figure 11. Average cost to average revenue for: (a) Simple-Small, (b) Simple-Large, (c) Multiple-Small, and (d) Multiple-Large scenarios. The shaded background behind each curve represents the 95% confidence interval on the reported average values.
Symmetry 11 01173 g011
Figure 12. Average embedding cost to average revenue for service requests vs. (a) the number of nodes and edges; (b) the number of paths and edges.
Symmetry 11 01173 g012
Table 1. Comparison of the most recent related works.
Ref#StrategyScenarioContribution
Virtual Network Embedding (VNE)
[27]ExactCloudIntroduced a Green Virtual Network Embedding (GVNE) framework to
minimize energy consumption.
[28]HeuristicData centerProposed Markov Chain-based Algorithm for VNE (MCA-VNE) to
minimizerequest rejection and maximize revenues.
[29]HeuristicCloudProposed SR-VNE algorithm to maximize revenue and acceptance in
long term.
[30]HeuristicService
provider
network
Proposed MaVEn-M and MaVEn-S algorithms using the
multi-commodity flow and Markov decision processes to
maximize revenue.
[31]heuristicCloudproposed Adaptive-VNE algorithm to maximize revenue, acceptance,
and end-user satisfaction.
Virtual Network Function Placement (VNF-P)
[33]Heuristic,
Metaheuristic
Operator
network
Proposed three greedy and a tabu search-based algorithms for VNF
embedding and process scheduling to maximize revenue.
[34,35]Exact,
Metaheuristic
Operator
network
Formulated VNFs chaining scheduling as problem as a series of
scheduling decisions for services to minimize scheduling latency.
[36]Exact,
Heuristic
Mobile
network
Proposed a proof of concept that NFV management can be extended to
the radio segment of mobile network.
[37]Exact,
Heuristic
Operator
network
Proposed an ILP formulation for VNF orchestration problem and a
dynamic programming heuristic to minimize the operational cost and
physical resource fragmentation.
[38]HeuristicOperator
cloud
Proposed a placement algorithms with two objectives and used
bargaining Nash theory to find a fair trade-off between them to
minimize end-to-end path and user’s mobility.
Service Function Chaining Placement Problem (SFC-PP)
[24]HeuristicOperator
network
Proposed a primary backup redundant scheme mapping to maximize
the service continuity.
[11]Exact,
Heuristic
Service
provider
network
Proposed NF decomposition selection based on VNF clustering using
virtualization technique type to minimize mapping cost.
[12]Exact,
Heuristic
Operator
network
Proposed a SFC placement with function scalability to realize the
dynamic operations on NFV.
[42]HeuristicOperator
network
Proposed a consolidation algorithm based on migration policy to reduce
the cost of QoS degradation during VNF migration.
[43]HeuristicNFV networkPresented an automatic policy-based approach to solve service chain
composition on NFV ot reduce operational cost.
[44]Exact,
Heuristic
Operator
network
Proposed a NF Consolidation on NFV to minimize resource occupation
by reducing the number of VNF.
[45]Exact,
Heuristic
Optical
network
Proposed placement algorithm based on game theory to minimize
mapping cost.
[46]HeuristicData centerOptimized VNF placement and service chaining using a Markov
approximation with many-to-one matching theory in coordinated
approach to minimize the cost.
[47]Exact,
Heuristic
NFVIProposed a coordinated approach to jointly optimize NFV-RA in the
three stages of the problem.
[48]ExactHybrid
network
Proposed a customizable SFC composition to minimize the mapping and
the management cost.
[49]Exact,
Heuristic
Service
provider
network
Proposed a survivability for SFC with multi-path link mapping in order
to maximize survivability and minimize resource redundancy
[50]HeuristicCloudProposed an eigen-decomposition based approach to maximize
revenues.
[51]HeuristicNFV networkProposed a coordinated placement algorithm that solves service chain
composition and embedding with reasonable execution time in
large-scale physical networks.
Table 2. Compared schemes.
NotationDescription
ILP-AILP-based scheme of the benchmark.
DSBMHeuristic scheme of the benchmark.
ILP-PProposed optimal implementation of path mapping, which is ILP-based scheme.
DcPSMProposed heuristic implementation of path mapping approach.
Table 3. Physical network topologies.
TopologyNodes Links
BT Europe24 37
Interout110 148
BT + 24 65
Int + 110 180
TopologyNodes E 3 E 4
Synthetic101421
305064
6098133
90156198
120227265
150265333
Table 4. Experimental Scenarios.
RunScenarioRequest TypeTopology
LongSimple-SmallSimple/ForkingBT Europe
Multiple-SmallMultipleBT Europe
Simple-LargeSimple/ForkingInterout
Multiple-LargeMultipleInterout
S P 5 B T , S P 10 B T , S P 20 B T P 5 , P 10 , P 20 BT Europe
S P 5 B T + , S P 10 B T + , S P 20 B T + P 5 , P 10 , P 20 BT +
S P 5 I n t , S P 10 I n t , S P 20 I n t P 5 , P 10 , P 20 Interout
S P 5 I n t + , S P 10 I n t + , S P 20 I n t + P 5 , P 10 , P 20 Int +
Short S P 5 E 3 , S P 5 E 4 P 5 Synthetic
S P 10 E 3 , S P 10 E 4 P 10 Synthetic
S P 20 E 3 , S P 20 E 4 P 20 Synthetic
Table 5. Total average cost to revenue for all solved requests in all long simulation run scenarios.
SchemeTotal Number of Solved Requests AR R c / r
DcPSM128,52847.46%0.3629
DSBM128,52856.21%1.0775
ILP-A59,639100%0.5461
ILP-P122,417100%0.5299
AR is the acceptance ratio, and R c / r is the ratio of average cost to revenue.