Article

Simulation of Passenger Evacuation Process in Cruise Ships Based on A Multi-Grid Model

1
School of Information Technology, City College, Wuhan University of Science and Technology, Wuhan 430083, China
2
School of Transportation, Wuhan University of Technology, Wuhan 430063, China
*
Author to whom correspondence should be addressed.
Symmetry 2019, 11(9), 1166; https://doi.org/10.3390/sym11091166
Submission received: 13 August 2019 / Revised: 11 September 2019 / Accepted: 12 September 2019 / Published: 15 September 2019

Abstract

:
The evacuation of the cruise ship is directly related to the safety of passengers during accidents. The method for avoiding and reducing casualties in accidents has become a research frontier of maritime safety. This paper presents the simulation of a passenger evacuation process using a multi-grid model. In the model, directions of passengers’ movement are extended and the relationship between passengers’ orientation and the walking speed under the inclining condition is also analyzed in detail. Considering the space layout, the attraction of the mainstream crowd and exclusion between individuals, the probability of passengers’ transfer between grids is established. The deck of the cruise ship is taken as the evacuation scenario and four parameters are defined for the scenario according to International Maritime Organization (IMO) guidelines. The process of evacuation in the cruise ship is simulated under upright and inclining conditions. Through the analysis of simulation results, evacuation bottleneck data and the relation between inclined angles and evacuation time are obtained. This work may provide a reference for formulating emergency evacuation plans for cruise ships.

1. Introduction

As a popular tourism industry, cruise vacations attract a large number of tourists [1]. Cruises are not only public places that gather large crowds, but also structures on the sea. Therefore, the process of passenger evacuation should be specially considered when the ship is damaged, tilted, or even sunk.
In response to this situation, the International Maritime Organization (IMO) Maritime Safety Committee (MSC) issued the “Guidelines for Evacuation Analysis for New and Existing Passenger Ships”. The IMO Guidelines made relevant rules on the evacuation simulation scenarios for passenger ships. The scenario parameters are grouped into four categories, as follows: Geometrical, population, environmental, and procedural [2]. The geometrical category comprises the arrangement of escape routes, the locations of obstacles, partial unavailability, and initial distribution conditions of passengers. The population category includes statistical parameters of passengers. The environmental category contains the static and dynamic conditions of the ship. Finally, the procedural category involves the assistance from the crews.
In order to obtain useful information affecting the evacuation of ships, many researchers gathered data by investigating or experimenting with the accidents of various passenger ships. Vanem et al. [3,4,5] collected historical data of passenger ship accidents involving fire, collision, and grounding. The results show that collisions may be riskier than fire, because collisions lead to short evacuation times compared to fire. Pagiaziti et al. [6] collected data from three types of accidents of passenger ships, involving collision, grounding, and contact, from the period from 1990 to 2012, and constructed several quantitative analysis models for different risks. Galea et al. [7,8,9] proposed the index of evacuation simulation based on evacuation experimental data from two cruise ships and compared dates with results of evacuation simulation by EVI [10] and maritimeEXODUS [11] software. Gwynne et al. [12] organized an evacuation experiment on a small passenger ship to conclude the regularity of passengers’ motion. Elnabawybahriz et al. [13] considered the Costa Concordia accident as the object and introduced the process of the accident. By analyzing other maritime accidents, they described a series of procedural problems existing in the current evacuation plans. Kim et al. [14] carried out the pedestrian walking experiment under the inclining condition of the ship. The results were applied to the study of pedestrian evacuation during tilting and sinking conditions on the ship.
Due to the high cost of performing ship experiments, many researchers studied ship evacuations by simulation. Ha et al. [15] considered the interplay between passengers and established an evacuation model of passengers in a rolling ship by using a cellular automaton. Yuan et al. [16] presented a simulation method based on a neighborhood particle swarm optimization algorithm, wherein they mainly focused on solving the conflict problem of the ship’s staff in the model. Nevalainen et al. [17] studied from three situations which contained a human response to environmental stimuli in accidents, way finding under an emergency and social environment, and panic, and investigated the human environment interaction during evacuation. Zhu et al. [18] put forward an accessibility evaluation model based on a data envelopment analysis. They applied the model to two ships and evaluated the passenger evacuation capacity. Balakhontceva et al. [19,20,21] applied the multi-agent model and the social force model to the ship evacuation simulation. They developed a program to simulate the passengers’ movement on deck and tested the simulation process of the passenger evacuation based on a cloud platform. Li et al. [22] established the topological model of evacuation routes and indicated that the optimal evacuation route could be proposed for each passenger with a Dijkstra algorithm. Park et al. [23] established an evacuation model of two ships based on SIMPEV [24] software and performed experiments on the two ships. By comparing the simulation results with the experimental data, it was found that the SIMPEV software met the acceptance criteria of the data. Ginnis et al. [25] applied the “Virtual Environment for Life on Ships” system to the three-dimensional visualization model of the ship evacuation simulation and tested the system in a rolling passenger ship. Kim et al. [26] defined the attributes and behaviors of evacuated individuals based on the PECS model [27]. The PECS was a model used to simulate human action in a social environment. This model was consisted of physical conditions, emotional state, cognitive capabilities, and social status. They considered the individual behavior model and the evacuation model separately and defined each individual as an agent with thinking ability. Liu et al. [28] simulated the evacuation process of an aircraft carrier with EXODUS [11] software, and obtained the relationship between exit width and escape time from the simulation results. Ni et al. [29,30,31] proposed an agent-based social force model and the interaction between passengers and obstacles was taken into account. Moreover, the influence of life jackets on passengers’ mobility was also added into the model and they simulated the evacuation process of passengers in different scenarios. Sarvari et al. [32] developed a flexible-board grid-based model, where one node could include more than one pedestrian in the meanwhile. They simulated several scenarios with the model and, from the simulation results, found pedestrian characteristics had the greatest impact on evacuation. The layout of evacuation scenario has an impact on the moving route of passengers and thus affects the evacuation efficiency. However, the above studies are mainly related to rules of pedestrian evacuation.
This paper adopts a multi-grid model to simulate the evacuation process of cruise ships. In this model, we consider the relationship between the passengers’ orientation and the walking speed when the cruise ship under inclining condition as an important factor. Additionally, we analyze the simulation result to find out the evacuation bottleneck and the influence of inclined angles on evacuation time. The rest of this paper is organized as follows: Section 2 defines the parameters of the evacuation scenario based on the IMO Guidelines. The multi-grid evacuation model of the cruise ship is established in the Section 3. In Section 4, evacuation simulation experiments are carried out and results are analyzed based on the layout of the scenario. The last section presents the conclusions.

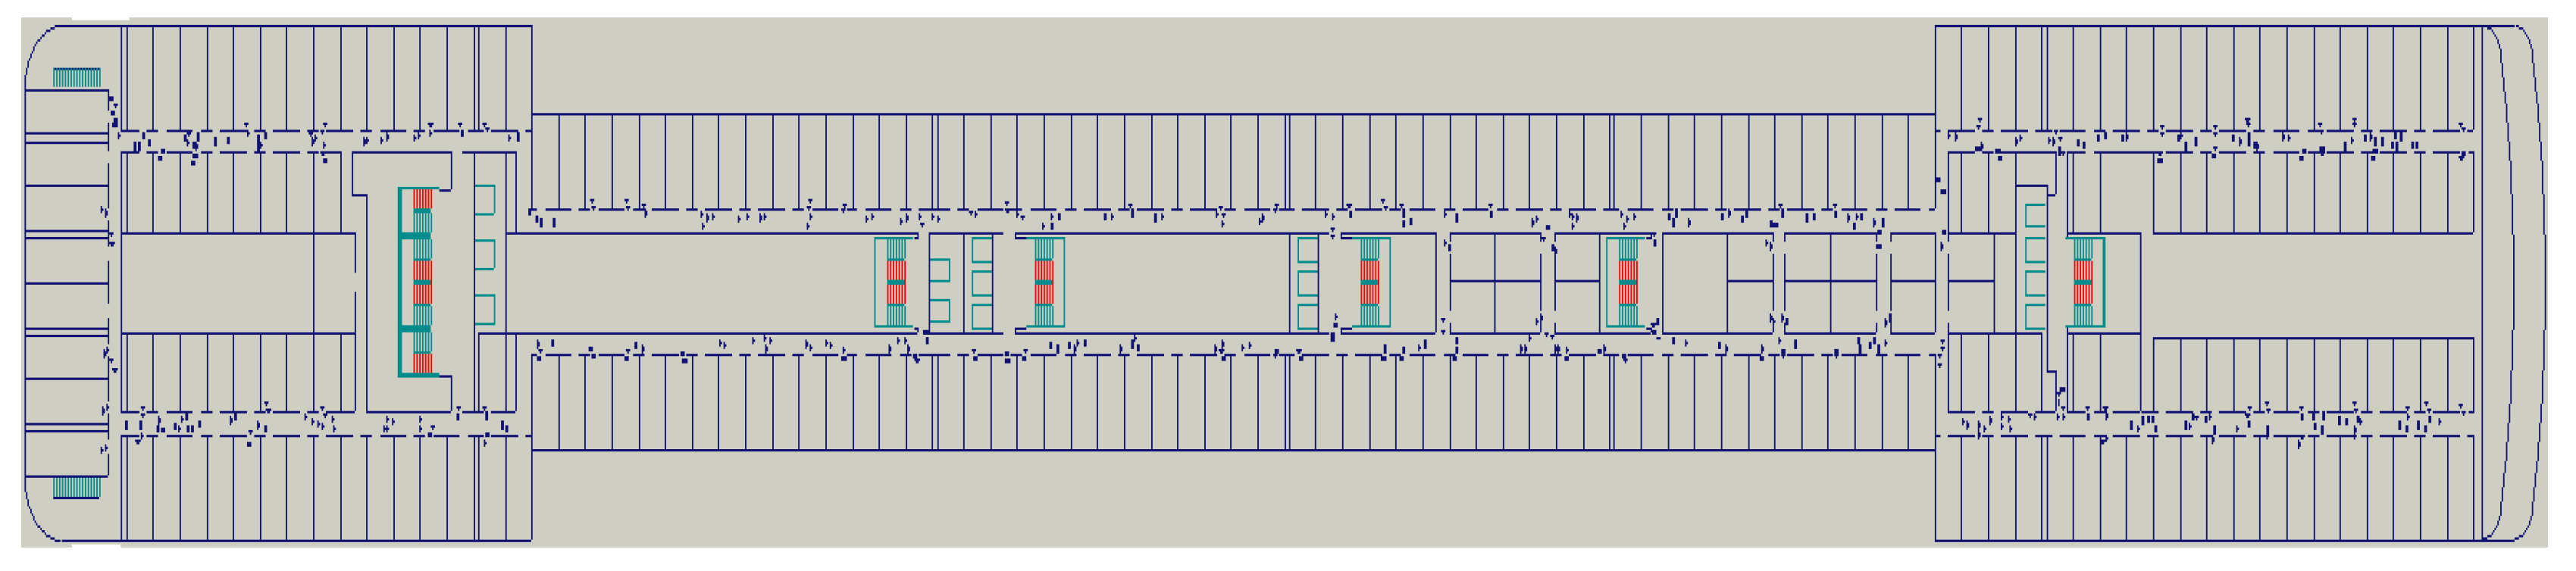
2. The Evacuation Scenario

Passengers’ activity areas are mainly on the deck, so one deck of the cruise ship was selected as the evacuation scenario and four parameters of the scenario were set according to the IMO Guidelines.

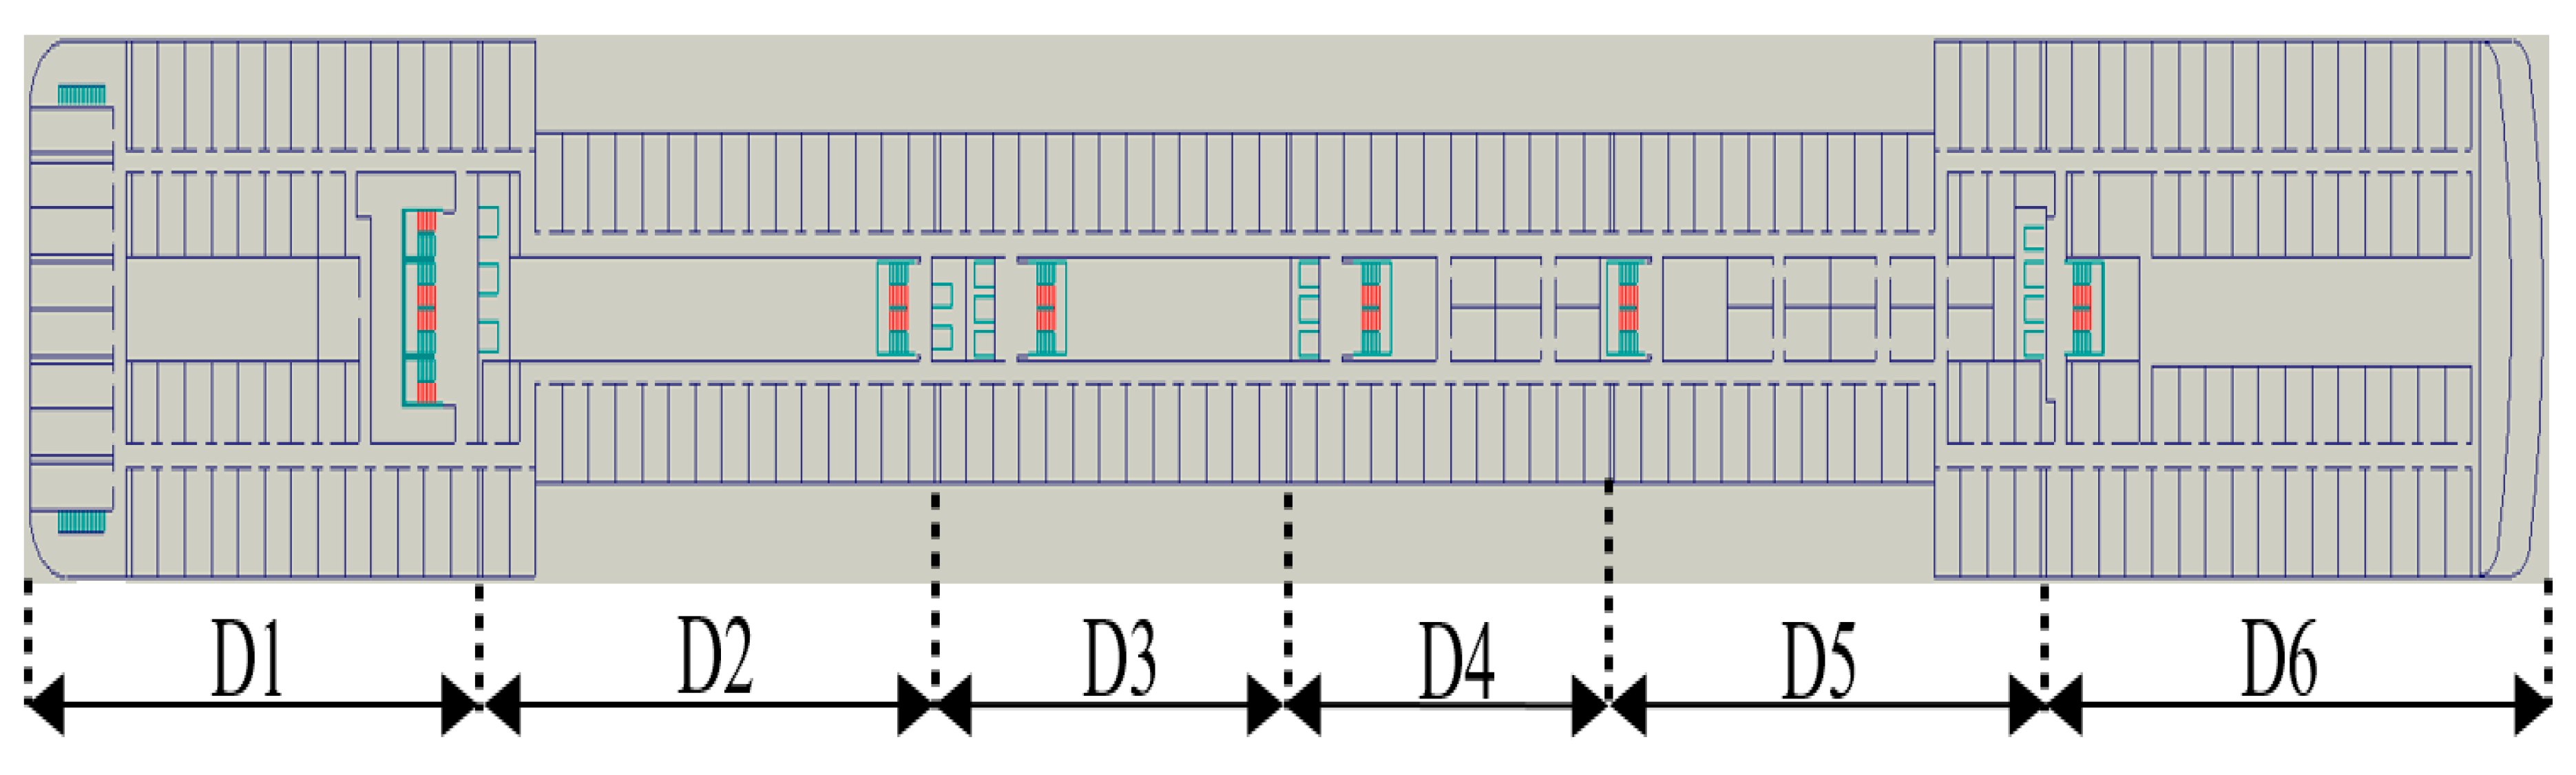
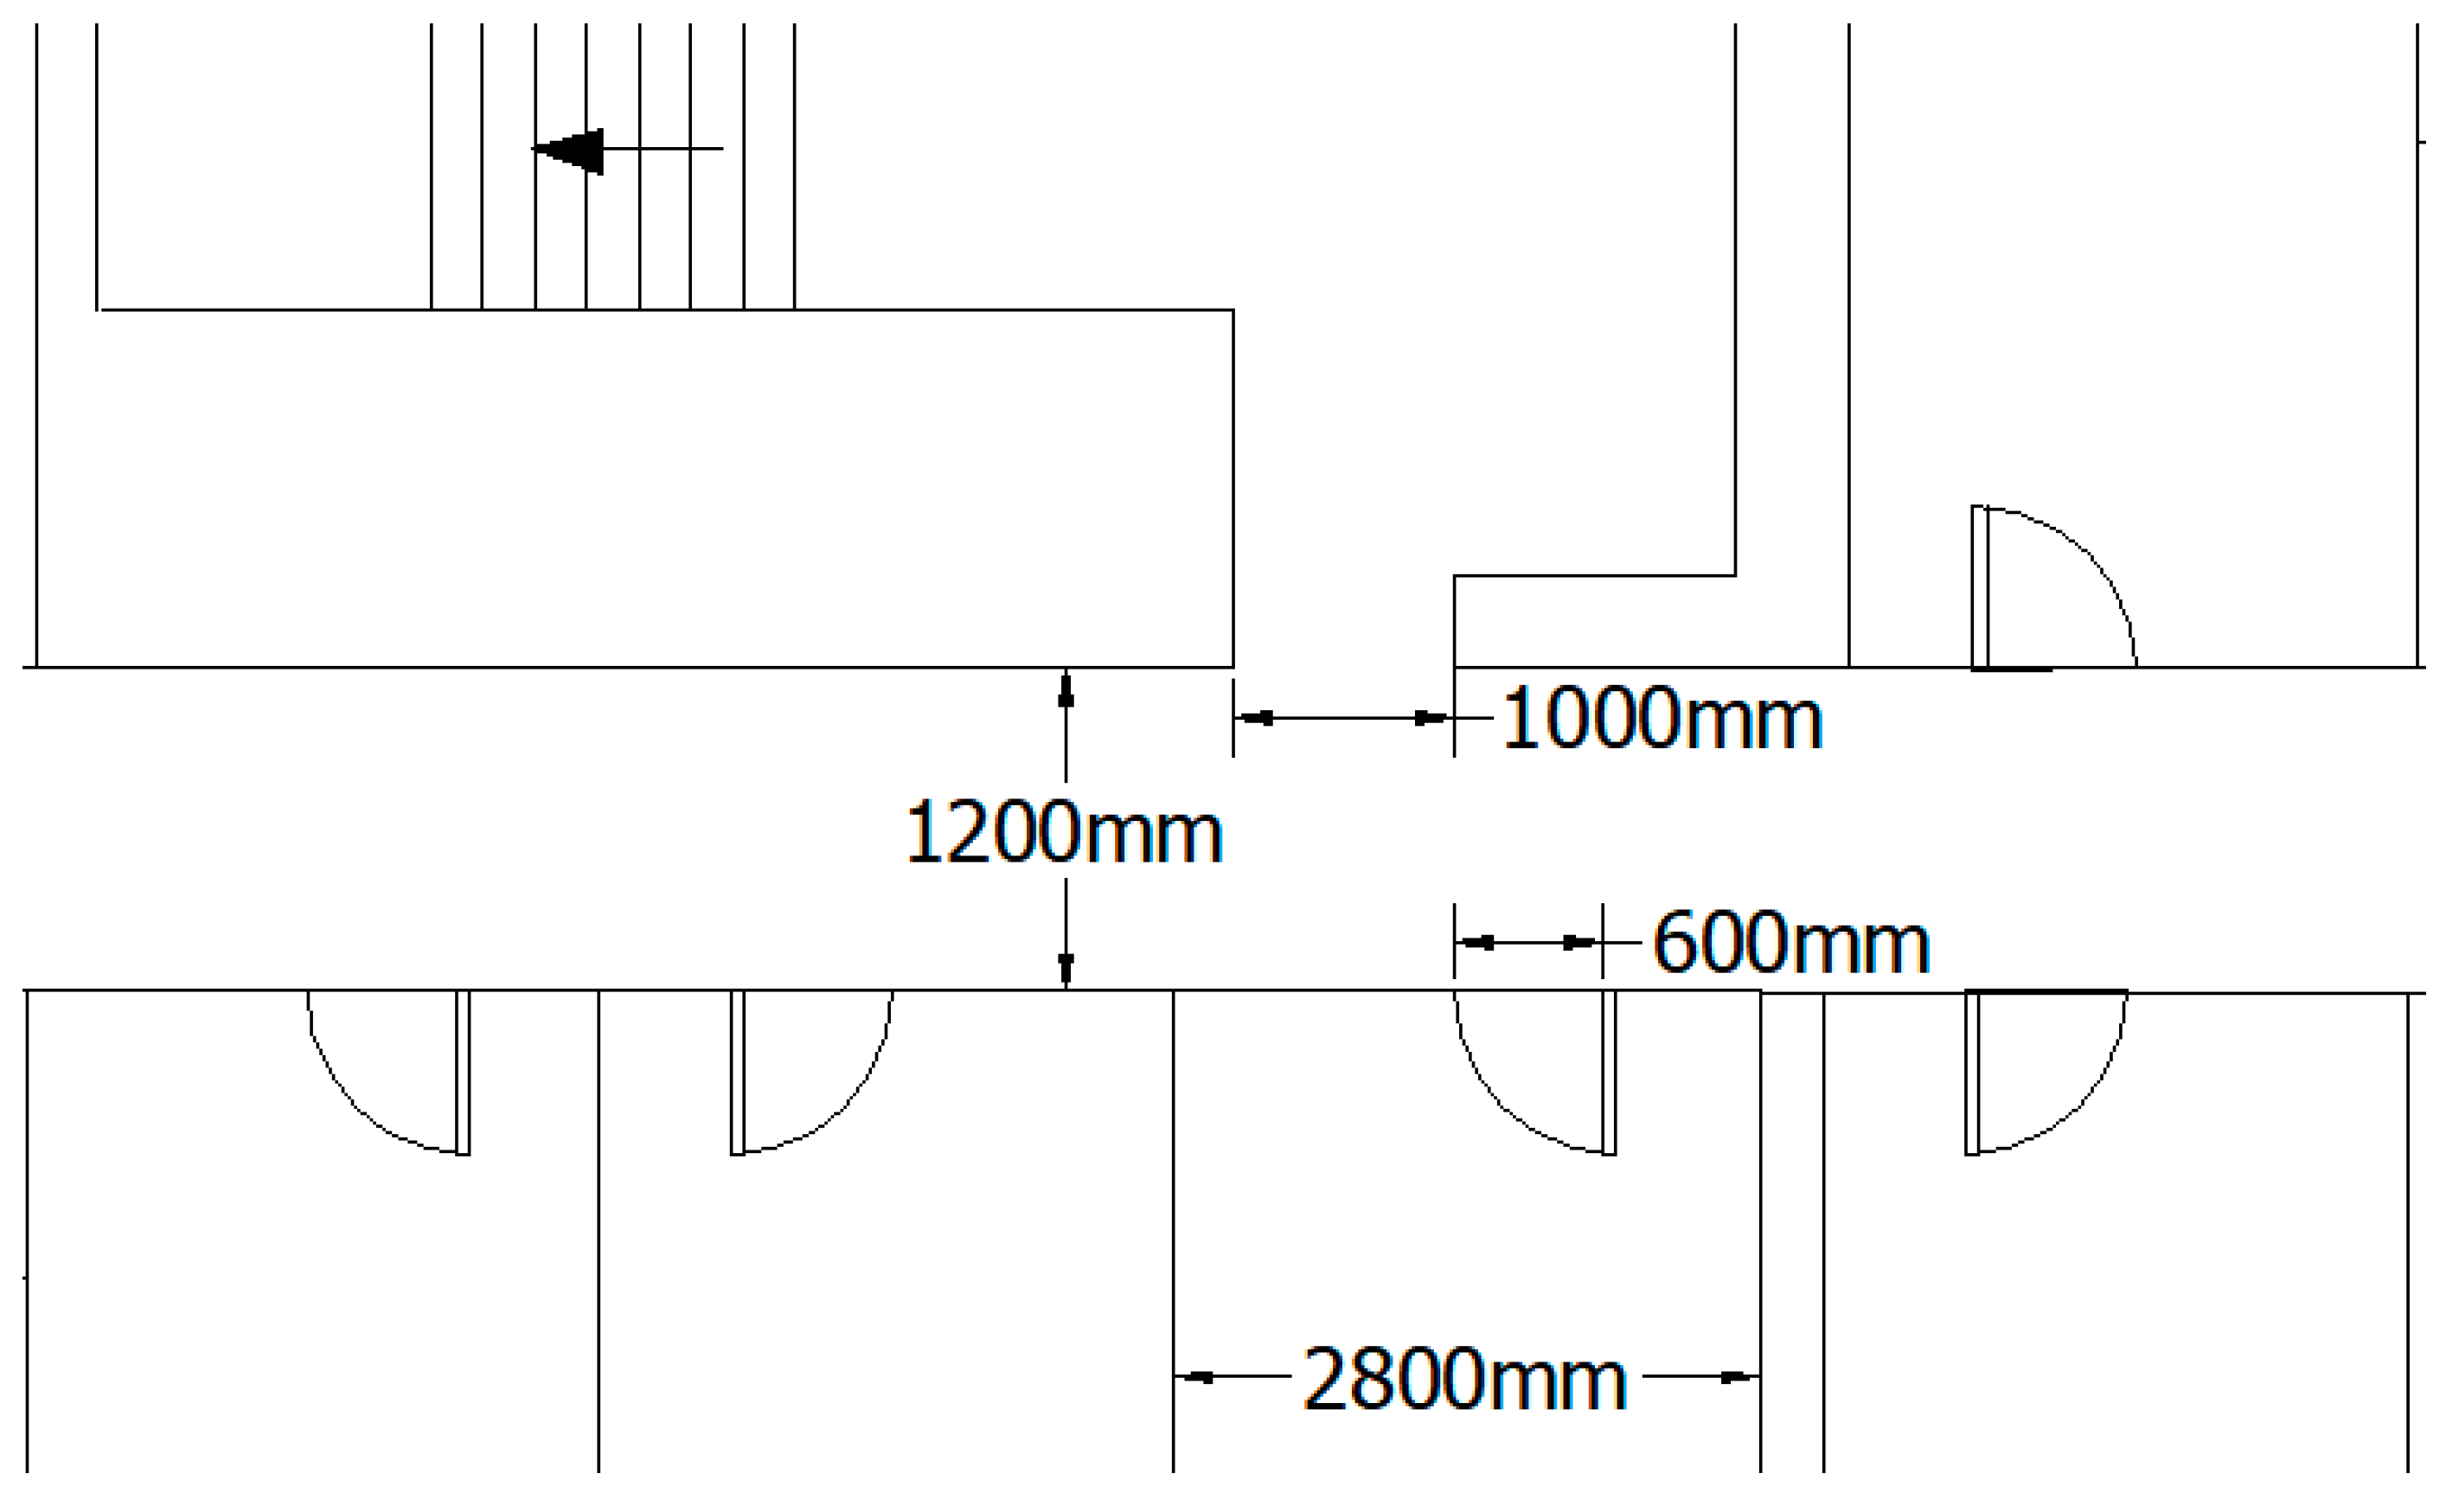
2.1. Geometrical Category

The deck is divided into six areas (D1–D6) according to locations of fire doors, as shown in Figure 1. There are 247 cabins on the deck and a total of 494 passengers with two passengers per cabin. The stern stairs are distributed on portside and starboard and the remaining six stairs are distributed near the centerline of the deck.
The typical sizes of the deck are shown in Figure 2. The cabin width is 2800 mm, the door width is 600 mm, the corridor width is 1200 mm, and the width of the stair entrance is 1000 mm.

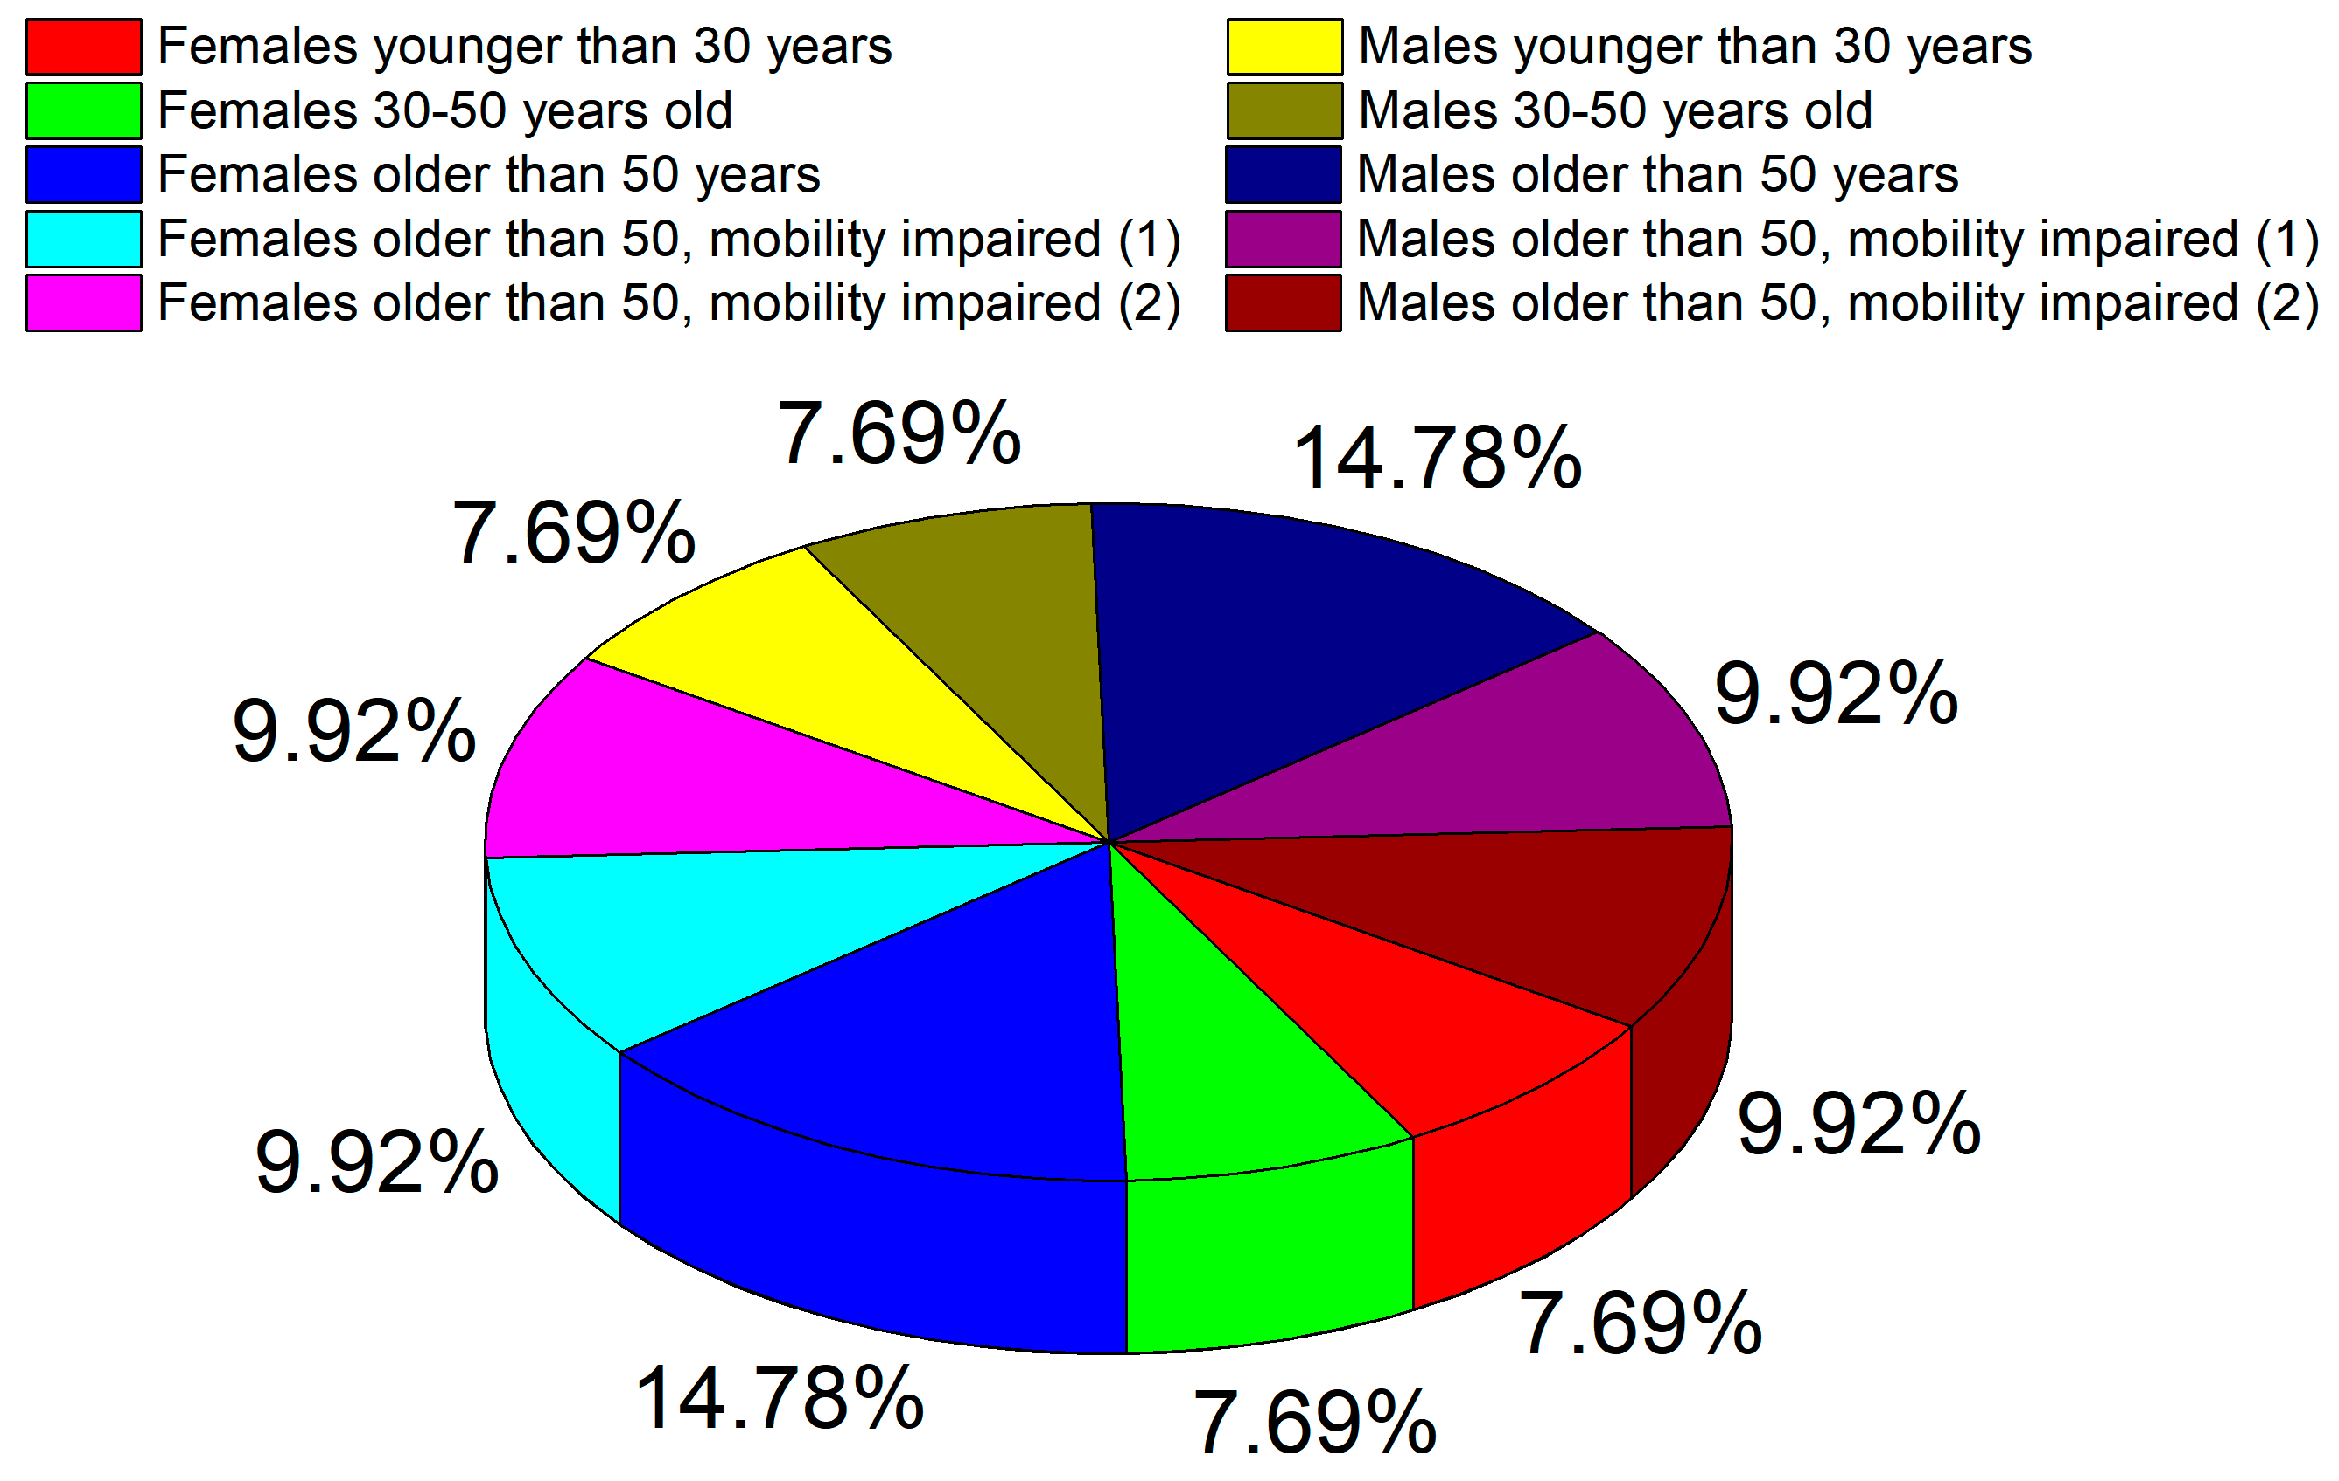
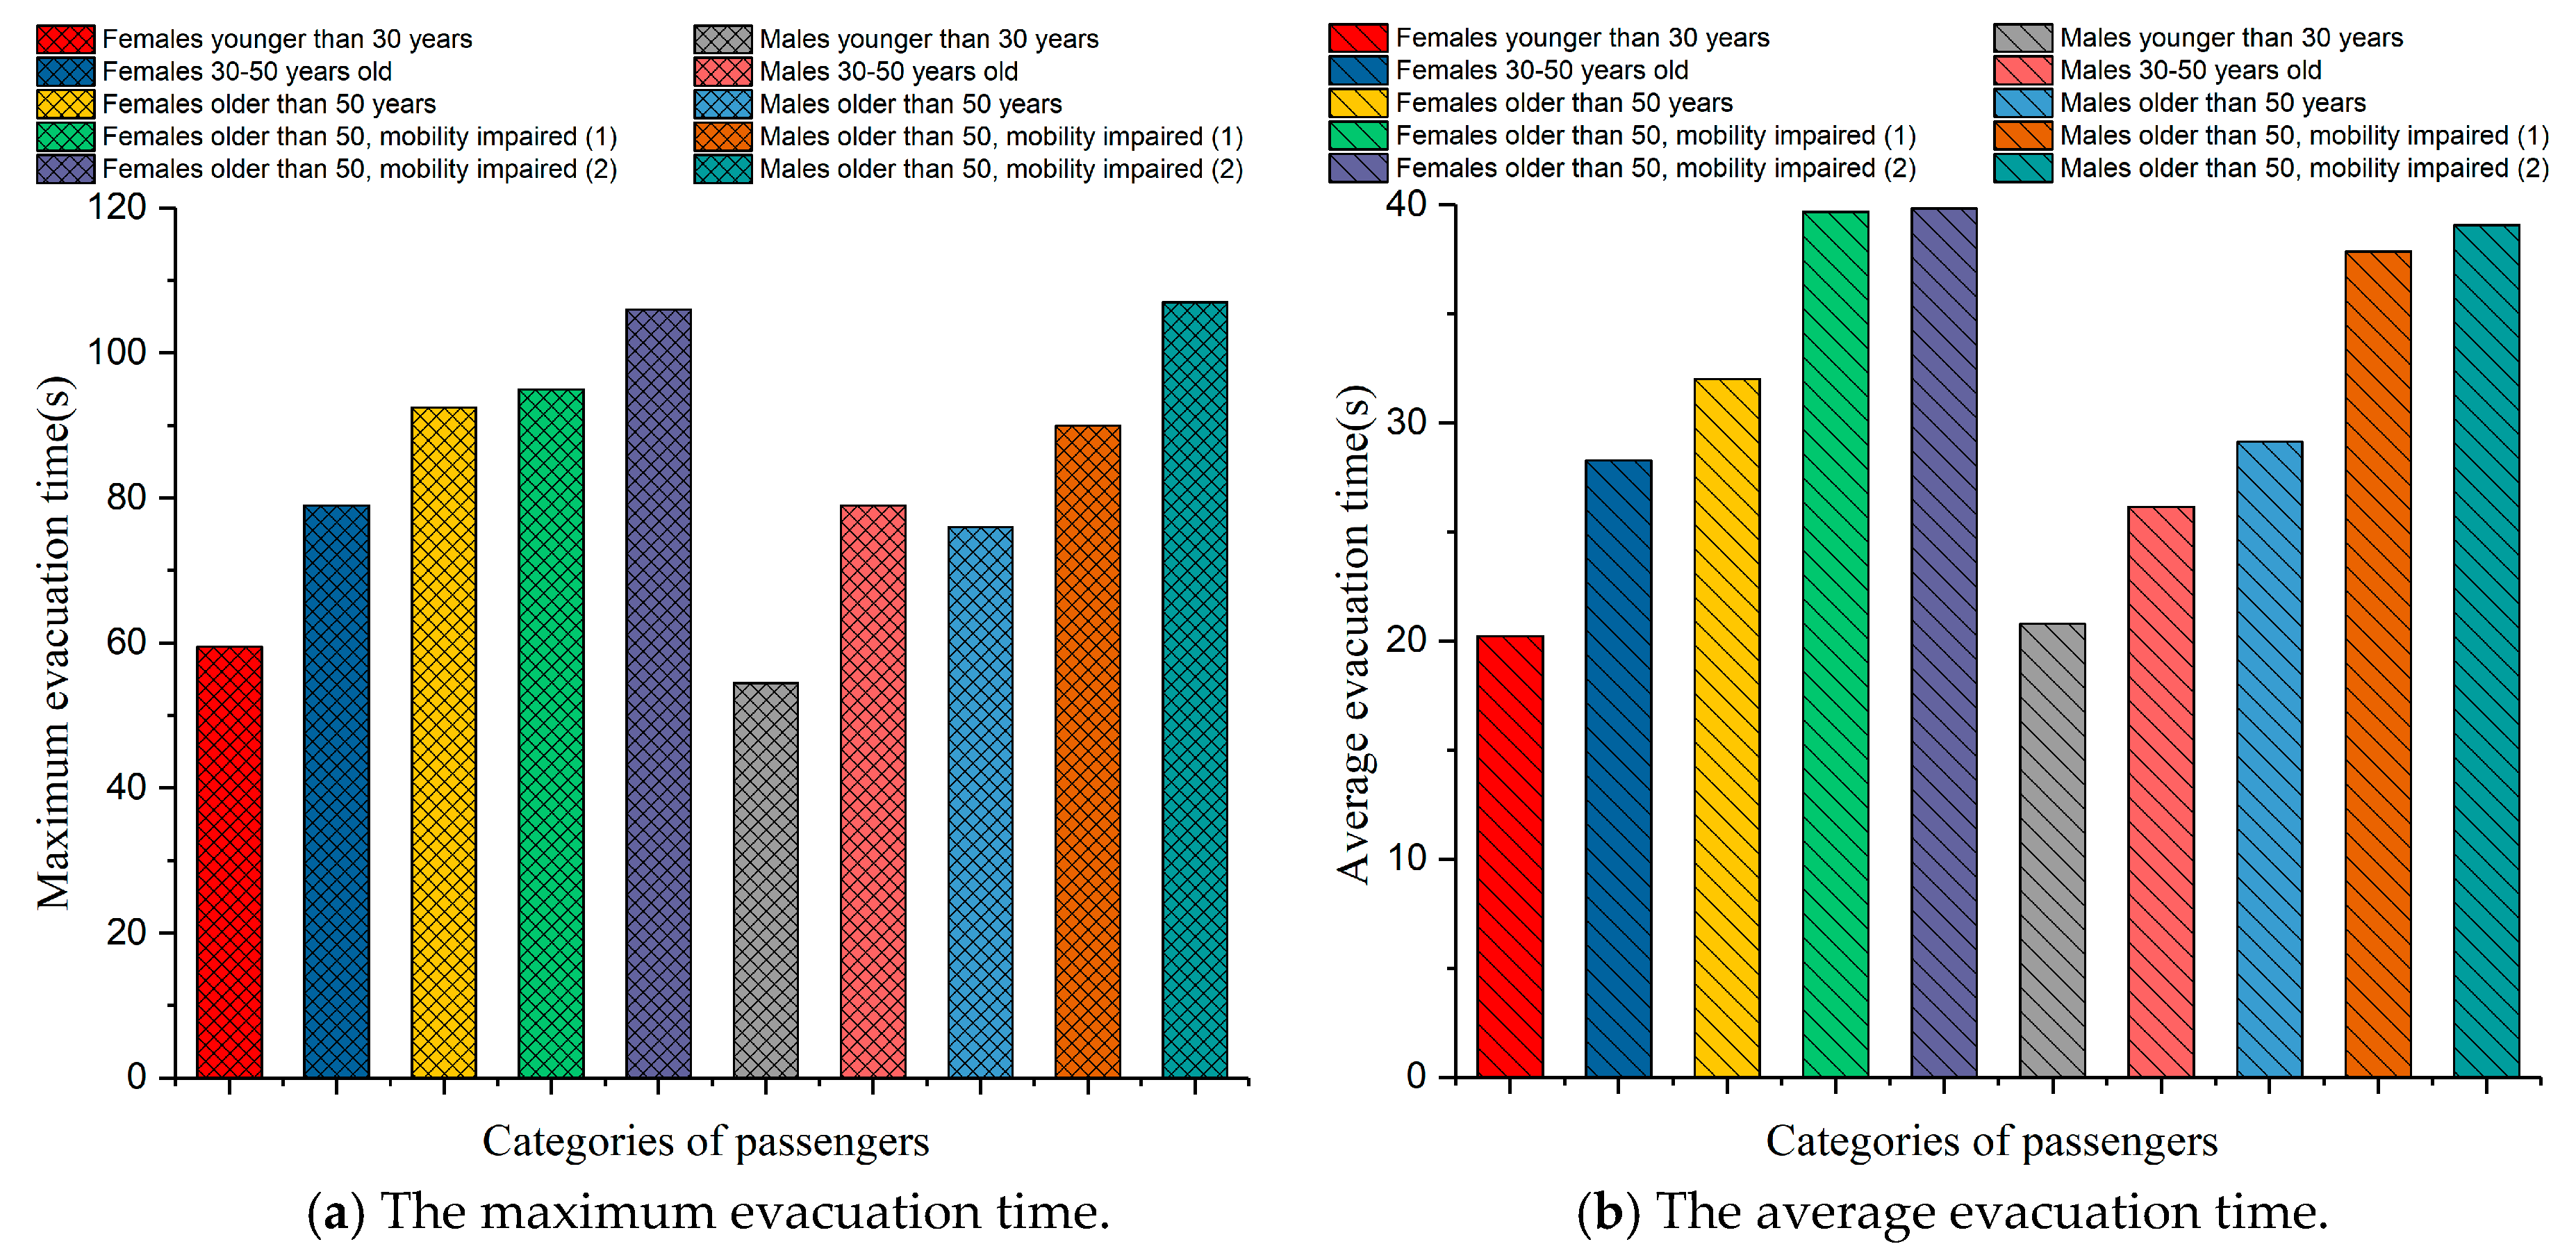
2.2. Population Category

Two important factors, the gender and age of passengers, are directly related to the walking speed of passengers and should be considered in an evacuation model. In the IMO Guidelines, passengers are divided into ten categories, as shown in Table 1.

2.3. Environmental Category

The static condition of ship refers to the upright condition, and the dynamic condition includes the condition of inclination, rolling, etc. This paper mainly studies the passenger evacuation process when the ship is under upright and inclining conditions. The inclining condition contains trim and heeling.
Trim is the difference between the draught forward and the draught aft. If the draught forward is greater than the draught aft it is called trim by bow. If the draught aft is greater, it is called trim by stern. Trim is also stated as trim angles, θ, and angles of trim by the bow are positive while angles of trim by the stern are negative. Figure 3a shows the ship under the condition of trim by the bow, where the trim angle is positive. Heeling is defined as when the ship lists to port or starboard and heeling angles are symbolized by ϕ. If the ship lists to port, heeling angles are negative. If the ship lists to starboard, heeling angles are positive. Figure 3b shows the ship listing to starboard and the heeling angle is positive. If the ship is under the upright condition, the trim and heeling angles are equal to 0.
Table 1 shows the average walking speed of passengers on flat terrain. If the cruise ship is under the inclining condition, the ground would change from the flat terrain to the tilted terrain and the walking speed of passengers would also change. Bles et al. [33] made an experiment on the walking speed of passengers in the passage and stair area and the results showed that the walking speed of passengers decreased as long as the ship was under the inclining condition. Lee et al. [34] carried out an experiment on the walking speed of people in static and dynamic conditions on a passenger ship. The experimental subject included individual movement and group movement and the results showed that the walking speed of pedestrians decreases by 10–20% when the ship was under the dynamic condition. Sun et al. [35] designed a ship corridor simulator and created an experiment to study the change of walking speeds of passengers under trim or heeling conditions. Koss et al. [36] took the gender and age differences of pedestrians as experimental objects and collected the walking speeds in the corridor and stair area of the ship. The results showed that pedestrian walking speeds decreased when the ship was under the inclining condition.
In a report submitted to IMO, a German research institute proposed the speed reduction formula of persons [37]. The speed reduction, r t r a n , in the laterally tilted passage is defined as Equation (1) and the speed reduction, r l o n g , in the longitudinally tilted passage is defined as Equation (2).
r t r a n = { 0.0067 ϕ + 1 :   0 ° ϕ < 15 °   0.0425 ϕ + 1.5375 :   15 ° ϕ < 35 ° 0.05 :   35 ° ϕ 45 ° 0 :   45 ° ϕ .
As shown in Equation (1), the walking speed decreases gradually as the slope angle increases. When the slope angle is greater than or equal to 45°, the motion is assumed to stop.
r l o n g = { 0 :   ϕ < 45 °   0.05 :   45 ° ϕ < 30 ° 0.085 ϕ + 2.6 :   30 ° ϕ < 20 °   0.005 ϕ + 1 :   20 ° ϕ < 0 ° 0.015 ϕ + 1 :   0 ° ϕ < 20 ° 0.07 f + 2.1 :   20 ° ϕ < 30 °   0 :   30 ° ϕ ,
As shown in Equation (2), when the slope angle is less than 0, it means that persons walk in a downhill passage. When the slope angle is greater than 0°, it indicates that persons walk in an uphill passage. The walking speed decreases gradually as the absolute value of slope angles increases. As can be seen from the above, the walking speed will be decreased when the ship is under the inclining condition.

2.4. Procedural Category

The procedural category represents assistance by crews in the event of an accident. This paper mainly studies the spontaneous behavior of passengers in the process of evacuation, while assistance from crews was not considered.

3. Modeling of Multi-Grid in a Cruise Ship

In recent years, many models have been applied by researchers in pedestrian evacuation simulations, such as the cellular automata model [38,39], the lattice gas model [40], the social force model [41,42], the fluid mechanics model [43,44], the multi-granularity 2-tuple QFD (quality function deployment) model [45], the magnetic model [46], the centrifugal force model [47], and the agent-based model [48].
The cellular automata model is most widely used in evacuation simulation [49,50,51], compared to other models. In the cellular automata model, the space is divided according to a fixed grid size. The grid size is determined by the shoulder width of a human body, the sized of which is usually 500 mm × 500 mm. One person occupies one grid and walls or obstacles occupy one or more grids. The typical neighborhood range of the cellular automata is the Moore neighborhood, as shown in Figure 4. The blue area is the grid occupied by a person and this person can judge the status of grids in eight directions and determine the target grid in order to move to the next step.
However, the cellular automata model has some shortcomings. If walls or obstacles cannot be divided by the gird size, the remainder would usually be rounded off, which would cause errors. The multi-grid model [52] is a kind of refined grid model. In this model, pedestrians occupy more than one grid and can move one or several grids with each step. Moreover, pedestrians can also move towards eight directions, which is the same as in Figure 4. The evacuation model of the cruise ship is established based on the multi-grid model in this paper. According to the standard adult body size data [53], the horizontal size of the human body is about 500 mm × 300 mm. Since the projection of the human body is an elliptic [54], each passenger occupies fifteen grids if the grid size is defined as 100 mm × 100 mm, as shown in Figure 5. Moreover, the typical sizes in Figure 2 could also be exactly divisible by the grid size, from which more accurate models can be established.

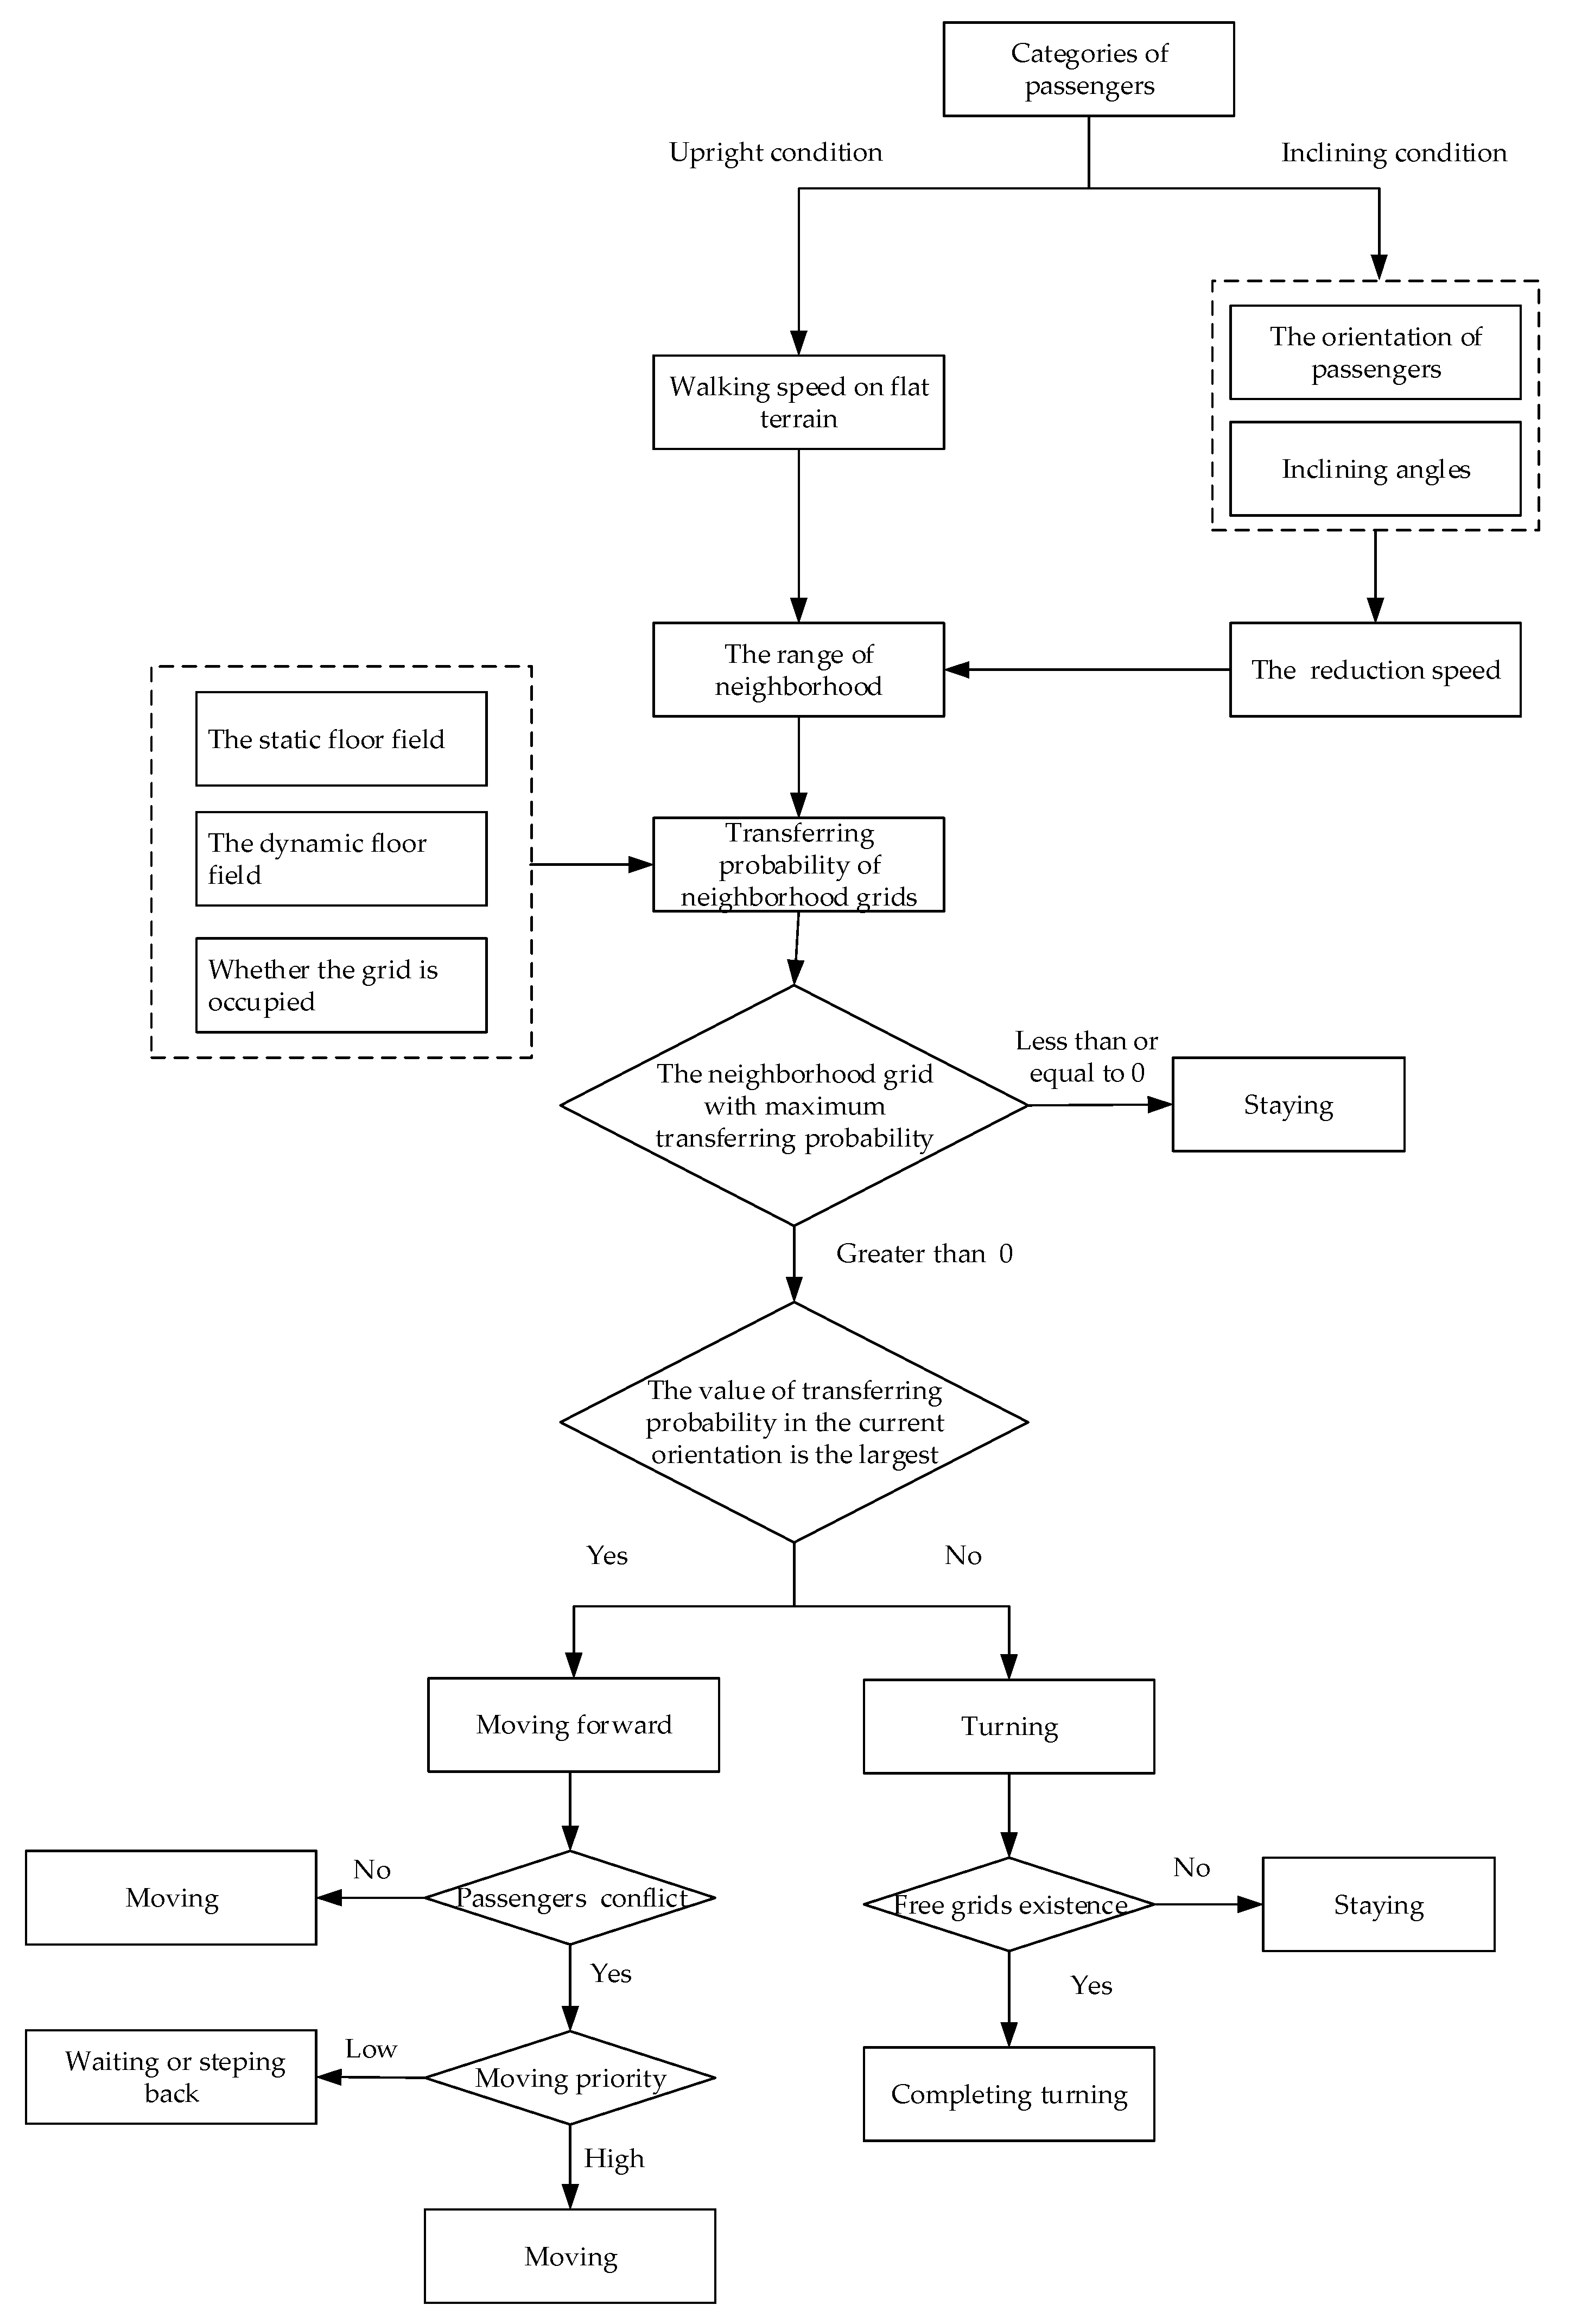
3.1. The Passenger Moving Rules of the Multi-Grid Model

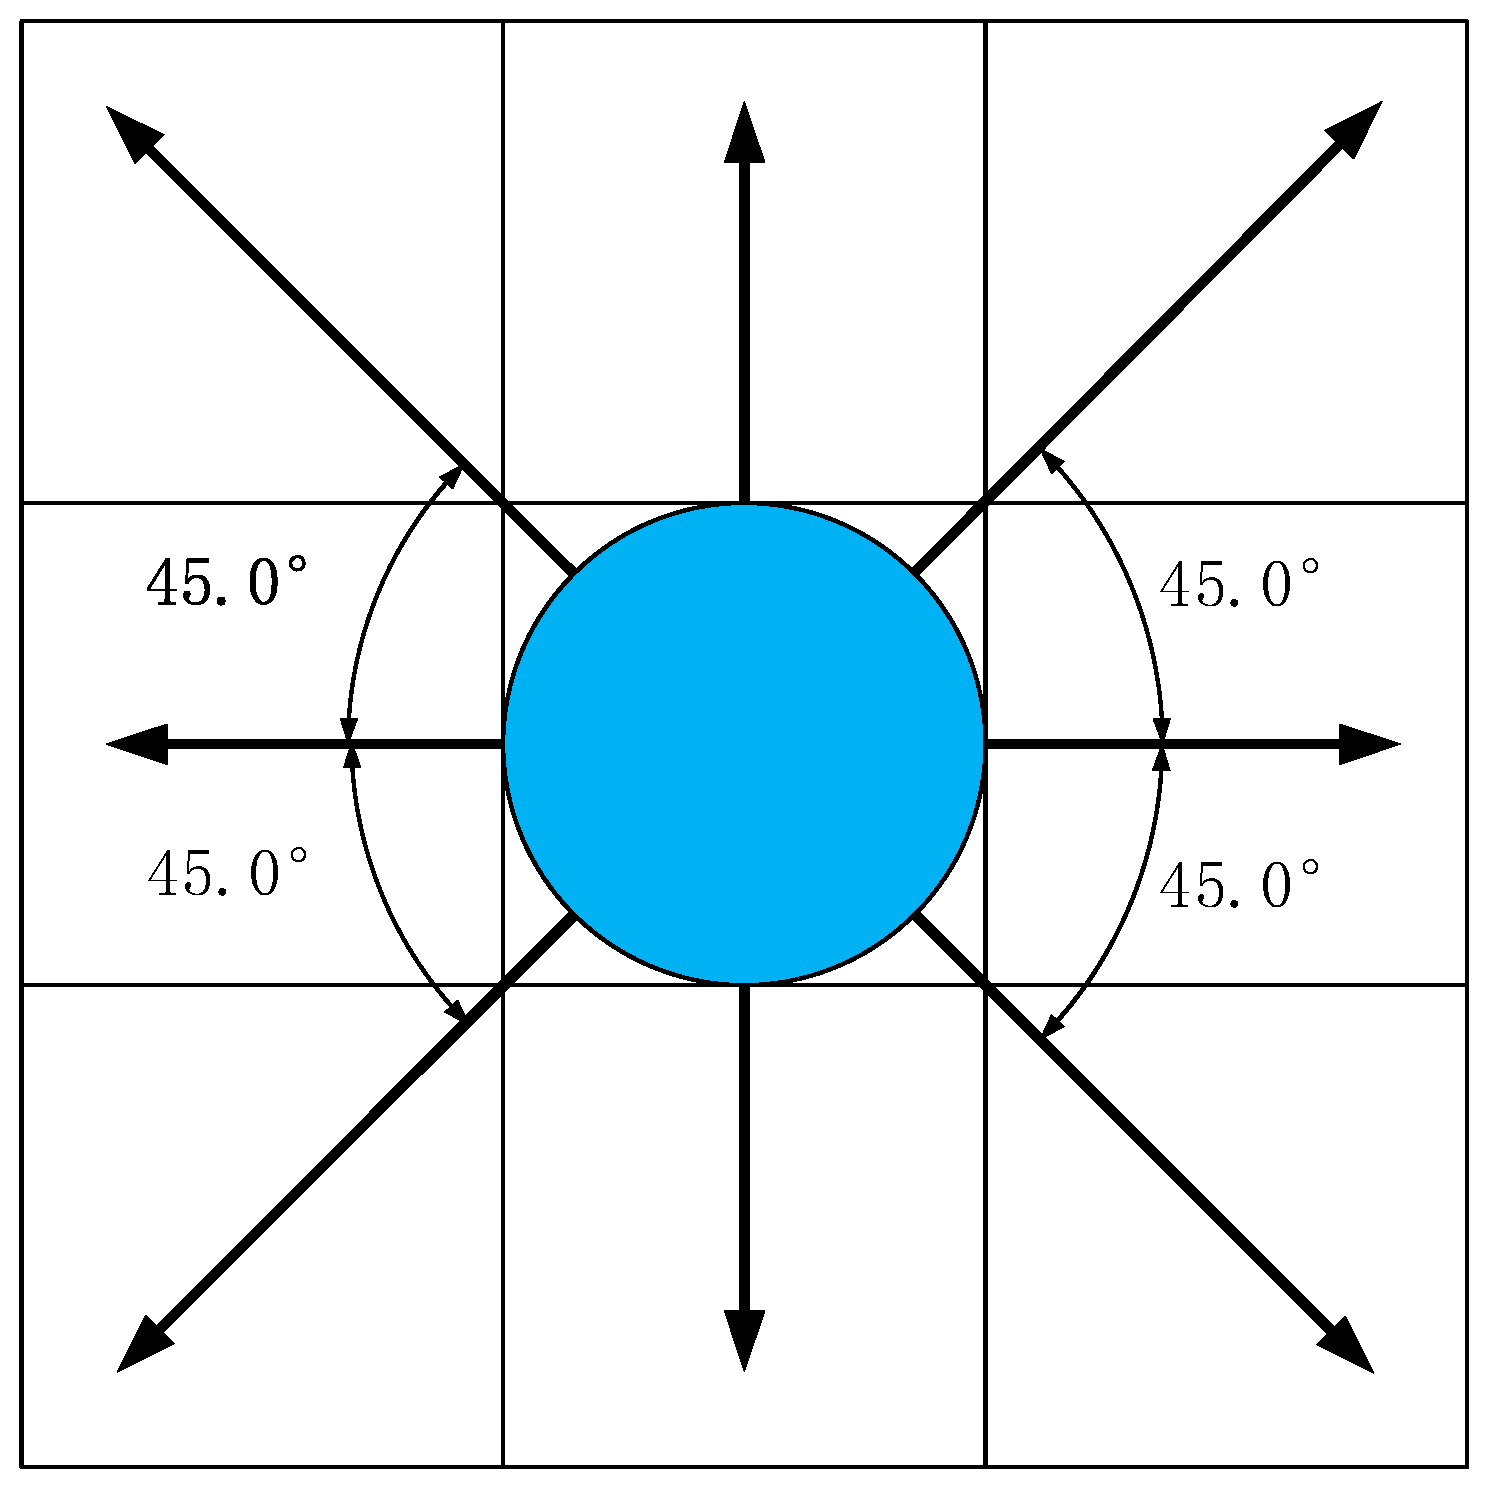
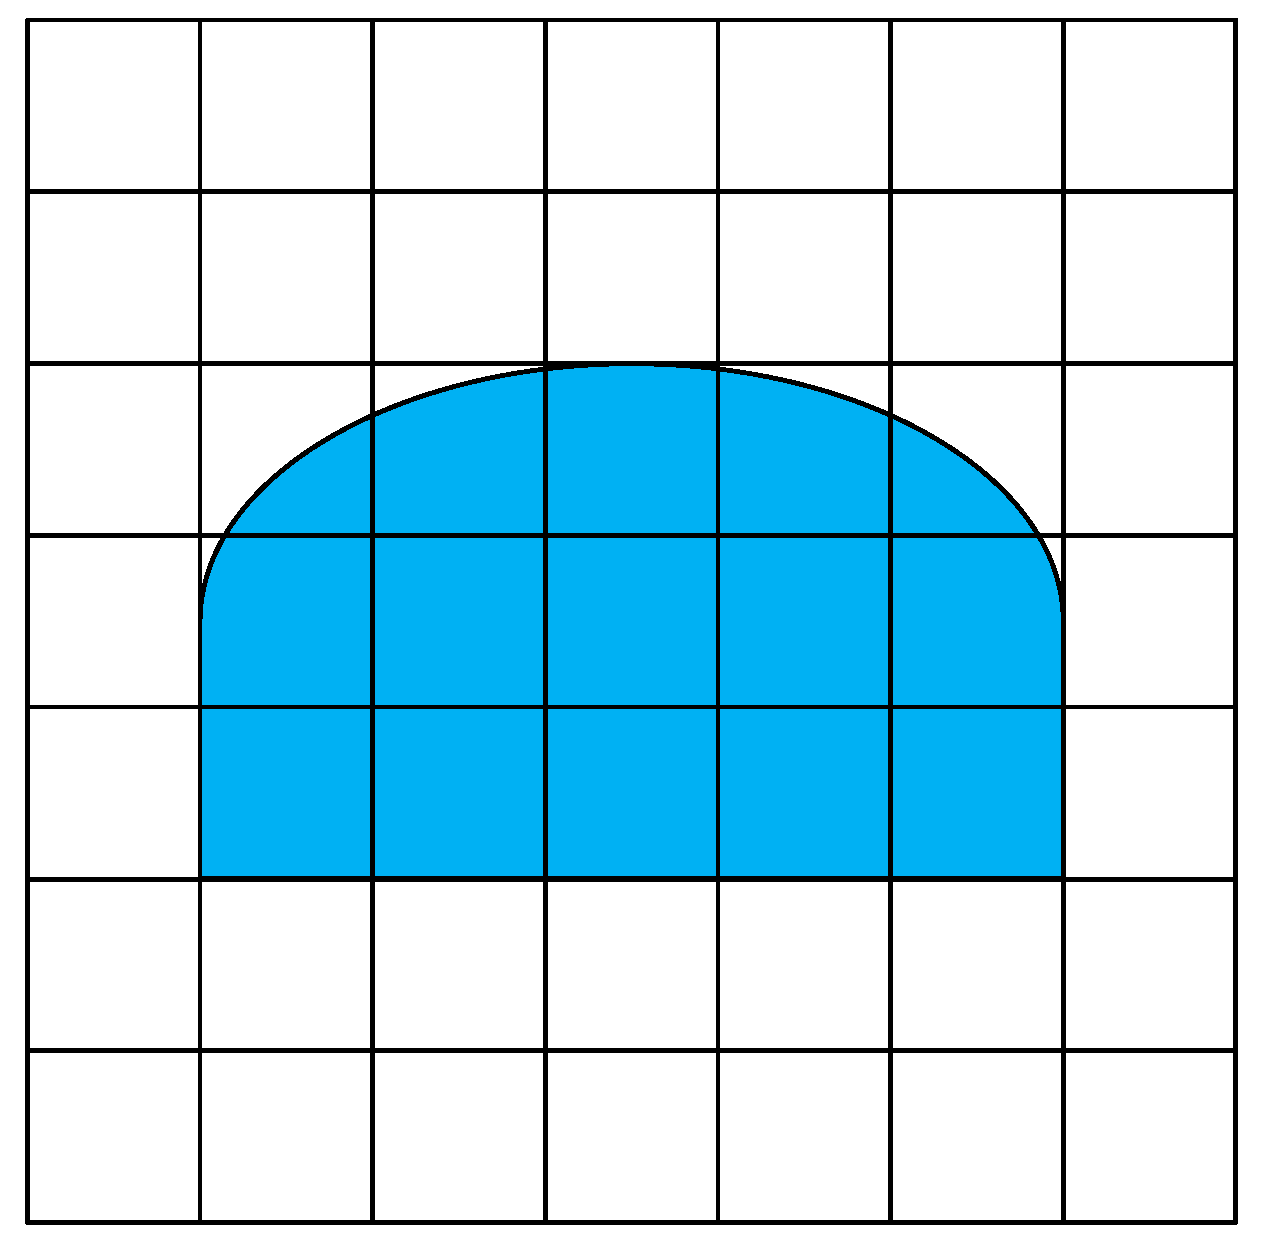
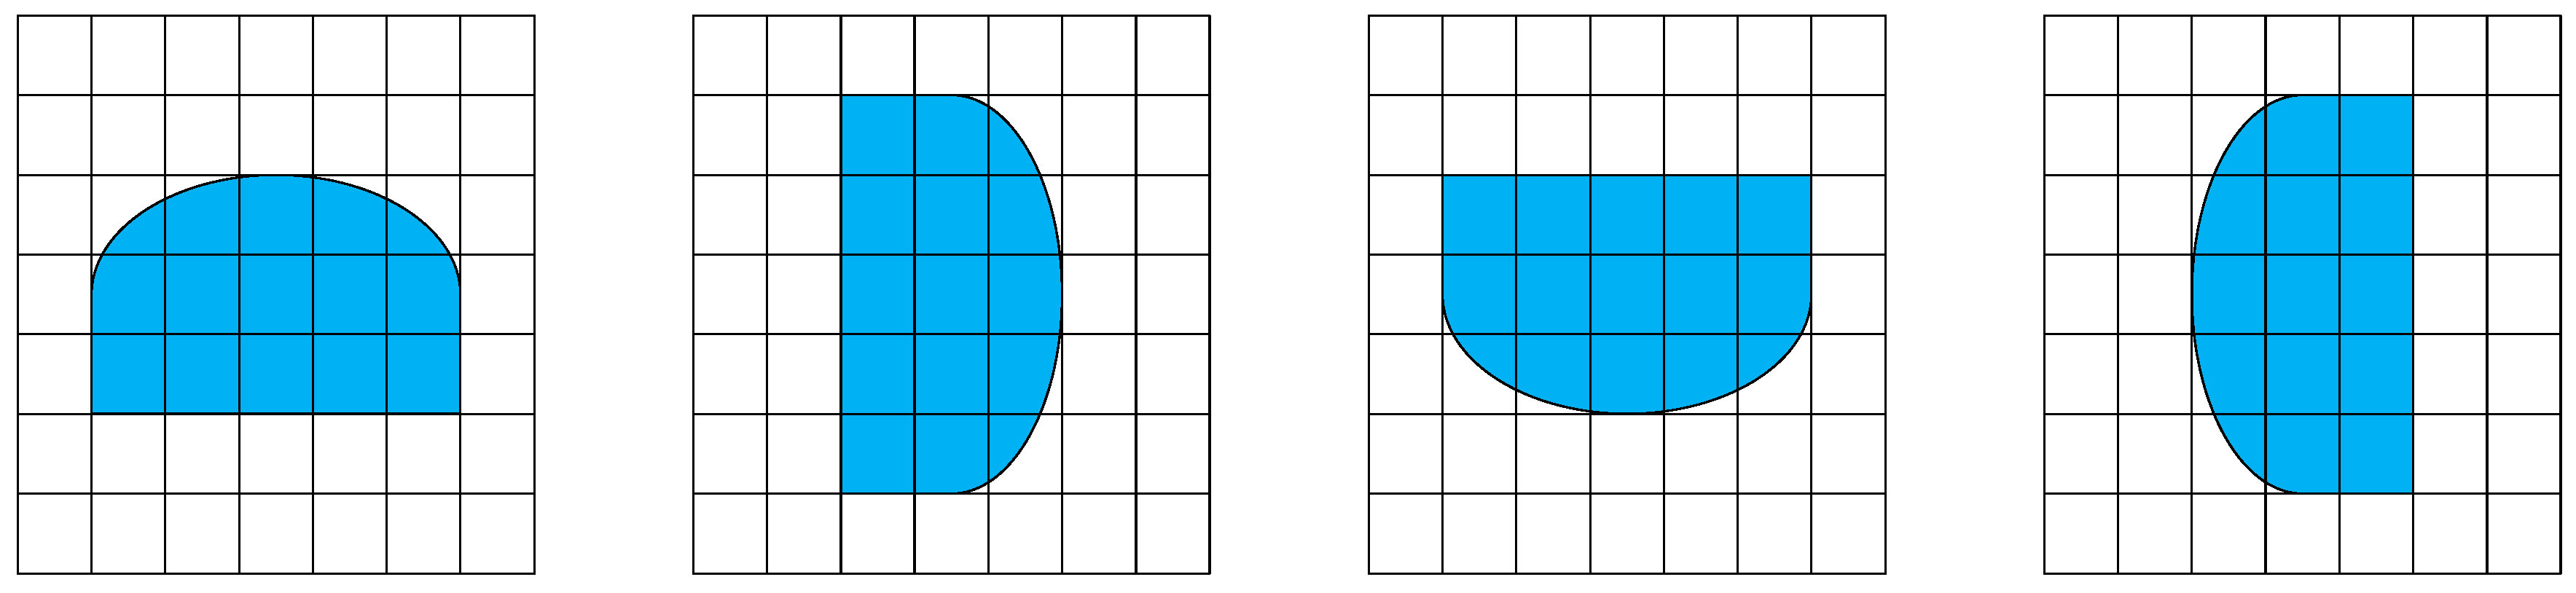
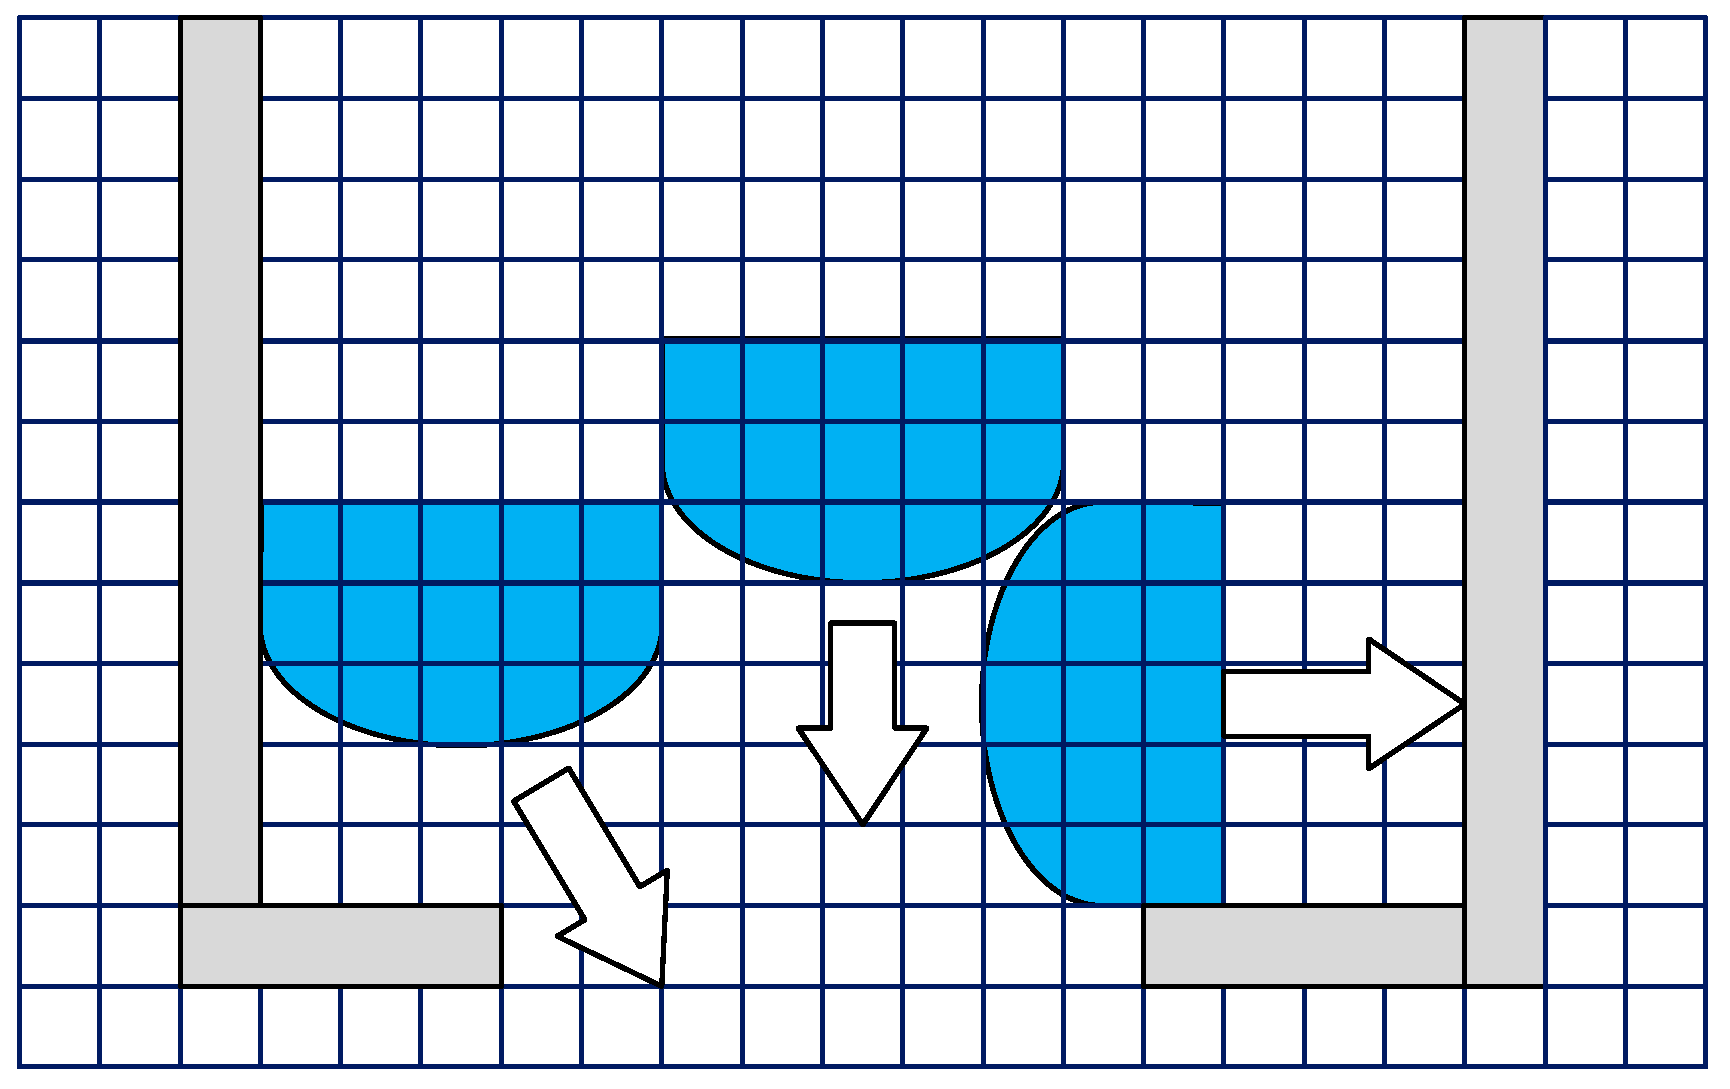
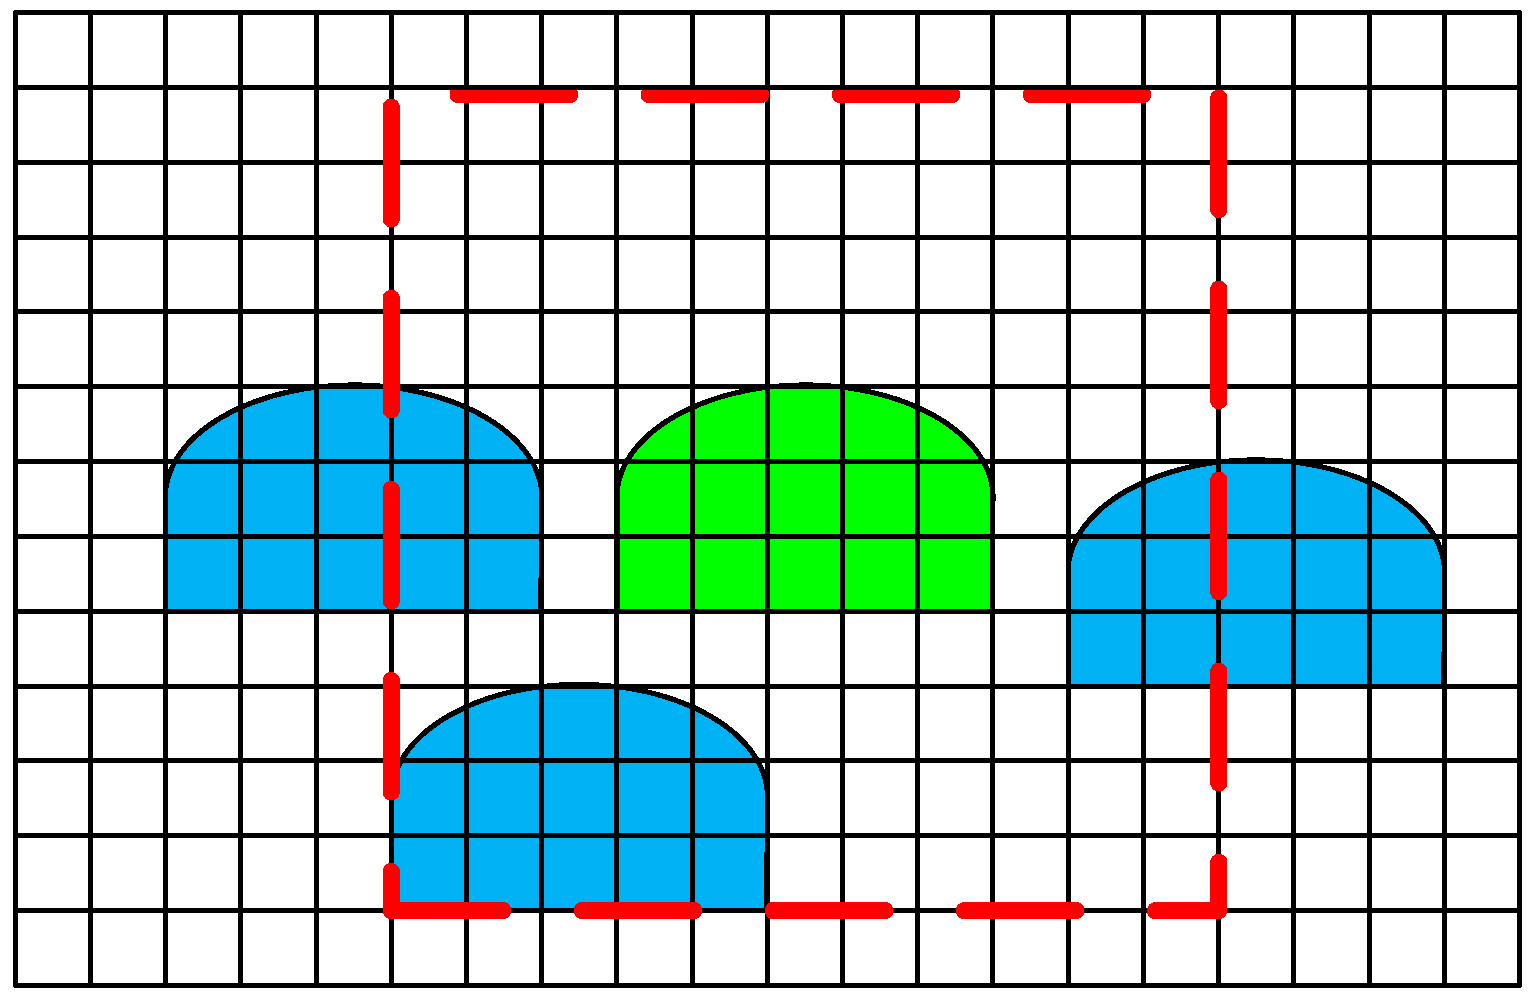
3.1.1. The Moving Range

In order to make the model closer to reality, the walking direction of passengers is defined in the model, as shown in Figure 6. The arc bulge is the passenger’s line of sight, which is defined as the orientation of passengers, and each passenger has four orientations.
As shown in Figure 7, the red part is the centroid of passengers. The length along the orientation between centroids is the distance of the passenger moves. In the Figure 7a, the distance the passenger moves is five grids. The moving directions of the multi-grid model [55] are extended and passengers can move towards any free grids in front of them. When there is an obstacle in front of the passenger, the passenger will choose free places to move. According to the choice of the passenger, there will be different angles between the orientation and tracks, as shown in Figure 7a,b. Since angles are not confined to 45 degrees, the directions of passenger movement are more diversified, which is more in line with the actual situation.
In the multi-grid model, passengers can move one or more grids in one step. It is assumed that the maximum movement range of passengers is five grids at each step and passengers can actually move one to five grids in one step, as shown in Figure 8a. The range of the neighborhood is the grid range that passengers can choose to move at each step. This can be expressed as the shaded part, as in Figure 8b. It can be seen that the range of the neighborhood can be determined by the walking speed and defined as follows:
N s = ( V s + 1 ) × ( 2 × V s + 1 ) ,
where N s is the range of neighborhood and V s is the maximum number of grids that the passenger can move in one step.
Since the size of the grid is 100 mm × 100 mm, the walking speeds in Table 1 could not be all exactly divisible by the side length of the grid. In order to solve this problem, the method of probability walking was adopted [56]. It is supposed that the model state is updated every 0.1 s. If the walking speed is 1.3 m/s, the passenger will move one grid with a probability of 0.7 and two grids with a probability of 0.3 at each step. If the walking speed is 1.5 m/s, the passenger will move two grids with a probability of 0.5 and one grid with a probability of 0.5 at each step, and so on. The update frequency of the model in this paper is 0.5 s and the state update frequency of the passenger in the model is also 0.5 s.

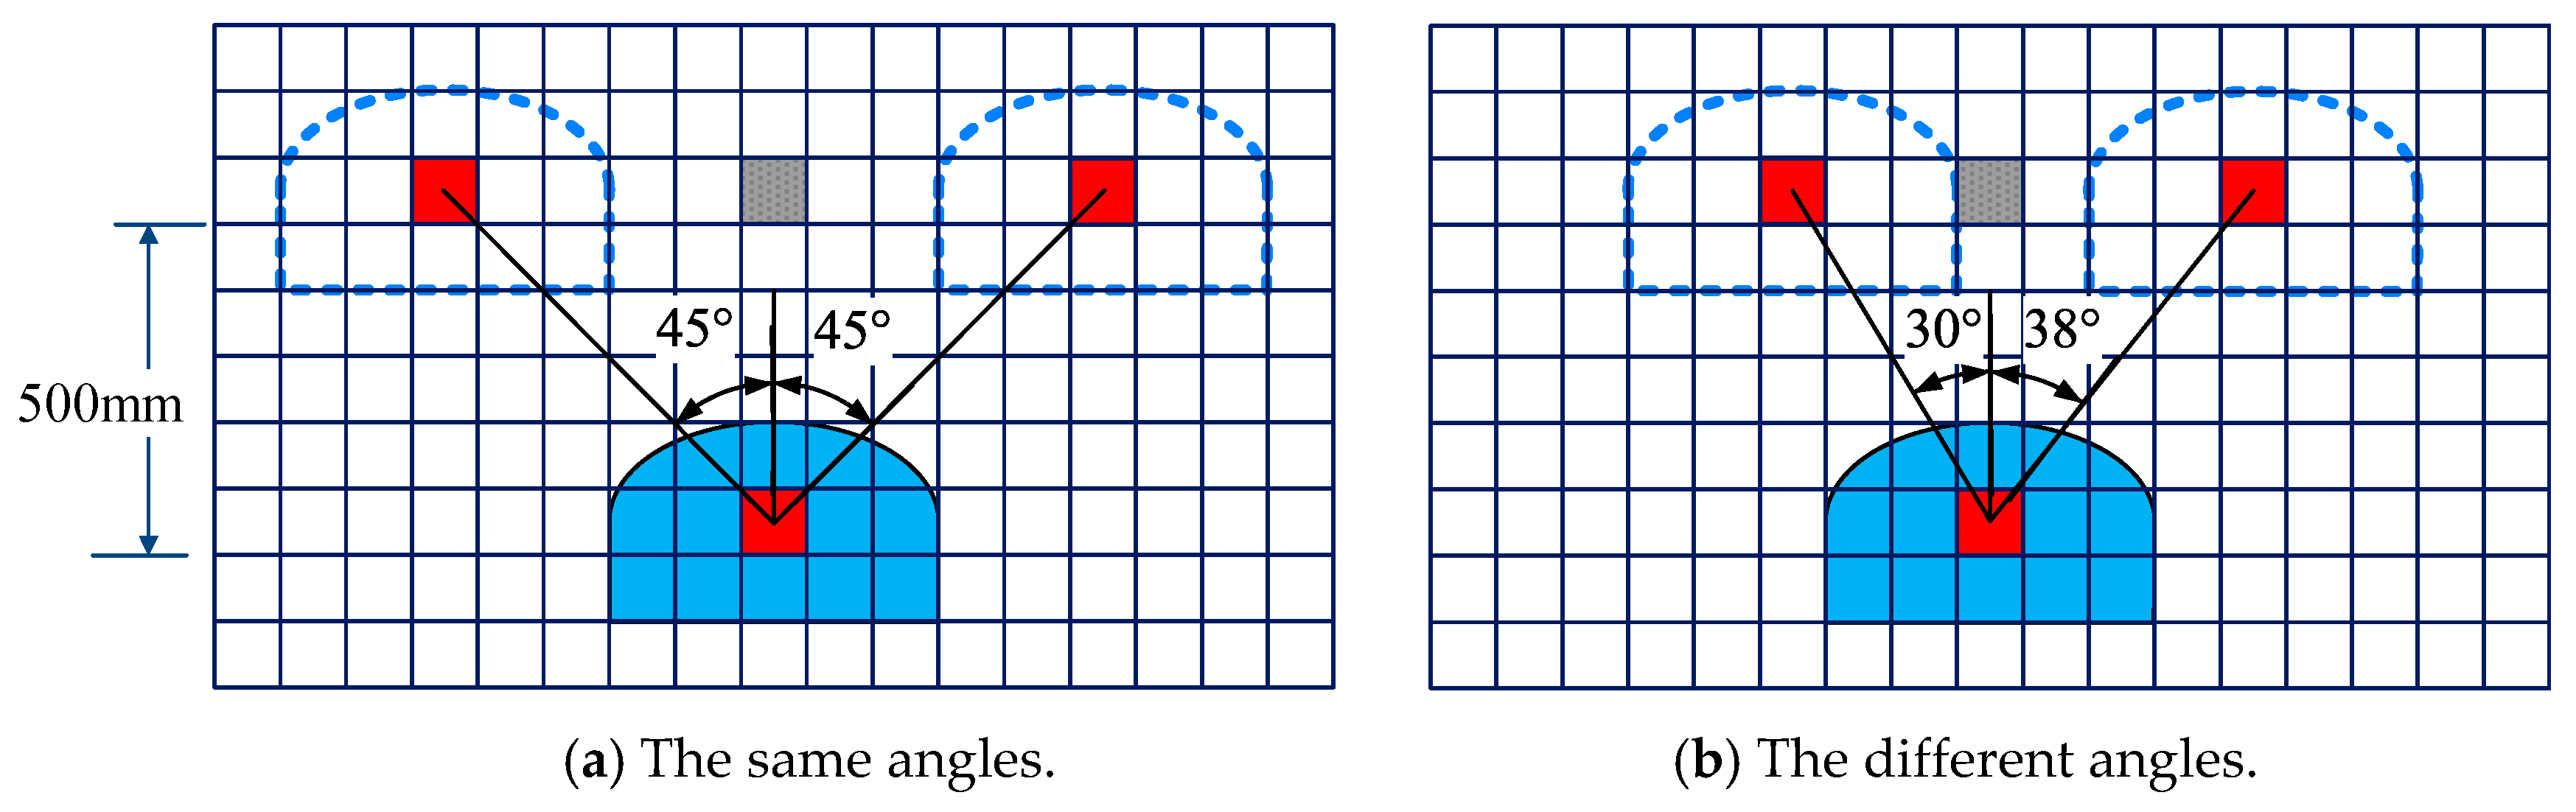
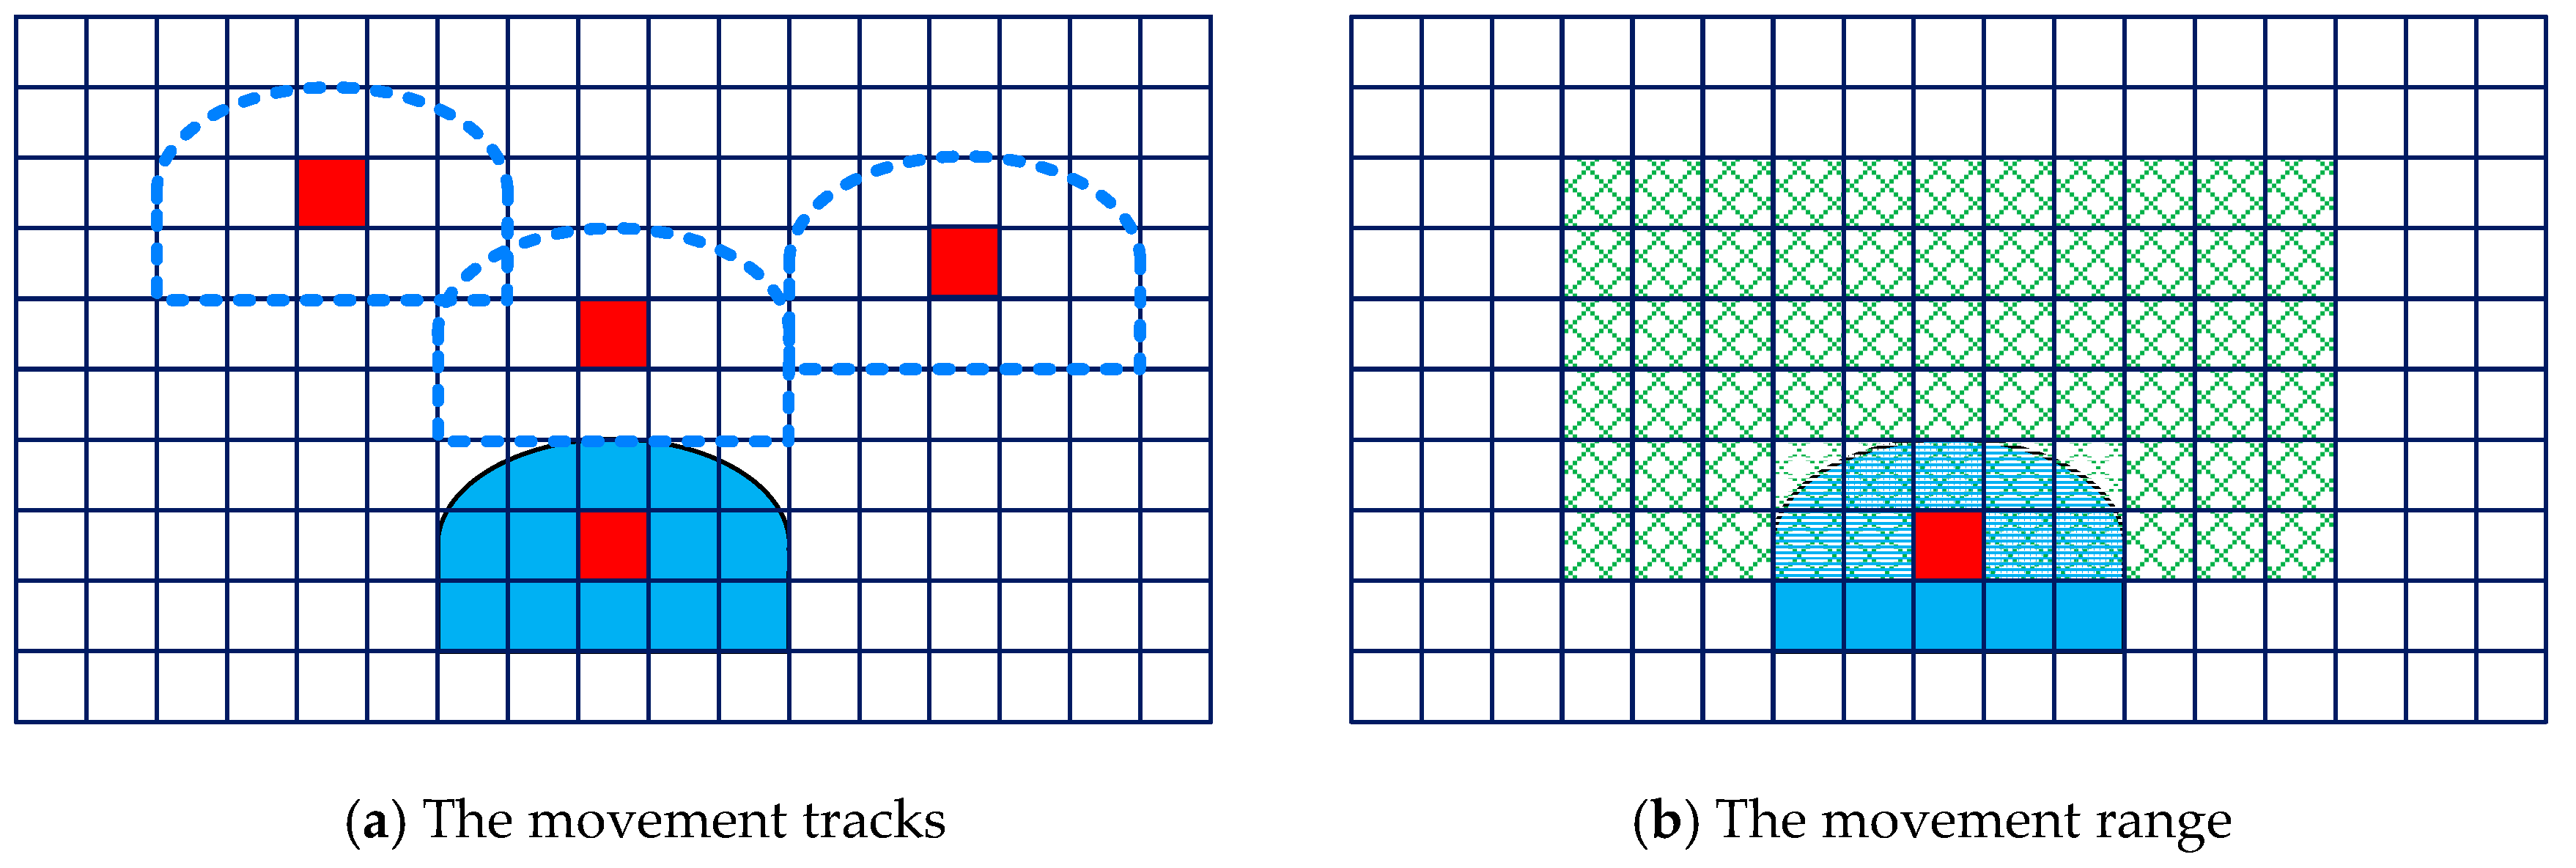
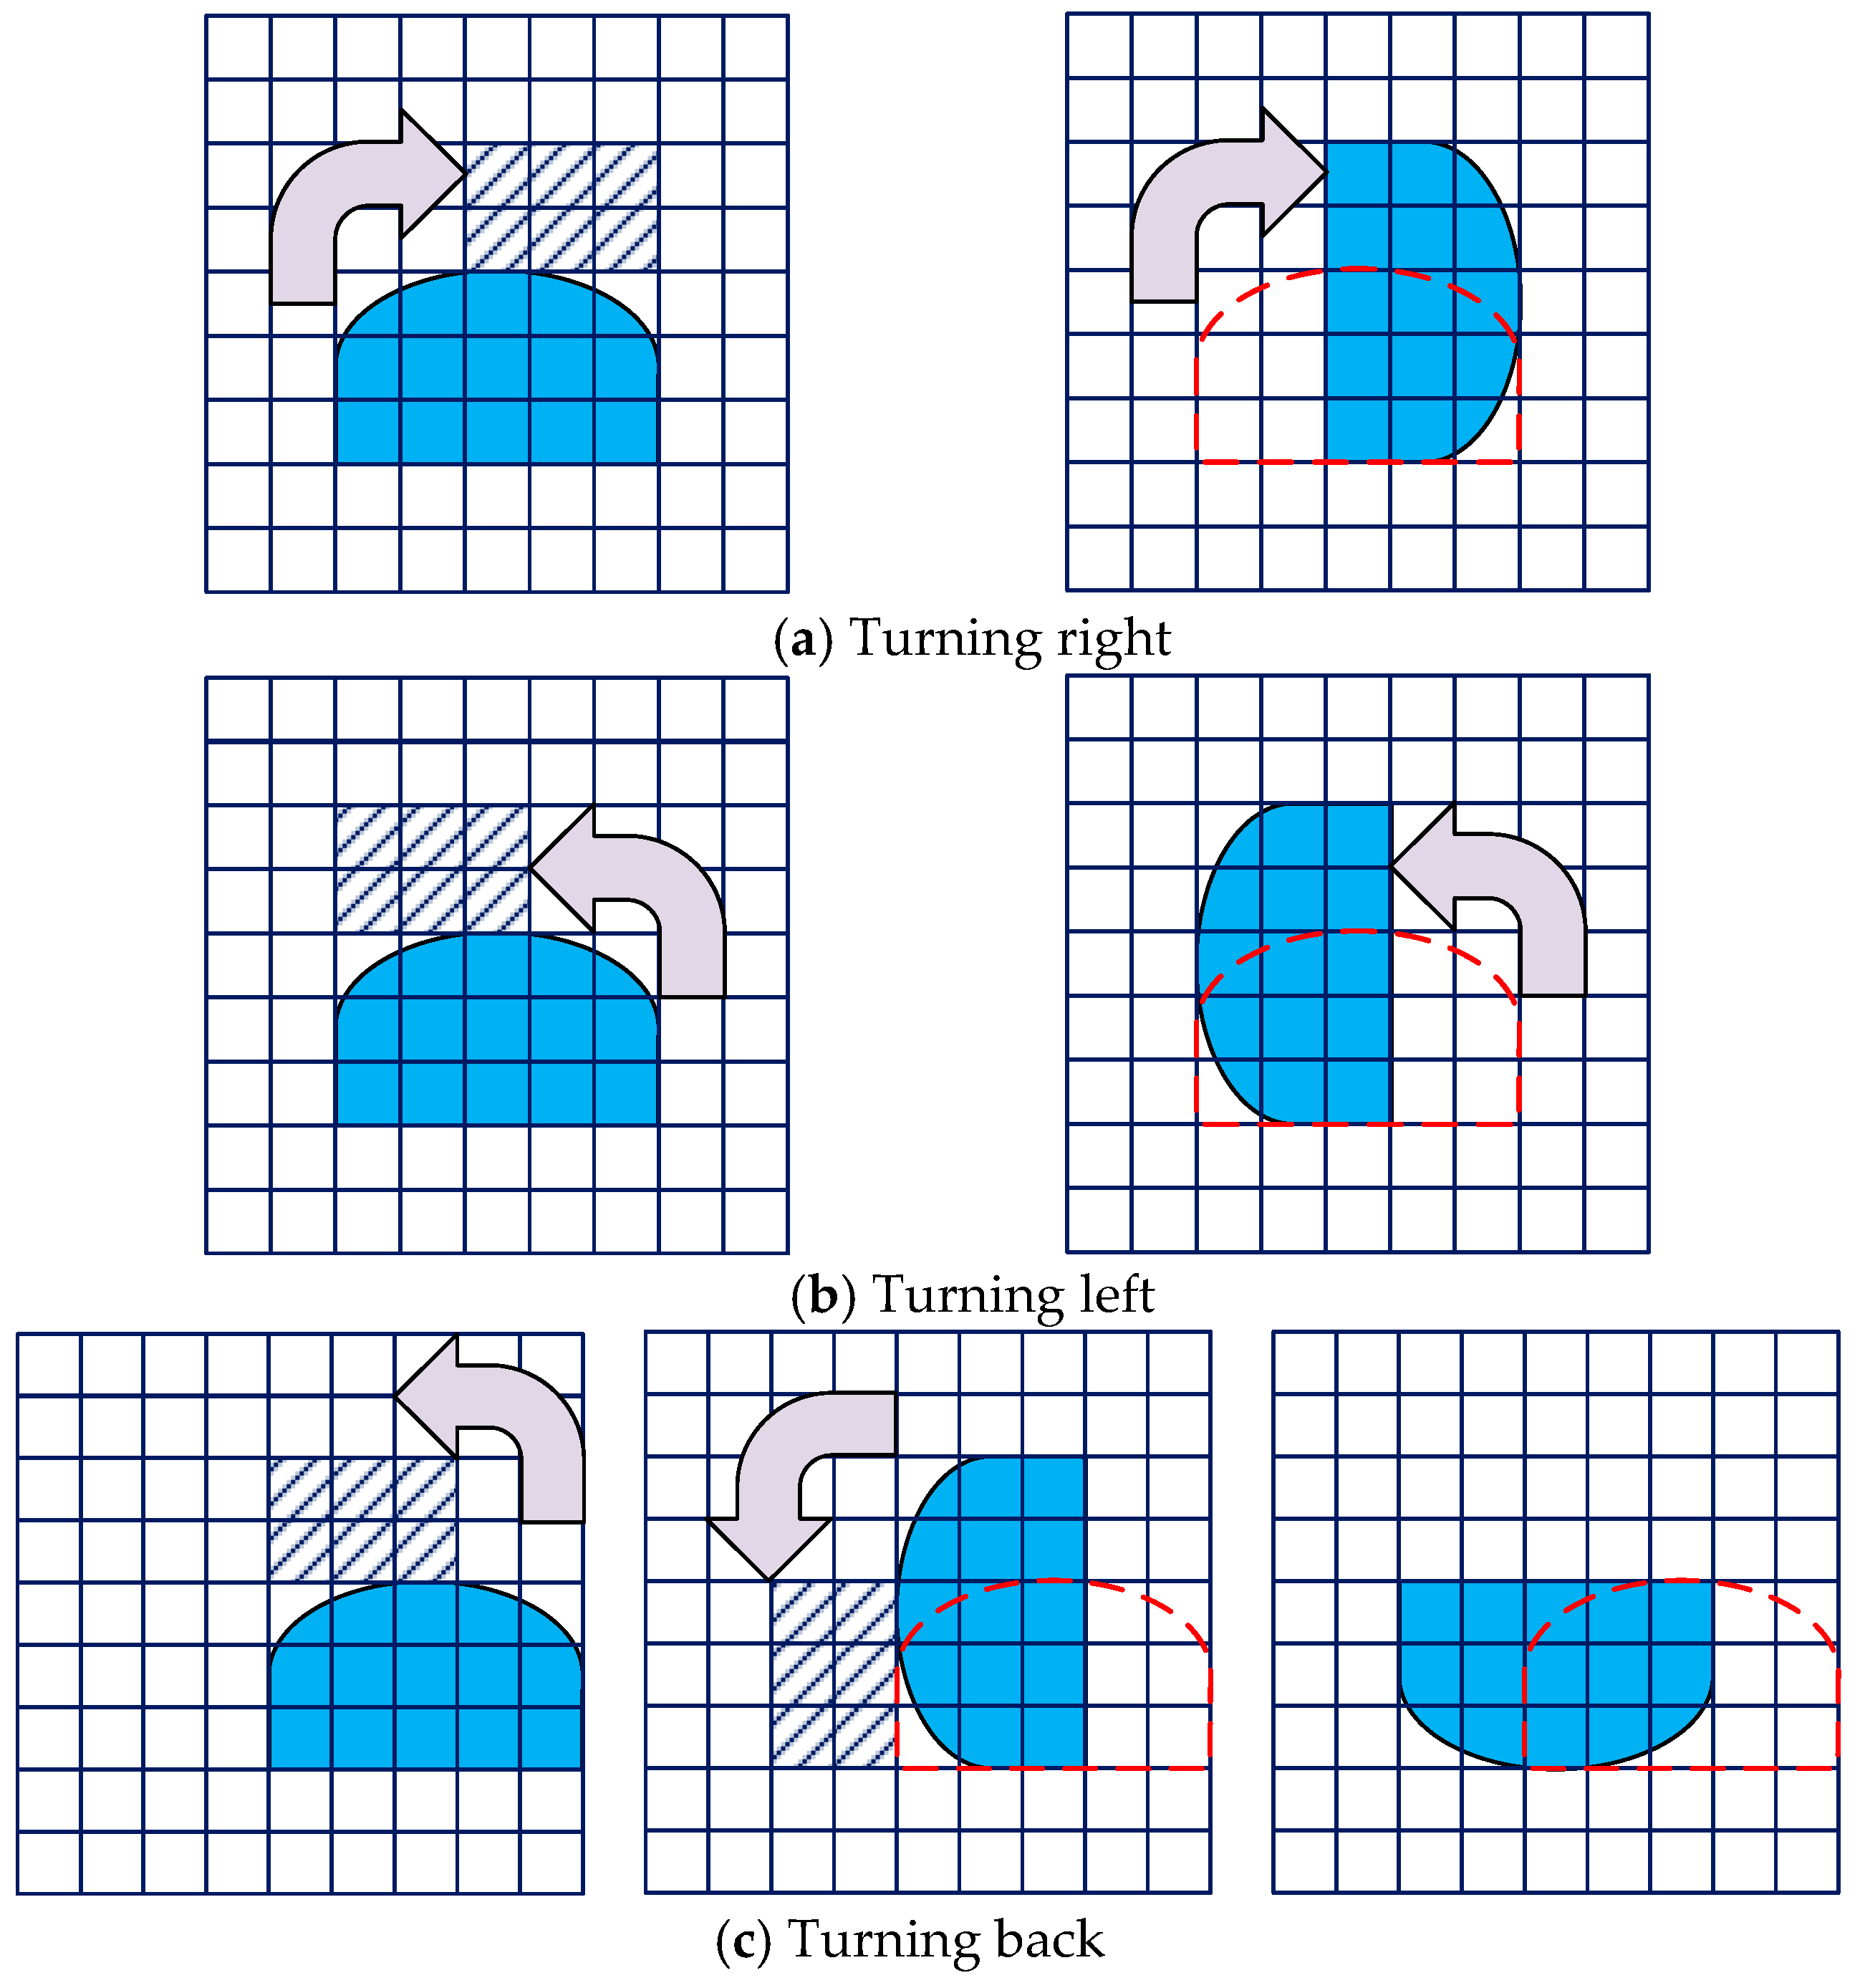
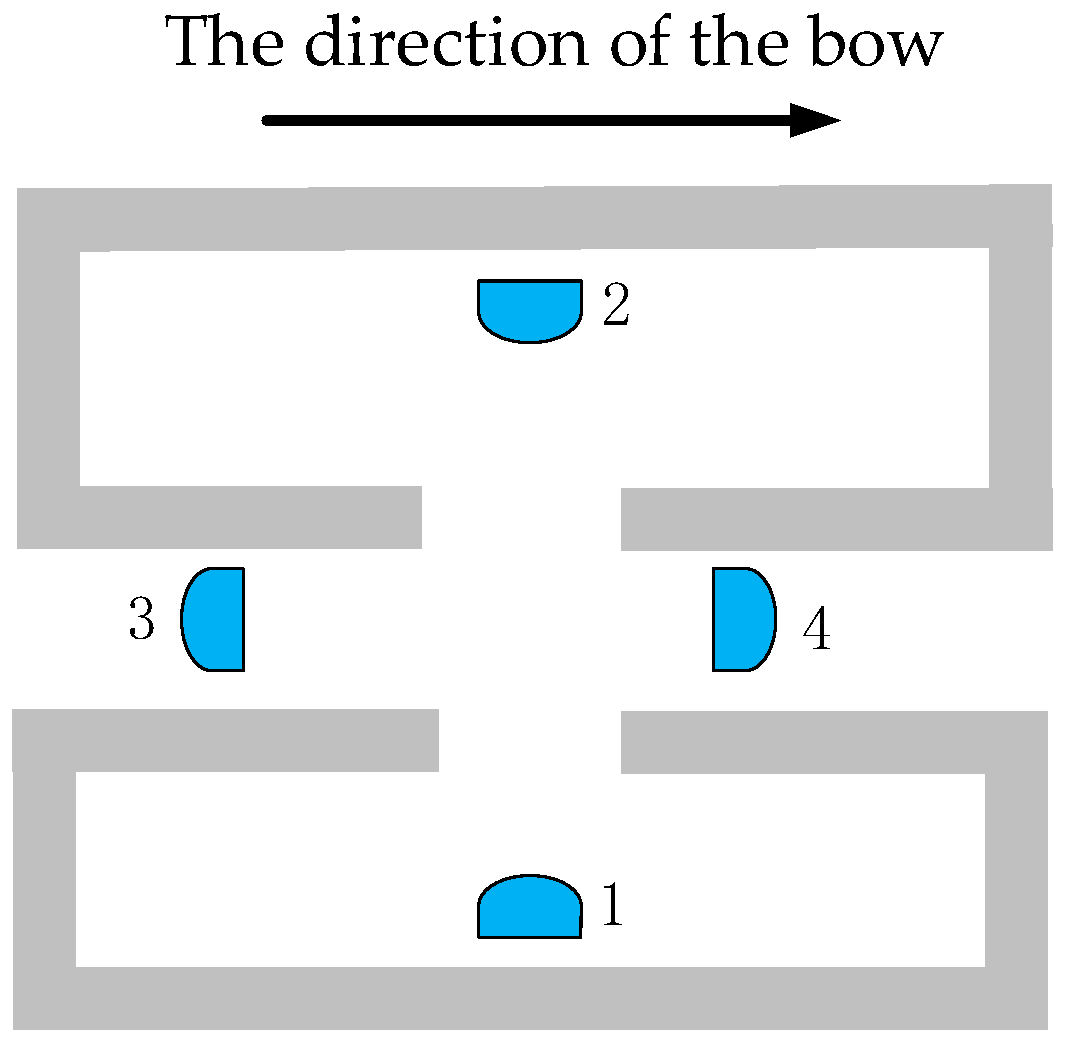
3.1.2. The Turning Rules

Passengers need to change their walking direction by making a turn. Figure 9a shows the process of turning right and the process of turning left is shown in Figure 9b. Compared with the process of turning left and right, there is an additional process in the process of turning back. The passenger can choose to turn left or right firstly, and then this passenger may make a turn to complete the process. Figure 9c shows the process of turning back by turning left firstly. As the orientation of the passenger changes during the course of turning, the grids occupied by the passenger will also change. It is necessary to ensure that these grids are empty before turning and the shaded part in Figure 9 should not be occupied by obstacles or other passengers.

3.1.3. The Anti-Collision Rule

At some exits, passengers will step back to avoid collision with other passengers, as shown in Figure 10. Three passengers will leave through the exit, two passengers face the exit, and one passenger faces the wall. If three passengers are moving forward simultaneously, they will be stuck in the exit. The model will be locked up and fall into an infinite loop. In order to avoid this situation, the passenger who will make a turn should voluntarily wait or step back in the model. As shown in Figure 10, the passenger on the right should wait or step back before two passengers on the left pass. Considering the movement behavior of avoiding collision, the range of stepping back should be added into the moving range. The range of neighborhood also should be modified and calculated as follows:
N s = ( 2 × V S + 1 ) 2 .
Passengers will move to neighborhood grids at each step and transferring target grids are determined by the transferring probability of neighborhood grids. The passenger will move to the grid where transferring probability is at the maximum. The calculation of transferring probability is based on the status of passengers and neighboring grids. The status of grids is determined by the attraction factor of grids, also known as the floor field. The floor field includes the static floor field and the dynamic floor field. The static floor field is related to the evacuation space layout, while the dynamic floor field is relevant to the influence between passengers.

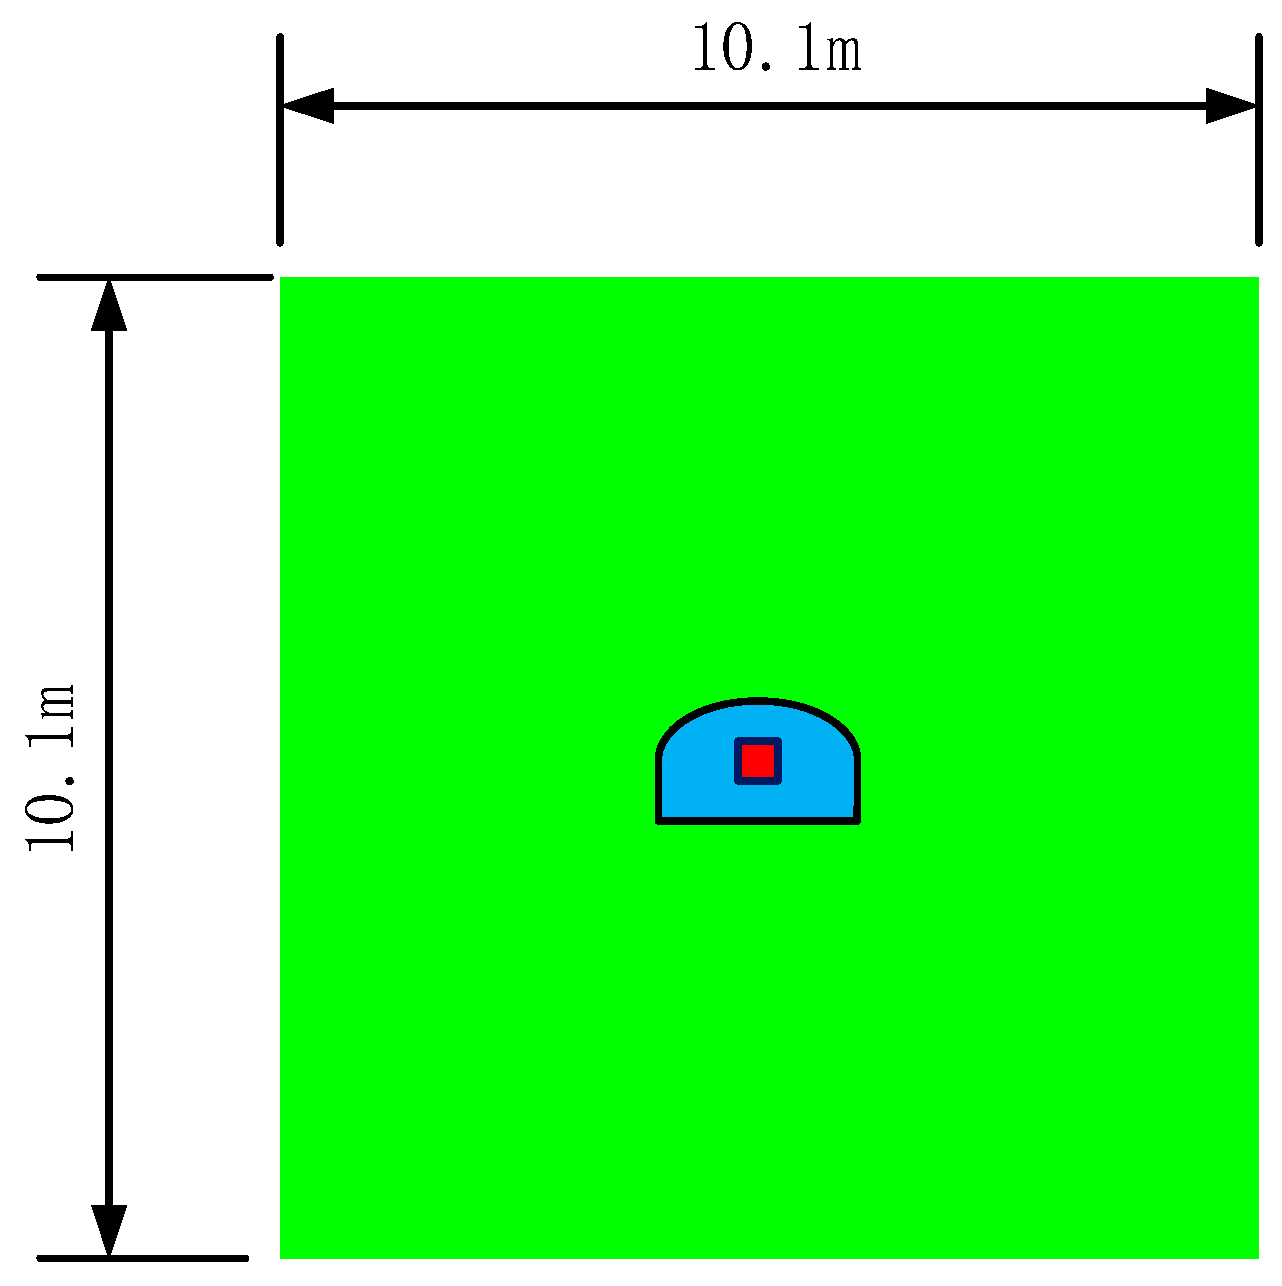
3.2. The Static Floor Field

The static floor field is determined by the layout of the evacuation space and remains unchanged during the whole process of evacuation. The closer the grid is to the exit, the greater the intensity of the static floor field will be. It can be known from Section 2.1, that passengers will pass through the cabin, corridor, and finally arrive the stair area during the evacuation. Each area that passengers pass through can be defined as a layer evacuation space. For the multi-layer evacuation space, the distance between the grid and the exit in each layer should be superposed. If the evacuation space has n layers of evacuation space, n is bigger as long as the space is further away from the exit. The distance between the grid and the final exit can be defined as follows:
L i = min m ( ( C i x e n x m ) 2 + ( C i y e n y m ) 2   ) + j = 1 n 1 (   min k ( ( e j x k e j + 1 x k ) 2 + ( e j y k e j + 1 y k ) 2   )   ) ,
where ( C i x ,   C i y ) is the coordinate of the grid C i , ( e n x m ,   e n y m ) is the coordinate of the m t h grid of exit of the n t h layer space, ( e j x k ,   e j y k ) is the coordinate of the k t h grid of the j t h layer space, and L i is the minimum distance between the grid C i and the final exit.
In the static floor field, the attraction factor of the grid to the passenger can be defined as follows:
F i l = L max L i L max ,
where F i l is the attraction factor of the grid C i in the static floor field and L max is the maximum value of L i . The static floor field of the deck is shown in Figure 11. The area with the higher value of the attraction factor is more attractive to passengers.

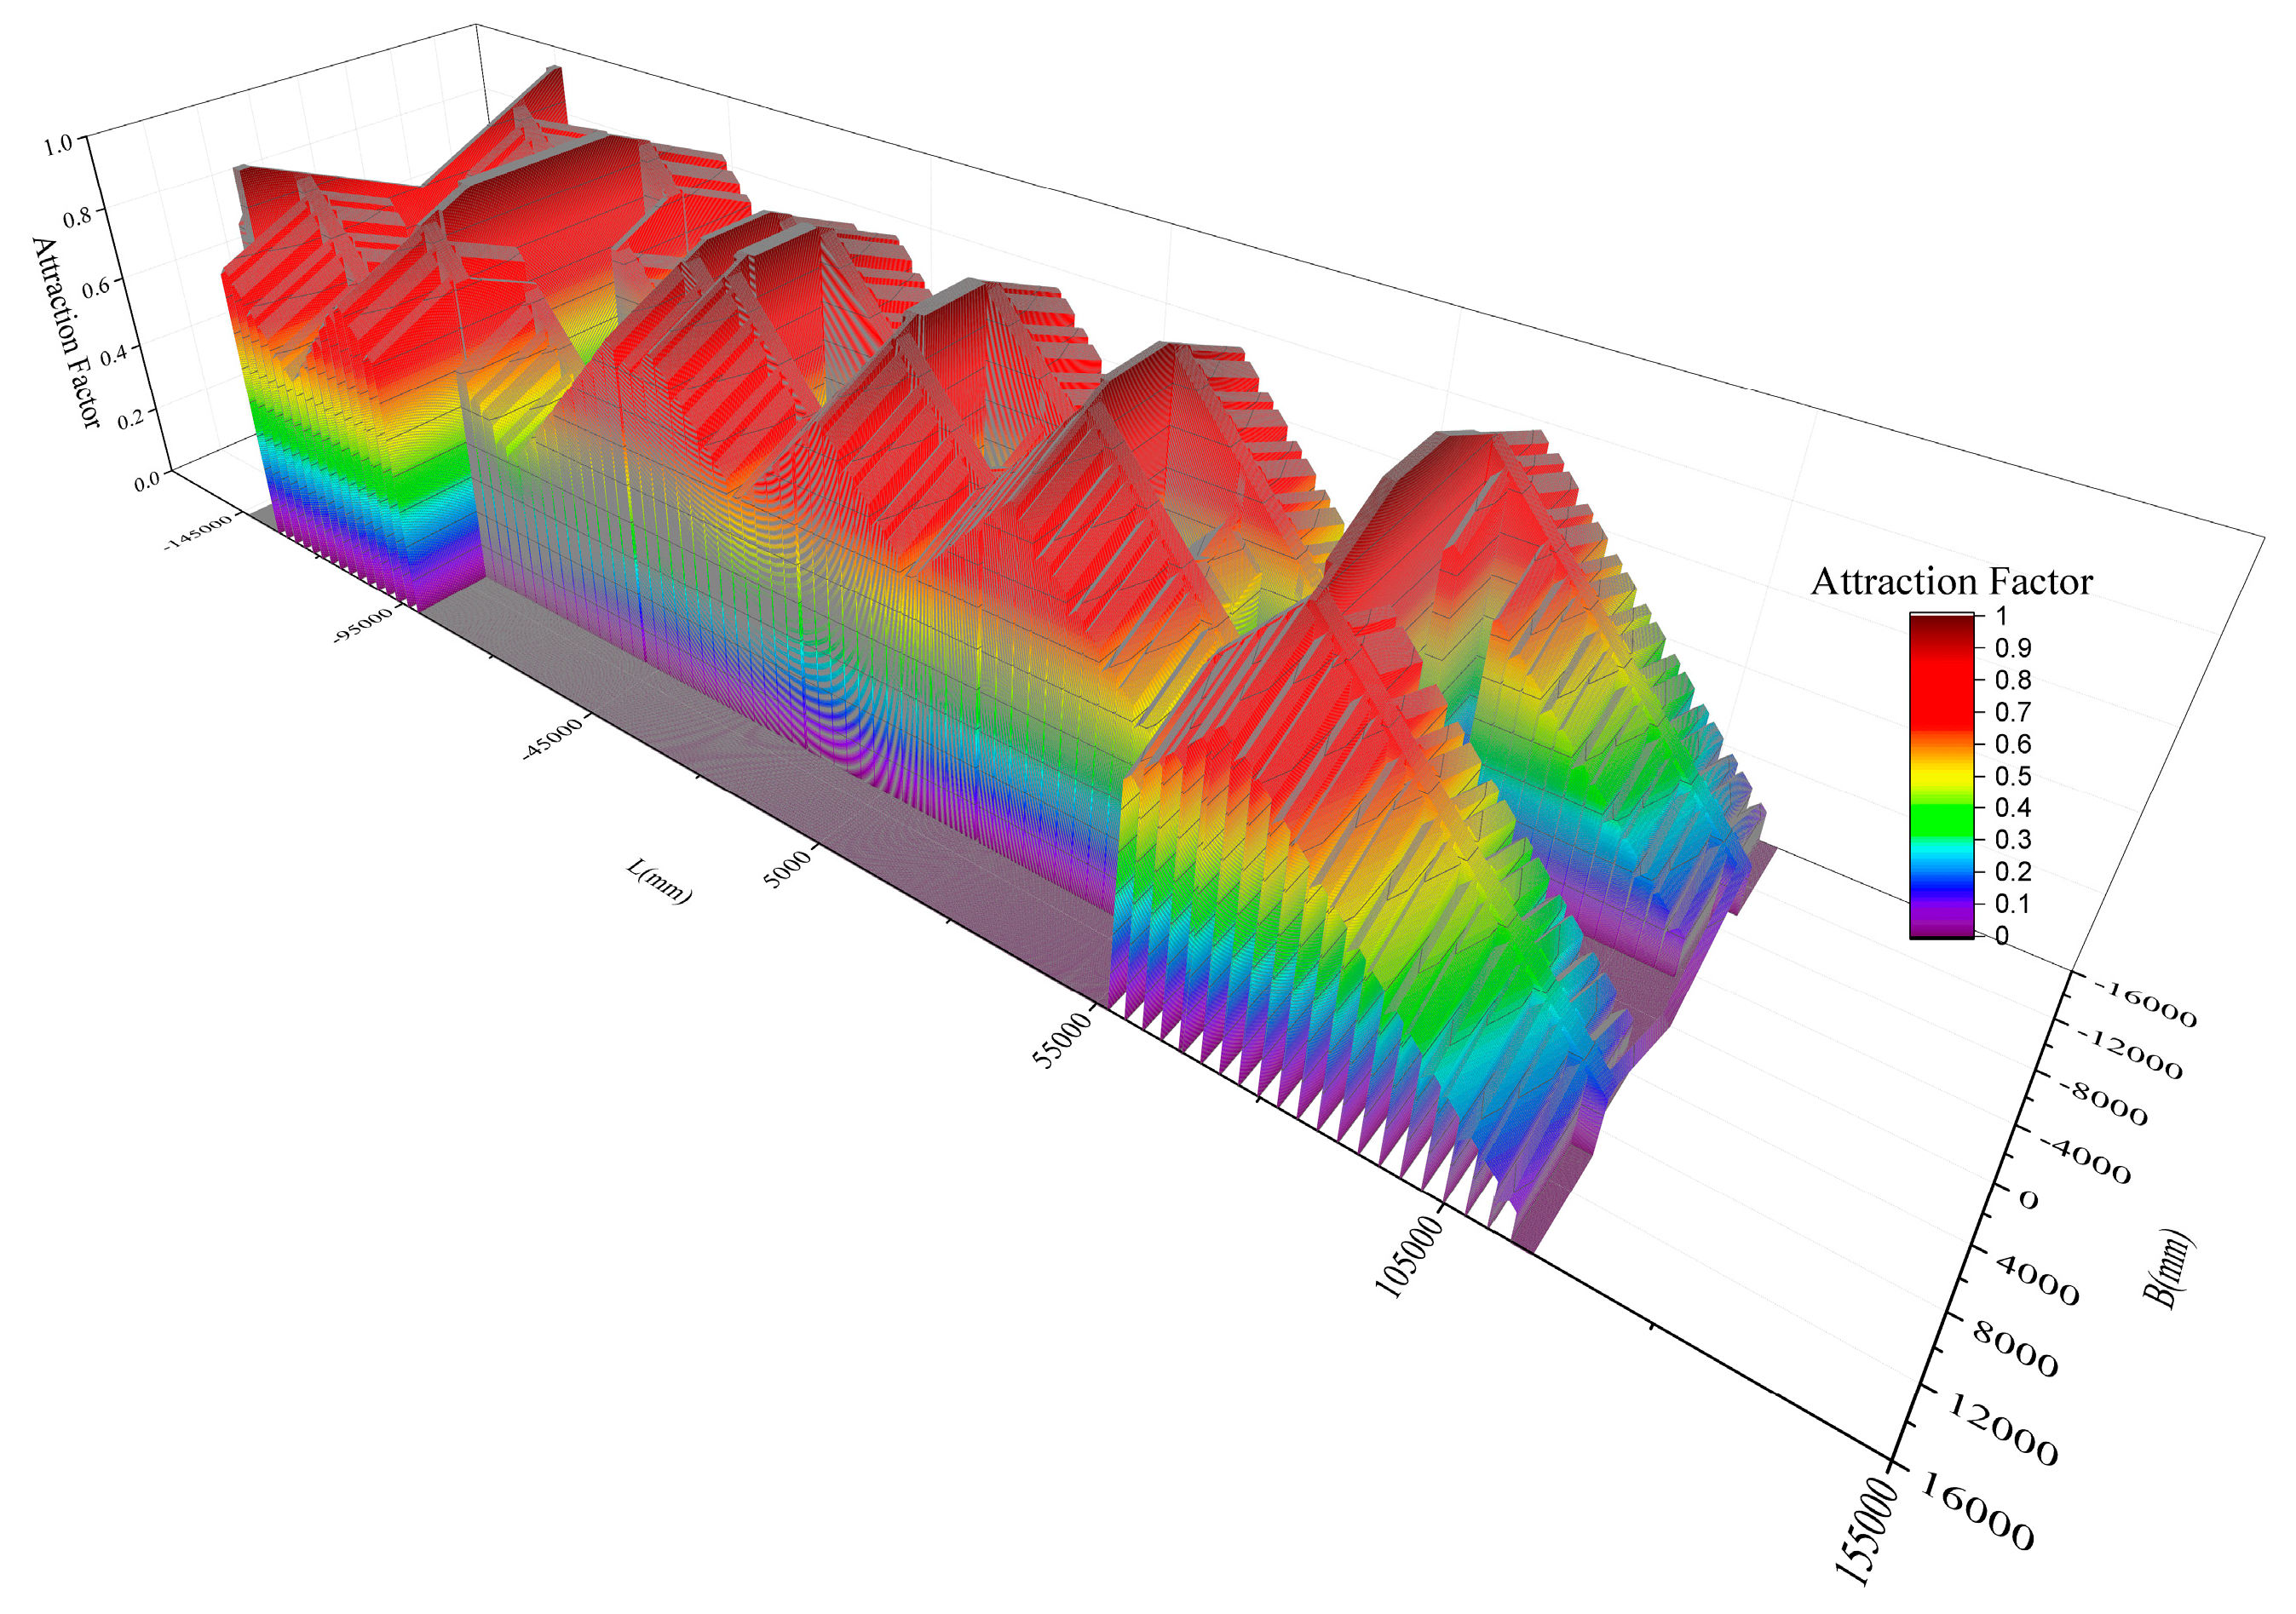
3.3. The Dynamic Floor Field

The dynamic floor field is determined by the movement track and distribution of passengers in evacuation spaces. It changes at each step and includes the attraction of the mainstream crowd and the exclusivity of individuals around.

3.3.1. Attraction of Mainstream Crowd

When individuals are affected by the spirit of the crowd, they will mimic the behavior of others. Similarly, passengers would be affected by the mainstream crowd in the process of evacuation and move toward the path that the mainstream crowd have passed.
The radius of each individual’s influence is 5 m [57]. As shown in Figure 12, by extending the 5 m zone around the centroid of passengers the influence range can be formed. In the evacuation space, each passenger would spread influence to others and also be affected by other passengers at each step. The influence range of each passenger generates a superposition effect in a certain area. The larger the value of the superposition, the greater the influence of the grid and vice versa. The attraction of the mainstream crowd can be defined as follows:
F i m = j N p ( r = r 1 m r 2 m S ( P j x + r m ,   P j y + r m ) ) ,
and
S ( P j x + r , P j y + r ) = 1 P j x + r = C i x ,   P j y + r = C i y   S ( P j x + r , P j y + r ) = 0 P j x + r C i x   ,   P j y + r C i y
where ( P j x ,   P j y ) is the centroid coordinate of the passenger j , r m is the influence radius of the passenger, ( r 1 m ,   r 2 m ) represents the scope of influence radius, ( C i x ,   C i y ) is the coordinate of the gird C i , N p is the set of passengers, and F i m is the attraction factor made by mainstream crowd in the grid C i .

3.3.2. Exclusion Between Individuals

When individuals get close enough, the exclusion between individuals emerges because they try to avoid contact with others.
As shown in Figure 13, the green passenger will make an exclusion effect in surrounding grids to avoid to contact with blue passengers. Then, the exclusion factor between passengers can be defined as follows:
F i r = { min j N p ( ( C i x P j x ) 2 + ( C i y P j y ) 2 2 r e ) | C i x P j x | r e   a n d   | C i x P j x | r e 1 | C i x P j x | > r e   o r   | C i x P j x | > r e
where F i r is the exclusion factor made by passengers in the grid C i and r e is the exclusion range of the passenger. The exclusion range contains five layers of neighborhood around the centroid of the passenger.

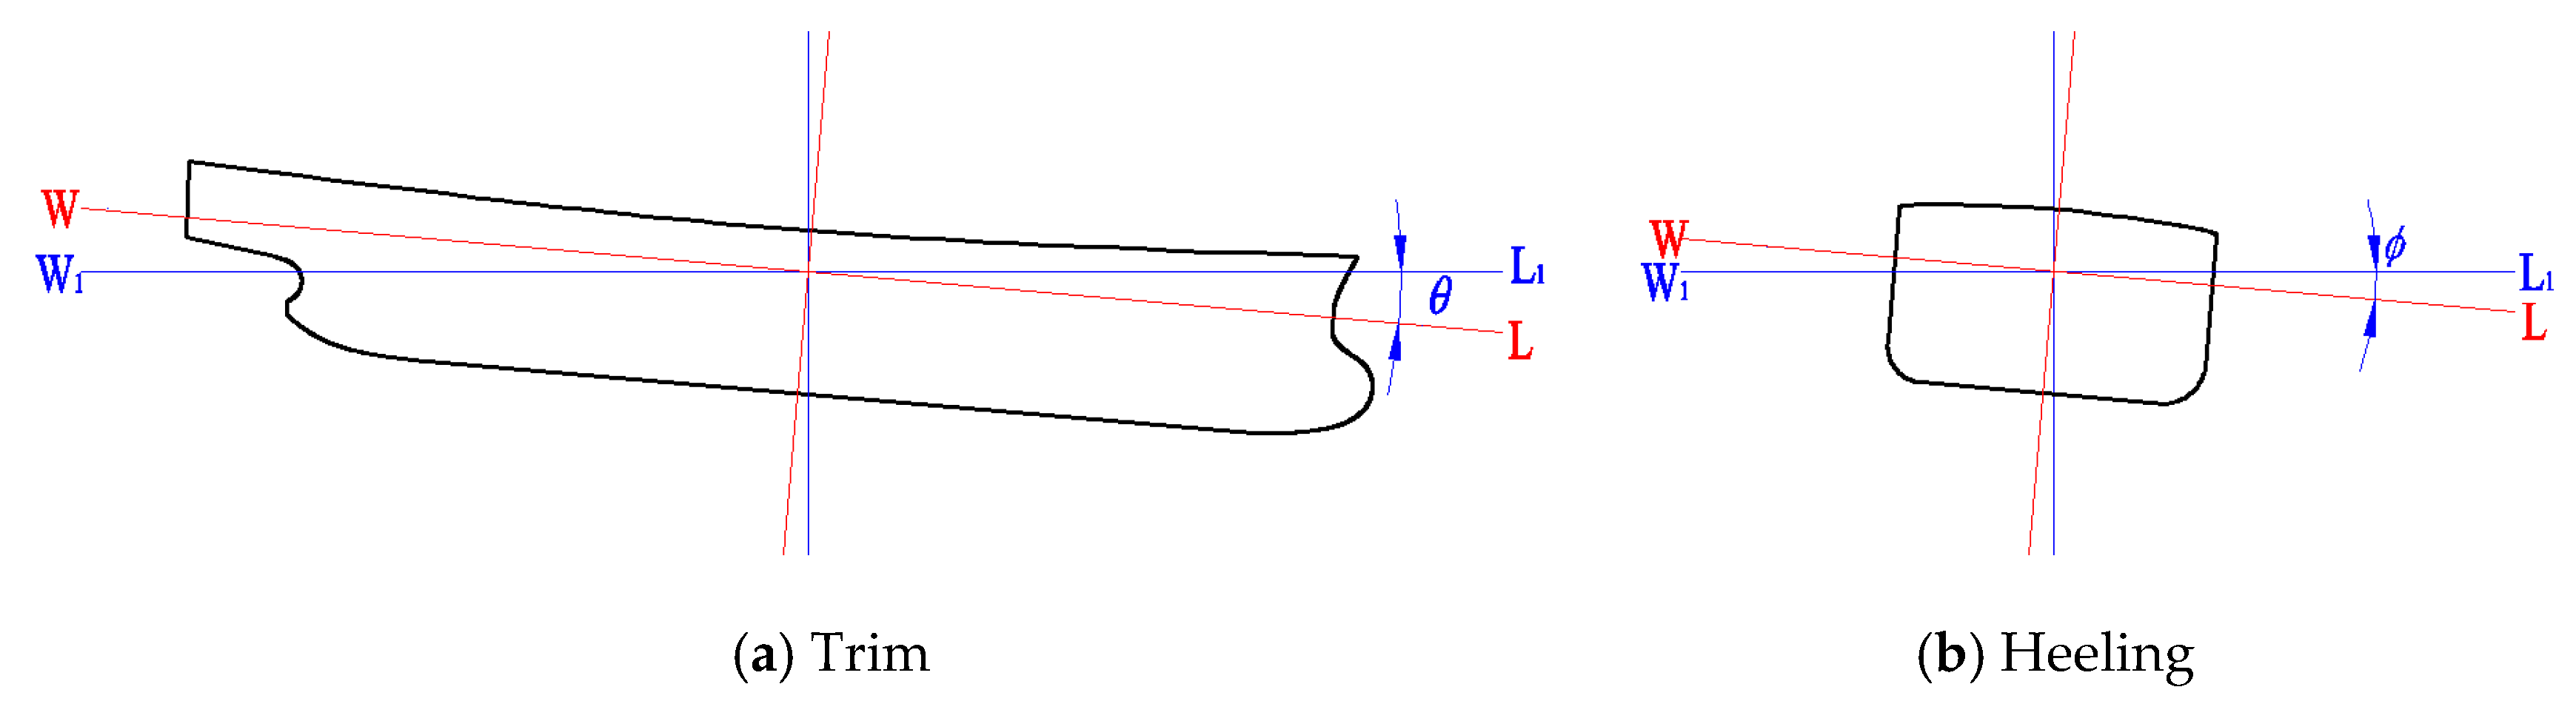
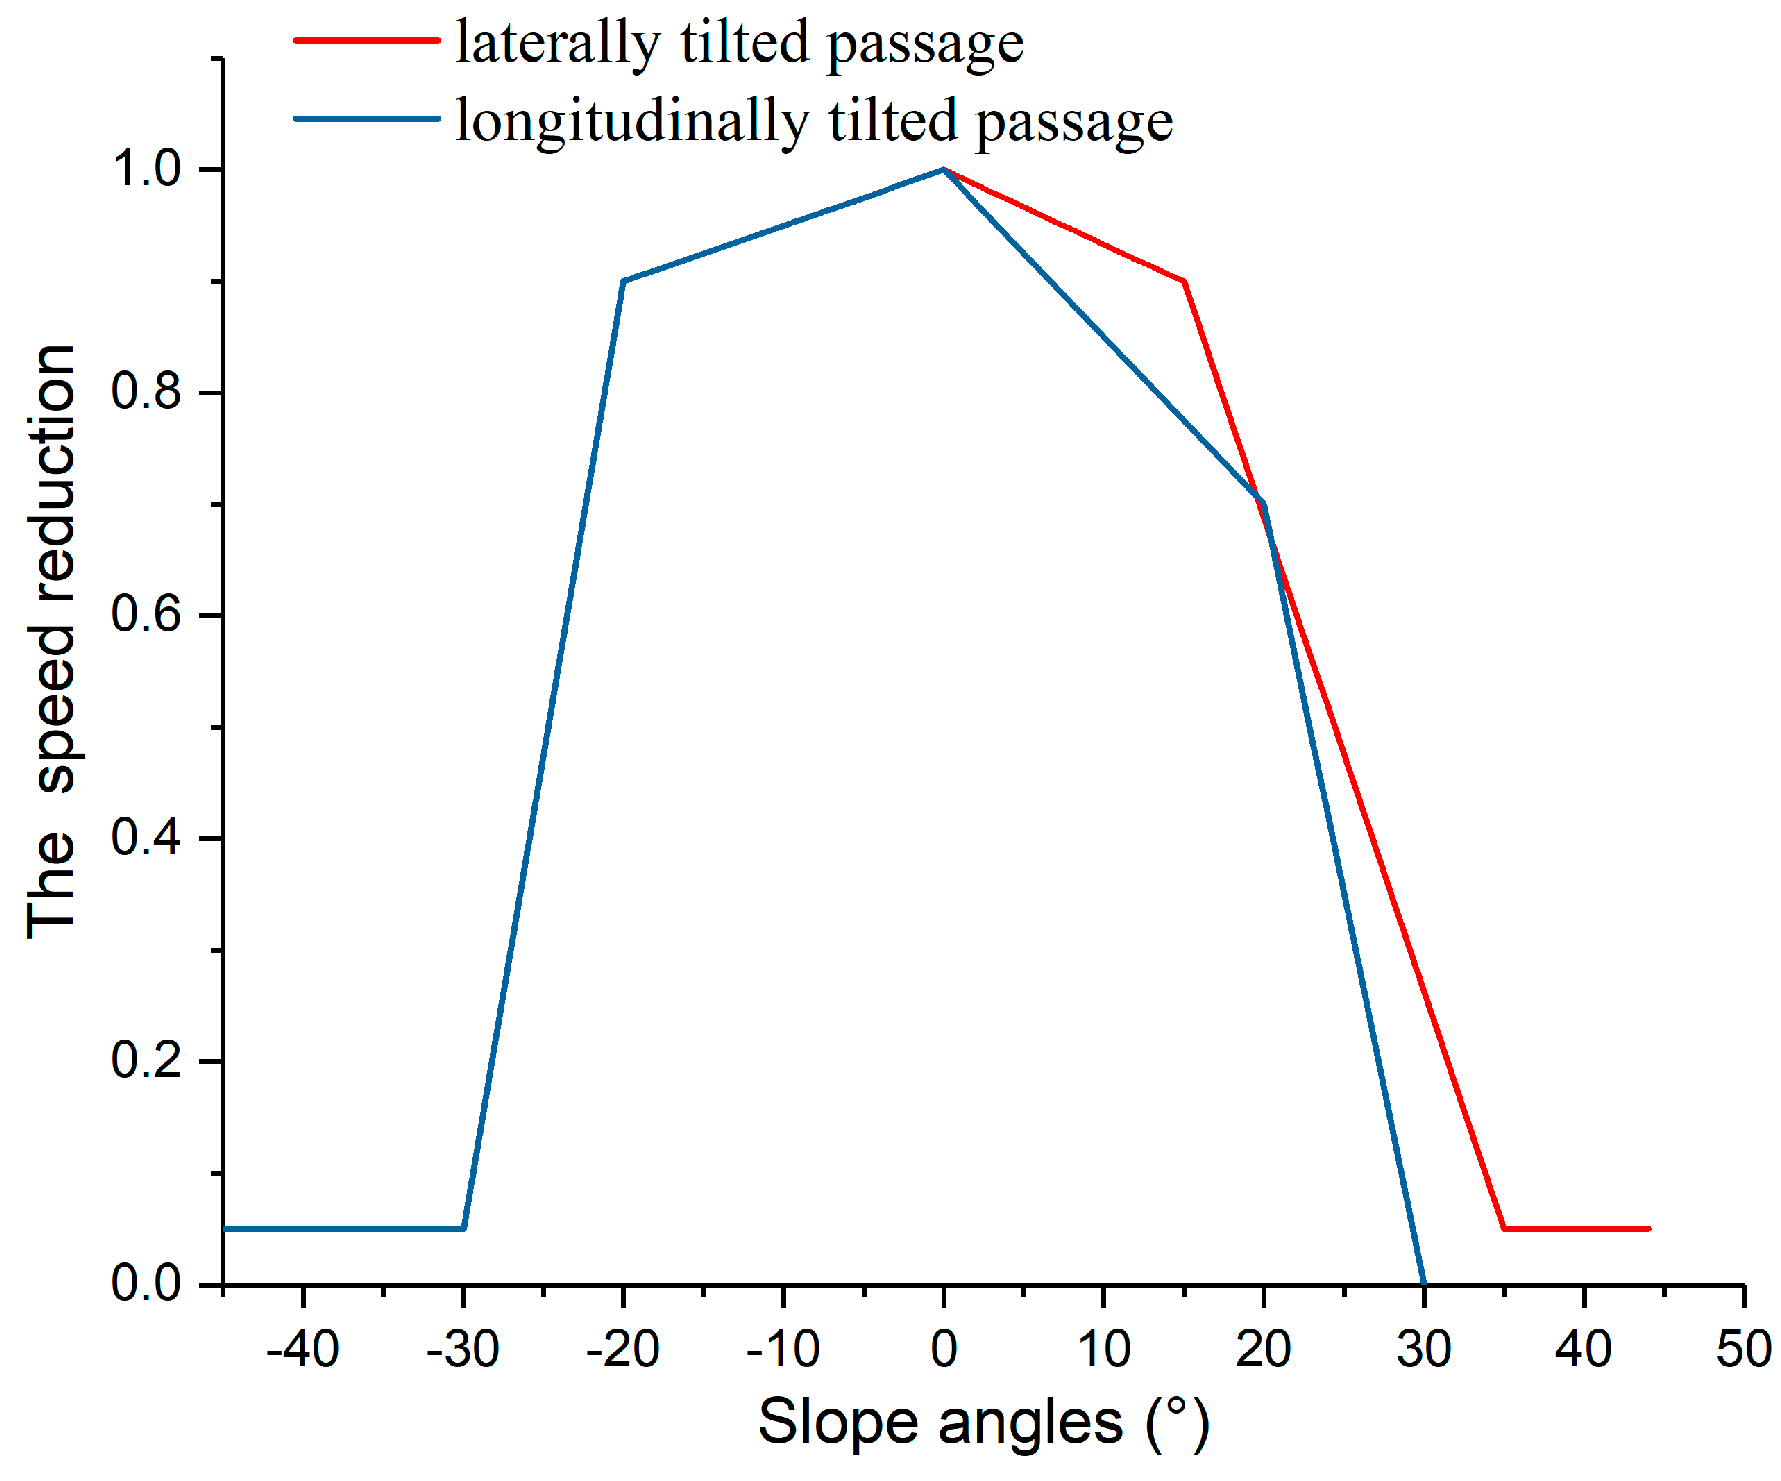
3.4. The Change of Walking Speeds Under the Inclining Condition

As mentioned in Section 2.3, the walking speed would decrease when a passenger walks in an inclining passage. In fact, the walking speed also depends on the orientation of passengers. As shown in Figure 14, passenger No. 1 and passenger No. 2 were in the room. Passenger No. 1 faced the port and passenger No. 2 faced the starboard. Passenger No. 3 and passenger No. 4 were in the corridor. Passenger No. 3 faced the stern and passenger No. 4 faced the bow.
When the ship listed to starboard, four passengers moved along the orientation shown in Figure 14. Then, passengers No. 1 and No. 2 were equivalent to moving in the longitudinally tilted passage and the speed reduction should be calculated by Equation (2). Since passenger No. 1 faced to the port, this passenger walked in an uphill passage and the slope angle was positive. Contrary to passenger No. 1, passenger No. 2 walked in a downhill passage and the slope angle was negative. Passengers No. 3 and No. 4 were equivalent to moving in the laterally tilted passage and the speed reduction should be calculated by Equation (1). When the ship listed to port, passengers No. 3 and No. 4 remained equivalent to moving in the laterally tilted passage. However, the conditions of passengers No. 1 and No. 2 were changed. At this time, passenger No. 1 walked in a downhill passage and passenger No. 2 walked in an uphill passage.
If the ship trimmed by the bow, passengers No. 1 and No. 2 were equivalent to moving in the laterally tilted passage, where speed reduction would be calculated by Equation (1). Passengers No. 3 and No. 4 were equivalent to moving in the longitudinally tilted passage, where speed reduction would be calculated by Equation (2). Passenger No. 3 walked in an uphill passage and passenger No. 4 walked in a downhill passage. If the ship trimmed by the stern, passengers No. 1 and No. 2 would remain equivalent to moving in the laterally tilted passage. However, the conditions of passengers No. 3 and No. 4 were contrary to the condition of the ship trimmed by the bow; passenger No. 3 walked in a downhill passage and passenger No. 4 walked in an uphill passage.
From the above analysis, it can be found that the speed change of the passenger is related to the floating condition of the ship and the orientation of the passenger.

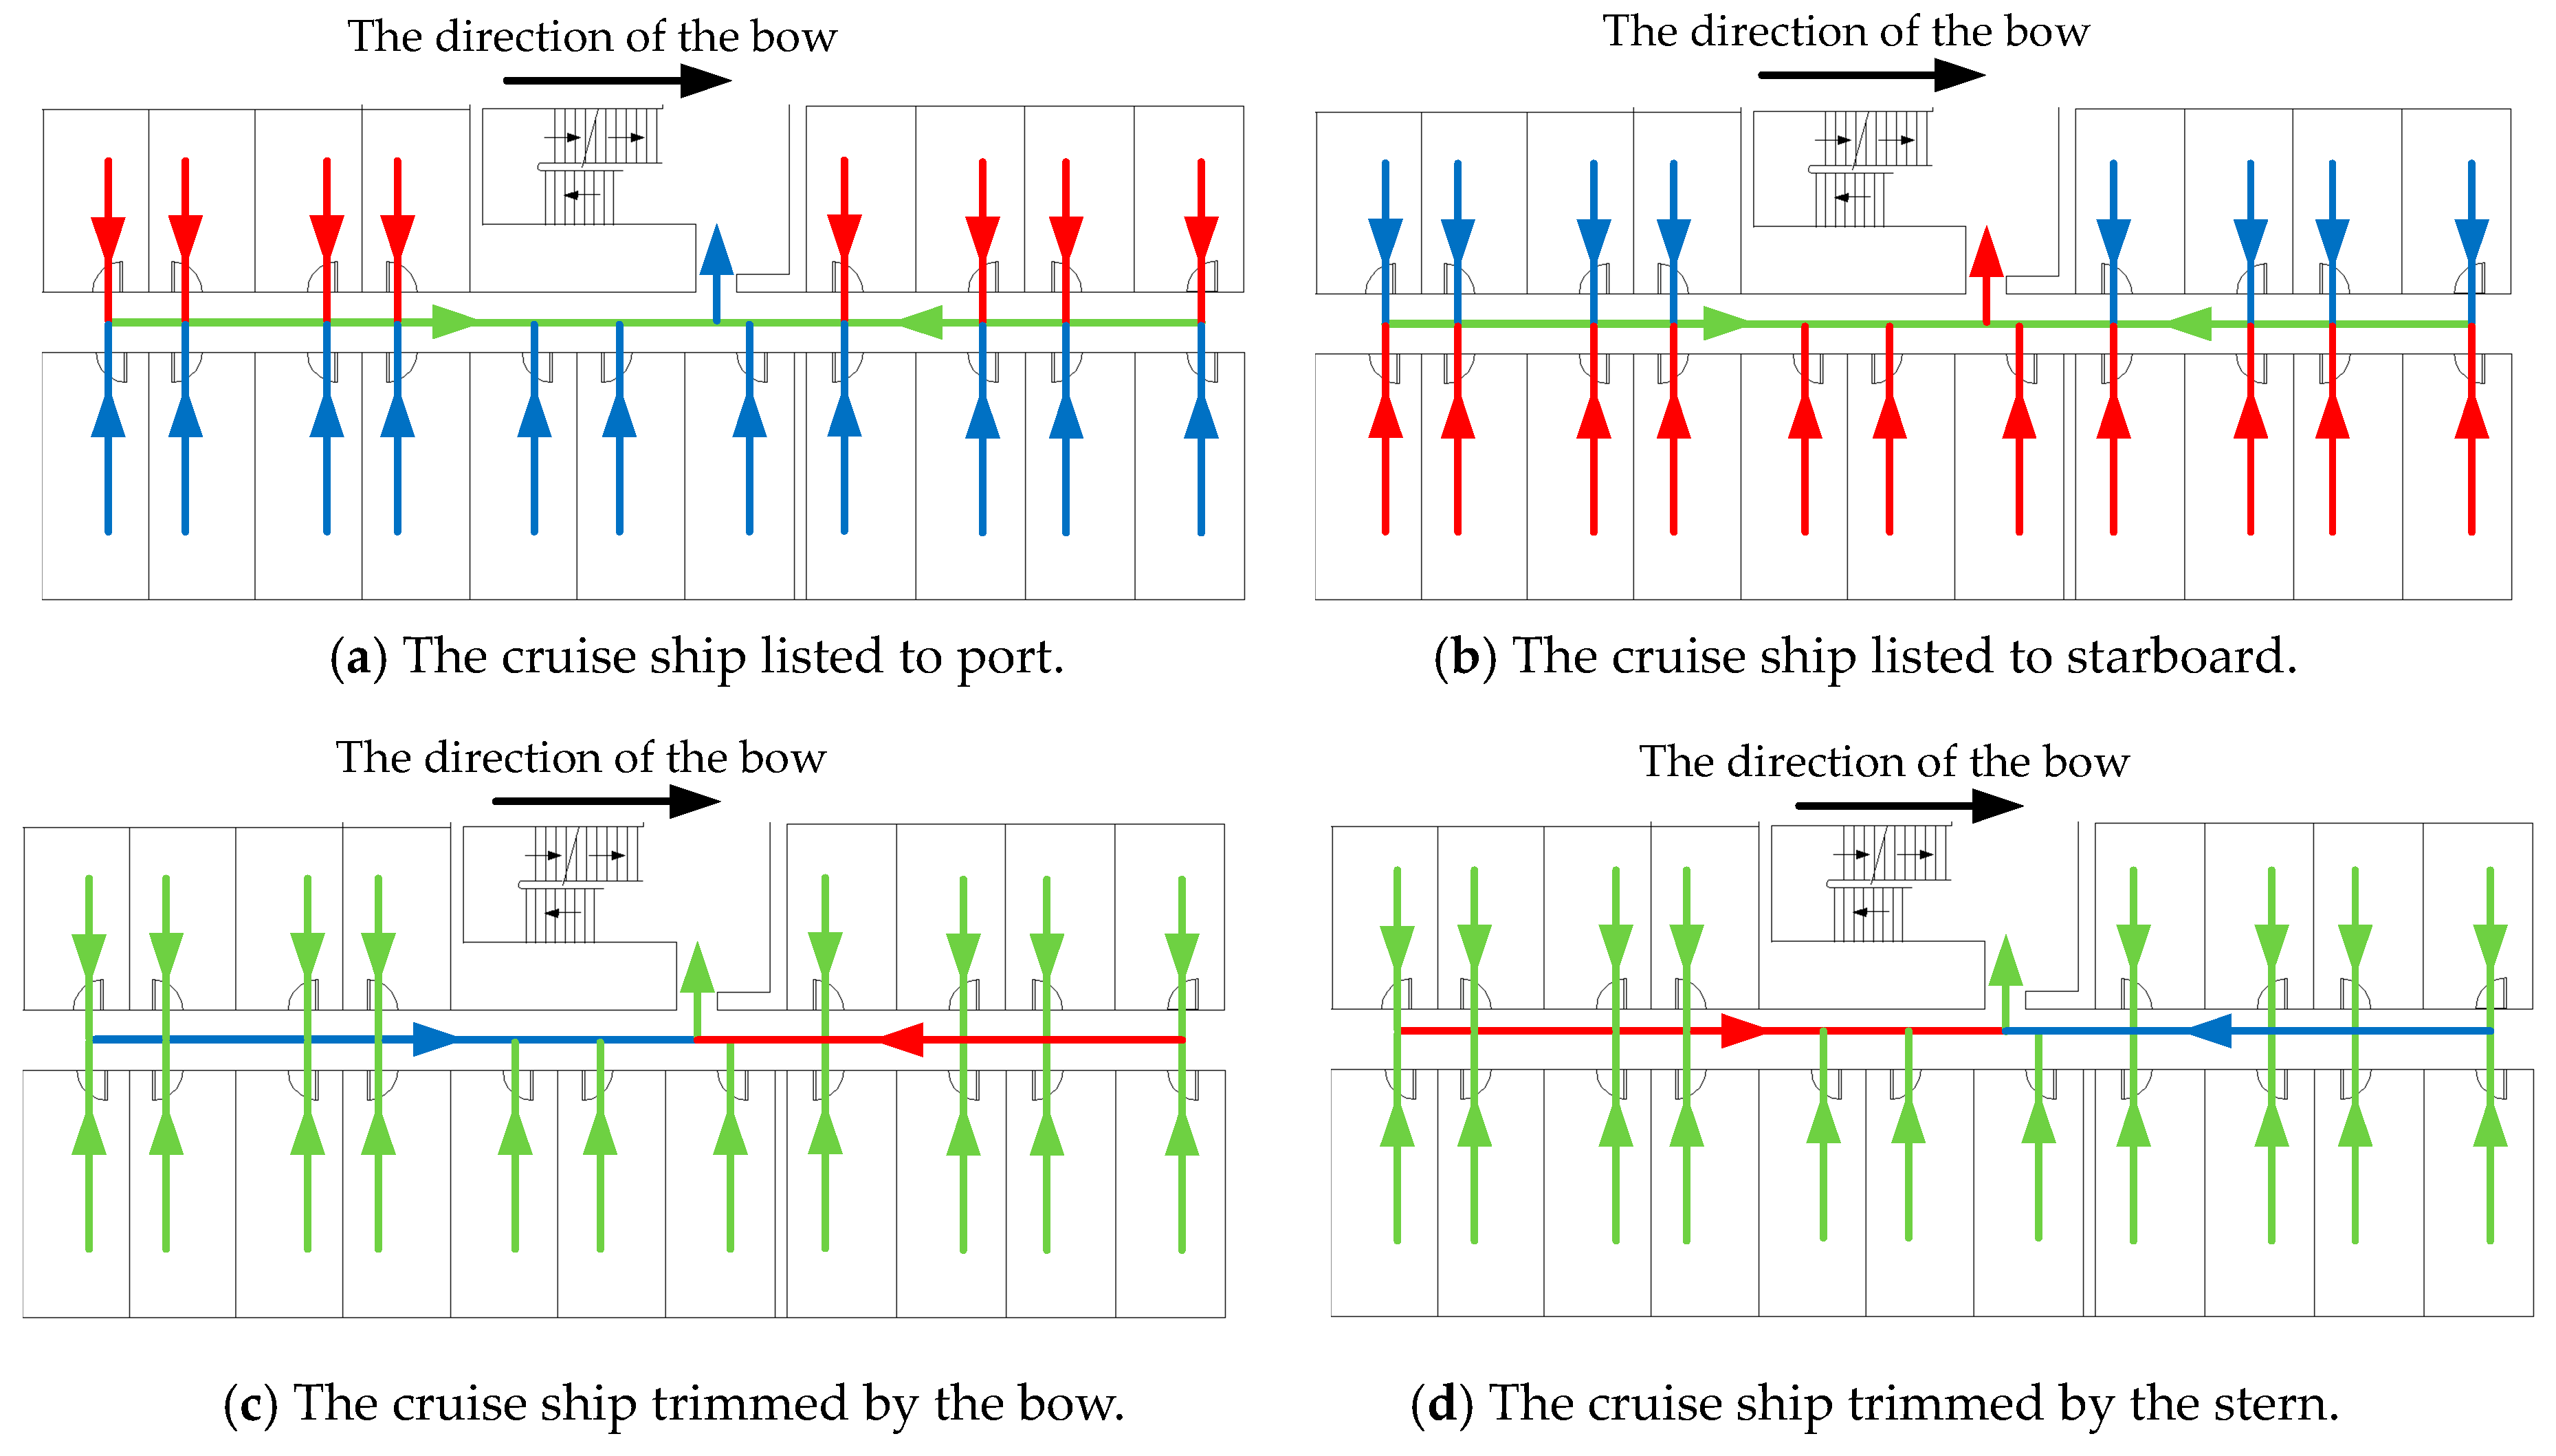
3.5. The Transferring Rule

The movement of passengers is decided by the states of neighboring grids and passengers will transfer to the grid which has the maximum transferring probability. The transferring probability can be defined as follows:
PR i = f b ( α F i l i J N F i l + β F i m i J N F i m + γ F i r i J N F i r ) ,
where PR i is the probability of passengers transfer to the grid C i in the next step. If the grid C i is occupied by a wall, obstacle, or other passengers, f b would be 0. If the grid C i is empty, f b would be 1. J N is the set of neighborhood grids. i J N F i l , i J N F i m and i J N F i r are represented sums of three factors of neighborhood grids and α, β, and γ are the weights of the three factors, respectively.
The target grid that the passenger will transfer to in the next step can be determined by the value of PR i . When PR i is less than or equal to 0, the passenger will stay still.
In the process of evacuation, passengers first compare the maximum value of PR i for four orientations in the neighborhood grids. If the value of PR i in the current orientation is smaller than other orientations, passengers will turn to the orientation in which value of PR i is the largest. If the value of PR i in the current orientation is the largest, passengers will move forward.
The ways of updating states of passengers include sequential update, random update, and simultaneous update. Sequential update requires that all passengers be numbered first and then states of them be updated in order. In random mode, the passenger is selected randomly for updating from those whose states are not updated yet until the states of all passengers are updated. Simultaneous updating used in this paper means the update of states of all passengers was made at the same time. Since simultaneous update conforms to the parallel update rule, conflict occurs when several passengers compete for one position. In that case, passengers are randomly selected for that position from the competitors by the system and the rest will stay where they are. It is assumed that all passengers respond instantaneously to emergencies in the simulation and all passengers move synchronously at the beginning of evacuation. The main process of evacuation simulation is shown in Figure 15.

4. Simulation and Results

In this section, the evacuation process under the upright and inclining condition is simulated by the multi-grid model. The evacuation scenario is set as described in Section 2. A total of 494 passengers were assigned according to the IMO Guidelines, as shown in Figure 16. Initial positions of passengers were assigned randomly and two passengers were randomly assigned to each cabin.

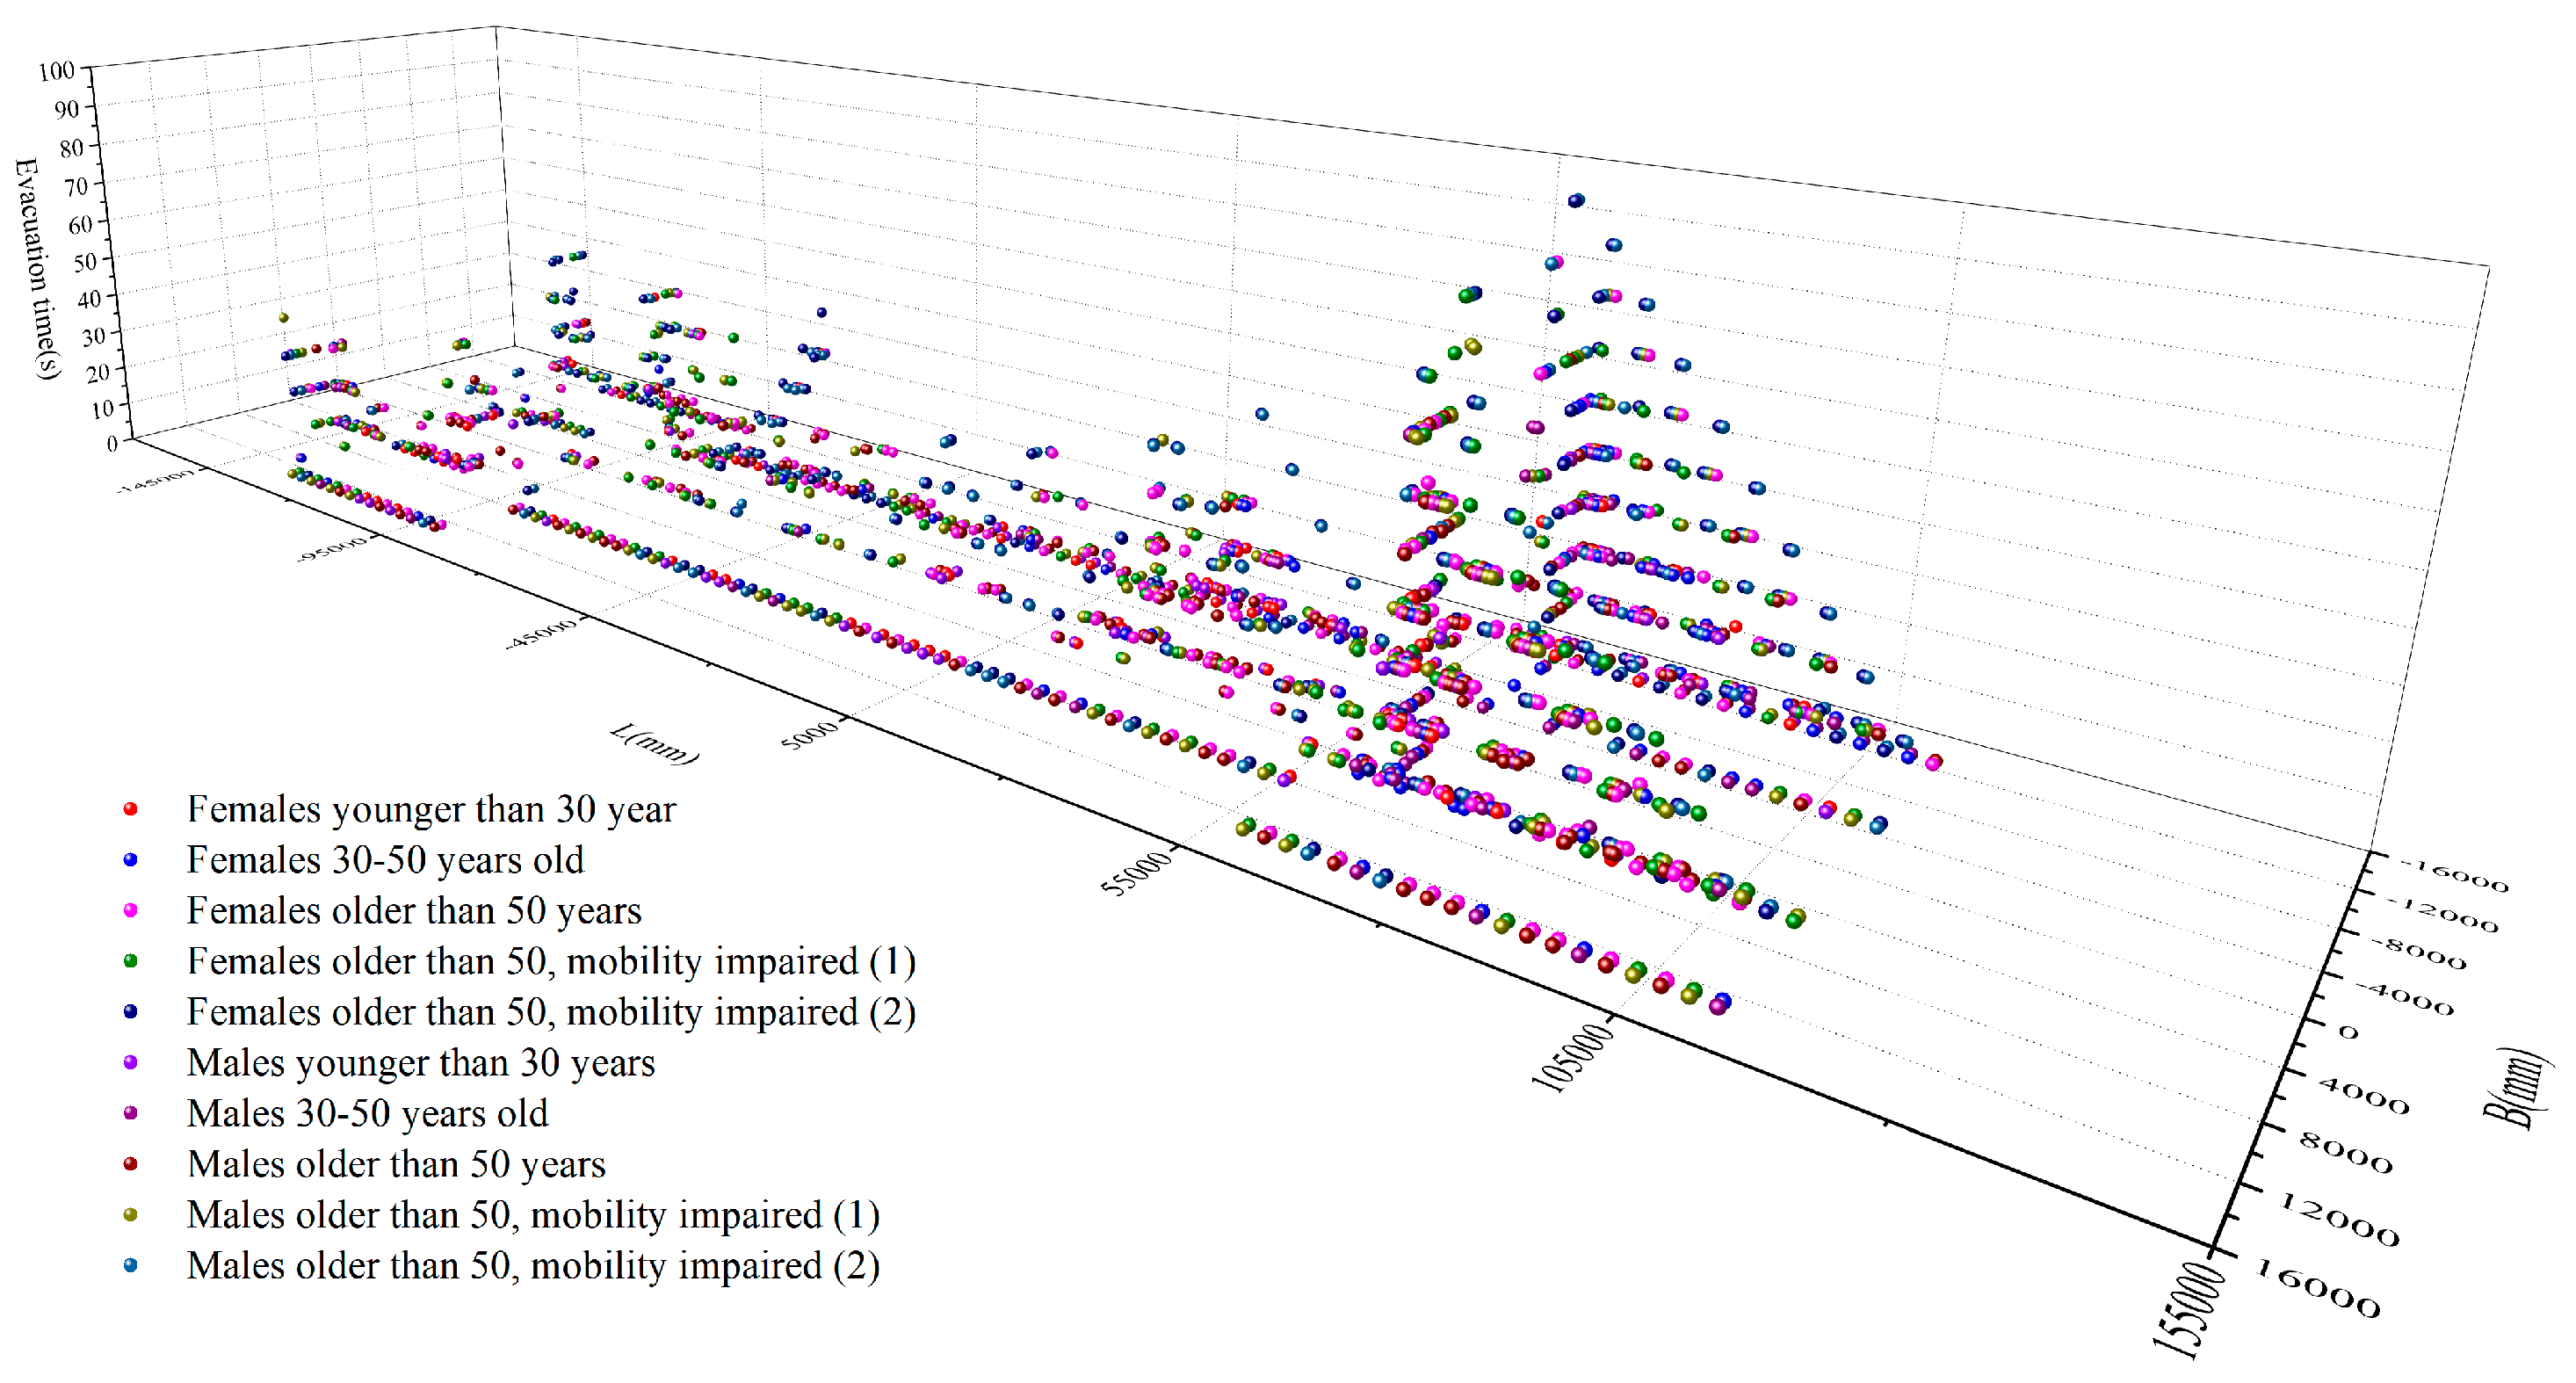
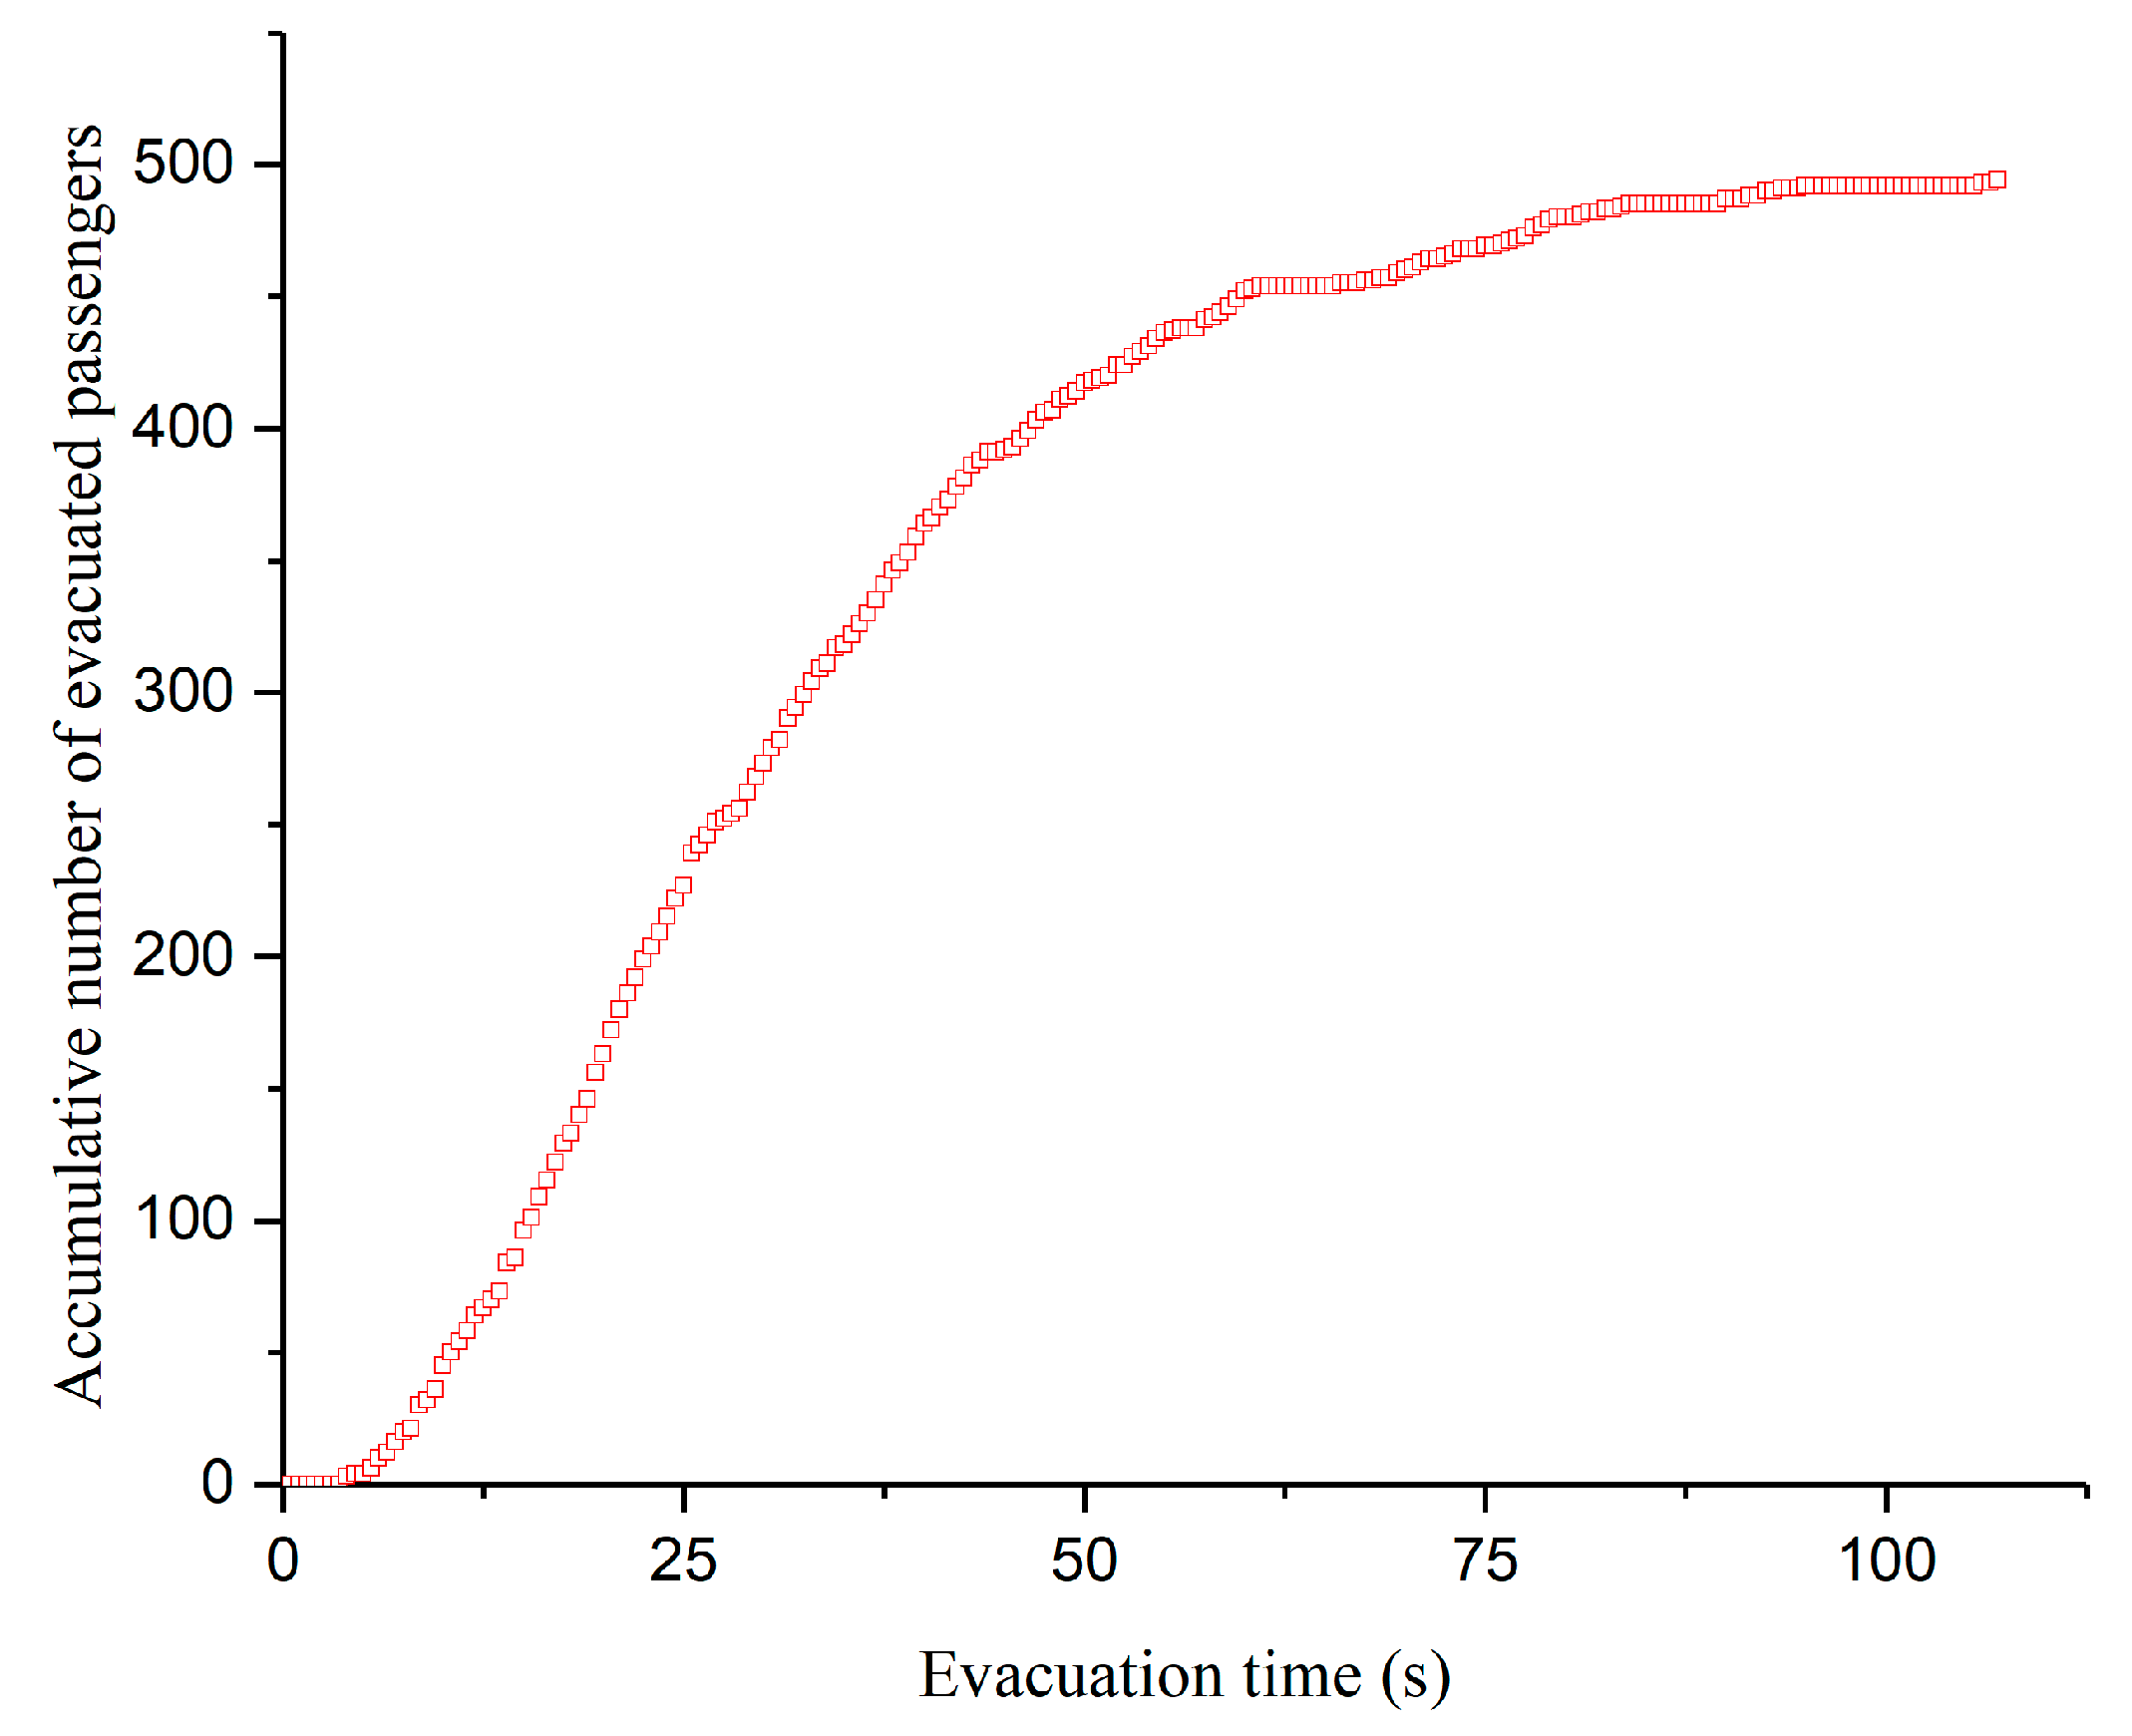
4.1. The Evacuation Simulation Under the Upright Condition

Figure 17 shows the evacuation simulation process of the deck under the upright condition. Passengers start moving from the initial position of the cabin at the beginning of evacuation. The evacuation is completed when all passengers arrive in the stairs area.
Figure 18 shows the changes of passengers’ positions with the evacuation time. L is the coordinate of the length of the cruise ship and B is the coordinate of the width of the cruise ship. The vertical coordinate is the evacuation time and positions of passengers at 0, 10, 20, ···, 100 s are selected to reflect the moving track of passengers. As can be seen from the figure, all passengers were in cabins positions at the beginning of evacuation. With the change of time, passengers gradually moved towards entrance of the stairs. Excepting passengers in the range of length 55,000 mm–105,000 mm, passengers in other areas were evacuated within 70 s. As can be seen from Figure 17, passengers who had not completed the evacuation were located in area D6. Four rows of cabins were arranged in area D6 so there were more passengers in this area at the beginning of the evacuation. Moreover, there was only one stair on the left side of area D6, while stairs were arranged on both sides in other areas. Therefore, more passengers and fewer stairs in area D6 which led to a longer evacuation time. It can be known that the area D6 is the bottleneck of the evacuation.
Figure 19 shows the accumulative number of evacuated passengers changed with the evacuation time and that all passengers were evacuated in 107 s. After 50 s, the rate of curve gradually decreased, which indicated fewer people were evacuated in unit time. It can be seen from Figure 18 that most passengers had completed the evacuation after 50 s and the remaining passengers were mainly located in areas D5 and D6. At this time, fewer people entered the stair area in unit time so fewer people were evacuated per unit time.
Figure 20 shows the maximum and average evacuation time for different categories of passengers. It can be found that the evacuation time of passengers is basically corresponds with their walking speeds.

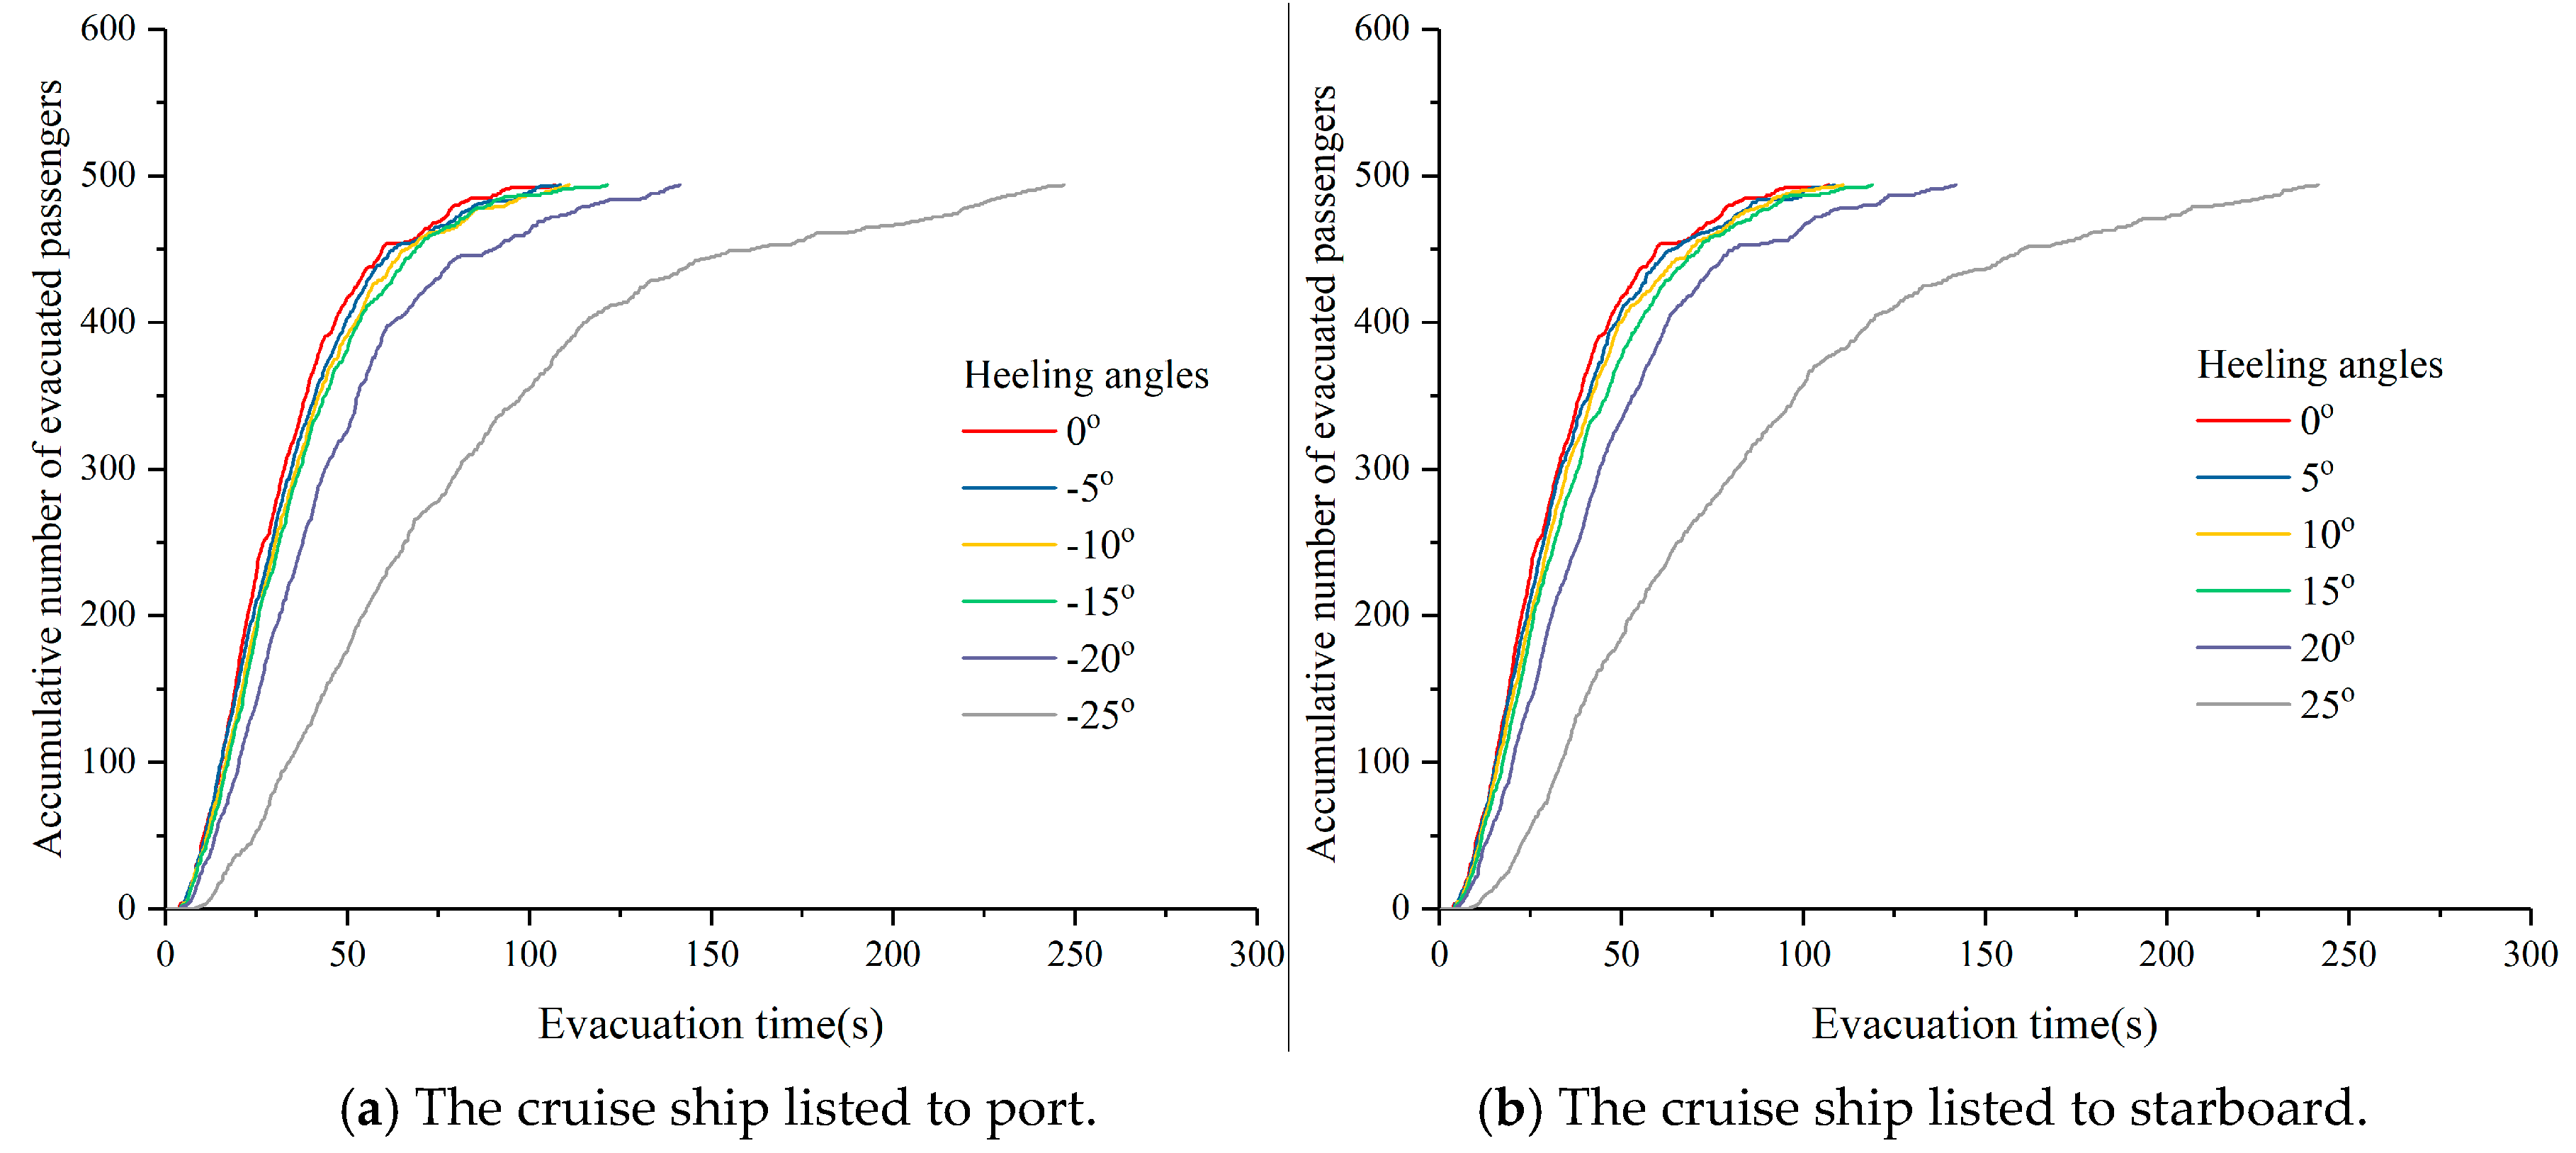
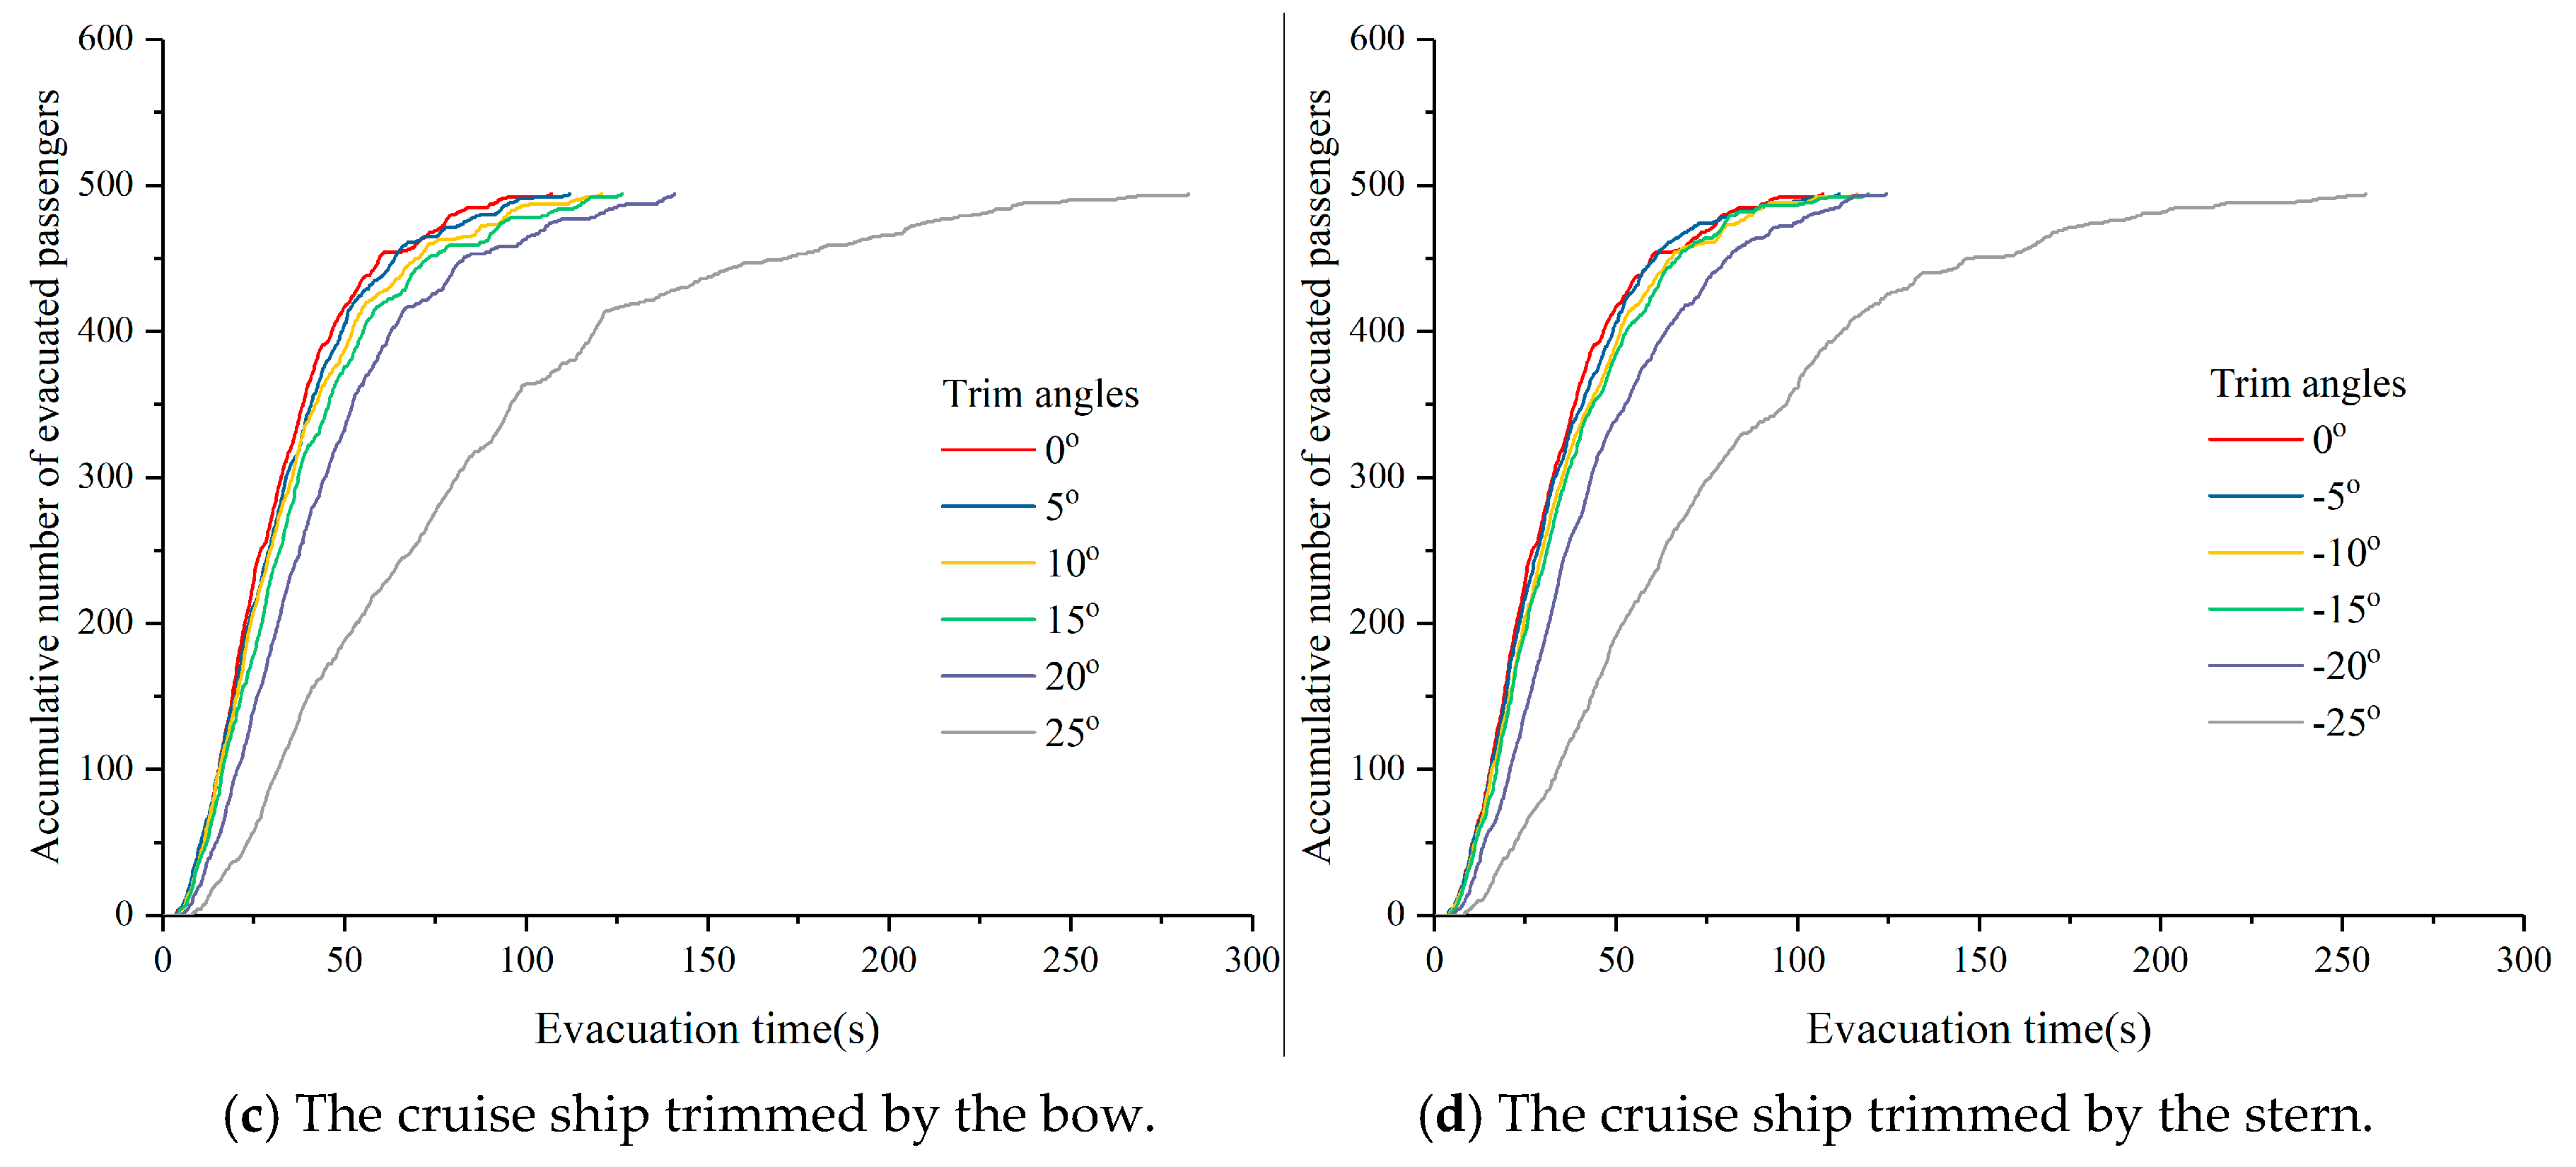
4.2. The Evacuation Simulation Under the Inclining Condition

In order to compare results between two conditions, all initial parameters of simulations under the inclining condition were consistent with the upright condition.
Figure 21a shows the evacuation simulation result when the cruise ship listed to port. In cases where heeling angles ϕ were −5, −10, and −15 degrees, evacuation times were slightly greater than the evacuation time under the upright condition. However, once ϕ was −20 degrees, the evacuation time increased significantly. When the ϕ was −25 degrees, the evacuation time was 247 s, which is 2.3 times of the evacuation time under the upright condition. Figure 21b shows the evacuation simulation result when the cruise ship listed to starboard. There was no obvious difference from the result that listed to port.
Figure 21c shows the evacuation result when the cruise ship trimmed by the bow. When trim angles, θ , were less than or equal to 20 degrees, the evacuation time slowly increased with the increase of angles. However, the evacuation time suddenly increased to 283 s as long as θ was 25 degrees. Figure 21d shows the evacuation result when the cruise ship trimmed by the stern. In the same absolute value of θ , the evacuation time in Figure 21d was lesser than Figure 21c.
From the above analysis in the four conditions, it can be found that the evacuation time suddenly started to significantly increase if inclined angles exceeded 20 degrees. The evacuation times at 25 degrees were nearly double that at 20 degrees, which showed a high nonlinear change. Moreover, there was little difference in evacuation time between listing to port and starboard, but the difference in evacuation time between trimming by the bow and stern was big.
There were two reasons for this phenomenon. The first reason was related to the layout of the deck. Figure 22 shows the track of passengers under the inclining condition. The red, blue, and green lines represent uphill, downhill, and laterally tilted passages, respectively. Figure 22a shows the track of passengers when the cruise ship listed to port. It can be seen that passengers in outside cabins were in a downhill passage, while passengers in inner cabins were in an uphill passage. When all passengers walked out of the cabins, they would move in a laterally tilted passage before arriving at the stairs. At the entrance of the stairs, passengers would turn in the direction of the stairs, whereupon they were in a laterally tilted passage again. During the whole evacuation process, the slope was changed with the route and the speed reduction of passengers was different according to the slope of the passage. The second reason was related to the speed reduction. Figure 23 shows the speed reduction changed with slope angles; this relationship is obtained by Equations (1) and (2). When slope angles were less than 15 degrees, lateral and longitudinal speed reduction were changed linearly with slope angles. Once slope angles exceeded 15 degrees, the ratio of lateral speed reduction began to increase. After absolute values of slope angles were greater than 20 degrees, the ratio of longitudinal speed reduction began to increase. Moreover, the decreasing ratio of longitudinal speed reduction was greater than the decreasing ratio of lateral speed reduction.
Therefore, when inclined angles were less than 20 degrees, the evacuation time was increased nearly linearly with the angles. As long as inclined angles were 20 degrees, the ratio of time increased due to the increasing ratio of lateral speed reduction. Once inclined angles were 25 degrees, the evacuation time increased significantly because the ratio of longitudinal speed reduction increased substantially. So, there was a highly nonlinear relationship between the evacuation time and inclined angles. Figure 22b shows the track of passengers when the cruise ship listed to starboard. The slope in the corridor was the same with the condition of listing to port but in the cabins was the opposite. As cabins were arranged symmetrically along the transverse direction of the cruise ship, there was little difference between the two simulation results.
Figure 22c,d show the track of passengers under the condition of trimmed by the bow and stern. It can be seen that passengers walked a laterally tilted passage when they were in the cabins. Passengers were in a longitudinally tilted passage if they entered the corridor and they were in an uphill or downhill passage according to their orientation. Except in area D6, passengers in other areas were generally divided into two groups when they walked in the corridor. One group moved toward the direction of the bow and entered the stairs on the right of the area. The other group moved toward the direction of the stern and entered the stairs on the left of the area. Compared with other areas, area D6 had the largest number of passengers and these passengers had to move toward the direction of the stern and then could arrive at the stairs. When the cruise ship trimmed by the bow, these passengers were in an uphill passage. On the contrary, these passengers were in a downhill passage if the cruise ship trimmed by the stern. According to Figure 23, uphill speed reduction was greater than downhill speed reduction at the same absolute value of the angle. Therefore, the walking speed of these passengers was slower and more time was needed to complete evacuation when the cruise ship trimmed by the bow.

5. Conclusions

In this study, a multi-grid model was used to simulate the evacuation process of cruise ships. This model can accurately represent the size of the human body and the passage. The orientation of passengers was added to the model and the rules for passengers’ movement and turning were defined. Moreover, the relationship between the passengers’ orientation and the walking speed under inclining condition was analyzed in detail. By considering the effects of static and dynamic floor fields on passengers, the transferring probability of passengers moved between grids was established and passengers would move to the grid which had the maximum transferring probability.
The deck of the cruise ship was taken as the evacuation scenario and four parameters of the scenario were set according to the IMO guidelines. The evacuation processes of scenarios under upright and inclining conditions were simulated. Through the analysis of the simulation result in the upright condition, it was found that area D6 was the bottleneck of the evacuation for this area and needed the longest time to evacuate passengers. In the inclining condition, the evacuation time was longer than the upright condition. When the inclined angle was less than or equal to 15 degrees, the evacuation times were changed nearly linearly with angles in the four conditions. After the inclined angle was greater than 15 degrees, the evacuation time increased significantly, which showed nonlinear changes. When the inclined angle was equal to 25 degrees, the evacuation time under trimmed by the bow was the longest. Through the simulation, the evacuation bottleneck and the changing rules of evacuation time under the inclining condition were obtained. We hope that this study could provide a reference for making the evacuation schemes for cruise ships in the future.

Author Contributions

Conceptualization, methodology and writing, M.H.; review and editing, W.C., H.Z.

Funding

This research was funded by Special Project of Large-scale Cruise Ship Research and Development ([2016] No. 543), Ministry of Industry and Information Technology, China.

Acknowledgments

The authors would like to thank the anonymous reviewers and academic editor for their valuable comments and suggestions.

Conflicts of Interest

The authors declare no conflict of interest.

References

  1. Wang, H. Annual Report on China’s Cruise Industry 2018; Social Sciences Academic Press: Beijing, China, 2018; pp. 3–4. [Google Scholar]
  2. International Maritime Organization. Guidelines for Evacuation Analysis for New and Existing Passenger Ships; International Maritime Organization: London, UK, 2016; p. 32. [Google Scholar]
  3. Vanem, E.; Skjong, R. Designing for safety in passenger ships utilizing advanced evacuation analyses—A risk based approach. Saf. Sci. 2006, 44, 111–135. [Google Scholar] [CrossRef]
  4. Vanem, E.; Skjong, R. Fire and evacuation risk assessment for passenger ships. In Proceedings of the 10th International Fire Science & Engineering Conference (Interflam), Edinburgh, Scotland, 5–7 July 2004. [Google Scholar]
  5. Vanem, E.; Skjong, R. Collision and Grounding of Passenger Ships—Risk Assessment and Emergency Evacuations. In Proceedings of the 3rd International Conference on Collision and Grounding of Ships(ICCGS), Izu, Japan, 25–27 October 2004; pp. 195–202. [Google Scholar]
  6. Pagiaziti, A.; Maliaga, E.; Eliopoulou, E.; Zaraphonitis, G.; Hamann, R. Statistics of collision, grounding and contact accidents of passenger and container ships. In Proceedings of the 5th International Symposium on ship Operations, Management and Economics (SOME), Athens, Greece, 28–29 May 2015; pp. 28–29. [Google Scholar]
  7. Galea, E.R.; Deere, S.; Filippidis, L.; Brown, R.; Nicholls, I.; Hifi, Y.; Besnard, N. The SAFEGUARD validation data-set and recommendations to IMO to update MSC Circ 1238. RINA, Royal Institution of Naval Architects. In Proceedings of the Safeguard: Passenger Evacuation Seminar 2012, London, UK, 30 November 2012; pp. 41–60. [Google Scholar]
  8. Galea, E.R.; Deere, S.; Brown, R.; Filippidis, L. An Experimental Validation of an Evacuation Model using Data Sets Generated from Two Large Passenger Ships. J. Ship Res. 2013, 57, 155–170. [Google Scholar] [CrossRef]
  9. Galea, E.R.; Deere, S.; Brown, R.; Filippidis, L. A Validation Data-Set and Suggested Validation Protocol for Ship Evacuation Models. Fire Saf. Sci. 2014, 11, 1115–1128. [Google Scholar] [CrossRef] [Green Version]
  10. EVI—Evacuation Analysis Software. Available online: http://www.brookesbell.com/service/software/evi-escape-evacuation-analysis (accessed on 27 August 2019).
  11. Fire Safety Engineering Group. Available online: http://fseg.gre.ac.uk/leaflets/exodusleaflets.html (accessed on 27 August 2019).
  12. Gwynne, S.M.V.; Galea, E.R.; Lyster, C.; Glen, I. Analysing the Evacuation Procedures Employed on a Thames Passenger Boat Using the maritimeEXODUS Evacuation Model. Fire Technol. 2003, 39, 225–246. [Google Scholar] [CrossRef]
  13. Elnabawybahriz, M.N.; Hassan, M.H.N. The impact of low efficient evacuation plan during costa concordia accident. Int. J. Mech Sci. 2016, 5, 43–54. [Google Scholar]
  14. Kim, H.; Roh, M.; Han, S. Passenger evacuation simulation considering the heeling angle change during sinking. Int. J. Nav Arch. Ocean. 2019, 11, 329–343. [Google Scholar] [CrossRef]
  15. Ha, S.; Ku, N.; Roh, M.; Lee, K. Cell-based evacuation simulation considering human behavior in a passenger ship. Ocean. Eng 2012, 53, 138–152. [Google Scholar] [CrossRef]
  16. Yuan, G.; Zhang, L.; Liu, L.; Wang, K. Passengers’ Evacuation in Ships Based on Neighborhood Particle Swarm Optimization. Math. Probl. Eng. 2014. [Google Scholar] [CrossRef]
  17. Nevalainen, J.; Ahola, M.K.; Kujala, P. Modeling passenger ship evacuation from passenger perspective. In Proceedings of the Marine Design 2015, London, UK, 2–3 September 2015. [Google Scholar]
  18. Zhu, C.; Han, D.; Chen, M.; Yao, J. Accessibility evaluation of ship evacuation based on DEA. J. Harbin Eng. Univ. 2015, 6, 741–745. [Google Scholar]
  19. Balakhontceva, M.; Karbovskii, V.; Rybokonenko, D.; Boukhanovsky, A.V. Multi-agent Simulation of Passenger Evacuation Considering Ship Motions. Procedia Comput. Sci. 2015, 66, 140–149. [Google Scholar] [CrossRef] [Green Version]
  20. Rybokonenko, D.; Balakhontceva, M.; Voloshin, D.V.; Karbovskii, V. Agent-based Modeling of Crowd Dynamics on a Moving Platform. Procedia Comput. Sci. 2015, 66, 317–327. [Google Scholar] [CrossRef] [Green Version]
  21. Balakhontceva, M.; Karbovskii, V.; Sutulo, S.; Boukhanovsky, A.V. Multi-agent Simulation of Passenger Evacuation from a Damaged Ship under Storm Conditions. In Proceedings of the International Conference on Conceptual Structures, Annecy, France, 5–7 July 2016; pp. 2455–2464. [Google Scholar]
  22. Li, J.; Zhu, H. A Risk-based Model of Evacuation Route Optimization under Fire. Procedia Eng. 2018, 211, 365–371. [Google Scholar] [CrossRef]
  23. Park, K.; Ham, S.; Ha, S. Validation of advanced evacuation analysis on passenger ships using experimental scenario and data of full-scale evacuation. Comput. Ind. 2015, 71, 103–115. [Google Scholar] [CrossRef]
  24. Roh, M.; Ha, S. Advanced ship evacuation analysis using a cell-based simulation model. Comput. Ind. 2013, 64, 80–89. [Google Scholar] [CrossRef]
  25. Ginnis, A.I.; Kostas, K.V.; Politis, C.G.; Kaklis, P.D. VELOS: A VR platform for ship-evacuation analysis. Comput. Aid. Des. 2010, 42, 1045–1058. [Google Scholar] [CrossRef] [Green Version]
  26. Kim, H.; Park, J.; Lee, D.; Yang, Y. Establishing the methodologies for human evacuation simulation in marine accidents. Comput. Ind. Eng. 2004, 46, 725–740. [Google Scholar] [CrossRef]
  27. Schmidt, B. Modelling of Human Behavior: The PECS Reference Model. In Proceedings of the 14th European Simulation Symposium and Exhibition, Dresden, Germany, 23–26 October 2002. [Google Scholar]
  28. Liu, B.Y.; Zhou, X.S.; Yan, S.Y. Influence of carrier corridor configuration on evacuation performance. Chin. J. Ship Res. 2018, 13, 1–6. [Google Scholar]
  29. Ni, B.; Zhen, L.; Pei, Z.; Xiang, L. An Evacuation Model for Passenger Ships That Includes the Influence of Obstacles in Cabins. Math. Probl. Eng. 2017. [Google Scholar] [CrossRef]
  30. Ni, B.; Li, Z.; Li, X. Agent-Based Evacuation in Passenger Ships Using a Goal-Driven Decision-Making Model. Pol. Marit. Res. 2017, 24, 56–67. [Google Scholar] [CrossRef] [Green Version]
  31. Ni, B.; Lin, Z.; Li, P. Agent-based evacuation model incorporating life jacket retrieval and counterflow avoidance behavior for passenger ships. J. Stat. Mech. Theory Exp. 2018, 12, 123405. [Google Scholar] [CrossRef]
  32. Sarvari, P.A.; Cevikcan, E. A Simulation-Based Methodology for Evaluating the Factors on Ship Emergency Evacuation. Trans. R. Inst. Nav. Archit. Part A 2017, 159, 415–434. [Google Scholar]
  33. Bles, W.; Nooy, S.; Boer, L.C. Influence of Ship Listing and Ship Motion on Walking Speed. In Proceedings of the First Conference on Pedestrian and Evacuation Dynamics, Duisburg, Germany, 4–6 April 2001; pp. 437–452. [Google Scholar]
  34. Lee, D.; Park, J.H.; Kim, H. A study on experiment of human behavior for evacuation simulation. Ocean. Eng. 2004, 31, 931–941. [Google Scholar] [CrossRef]
  35. Sun, J.; Lu, S.; Lo, S.; Jian, M.; Xie, Q. Moving characteristics of single file passengers considering the effect of ship trim and heeling. Physica A 2018, 490, 476–487. [Google Scholar] [CrossRef]
  36. Koss, L.L.; Moore, A.; Porteous, B. Human mobility data for movement on ships. In Proceedings of the International Conference on Fire at Sea, London, UK, 20–21 November 1997; pp. 11–21. [Google Scholar]
  37. International Maritime Organization. Passenger Ship Safety Time Dependent Survival Probability of a Damaged Passenger Ship; International Maritime Organization: London, UK, 2006; pp. 46–47. [Google Scholar]
  38. Kirchner, A.; Schadschneider, A. Simulation of evacuation processes using a bionics-inspired cellular automaton model for pedestrian dynamics. Physica A 2002, 312, 260–276. [Google Scholar] [CrossRef] [Green Version]
  39. Nishinari, K.; Kirchner, A.; Namazi, A.; Schadschneider, A. Extended Floor Field CA Model for Evacuation Dynamics. Trans. Inf. Syst. D 2004, 87, 726–732. [Google Scholar]
  40. Nagai, R.; Fukamachi, M.; Nagatani, T. Experiment and simulation for counterflow of people going on all fours. Physica A 2005, 358, 516–528. [Google Scholar] [CrossRef]
  41. Helbing, D.; Molnar, P. Social force model for pedestrian dynamics. Phys. Rev. E 1995, 51, 4282–4286. [Google Scholar] [CrossRef] [Green Version]
  42. Helbing, D.; Farkas, I.J.; Vicsek, T. Simulating dynamical features of escape panic. Nature 2000, 407, 487–490. [Google Scholar] [CrossRef] [Green Version]
  43. Henderson, L.F. On the fluid mechanics of human crowd motion. Trans. Res. 1974, 8, 509–515. [Google Scholar] [CrossRef]
  44. Helbing, D. A Fluid-Dynamic Model for the Movement of Pedestrians. Complex. Syst. 1992, 6, 391–415. [Google Scholar]
  45. Mei, Y.; Liang, Y.; Tu, Y. A Multi-Granularity 2-Tuple QFD Method and Application to Emergency Routes Evaluation. Symmetry 2018, 10, 484. [Google Scholar] [CrossRef]
  46. Okazaki, S.; Yamamoto, C. A Study of Pedestrian Movement in Architectural Space Part 4: Pedestrian Movement Represented in Perspective. Trans. AIJ 1981, 299, 105–113. [Google Scholar]
  47. Yu, W.J.; Chen, R.; Dong, L.Y.; Dai, S.Q. Centrifugal force model for pedestrian dynamics. Phys. Rev. E Stat. Nonlin. Soft Matter. Phys. 2005, 72, 26112. [Google Scholar] [CrossRef] [PubMed]
  48. Yang, W.; Hu, Y.; Hu, C.; Yang, M. An Agent-Based Simulation of Deep Foundation Pit Emergency Evacuation Modeling in the Presence of Collapse Disaster. Symmetry 2018, 10, 581. [Google Scholar] [CrossRef]
  49. Hai-Jun, H.; Ren-Yong, G. Static floor field and exit choice for pedestrian evacuation in rooms with internal obstacles and multiple exits. Phys. Rev. E Stat. Nonlin. Soft Matter. Phys. 2008, 78, 21131. [Google Scholar]
  50. Fu, Z.; Zhou, X.; Zhu, K.; Chen, Y.; Zhuang, Y.; Hu, Y.; Yang, L.; Chen, C.; Jian, L. A floor field cellular automaton for crowd evacuation considering different walking abilities. Physica A 2015, 420, 294–303. [Google Scholar] [CrossRef]
  51. Zheng, Y.; Li, X.; Jia, B.; Jiang, R. Simulation of pedestrians’ evacuation dynamics with underground flood spreading based on cellular automaton. Simul. Model. Pract. Theory 2019, 94, 149–161. [Google Scholar] [CrossRef]
  52. Song, W.; Xu, X.; Wang, B.H.; Ni, S. Simulation of evacuation processes using a multi-grid model for pedestrian dynamics. Physica A 2006, 363, 492–500. [Google Scholar] [CrossRef]
  53. China National Institute of Standardization. Human Dimension of Chinese Adults; Standards Press of China: Beijing, China, 1988; pp. 10–11. [Google Scholar]
  54. Gong, J. Human Size and Indoor Space; Tianjin Science and Technology Press: Tianjin, China, 1999; 208p. [Google Scholar]
  55. Cao, S.; Song, W.; Lv, W.; Fang, Z. A multi-grid model for pedestrian evacuation in a room without visibility. Phys. A 2015, 436, 45–61. [Google Scholar] [CrossRef]
  56. Fu, L.B. A Study on Pedestrian and Evacuation Dynamics Involving Human Behavior. Ph.D. Thesis, University of Science and Technology of China, Hefei, China, 2017. [Google Scholar]
  57. Gallup, A.C.; Hale, J.J.; Sumpter, D.J.T.; Simon, G.; Alex, K.; Krebs, J.R.; Couzin, I.D. Visual attention and the acquisition of information in human crowds. Proc. Natl. Acad. Sci. USA 2012, 109, 7245–7250. [Google Scholar] [CrossRef] [Green Version]
Figure 1. The evacuation scenario of the deck.
Symmetry 11 01166 g001
Figure 2. Typical size on the deck.
Symmetry 11 01166 g002
Figure 3. Trim and heeling.
Symmetry 11 01166 g003
Figure 4. Moore neighborhood of the cellular automata.
Symmetry 11 01166 g004
Figure 5. The passenger model.
Symmetry 11 01166 g005
Figure 6. The orientation of passengers.
Symmetry 11 01166 g006
Figure 7. The way of a passenger’s detour.
Symmetry 11 01166 g007
Figure 8. The movement range of passengers at one step.
Symmetry 11 01166 g008
Figure 9. The turning rule of passengers.
Symmetry 11 01166 g009
Figure 10. The behavior rule of passengers at the exit.
Symmetry 11 01166 g010
Figure 11. The static floor field of the deck.
Symmetry 11 01166 g011
Figure 12. The range of influence by an individual.
Symmetry 11 01166 g012
Figure 13. The exclusion between passengers.
Symmetry 11 01166 g013
Figure 14. The relationship between the orientation and the walking speed.
Symmetry 11 01166 g014
Figure 15. The main process of evacuation simulation.
Symmetry 11 01166 g015
Figure 16. The ratio of different categories passengers on deck.
Symmetry 11 01166 g016
Figure 17. The evacuation simulation process of the deck.
Symmetry 11 01166 g017
Figure 18. Changes of passengers’ positions with the evacuation time.
Symmetry 11 01166 g018
Figure 19. The accumulative number of evacuated passengers changed with the evacuation time.
Symmetry 11 01166 g019
Figure 20. The evacuation time of different categories of passengers.
Symmetry 11 01166 g020
Figure 21. Evacuation simulation results of the cruise ship under different inclined angles.
Symmetry 11 01166 g021aSymmetry 11 01166 g021b
Figure 22. The track of passenger under the inclining condition.
Symmetry 11 01166 g022
Figure 23. The speed reduction changed with slope angles.
Symmetry 11 01166 g023
Table 1. The percentage and average walking speed of passengers
PassengersPercentage of Passengers (%)Average Walking Speed on Flat Terrain (m/s)
Females younger than 30 years71.24
Females 30–50 years old70.95
Females older than 50 years160.75
Females older than 50, mobility impaired (1) 100.57
Females older than 50, mobility impaired (2) 100.49
Males younger than 30 years 71.48
Males 30–50 years old 71.30
Males older than 50 years 161.12
Males older than 50, mobility impaired (1)100.85
Males older than 50, mobility impaired (2)100.73

