Abstract
With the wide use of various image altering tools, digital image manipulation becomes very convenient and easy, which makes the detection of image originality and authenticity significant. Among various image tampering detection tools, double JPEG image compression detector, which is not sensitive to specific image tampering operation, has received large attention. In this paper, we propose an improved double JPEG compression detection method based on noise-free DCT (Discrete Cosine Transform) coefficients mixture histogram model. Specifically, we first extract the block-wise DCT coefficients histogram and eliminate the quantization noise which introduced by rounding and truncation operations. Then, for each DCT frequency, a posterior probability can be obtained by solving the DCT coefficients mixture histogram with a simplified model. Finally, the probabilities from all the DCT frequencies are accumulated to give the posterior probability of a DCT block being authentic or tampered. Extensive experimental results in both quantitative and qualitative terms prove the superiority of our proposed method when compared with the state-of-the-art methods.
1. Introduction
With the rapid growth of image acquisition devices and the popularity of social networks, digital images have become an important form of information exchange, which leads to the fact that digital images are being utilized more often to support important decisions in daily life. This is especially true in the applications related to criminal investigation, law enforcement, military, and scientific research. However, due to the wide use of easy-to-use and sophisticated image editing software, altering the content of an image without leaving obvious visual traces has become very convenient and easy. Therefore, it is very important to develop robust image tampering detection tools to validate the originality and authenticity of images. Although an embedded watermarking or digital signature can be utilized to verify the originality and authenticity of an image, most digital images used in practice do not have either. As a consequence, blind digital image forensic technologies, which aim to verify the originality and authenticity of digital images without any prior knowledge, have become a research hotspot.
Over the past few years, many approaches have been proposed in the field of blind image forensic technologies [1,2]. The existing methodologies can be roughly classified into three categories according to the forensic features used. The first category is aiming at detecting the absence of special artifacts introduced during image acquisition process such as color filter array (CFA) interpolation [3], sensor pattern noise (SPN) [4], camera response function (CRF) [5], etc. The second category intends to detect the special traces left by manual editing operations, including contrast enhancement [6], blur inconsistency [7], resampling [8], image sharpening [9], noise level inconsistencies [10], and inconsistent perspective constraints [11]. The last category comprises the approaches which are based on detecting the compression history of JPEG images. JPEG is the most widely used image compression standard in our daily life as it is the default format of most of the cameras, smart phones, and websites. When people re-save the tampered JPEG image in JPEG format (or in any lossless format, in this case, we can re-save the tampered image in JPEG format with a compression quality factor of 100 before detection), double JPEG compression will be introduced. Therefore, the trace of double JPEG compression can be utilized to expose tampering. As the double JPEG image compression detector is not sensitive to specific image tampering operations, this category has received more attention.
Numerous approaches in the literature have been proposed to discover JPEG image tampering. According to the DCT (Discrete Cosine Transform) blocks in twice JPEG compression are aligned or not, double JPEG compression can be divided into non-aligned double JPEG (NA-DJPEG) compression and aligned double JPEG (A-DJPEG) compression. The NA-DJPEG based methods intend to detect some specific NA-DJPEG artifacts occurring in the tampered regions while the A-DJPEG based methods are aimed at detecting the double quantization (DQ) artifact or abnormal DCT coefficients statistics in the authentic regions. Both of these two kinds of methods can distinguish between the real and the tampered regions in a tampered image. For NA-DJPEG compression detection, Luo et al. [12] measured the symmetrical property of the blocking artifact characteristics matrix (BACM) for detection. The same group [13] also proposed an independent component analysis (ICA)-based identification algorithm by utilizing the symmetric property of independent value map (IVM). Bianchi et al. [14] utilized the symmetry property of integer periodicity maps to detect NA-DJPEG compressed images. For A-DJPEG compression detection, on one hand, some approaches in this branch intend to analyze the DQ artifact hidden in the DCT coefficients histogram. Lin et al. [15] proposed an automatic tampering localization algorithm by analyzing the periodicity of DCT coefficients histogram. Zhang et al. [16] utilized symmetric alpha stable distribution to classify single and double JPEG compressed images. The work in [17] utilized a simplified DCT coefficients mixture histogram model to locate the suspect regions. Then, Yu et al. [18] improved this method by using a new manner to estimate the parameters of the mixture model. Wang et al. [19] exploited a Laplacian mixture model to describe the quantized AC DCT coefficients to detect the tampered regions. Besides, abnormal DCT coefficients statistics were utilized for tampering detection in [20]. Meanwhile, Wang et al. [21] extracted the DCT coefficients histograms as the input of a CNN (convolutional neural network) for detection. However, these existing methods mentioned above usually ignore the negative influence of the quantization noise, which inevitably decreases the performance. On the other hand, a few methods address analyzing the specific distribution of the first digits of DCT coefficients which are introduced by double JPEG compression. Amerini et al. [22] localized the splicing regions based on the first-digits features of DCT coefficients. More recently, the work in [23] exploited footprints introduced by all the non-zero and zero AC modes based on Benford’s law in a low-dimensional representation via principal component analysis (PCA) for detection. However, the methods from this branch usually need large regions for feature extraction, which leads to the fact that these methods usually perform worse on tampered region localization when compared with the aforementioned methods from the first branch.
In this paper, we focus on the aligned double JPEG compression. Specifically, we propose an improved double JPEG compression detection method based on noise-free DCT coefficients mixture histogram model. The motivation behind our method is that by eliminating the quantization noise, better posterior probability of a block being authentic or tampered can be obtained by solving the mixture DCT coefficients histogram model. Extensive experimental results in both quantitative and qualitative terms prove the superiority of our proposed method when compared with some related methods.
The remainder of this paper is organized as follows. The next section introduces the preliminaries related to the topic of this paper. In Section 3, we describe our proposed double JPEG image compression detection method in detail. The experimental results along with some useful discussions are presented in Section 4. Finally, we draw the conclusions and indicate the future work in Section 5.
2. Preliminaries
2.1. JPEG Compression
To explain the DQ artifact which is introduced by double JPEG compression, we first present a brief description of JPEG compression. The compression of JPEG images involves three basic procedures:
- (1)
- DCT transform: an image is first divided into DCT blocks (with size 8 × 8). Each block is subtracted by 128 and transformed to the YCbCr color space. Then, DCT transform is applied to each channel of the DCT block.
- (2)
- Quantization: the DCT coefficients at each frequency are divided by a quantization step and rounded to the nearest integer.
- (3)
- Entropy coding: lossless entropy coding of the quantized DCT coefficients.
The quantization steps for different frequencies are stored in quantization tables (luminance table for Y channel and chroma table for Cb and Cr channels). The quantization tables can be retrieved from the JPEG header.
2.2. JPEG Image Tampering Model
Generally, the JPEG image tampering process can be modeled in the following three steps (as shown in Figure 1):
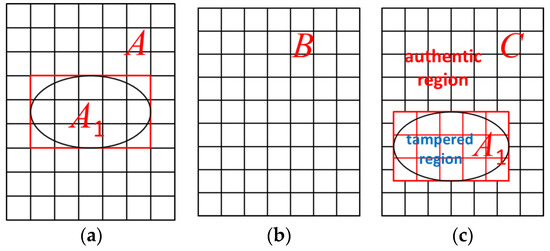
Figure 1.
An illustration of JPEG image tampering process. (a) Choosing a portion A1 from an image A. (b) Pasting A1 into a JPEG compressed image B or altering a selected region in B with image editing tools directly. (c) Saving the forgery image as image C in JPEG or any lossless format.
- (1)
- Choosing a portion A1 from an image A.
- (2)
- Pasting A1 into a JPEG compressed image B or altering a selected region in B with image editing tools directly.
- (3)
- Saving the forgery image as image C in JPEG or any lossless format (in this case, we will re-save the image as JPEG format with a compression quality factor 100 before detection).
As a result, the authentic region of the tampered image C will present DQ artifact, while the tampered region may not. The tampered region of C would not exhibit DQ artifact because of the following reasons: (1) the tampered region may not undergo the first JPEG compression as it may come from the images in lossless format or produced by image editing tools directly. (2) Mismatch of the 8 × 8 DCT grids of the tampered region with that of the unchanged region. There is a very low probability of 1/64 that the tampered blocks aligned with the unchanged region. (3) Although there is a very low possibility that the tampered region exactly match the 8 × 8 DCT grid, the blocks along the boundary of the tampered region will consist of pixels from both the tampered region and the authentic region. These blocks still do not have a DQ artifact. Therefore, by detecting the DQ artifact hidden in the authentic region, we can verify the authenticity of an image and distinguish the authentic region from the tampered part.
2.3. Double Quantization (DQ) Artifact
In this subsection, we briefly describe the DQ artifact. Denoting the unquantized, singly quantized (with factor ), and doubly quantized (with followed by ) DCT coefficients as Cu, Cs and Cd, respectively, we can achieve:
hence, when Cs > 0 and Cd > 0,
then,
where [·], ⌈·⌉, ⌊·⌋ represent rounding, ceiling, and floor operation, respectively. Equations (1) and (3) mean that the Cu located in a pixel value range of the uncompressed image will be mapped into a common double quantized coefficient Cd after double JPEG compression. As a result, the number of a bin on Cd can be calculated as:
Obviously, N(Cd) is a period function with a period /gcd(, ), where gcd(, ) means the greatest common divider of and . Figure 2 illustrates an example of DQ artifact. It is obvious that all the histograms are approximately symmetric. Figure 2a,b are the histograms of single quantized histogram at frequency (2, 2) of an uncompressed image with QF = 80 and QF = 90, respectively. Figure 2c presents the double quantized histogram with QF1 = 80 and QF2 = 90 while Figure 2d shows the double quantized histogram with QF1 = 90 and QF2 = 80. Here, QF is short for the quality factor during JPEG compression. The higher the QF is, the smaller the image loss is. From Figure 2c we can find that when an image is under double JPEG compression with QF1 < QF2, the double quantized DCT coefficient histogram can exhibit some periodic pattern of peaks and valleys, which is known as the DQ artifact [15]. The period of this histogram can be calculated as gcd(, ) as mentioned above. In comparison, when QF1 > QF2, although the DCT coefficient histogram can represent periodic fluctuation, it is difficult to be detected as the distribution of the bins in this situation is very similar to the distribution of the bins of single compression (Figure 2a,d).
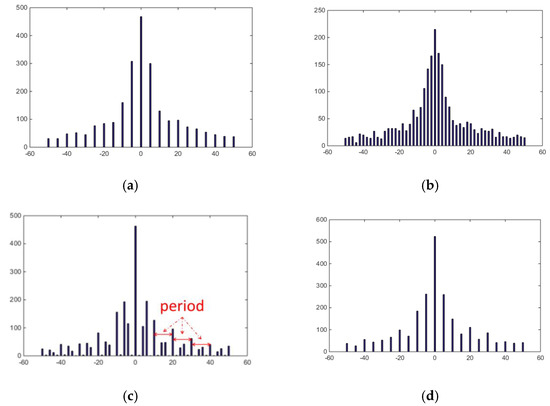
Figure 2.
An illustration of the double quantization (DQ) artifact. (a,b) The histograms of single quantized histogram at frequency (2, 2) of an uncompressed image with QF = 80 and QF = 90 via Matlab ‘imwrite’ function, respectively. (c) The double quantized histogram with QF1 = 80 and QF2 = 90. (d) The double quantized histogram with QF1 = 90 and QF2 = 80.
In practice, a tampered JPEG image contains authentic and tampered portions and the histogram distributions of these two kinds of regions are different. When we extract the DCT coefficient histogram from the whole image, the obtained histogram can be treated as a mixture histogram from two kinds of histograms of authentic and tampered regions respectively. Using Figure 3 as example, Figure 3a presents a tampered JPEG image while Figure 3b illustrates the corresponding ground-truth of Figure 3a. The white portion stands for the authentic regions while the black portion means the tampered regions. Figure 3c presents the DCT coefficient histogram at frequency (3, 3) of the whole image in Figure 3a. We can find that the obtained DCT coefficient histogram looks like a sum of two different histograms. One has a specific periodicity (marked by ‘period’ in the figure) which is introduced by the DQ artifact from the authentic part, while the other has a relative random distribution which is extracted from the tampered part along with some quantization noise.
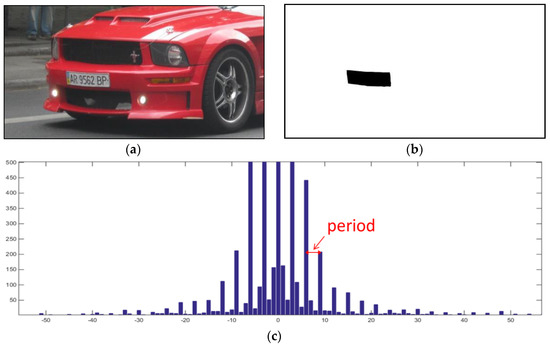
Figure 3.
A typical DCT coefficient histogram of a tampered JPEG image. (a) A tampered JPEG image. (b) The corresponding ground-truth of (a). (c) The DCT coefficient histogram at frequency (3, 3) of (a).
3. Proposed Method
In this section, we will elaborate our proposed method. Figure 4 illustrates the whole framework.
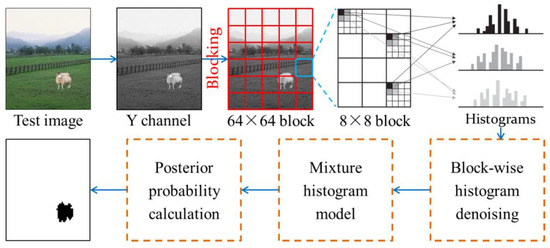
Figure 4.
The whole framework of our proposed method.
3.1. Quantization Noise Removal
Given an image, we first convert it into YCbCr space and extract the Y channel and the corresponding quantization table. Then, we divide the map of Y channel into non-overlapping blocks with size 64 × 64 (when the size of the image is not a multiple of 64, we will pad the image with mirror reflections of itself along the right and post edges and then cut it to the original size after detection) for quantization noise removal as the quantization noise is more obvious locally. Specifically, for each frequency (r, c) within a divided 64 × 64 block, a quantized DCT coefficients histogram can be obtained. Based on the analysis in Section 2, we can draw the conclusion that the only difference between single and double compressed regions is that the latter have specific periodicity in the DCT coefficients histogram. However, the process of double JPEG compression would inevitably introduce some truncation error and rounding error due to quantization operation. In practice, Equation (1) should be rewritten as:
where e stands for the total noise introduced by truncation error and rounding error. Generally, according to [24], e comprises two kinds of noise, i.e., residual noise and split noise, as shown in Figure 5. The residual noise is usually very small. In contrast, the split noise is relative large and can decrease the detection performance significantly. This kind of noise appears when a bin of the first quantization (in position ) falls exactly halfway between two neighboring bins in position and as:
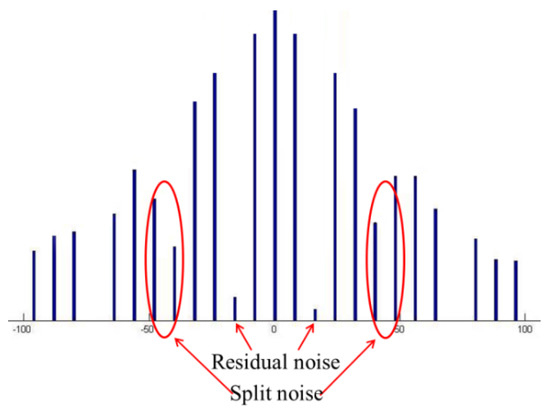
Figure 5.
An illustration of quantization noise.
Obviously, if the quantization noise can be eliminated, a better mixture model of the DCT coefficients histogram will be obtained, which can improve the performance. In order to solve this problem, we first resort to the split noise filtering algorithm [25] to eliminate the split noise. In this algorithm, the authors first traversed the bins of the input histogram and gathered the bins introduced by the split noise according to Equation (6). Then, the bins introduced by the split noise were removed by moving these bins to the nearest neighboring bins. More detailed descriptions can be found in [25]. Once the split noise has been removed, the residual noise can be easily removed with a proper threshold Tfilter as it is very small. Here, Tfilter is experimentally set as 10% of the largest value of the histogram.
Once the quantization noise has been removed, for each frequency (r, c), all the histograms of the divided 64 × 64 blocks will be merged to obtain an overall histogram.
3.2. Tampered Region Localization
According to [18], the DCT coefficients p(x) at a frequency (r, c) of a tampered JPEG image can be modeled as the mixture of a tampered component (x;) and an authentic component (x;,) as:
where
and
where
Here, (t) is the distribution of the unquantized DCT coefficients and g(w) stands for a Gaussian kernel for describing the effect of quantization noise. In this paper, as we have eliminated the quantization noise in Section 3.1, Equation (9) should be reformulated as
In the case of x < 0, the expression of and can be achieved based on the symmetric distribution of the histograms (Figure 2). By assuming the histogram of the unquantized DCT coefficients is locally uniform, the first quantization step can be estimated as:
where H(x) is the obtained histogram at the frequency (r, c). Since can be obtained from the file header of the JPEG file, after estimating , the distributions (x;,) and (x;) can be obtained. Then for each frequency (r, c), the posterior probability of this block being authentic or tampered can be obtained by calculating the ratio of the probability of being doubly compressed and the probability of being single compressed as:
Then, the probabilities of all the frequencies are accumulated to give the posterior probability of this block being authentic or tampered as:
where (I, j) is the k-th DCT coefficient in the block with index (i, j).
According to [17], Equation (14) can be further simplified as:
where
As a result, we can get the posterior probability of a block being authentic or tampered. Then, a pre-defined threshold τ is utilized to locate the tampered regions. When the posterior probability value of a block is larger than τ, this block will be classified as an authentic block, and vice versa. In this paper, τ is set as 1 as the posterior probability is calculated as the accumulation of . When is larger than , the block will be classified as a double compressed one, which means it is an authentic block, and vice versa.
4. Experiments and Discussion
In this section, we present the experimental results in both quantitative and qualitative metrics in comparison with two DQ analysis based methods [18,19] and a first-digit feature-based method [22] along with some useful discussions.
4.1. Quantitative Experiments
To evaluate the effectiveness of our proposed approach and compare the performance with some related algorithms, we conducted a set of experiments on a public database constructed in [26]. This database was constructed from 100 uncompressed images with size 1024 × 1024. Specifically, this database contained three scenarios corresponding to different percentages of the double compressed region. In the first scenario, double compression was conducted in the central portion with size 256 × 256, which is denoted as Scenario ‘1/16′. Scenario ‘1/2′ means that double compression was present in the right half of the image while Scenario ‘15/16′ means double compression was present in the whole image except the central portion with size 256 × 256. The compression quality factors of the first and the second compression are marked as QF1 and QF2, respectively. Both QF1 and QF2 ranged from 50 to 100 in interval 5. In total, each scenario contained 12,100 images (100 original images, 11 QF1 factors, and QF2 11 factors). In this paper, we treated double and single JPEG compressed pixels as positive and negative samples, respectively. Then, we used precision, recall, and score to evaluate the performance, which are defined as:
Table 1, Table 2 and Table 3 present the average performance under three scenarios for all the methods (in short, we present the results with quantization step interval of 10). As a DQ artifact is only obvious when QF1 < QF2, we merely exhibit the upper triangular matrix of the detection result. The maximum value of each combination of QF1 and QF2 is in bold. From these tables we can find that our proposed method outperforms the others on the whole. Specifically, when compared with [19], obvious improvement can be achieved. This can be attributed to that [19] used graph cut algorithm to locate the tampered region, which usually introduces false detection or missing detection in small connected regions. In contrast, our proposed method can locate the tampered region with a resolution of 8 × 8 pixels. Besides, when compared with [18], moderate improvement can be achieved, which verifies the effectiveness of the quantization noise removal process. When compared with [22], obvious improvement can be achieved when QF1 is close to QF2. This can be attributed to that the discrimination ability of the first-digit features extracted from the double compressed images with similar quality factors is not strong enough to make a decision.

Table 1.
Average precision for each combination of QF1 and QF2.

Table 2.
Average recall for each combination of QF1 and QF2.

Table 3.
Average F1score for each combination of QF1 and QF2.
4.2. Qualitative Experiments
In this subsection, we evaluate the performance of all the methods qualitatively on some spliced composite images from CASIA TIDEv2.0 database [27]. The images in this database have been compressed with different quality factors. Besides, the sizes of the tampered regions were varying and the contents of these images are diverse. Figure 6 demonstrates the detection results for all the methods. The first column displays the tampered images. These tampered images were created by pasting a portion from the host image or another image and then compressed with JPEG format. The second column shows the corresponding ground-truth. The third to the last columns are the image tampering detection results of [18,19,22], and our proposed approach, respectively. For each result map, the white portion represents the authentic regions while the black portion stands for the tampered regions.
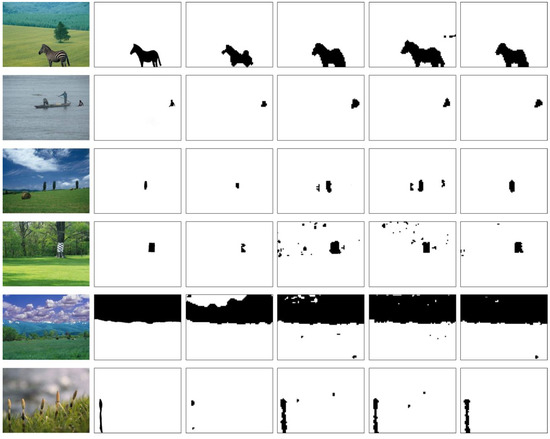
Figure 6.
Image tampering detection results on the images from CASIA TIDEv2.0 database. The first column displays the tampered images. The second column shows the corresponding ground-truth. The third to the last columns are the image tampering detection results of [18,19,22], and our proposed approach, respectively. The white portions stand for the authentic regions while the black portions mean the tampered regions.
The detection results verify the superiority of our proposed method when compared with the contrast methods. In detail, from the first two rows we can find that all the methods can achieve satisfactory results for the images who own obvious foreground object and relative smooth background. Besides, from the last two rows we can find that [19] usually introduce false detection in smooth or small regions. Specifically, seeing the fifth row, [19] mis-classifies a large portion of tampered sky as authentic regions. In the last row, [19] only detects a very small portion of the tampered plant. It can be attributed to that this method used graph cut algorithm to locate the tampered region, which may divide an object into multiple portions and introduce false detection in some small portions. Meanwhile, when compared with the results of [18,22] in the fourth column, our proposed approach can eliminate some isolated false and missing detective regions. This can be attributed to that the quantization noise in DCT coefficients histogram has been eliminated before solving the mixture histogram model.
4.3. Computational Complexity
The execution time of our proposed method was determined by many factors including QF1 and QF2 (which affect the time of noise removal) and the image size; other detection methods were influenced by these same factors. Table 4 presents the execution times of all the methods under different image sizes. The average execution time of the images in quantitative experiments was utilized as the final result (for testing image sizes smaller than 1024 × 1024, we cut the image to the required size from the upper left edge. For testing image sizes larger than 1024 × 1024, we padded the image with mirror reflections of itself along the right and post edges). The results are obtained by Matlab 2014b (desktop PC with a 3.0 GHz Core i5-7500 processor and 8 GB RAM). For the first-digit feature-based method [22], we only present the testing time under block size 64 × 64 which set by the authors. From this table we can find that the execution time of each method increases with the image size. Specifically, [19] runs fastest due to it using graph cut to make decision. The method [18] runs at the same level with our proposed method. When the image size increases, [18] has to spend more time for searching the optimal parameter while our method needs to spend more time to eliminate quantization noise in more divided blocks. Besides, [22] runs slowest due to the time-consuming calculation of the first-digit features.

Table 4.
Average execution time (seconds) of the images under different sizes.
5. Conclusions
In this paper, based on the finding that the quantization noise can decrease the performance of double JPEG compression detection, we propose a double JPEG compression detection method based on noise-free DCT coefficients mixture histogram model. By eliminating the quantization noise, a better solution of the DCT coefficients mixture histogram can be obtained, which leads to a more precise block-wise posterior probability map. Experimental results verify the superiority of our proposed approach in comparison with some related methods in both quantitative and qualitative forms.
Although our method obtains promising results, we are also aware of some important directions to extend this work. First, the quantization noise should be further analyzed to improve the current noise filtering strategy. Looking at the qualitative results of our proposed method in Figure 6, we can find that there still existing a few false detective regions. Besides, some novel image segmentation technologies can be considered for locating the tampered region more precisely and accelerating our method. Finally, the double compression detection tasks on some other media such as audio [28] and video [29,30] will be considered in the future.
Author Contributions
Conceptualization, N.Z. and J.S.; methodology, N.Z. and J.S.; software, N.Z.; validation, N.Z. and X.N.; formal analysis, X.N.; investigation, X.N.; resources, X.N.; data curation, X.N.; writing—original draft preparation, N.Z.; writing—review and editing, N.Z. and J.S.; visualization, N.Z.; supervision, N.Z.; project administration, N.Z.; funding acquisition, N.Z.
Funding
This research was funded by the Scientific Research Program Funded by Shaanxi Provincial Education Department, grant number “18JK0378” and the Young Talent Fund of University Association for Science and Technology in Shaanxi, China, grant number “20180114”. This research was also partly funded by the National Natural Science Foundation of China, grant number “61901349” and the Natural Science Basic Research Plan in Shaanxi Province of China, grant number “2019JQ-322”.
Acknowledgments
The authors would like to thank Liyang Yu and Wei Wang for kindly sharing the source code of their algorithms respectively for comparison.
Conflicts of Interest
The authors declare no conflict of interest.
References
- Birajdar, G.K.; Mankar, V.H. Digital image forgery detection using passive techniques: A survey. Digit. Investig. 2013, 10, 226–245. [Google Scholar] [CrossRef]
- Korus, P. Digital image integrity—A survey of protection and verification techniques. Digit. Signal Process. 2017, 71, 1–26. [Google Scholar] [CrossRef]
- Chang, T.Y.; Tai, S.C.; Lin, G.S. A passive multi-purpose scheme based on periodicity analysis of CFA artifacts for image forensics. J. Vis. Commun. Image Represent. 2014, 25, 1289–1298. [Google Scholar] [CrossRef]
- Chierchia, G.; Poggi, G.; Sansone, C.; Verdoliva, L. A Bayesian-MRF approach for PRNU-based image forgery detection. IEEE Trans. Inf. Forensics Secur. 2014, 9, 554–567. [Google Scholar] [CrossRef]
- Hsu, Y.F.; Chang, S.F. Camera response functions for image forensics: An automatic algorithm for splicing detection. IEEE Trans. Inf. Forensics Secur. 2010, 5, 816–825. [Google Scholar] [CrossRef]
- Cao, G.; Zhao, Y.; Ni, R.R.; Li, X.L. Contrast enhancement-based forensics in digital images. IEEE Trans. Inf. Forensics Secur. 2014, 9, 515–525. [Google Scholar] [CrossRef]
- Bahrami, K.; Kot, A.C.; Li, L.D.; Li, H.L. Blurred image splicing localization by exposing blur type inconsistency. IEEE Trans. Inf. Forensics Secur. 2015, 10, 999–1009. [Google Scholar] [CrossRef]
- Zhu, N.; Deng, C.; Gao, X.B. A learning-to-rank approach for image scaling factor estimation. Neurocomputing 2016, 204, 33–40. [Google Scholar] [CrossRef]
- Zhu, N.; Deng, C.; Gao, X.B. Image sharpening detection based on multiresolution overshoot artifact analysis. Multimed. Tools Appl. 2017, 76, 16563–16580. [Google Scholar] [CrossRef]
- Zhu, N.; Li, Z. Blind image splicing detection via noise level function. Signal Process. Image Commun. 2018, 68, 181–192. [Google Scholar] [CrossRef]
- Yao, H.; Wang, S.Z.; Zhao, Y.; Zhang, X.P. Detecting image forgery using perspective constraints. IEEE Signal Process. Lett. 2012, 19, 123–126. [Google Scholar] [CrossRef]
- Luo, W.Q.; Qu, Z.H.; Huang, J.W.; Qiu, G.P. A novel method for detecting cropped and recompressed image block. In Proceedings of the IEEE International Conference on Acoustics, Speech, and Signal Processing (ICASSP), Honolulu, HI, USA, 15–20 April 2007; pp. II-217–II-220. [Google Scholar]
- Qu, Z.H.; Luo, W.Q.; Huang, J.W. A convolutive mixing model for shifted double JPEG compression with application to passive image authentication. In Proceedings of the IEEE International Conference on Acoustics, Speech, and Signal Processing (ICASSP), Las Vegas, NV, USA, 30 March–4 April 2008; pp. 1661–1664. [Google Scholar]
- Bianchi, T.; Piva, A. Detection of nonaligned double JPEG compression based on integer periodicity maps. IEEE Trans. Inf. Forensics Secur. 2012, 7, 842–848. [Google Scholar] [CrossRef]
- Lin, Z.C.; He, J.F.; Tang, X.O.; Tang, C.K. Fast, automatic and fine-grained tampered JPEG image detection via DCT coefficient analysis. Pattern Recogn. 2009, 42, 2492–2501. [Google Scholar] [CrossRef]
- Zhang, R.; Yu, X.G.; Zhao, J.; Liu, J.Y. Symmetric alpha stable distribution model application in detecting double JPEG compression. In Proceedings of the International Conference on Artificial Intelligence and Software Engineering (AISE), Phuket, Thailand, 11–12 January 2014; pp. 462–467. [Google Scholar]
- Bianchi, T.; Piva, A. Image forgery localization via block-grained analysis of JPEG artifacts. IEEE Trans. Inf. Forensics Secur. 2012, 7, 1003–1017. [Google Scholar] [CrossRef]
- Yu, L.Y.; Han, Q.; Niu, X.M.; Yiu, S.M.; Fang, J.B.; Zhang, Y. An improved parameter estimation scheme for image modification detection based on DCT coefficient analysis. Forensic Sci. Int. 2016, 259, 200–209. [Google Scholar] [CrossRef]
- Wang, W.; Dong, J.; Tan, T.N. Exploring DCT coefficient quantization effects for local tampering detection. IEEE Trans. Inf. Forensics Secur. 2014, 9, 1653–1666. [Google Scholar] [CrossRef]
- Lin, C.S.; Tsay, J.J. Passive forgery detection using discrete cosine transform coefficient analysis in JPEG compressed images. J. Electron. Imaging 2016, 25, 033010-1–033010-6. [Google Scholar] [CrossRef]
- Wang, Q.; Zhang, R. Double JPEG compression forensics based on a convolutional neural network. EURASIP J. Inf. Secur. 2016, 2016, 23. [Google Scholar] [CrossRef]
- Amerini, I.; Becarelli, R.; Caldelli, R.; Mastio, A.D. Splicing forgeries localization through the use of first digit features. In Proceedings of the IEEE International Workshop on Information Forensics and Security, Atlanta, GA, USA, 3–5 December 2014; pp. 143–148. [Google Scholar]
- Taimori, A.; Razzazi, F.; Behrad, A.; Ahmadi, A.; Babaie-Zadeh, M. Quantization-unaware double JPEG compression detection. J. Math. Imaging Vis. 2016, 54, 269–286. [Google Scholar] [CrossRef]
- Galvan, F.; Puglisi, G.; Bruna, A.R.; Battiato, S. First quantization matrix estimation from double compressed JPEG images. IEEE Trans. Inf. Forensics Secur. 2014, 9, 1299–1310. [Google Scholar] [CrossRef]
- Singh, G.; Singh, K. Forensics for partially double compressed doctored JPEG images. Multimed. Tools Appl. 2018, 77, 485–502. [Google Scholar] [CrossRef]
- Image Dataset for Localization of Double JPEG Compression. Available online: Ftp://lesc.dinfo.unifi.it/pub/Public/JPEGloc/ (accessed on 31 July 2019).
- CASIA Tampered Image Detection Evaluation Database. Available online: http://forensics.idealtest.org/ (accessed on 5 May 2019).
- Luo, D.; Yang, R.; Li, B.; Huang, J.W. Detection of double compressed AMR audio using stacked autoencoder. IEEE Trans. Inf. Forensics Secur. 2017, 12, 432–444. [Google Scholar] [CrossRef]
- Bian, S.; Li, H.L.; Gu, T.J.; Kot, A.C. Exposing video compression history by detecting transcoded HEVC videos from AVC coding. Symmetry 2019, 11, 67. [Google Scholar] [CrossRef]
- Yao, H.; Song, S.H.; Qin, C.; Tang, Z.J.; Liu, X.K. Detection of double-compressed H.264/AVC video incorporating the features of the string of data bits and skip macroblocks. Symmetry 2017, 9, 313. [Google Scholar] [CrossRef]
© 2019 by the authors. Licensee MDPI, Basel, Switzerland. This article is an open access article distributed under the terms and conditions of the Creative Commons Attribution (CC BY) license (http://creativecommons.org/licenses/by/4.0/).