1. Introduction
Ba–Ge type compounds are intensively studied with respect to the broad range of their possible technological applications, especially in thermoelectric devices [
1,
2], which are used for energy production and cooling. They are usually designed to acquire energy from the waste heat sources, e.g., from industrial or chemical processes [
3]. It should be emphasized here that superconducting properties of the Ba–Ge type compounds are used for the implementation of systems that perform quantum information processing [
4]. Relevant information on the various forms of quantum correlations can be found in [
5,
6,
7,
8]. Particularly noteworthy is [
9], in which the arrangement called the nonlinear quantum scissors was proposed for the first time. It allows calculations to be made on quantum states in a Hilbert space with a finite dimension.
Ba–Ge type compounds are well worth the attention with respect to their interesting low-temperature thermodynamic properties, including the
s–wave symmetry superconducting ones [
10,
11]. It was pointed out, in particular, that the
system undergoes a transition to the superconducting state at the temperature of
K [
12,
13,
14], similarly as the
one. This discovery resulted in a great deal of research work concerning the physical properties of the
material [
15,
16], which included studies on the interaction of rattling phonons [
2]. It is believed that the highly efficient thermoelectric conversion realised by the unusually low thermal conductivity in these materials is closely related to phonons of such a type. Explanation of this concept, as well as its implementation in thermoelectric devices, is one of the most intriguing research problems in the recent twenty years [
2,
17]. It is worth noting that the superconducting state in the
compound is also induced by the rattling phonons. Let us take note of the reader, the superconducting properties in functional materials, the structural parameters, the thermal conductivity, and the magnetic properties which are also examined. In this respect, special attention is given to functional oxides [
18,
19,
20].
In another case, induction of the
s–wave symmetry superconducting phase was experimentally observed in the
compound of the
crystalline structure at the temperature of 4 K [
21]. The existence of the superconducting state was also stated in compounds of the
and the
types, for which the critical temperature value fell within the range from 4 K to
K. The performed ab initio calculations revealed that the materials, which we are going to consider here, belong to the family of
s–wave symmetry superconductors with an electron–phonon pairing mechanism [
22,
23]. The superconductivity in the
compound is induced by the relatively strong electron–phonon coupling (indicated by the relatively large value of
), which compensates for the low value of the logarithmic phonon frequency
(see
Table 1). The small value of
results from the large atomic masses
M of
and
atoms (
). The shape of the Eliashberg function
and the integrated
for the
structure were presented in Reference [
24]. Phonon modes from various areas contribute uniformly to the increase in
, which implies the isotropic electron–phonon coupling. Additionally, the high value of the electron density of states at the Fermi level was confirmed, so that the formation of condensate of Cooper pairs is facilitated. Calculations were carried out by means of the VASP program employing the finite displacement method and by means of the ABINIT program using the linear response method. Using the DFT method, one can also model the stoichiometry of the samples (e.g., the functional [
25]) in the context of their relationship with magnetic properties.
However, it should be borne in mind that the oxygen excess and deficit can increase and decrease the oxidation degree of cations. The changing of charge state of cations as the consequence of changing of oxygen content changes such magnetic parameters as total magnetic moment and Curie point, as well as such electrical parameters as activation energy and band gap. Moreover, oxygen vacancies affect exchange interactions. Intensity of exchange interactions decreases with oxygen vacancy concentration increasing. Exchange near the oxygen vacancies is negative according to the Goodenough–Kanamori empirical rules. Oxygen vacancies should lead to the formation of the frustration and weak magnetic state such as spin glass [
26].
Pressure simulations were additionally performed for the
compound. It was found that both the value of the electron–phonon coupling constant
and the value of critical temperature
decrease with an increase in pressure [
24,
27]. Interestingly, there are two possible ways of
crystallization under high pressure (not exceeding 15 GPa, however), resulting in two different structures, namely,
and
[
21,
24], both remaining metastable even after lowering the pressure down to normal conditions. Two newly discovered structures,
and
, exhibit some interesting properties. The superconducting state can be induced in both, at the critical temperature value equal to
K and
K, respectively. The
phase is dynamically stable. It consists of clusters built of Ge atoms and triangular prisms formed by Ba atoms and intercalated with Ge atoms [
24]. Such a structure has not been observed in any other compound of this group, which distinguishes the
phase from the two others. The
structure is very similar to the previously observed structure of the
and the
compounds, where X = Ca, Y or Lu [
23]. The
dimers form square prisms in this crystalline structure. Theoretical predictions point out that the
phase is dynamically stable under normal conditions.
The latest experimental research concerning the
compound was carried out in 2016 [
28]. The system was synthesized under high pressure and at high temperature (
GPa,
K) and the generation of a new structure, classified as
, was observed. Metallic type electrical conductivity was stated, and the transition to the superconducting state occurred at the temperature of
K, which still remains the highest recorded critical temperature of this compound.
In the presented work, we are going to determine all the interesting thermodynamical properties of the s–wave symmetry superconducting state induced in the compound for three crystalline structures: , , and .
2. Theoretical Model
The electron–phonon interaction in the
compound is relatively strong, which is confirmed by the relatively high values of the electron–phonon coupling constant:
for the
structure and
for the two other structures, i.e.
and
ones [
24] (see
Table 1). Therefore we used the
s–wave symmetry Eliashberg formalism, being a generalization of the BCS mean field theory [
30,
31], to determine the thermodynamic properties of the superconducting state in the considered systems. It should be remembered that the conventional BCS theory studies the results correctly only in the weak electron–phonon coupling limit (
).
The
s–wave symmetry Eliashberg equations on the imaginary axis were solved in the self-consistent way for the whole considered temperature range. In the mixed representation, however, we analysed them only for selected temperature values [
29,
32,
33], for which the induction and the extinction of the superconducting state can be most easily observed.
The Eliashberg equations on the imaginary axis take the form of:
and
The
s–wave symmetry order parameter is defined by the ratio:
, where
represents the order parameter function and
is the wave function renormalization factor. Both functions depend directly on the fermionic Matsubara frequency
, where
denotes the Boltzmann constant. The pairing kernel is given by the formula:
, where
is the Eliashberg function. This function models the electron–phonon interaction. It should be noted that the numerical calculations related to the determination of the Eliashberg function were carried out for the ideal crystal structure. In the case of heterogeneity of the system (e.g., crystallites), one can expect the change in the thermodynamic properties of the superconducting phase, if the value of the electron and phonon density of states change. It is also important to change the matrix elements of the electron–phonon interaction. Analogous effects are also observed by examining the magnetic or electric properties of the crystals [
34]. In the case of small impurities, Anderson’s theorem for the superconducting state with s–wave symmetry decides that the value of
will not change [
35].
Note that the electron correlations do not contribute to the pairing potential. This means that the order parameter has only s–wave symmetry. The depairing electron correlations are modeled by the Coulomb pseudopotential (
), which can be defined by the formula [
36]:
, where
, with an accuracy of the first order with respect to the the Coulomb potential (
U). The symbols
,
, and
occurring in the formula denote the electronic density of states at the Fermi level, the characteristic electron frequency, and the characteristic phonon frequency, respectively. In our considerations we assumed the experimentally determined value of
, which was found for the
structure. The symbol
represents the Heaviside function. The value of the characteristic cutoff frequency in the Eliashberg theory should fall within the range
. We assumed
in our calculations. Note that the choice of
does not change the value of the thermodynamic functions that characterize the superconducting state. Only the value of the characteristic phonon frequency (
) is changed, which is the fitting parameter. The maximum phonon frequency is equal to
meV for the three crystalline structures considered here.
The Eliashberg function and the Coulomb pseudopotential are two input parameters for the Eliashberg equations. In the considered system, the Eliashberg functions were substituted by the respective coupling constants: . There was also introduced the characteristic phonon frequency (), which serves as the parameter fitting the model to the experimental data (to the value of the critical temperature).
The Eliashberg equations were solved numerically. We made use of the finite difference approximation of Newton’s method and assumed
, like in our other studies [
37,
38,
39,
40]. We obtained the stability of solutions of the Eliashberg equations within the temperature range from
K to
.
The Eliashberg equations defined on the imaginary axis allow to determine most of the thermodynamic properties of the superconducting phase, nevertheless, they do not give full information. For the purpose of finding the physical value of the order parameter, the Eliashberg equations should be solved in the mixed representation (
and
). The
s–wave symmetry Eliashberg equations in mixed representation can be obtained by the analytic continuation method [
33]. They take the form:
and
where the symbols
and
stand for the Bose–Einstein and the Fermi–Dirac functions, respectively.
3. Numerical Results
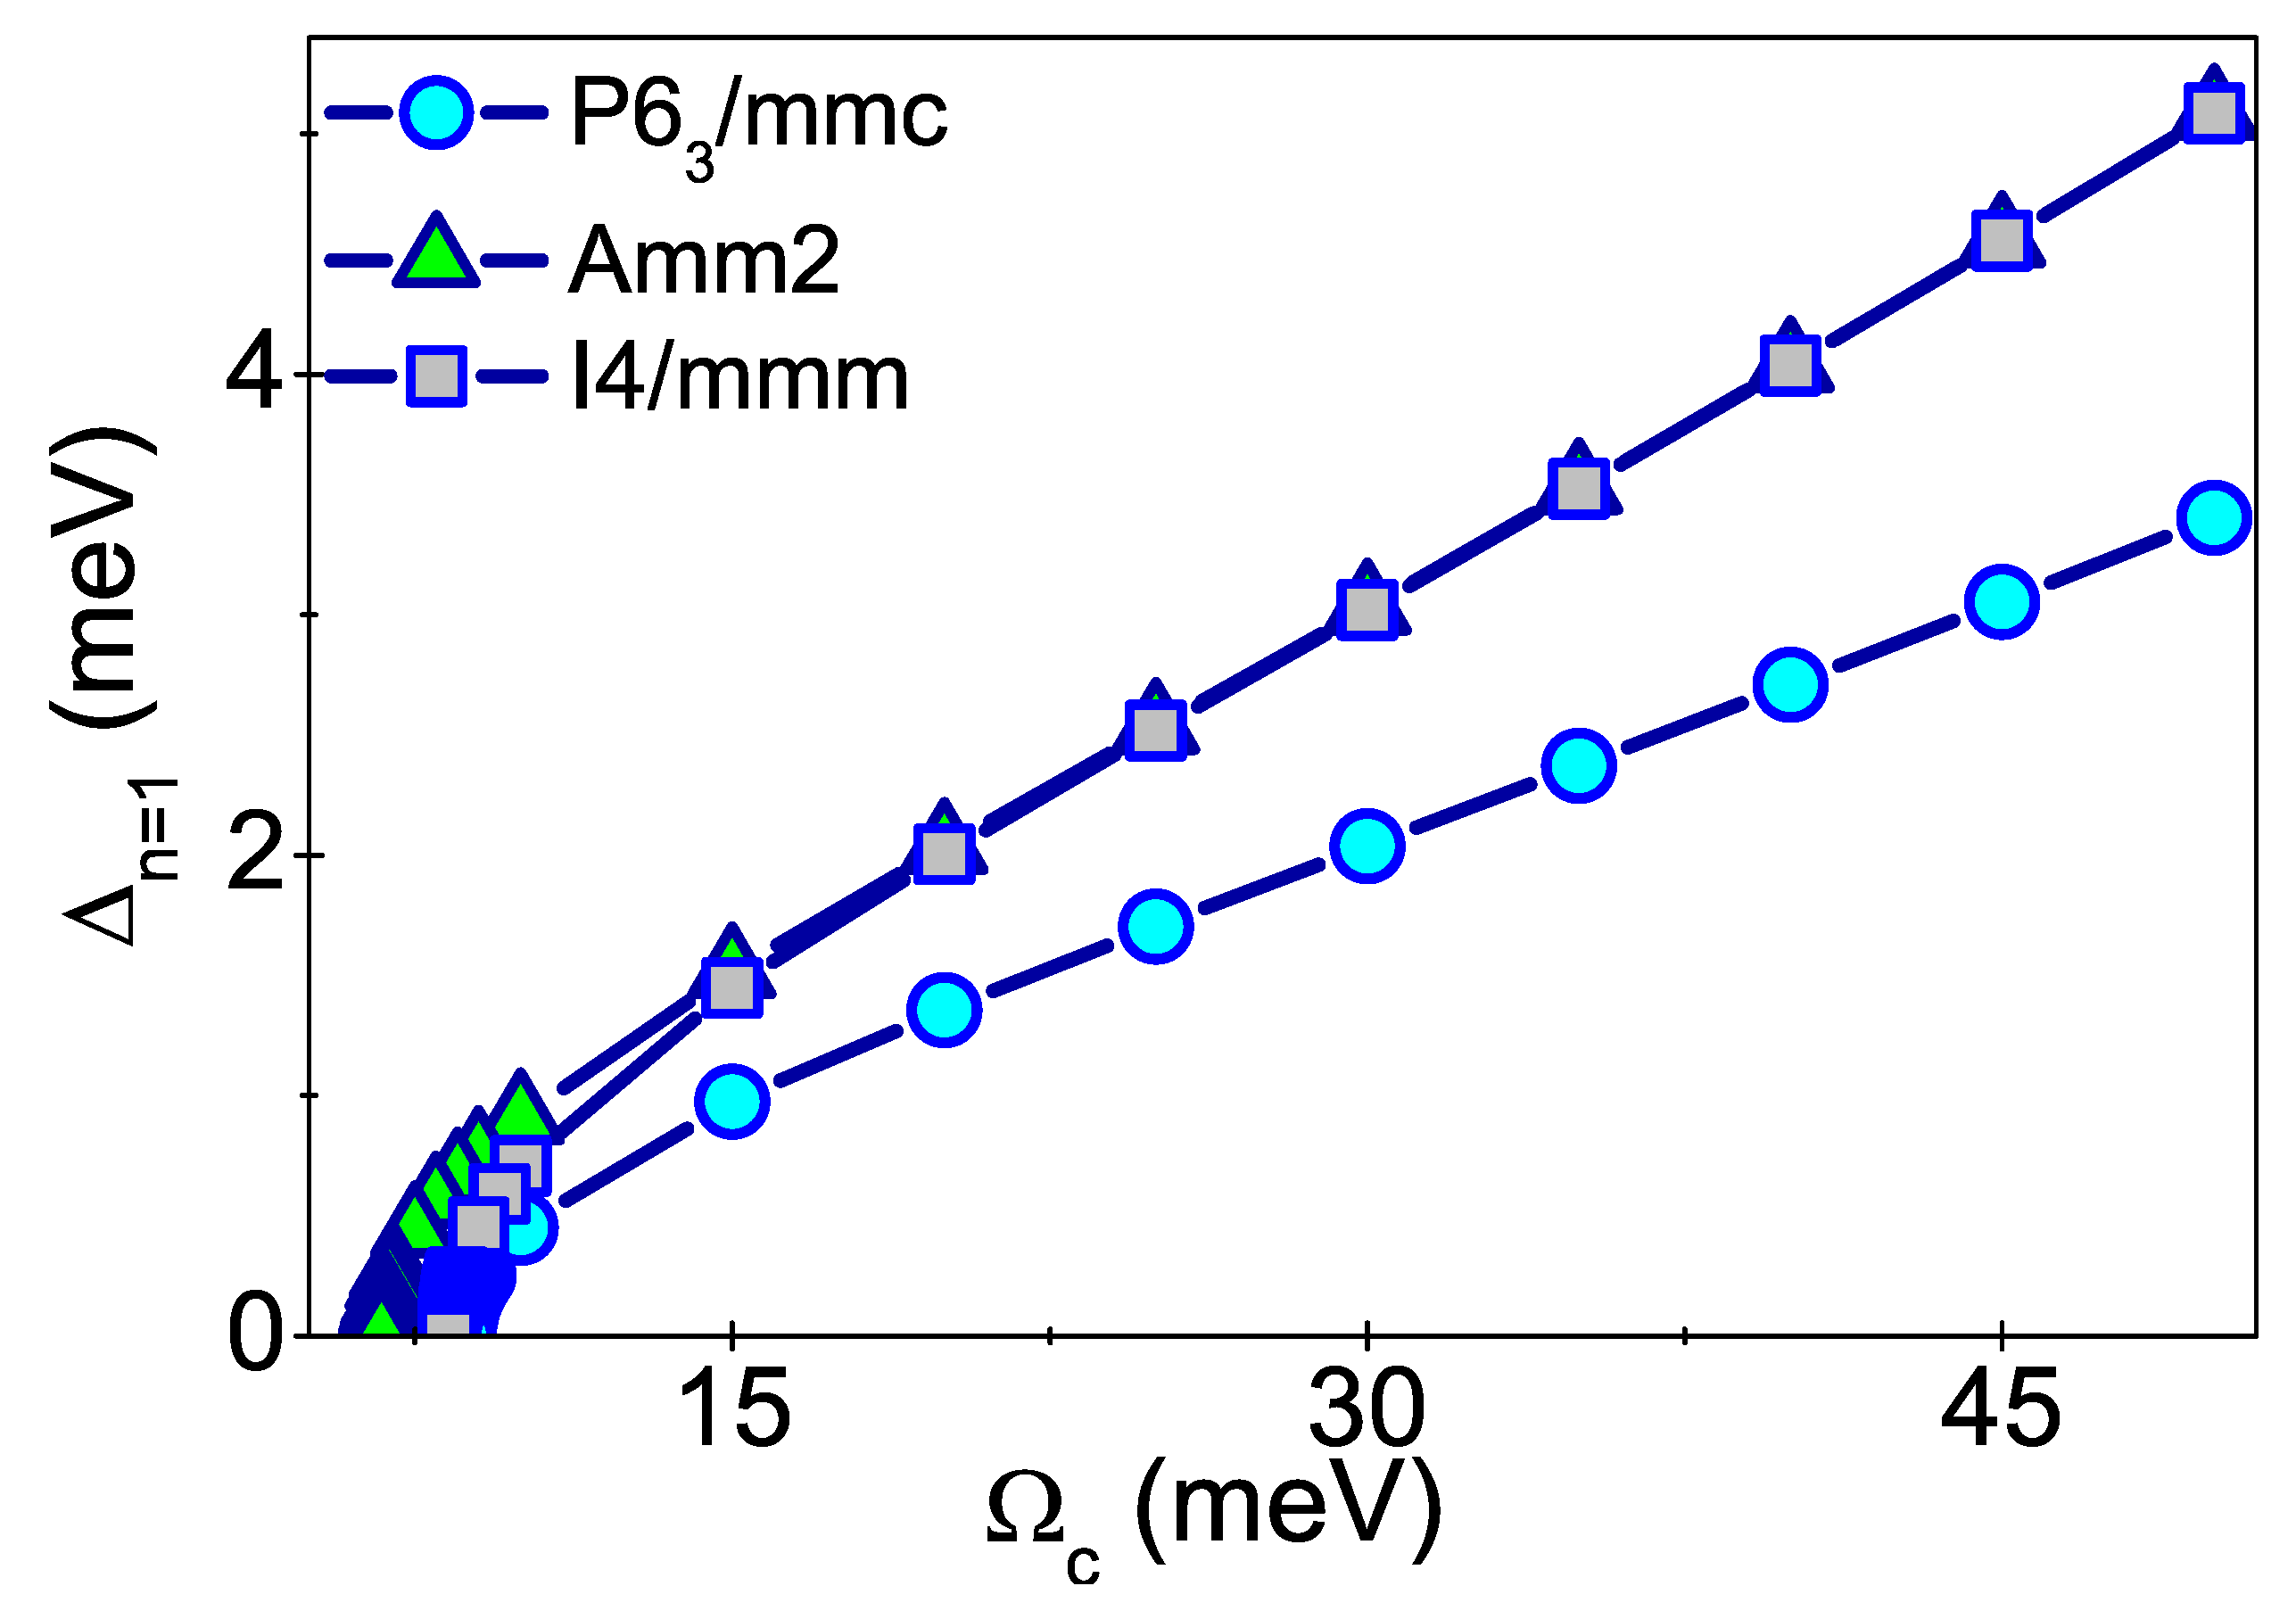
We began the analysis of properties of the superconducting state from the determination of the characteristic phonon frequency
from the equation:
. We obtained the following values:
meV,
meV, and
meV, for the
, the
, and the
structure, respectively. Full numerical results are presented in
Figure 1.
Then, we solved the
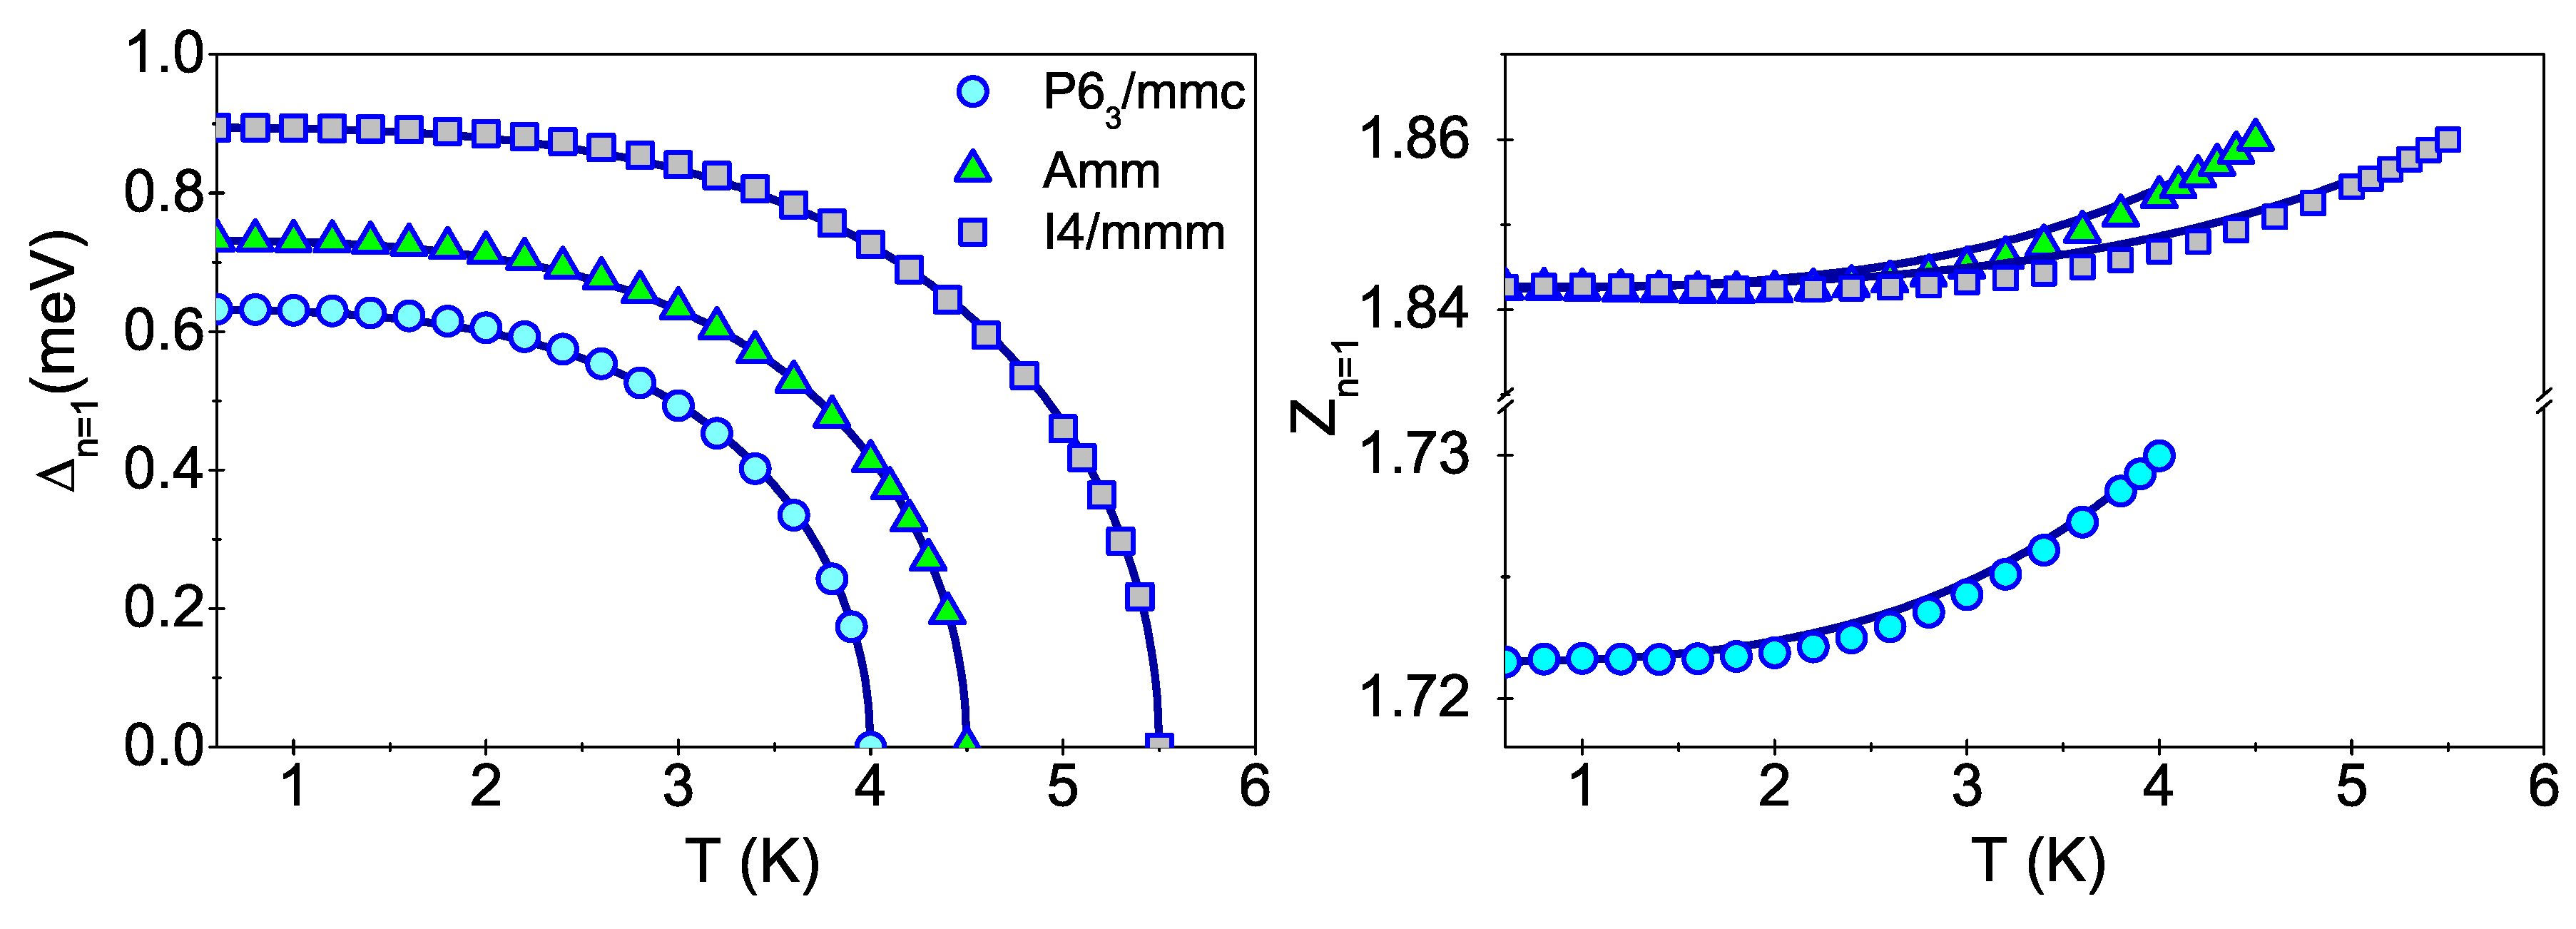
s–wave symmetry Eliashberg equations on the imaginary axis. We were interested in the dependence of the order parameter (
) and the wave function renormalisation factor (
) on temperature (
Figure 2). As it is well known, the order parameter takes zero value for
, what allows to estimate the critical temperature. Its respective values were found to be:
K for
,
K for
, and
K for
structure (see the upper plot in
Figure 2). Note that the obtained
functions can be compared with experimental data. As a result, it will be possible to identify the crystal structure of the tested system.
Please note that the results obtained by means of Eliashberg equations can be parameterised in the following way:
where
for
and
for both other structures. It is worth mentioning here that the parameter
is equal to
in the standard BCS theory [
41]. Additionally,
meV for
,
and
structures, respectively.
The lower plot in
Figure 2 presents the wave function renormalization factor, the value of which slightly increases with an increase in temperature and reaches its maximum at
. This maximum value should be comparable with the one obtained from the formula:
. The latter, after obvious calculations, gives the following maximum values for the considered case:
for the
structure and
for both other structures under consideration. One can easily see that the maximum values achieved from the numerical solution within the Eliashberg formalism are in good agreement with the ones calculated from the mentioned formula (see
Figure 2). Additionally, the full profile of the wave function renormalization factor can be approximately reproduced with the formula:
where
for
and
for both other structures.
Figure 2 indicates the results achieved numerically from the Eliashberg equations by point symbols (triangles, squares, or disks), while the fitting functions are shown as dark blue solid lines.
Subsequently, we determined the temperature dependence of the difference in free energy between the superconducting and the normal state. We used the following formula normalized with respect to the electronic density of states at the Fermi level [
42]:
Symbols and in the above formula represent the wave function renormalization factor for the superconducting (S) and the normal (N) states, respectively.
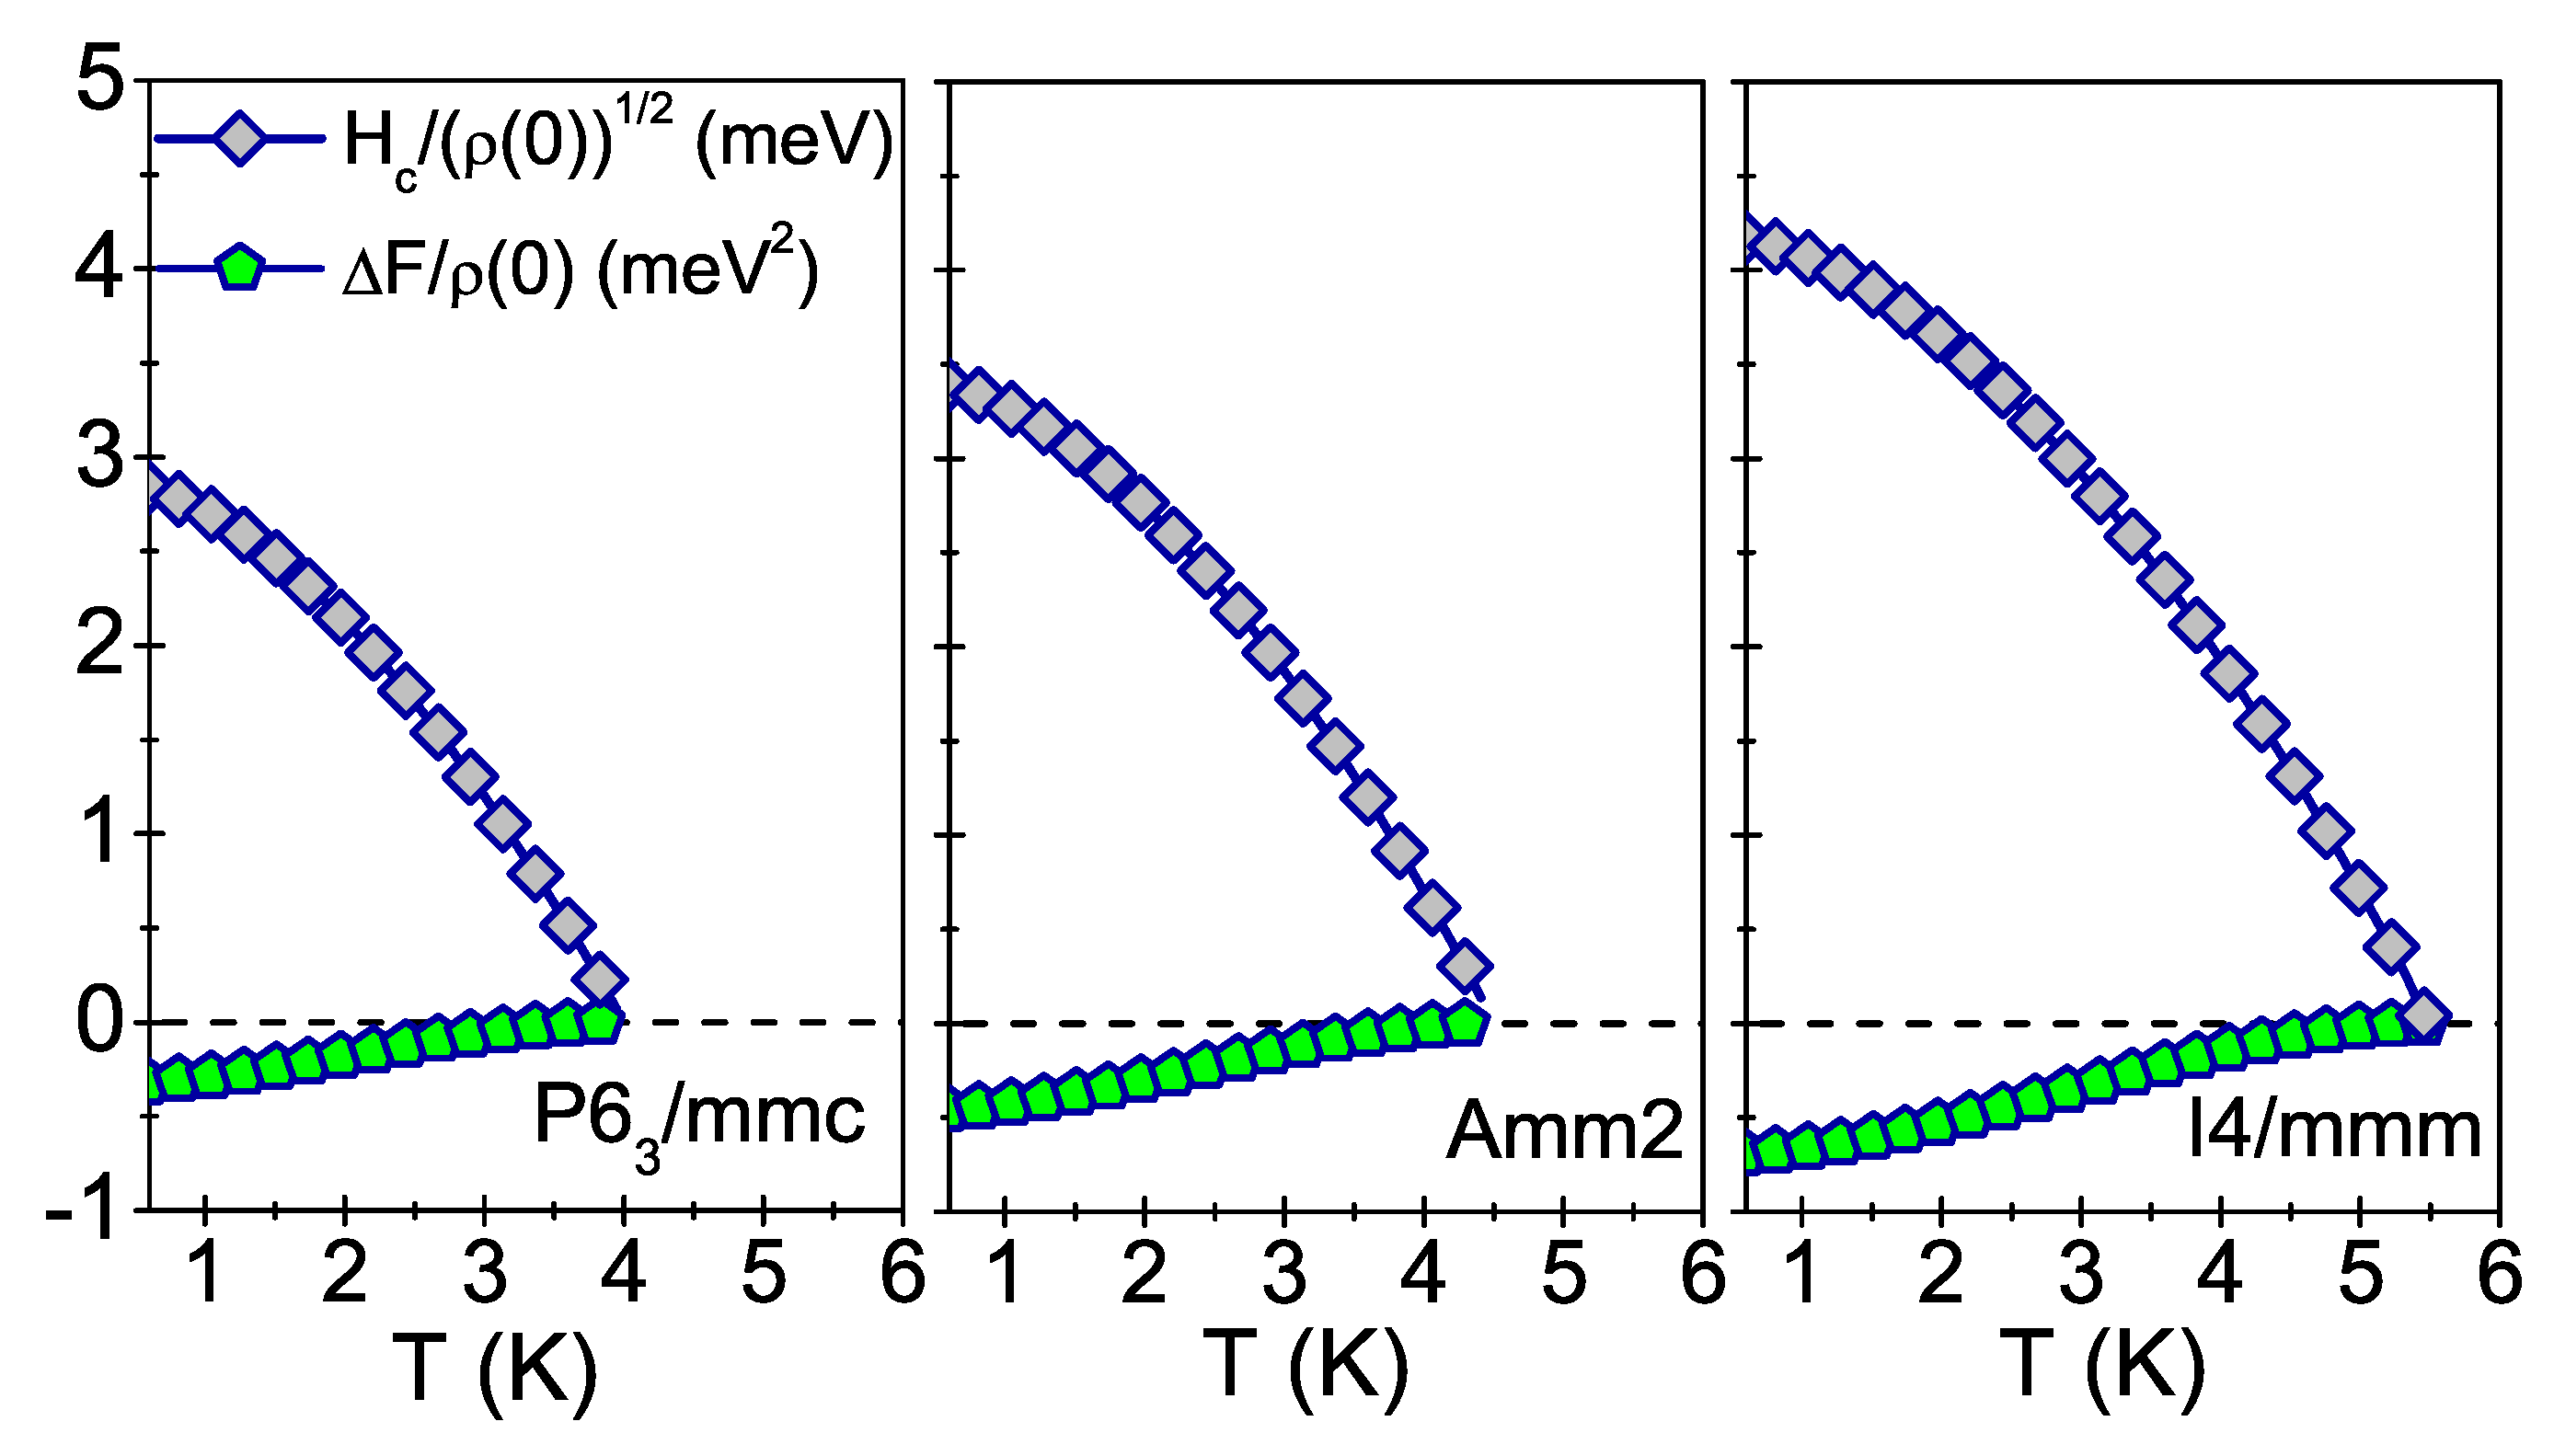
The negative values of the difference in free energy over the whole temperature range (
), shown in
Figure 3 (lower section), confirm the thermodynamic stability of the superconducting state in the crystalline structures under consideration.
The acquired knowledge of the temperature dependence of the difference in free energy allowed us to estimate further significant thermodynamic properties of the investigated compound. Our first step was the calculation of the thermodynamic critical field by means of the formula:
Its profile plotted against temperature is shown in
Figure 3 (upper section). One can conclude from it that the value of the thermodynamic critical field decreases as the temperature increases, and eventually drops down to zero at
. The results presented in
Figure 3 are in accordance with the experiment carried out for the
structure, during which the Meissner effect was observed at the temperature
K [
21].
Subsequently, the difference in the specific heat (
) between the superconducting(
S) and the normal (
N) state was determined. To do this, we used the formula:
The specific heat for the normal state can be determined by means of the formula:
, where
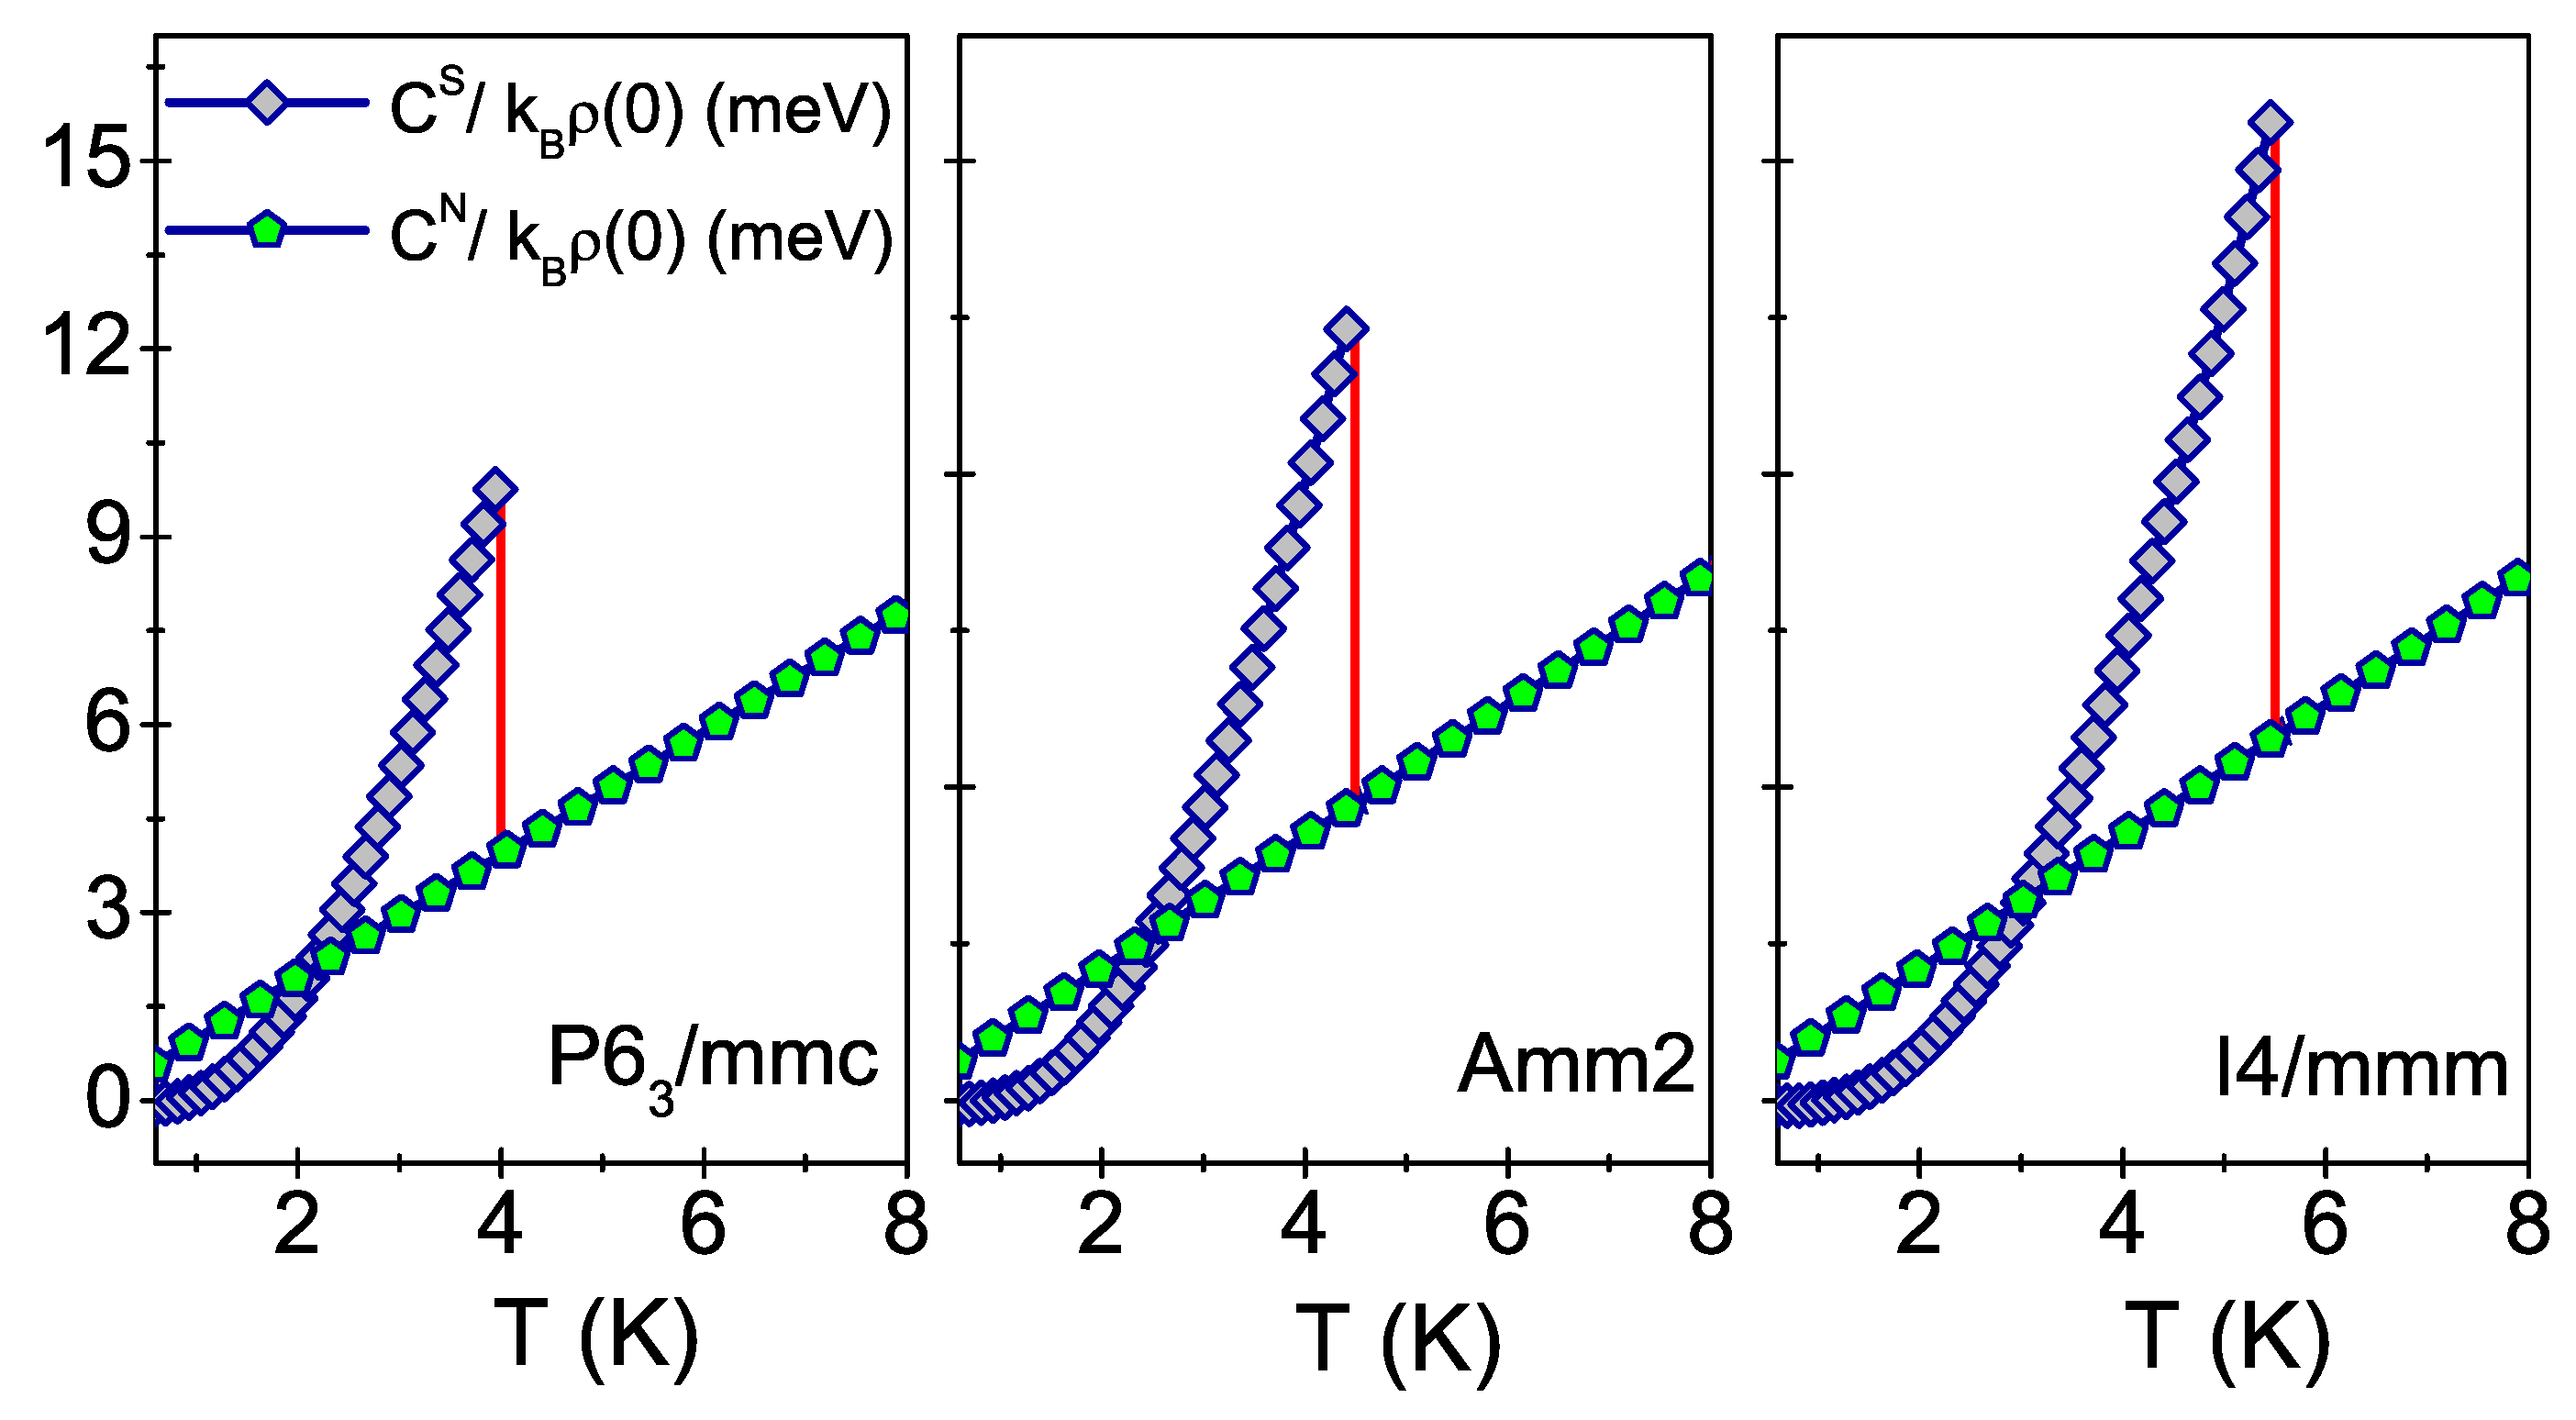
is the Sommerfeld constant. Numerical results are presented in
Figure 4 and indicate linear growth. On the other hand, it can be seen that the specific heat in the superconducting state increases exponentially as the temperature rises. Then, a rapid jump is observed at the critical temperature, followed by further changes proceeding in a way characteristic of the metallic phase. It should be clearly emphasized that the obtained specific heat curves, as well as the thermodynamic critical field curves, can be directly compared with data obtained experimentally.
The succesive stage of calculations consisted in solving the
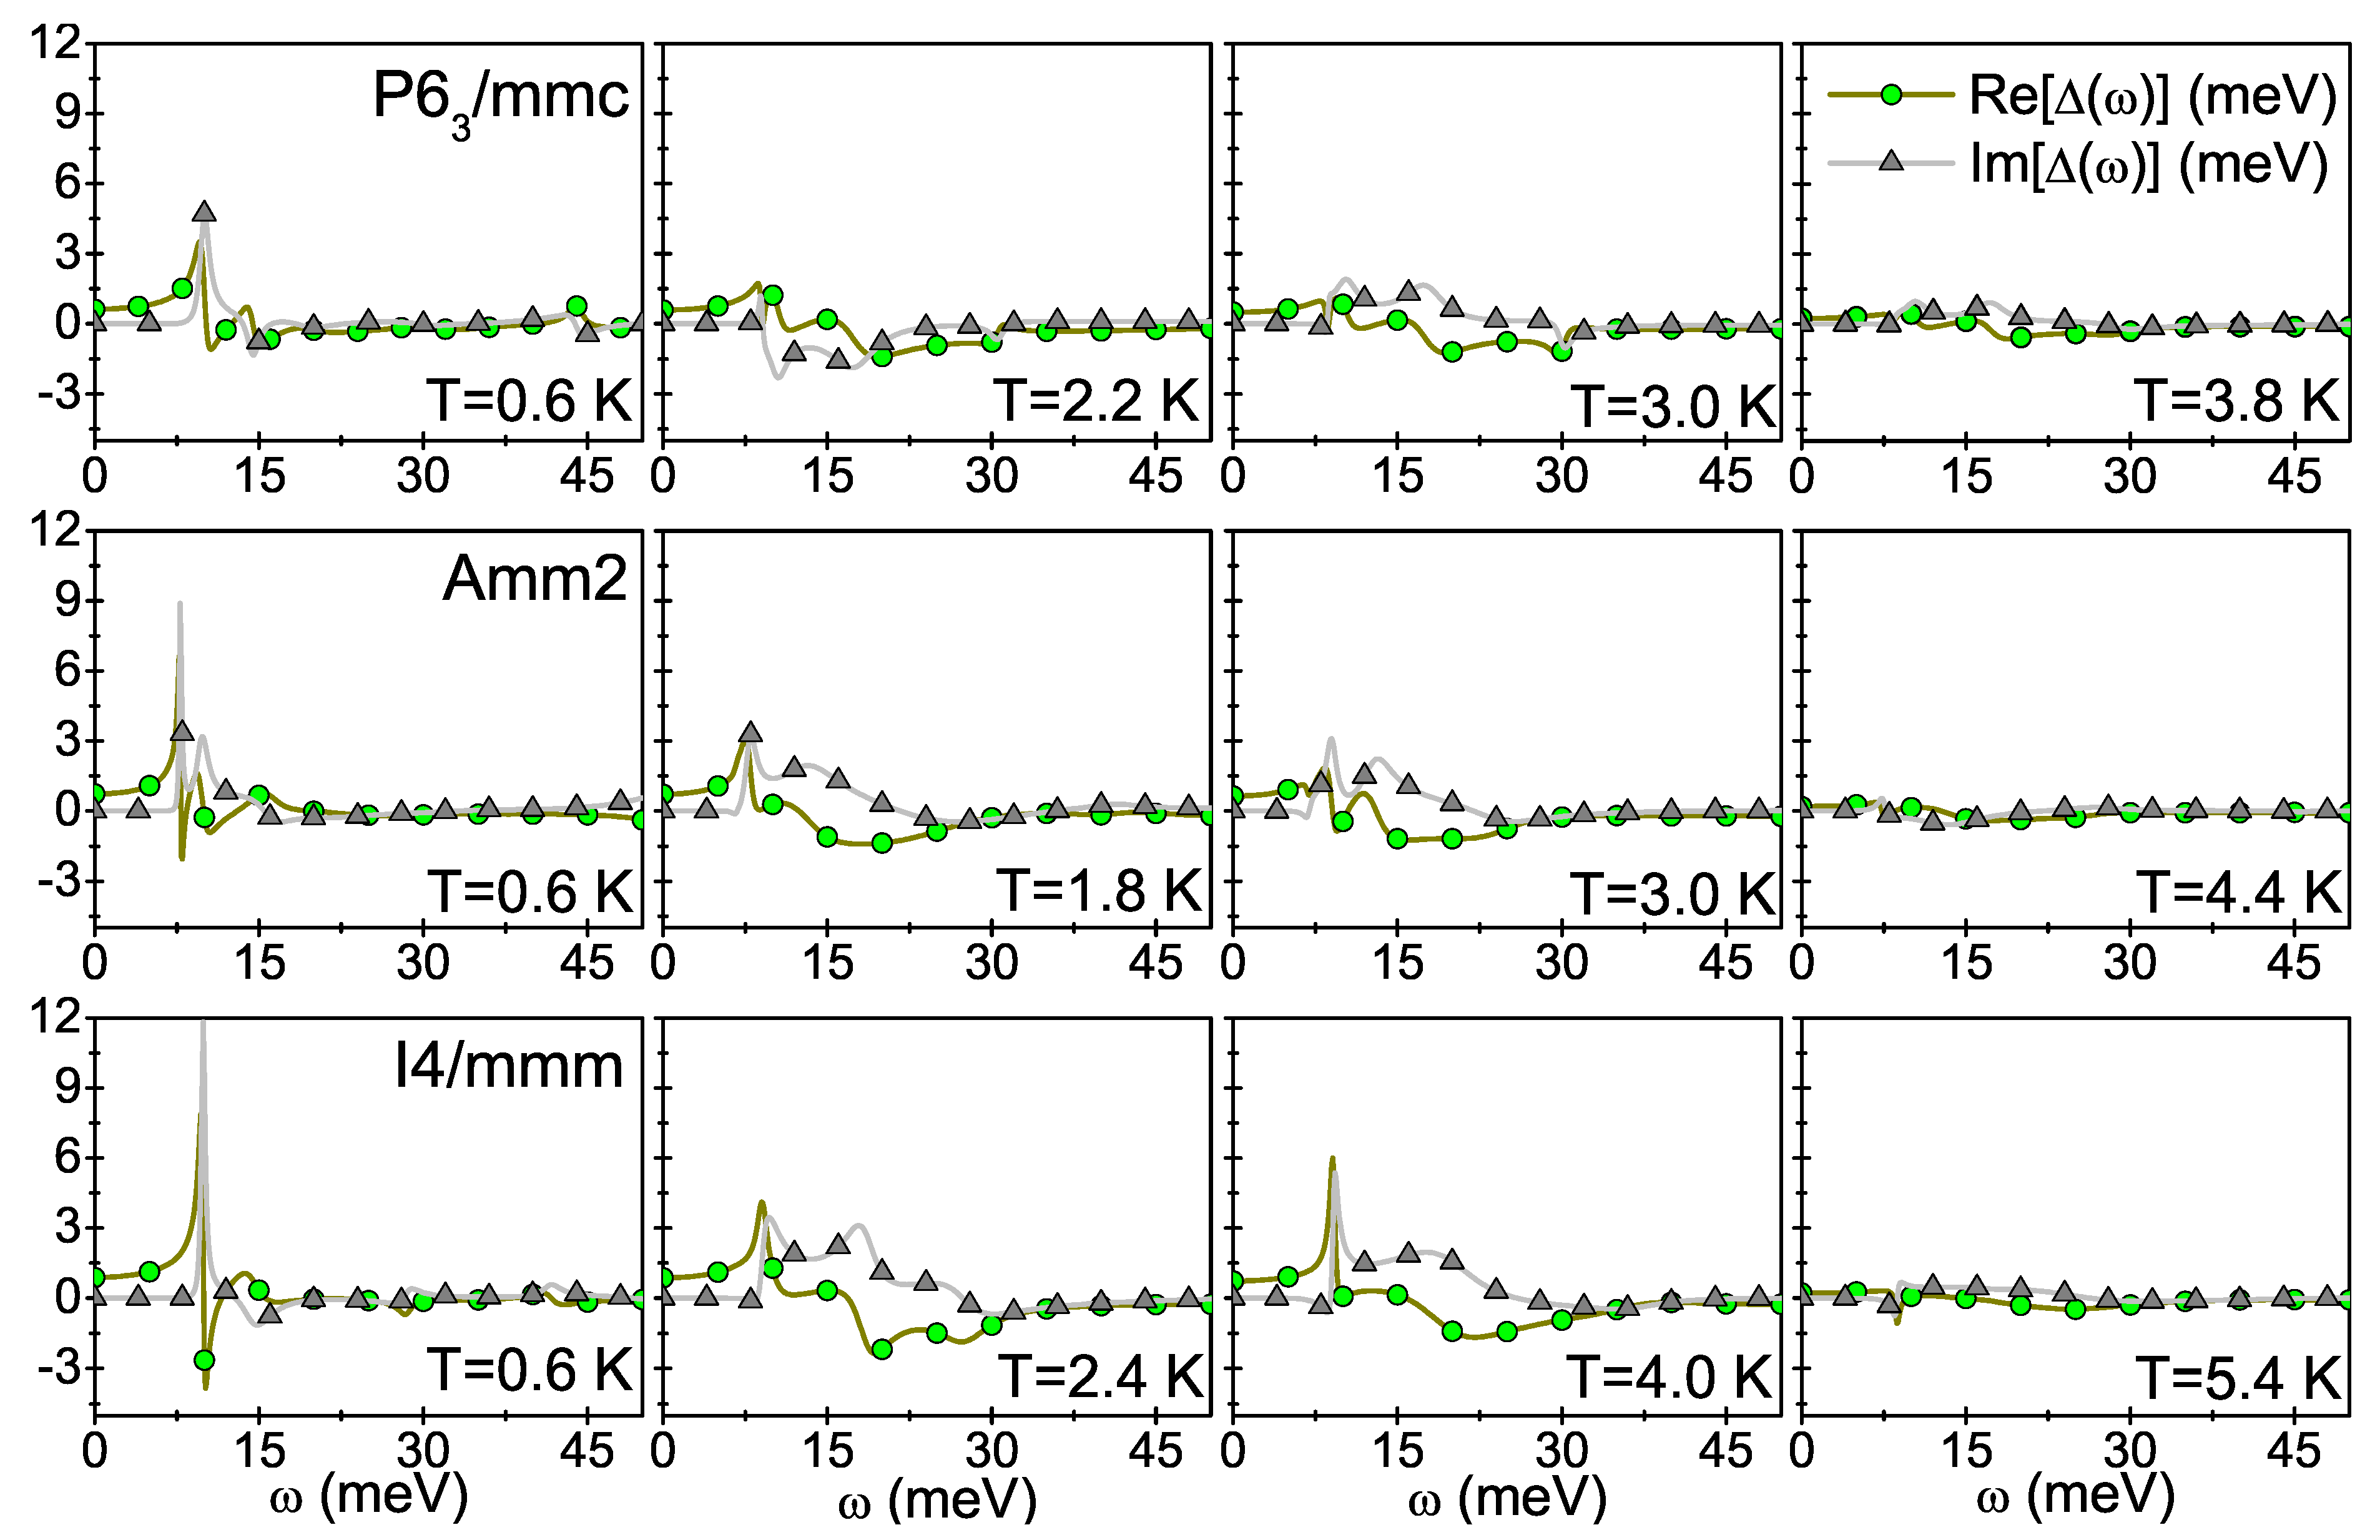
s–wave symmetry Eliashberg equations in mixed representation. In this way, we obtained functions describing both the order parameter and the wave function renormalization factor on the real axis, so that we could analyse the damping effect. The physical value of the order parameter can be obtained by means of the formula:
. The results are shown in
Figure 5. Each row of charts corresponds to one of the examined structures. The frequency range was assumed to extend from 0 to 50 meV. Such an interval was selected with respect to the construction of the Eliashberg function given for the
structure [
24], which takes the non-zero values near
meV. However, the frequency range for the other structures is remarkably greater, even reaching 45 meV, as can be seen in the charts (
Figure 5). The presented plots clearly show that only the real part of the order parameter takes the non-zero values for low frequencies (up to 8 meV). This is evidence of the existence of Cooper pairs with a long lifetime. For higher frequencies, also the imaginary part of the order parameter takes non-zero values. This indicates the existence of Cooper pairs with a finite lifetime. The rapid increase of the damping effects can be seen, especially in the frequency range from about 8 meV to about 30 meV. It is caused by the rather strong electron–phonon coupling within this range.
The numerical values obtained for the order parameter on the real axis
(
Figure 5) are in accordance with the values on the imaginary axis
(
Figure 2), what confirms the correctness of the performed calculations.
During the last step, we determined the dimensionless termodynamic parameters of the superconducting state:
,
, and
. One can notice that the results presented in
Table 1 for the
structure are quite close to the predictions of the BCS theory (
,
, and
[
30,
31]). Greater divgences can be seen for the two other structures. The apparently different results are directly related to the presence of both the retardation and the strong–coupling effects, which in turn are characterised by the ratio
. This ratio takes the following values:
for the
structure, and
for the two other structures (exact values are given in
Table 1). The lack of the above mentioned effects in the BCS theory could be expressed as
.
4. Summary
Slack’s predictions about clathrates containing additional atoms as the promising thermoelectric materials [
43] encouraged many researchers to seek more such systems. One of them is the
compound, for which the induction of the
s–wave symmetry superconducting state at the critical temperature of
K in the
crystalline structure was observed during experiments [
21]. Moreover, two other structures of this compound were discovered on account of investigations, namely,
and
[
24], synthetized under high pressure and remaining thermodynamically stable under normal conditions, which undergo the
s–wave symmetry superconductor–metal phase transition at the temperature of
K and
K, respectively. We determined the thermodynamic properties of the superconducting state for the reported structures using the formalism of the
s–wave Eliashberg equations by reason of the occurrence of high values of the electron–phonon coupling constants (
,
). In our calculations, we assumed that
, in consistency with the experimental results [
21,
24]. We determined the thermodynamic functions of the superconducting state which allowed us to find the nondimensional parameters
,
, and
. As far as the BCS theory is considered, these parameters are universal constants and their values are as follows:
,
, and
[
30,
31]. Within the Eliashberg formalism, we achieved the following results:
,
, and
for the
structure;
,
, and
for the
structure; and finally
,
, and
for the
structure. Our results differ slightly from the predictions of the BCS theory because of the presence of small retardation and strong–coupling effects (the relevant parameter
is less than ∼0.05 for all crystalline structures of the
compound).
It should be noted that, in the case of , the Eliashberg formalism we used describes the properties of the superconducting state at the quantitative level. This means that the thermodynamic functions are determined very precisely. Due to the relatively low value of the Coulomb pseudopotential, there is no need for any modification of the presented theory.
