Article

Impact of Prioritization on the Outpatient Queuing System in the Emergency Department with Limited Medical Resources

1
School of Mechanical, Electronic and Control Engineering, Beijing Jiaotong University, Beijing 100044, China
2
School of Economics and Management, Beijing Jiaotong University, Beijing 100044, China
*
Author to whom correspondence should be addressed.
Symmetry 2019, 11(6), 796; https://doi.org/10.3390/sym11060796
Submission received: 21 May 2019 / Revised: 11 June 2019 / Accepted: 12 June 2019 / Published: 14 June 2019

Abstract

:
The emergency department has an irreplaceable role in the hospital service system because of the characteristics of its emergency services. In this paper, a new patient queuing model with priority weight is proposed to optimize the management of emergency department services. Compared with classical queuing rules, the proposed model takes into consideration the key factors of service and the first-come-first-served queuing rule in emergency services. According to some related queuing indicators, the optimization of emergency services is discussed. Finally, a case study and some compared analysis are conducted to illustrate the practicability of the proposed model.

1. Introduction

Most of the patients admitted to the emergency department are critically ill and need urgent treatment. According to the characteristics of its emergency services, the emergency department is one of the most intensive departments in the hospital and has an irreplaceable role in the medical service system [1]. At present, a “hierarchical partition” treatment system is being applied to the emergency department. This method splits the patients in the emergency department according to different disease levels [2]. However, not all hospitals can do this kind of treatment system. For some hospitals with limited medical resources, only one section can be set up to conduct emergency medical services. Under this service system, patients are generally divided into emergency patients and non-emergency patients waiting to receive a treatment in a queue, and the proportion of emergency patients is usually between 20% to 30% [3].
A significant amount of research has been conducted on the management of the emergency department. For example, Solberg et al. [4] identified measures of emergency department (ED) and hospital workflow that would be of value in understanding, monitoring, and managing crowding. Goodacre and Webster [5] determined which patient characteristics are associated with prolonged waiting times in the emergency department and which characteristics are associated with an increased risk of leaving without being seen. Rowe et al. [6] determined the acuity level, reasons, and outcomes of the cases of patients leaving the emergency department (ED) without being seen (LWBS). However, these studies did not address the situation of only “one section” in emergency department and the possible problems of patients in this mode.
In order to analyze this kind of treatment mode under “one section”, queuing theory is a tool of choice. In previous studies, authors mostly favored queuing theory to solve problems in the medical field. Kao and Tung [7] used queuing theory to simulate the patient’s dynamics and proposed a two-stage model for the optimization of hospital beds. Jacur and Facchin [8] and Green [9] used queuing theory and simulation models to carry out bed planning problems in hospital critical surgery departments, pediatric semi-intensive care units, and obstetric units. Griffiths et al. [10] analyzed the intensive care unit through queuing theory and established mathematical models for both emergency and elective patients. Mital [11] analyzed the parameters of the hospital outpatient and inpatient department by establishing a model of M/M/C. Gorunescu et al. [12] considered the application of the M/PH/C model in medical management based on the M/M/C model in order to make the research closer to reality, including the patient’s arrival distribution and service time distribution, amongst other factors. Wang and Hare [13] conducted a study of the bed system for emergency care in Canada and discussed two queuing models consisting of three emergency input streams, the second of which was a multiflow separation model. Other authors consider the analysis of medical management through a combination of queuing models and other mathematical models or algorithms [14,15].
In this kind of treatment mode under “one hierarchy”, the patient’s treatment can be abstracted as waiting for service on the first-come-first-served basis in the same queue. However, because of the different types of patients, this mode has many potential negative effects, the most serious of which is delaying the condition of emergency patients. Therefore, this paper takes the service of emergency and non-emergency patients as the research object. On the basis of previous queuing studies, it considers giving priority to emergency patients in the queue and establishes a queuing model with priority. Meanwhile, we select some queuing indicators that can evaluate the quality of the emergency service, such as the utilization of resources and the average waiting time of patients (covered in more detail in Section 3). Through the selected queuing indicators, we analyze the actual impact of priority on the emergency department’s services, including the overall changes in the service, the changes in the service indicators of the emergency patients, and the changes in the service indicators of non-emergency patients. This will provide a theoretical reference for the actual emergency department service strategy, which represents the main contribution of this paper.
The remainder of the paper is organized as follows: Section 2 introduces the definition of service architecture and elements, Section 3 studies specific mathematical methods, Section 4 conducts case studies, Section 5 summarizes the full text and the future prospects for work.

2. Architecture and Hypothesis

2.1. Structure Definition

In this paper, patients in the emergency department are divided into two categories: one is emergency patients, and the other is non-emergency patients. The purpose of this paper is to discuss the impact of adding priority factors to existing emergency department service systems. In the study, the analysis of the problem cannot be performed in a single way. To solve the target problem, it is necessary to construct a dynamic system of the patient in the emergency department. In this system, patients are treated in the hospital while the remaining patients are queued for treatment. This is in line with a standard queuing theory system. Therefore, this paper uses queuing theory in operational research to solve the problem. The article needs to consider the comparison between the queuing model of the existing medical service system and the queuing model after adding the priority factor. Next, we will discuss the queuing model in detail.
The existing emergency service basically meets the queuing system under the first-come-first-served rule, and the current emergency service is also established accordingly. We have already discussed, however, that although this kind of rule has greater fairness, it will bring about a variety of problems. The most serious problem is ignoring the difference in the patient’s condition. There are two types of patients here and the condition of the emergency patient is more serious. Therefore, in this system, we give the emergency patient higher priority. Then, the emergency system under the new model will be a queuing system that satisfies the priority rules. We will establish a first-come-first-served queuing model and a priority queuing model and compare them to analyze the change in the emergency service under these different models.
The comparison of a single queuing indicator will appear to be unreasonable, so we need to construct a benefit objective function by the all queuing indicators which affect the service. We will use AHP to solve this problem. In the end, according to the comparison results, we will discuss the specific plan for emergency resources and a target program can be applied to the general emergency department.
Therefore, the research in this paper will be carried out in four steps. The specific steps are shown in Figure 1.

2.2. Hypothesis of the Queuing System

In this paper, we will discuss the emergency department service system by constructing a queuing model. In general, the queuing system mainly consists of four modules: customer source, queue, queuing rules, and service organization [16]. In the medical system, it was found through research that the patient’s arrival at the hospital fits well to a Poisson distribution [17]. Regarding service time, it is generally divided into two types: randomness and certainty. In general, for medical systems, the service desk’s service time is subject to a negative exponential distribution and an Erlang distribution [18]. In the emergency queuing system, we consider the use of two types of patients (emergency and non-emergency patients), and these two patients receive services on a first-come-first-served basis. In previous studies, it was found that, except for special circumstances, the number of randomly arrived patients counted in hospital statistics was in accordance with a Poisson distribution. In many cases, especially during the diagnosis and treatment of emergency departments, the total treatment time required for patients with complicated conditions is generally more, and for patients with milder symptoms, the total time spent in hospitals is relatively low. According to the previous studies, the patient’s visit time is generally satisfied with a negative exponential distribution.
Based on the above research, this paper intends to regard the system in which the patients in the emergency department wait in line as an M/M/C queuing system [19]. The resources, either servers or beds, depend on the actual area. The rules to be followed for this queuing system in the M/M/C model are:
  • The work of each of n resources is independent of each other, and the average service rate is the same, both μ ;
  • The average service rate of the entire hospital service organization is n μ (when N n ), N μ (when N < n );
  • Note that ρ s = λ / c μ is the average utilization rate of the service system. When ρ s < 1 , it will not be queued in an infinite number.
Therefore, we assume here that the patient should meet the following rules in this queuing system:
  • The arrival rate of the patient obeys the Poisson distribution;
  • Patient service time is subject to a negative exponential distribution.

3. Mathematical Methodology

According to the research content and assumptions of this paper, we make use of commonly accepted queuing-based notation and variables. Table 1 and Table 2 define all variables for input data, computations, and results, respectively.

3.1. First-Come-First-Served Queuing Model in Emergency Department

As mentioned above, the actual medical service system is abstracted into a first-come-first-served queuing model. Suppose there are c service resources in the system, each of which is independent for the patient; when λ / c μ < 1 , the queue system will have a steady value. For ρ 1 = λ / μ , ρ 1 = λ / c μ [20].
According to Markov’s state theory, the equation of state of the system is
p k = { ρ 1 k k ! p 0 = c k k ! ρ k p 0 , 0 k c ρ 1 k c ! c k c p 0 = c c c ! ρ k p 0 , k c
And if k = 0 P k = 1 , and ρ < 1 ,
1 = ( k = 0 c 1 ρ 1 k k ! + k = c ρ 1 k c ! c k c ) P 0 = ( k = 0 c 1 ρ 1 k k ! + ρ 1 c c ! 1 1 ρ ) P 0 ,
Therefore, it can be obtained from the above Formula [21]:
P 0 = ( k = 0 c 1 ρ 1 k k ! + ρ 1 c c ! 1 1 ρ ) 1 .
According to P 0 , we can obtain the following target parameters.
The probability that patients who come to the system must be queued:
C ( c , ρ 1 ) = k = c P k = k = c c c c ! ρ k P 0 = k = c P c ρ k c = p c 1 ρ = c p c c ρ 1 .
Average number of patients in the queue:
L q = k = c ( k c ) P k = l = 1 P l + c = ρ ( c ρ ) c c ! P 0 l = 1 l ρ l 1 = ρ ρ 1 c c ! ( 1 ρ ) 2 P 0
Average number of busy resources:
L s e r v i c e = k ¯ = k = 0 c k ρ k + c k = c + 1 P k = k = 0 c k c k k ! ρ k P 0 + k = c + 1 c c c c ! ρ k P 0 = c ρ ( k = 0 c 1 P k + k = c P k ) = c ρ = ρ 1
Average number of patients in the system
L s = L q + L s e r v i c e = L q + ρ 1 = ρ ρ 1 c P 0 c ! ( 1 ρ ) 2 + ρ 1 .
Average patient queuing time:
W q = L q λ = ρ 1 c P 0 μ c c ! ( 1 ρ ) 2 .
Average patient stay time:
W s = L s λ = W q + 1 μ .

3.2. Priority Urgency Queuing Model for Emergency Department

3.2.1. Hypothesis of Queuing Model with Priority in Emergency Department

Priority queuing system can be divided into preemptive priority queuing system and non-preemptive queuing system [22]. This article considers non-preemption priority here. According to the foregoing, at present, the use of two types of patients in the emergency department is considered, namely, emergency patient and non-emergency patient. In terms of the degree of illness, emergency patients are more severe than non-emergency patient. Therefore, the rules and hypothesis for patient compliance in the emergency department are as follows:
  • The arrival rates of both emergency patient and non-emergency patient obey Poisson distribution;
  • The time distribution of service emergency patient and non-emergency patient obeys the negative exponential distribution of μ 1 and μ 2 ;
  • Emergency patients have the non-preemptive priority. In the system, if there is no emergency patient and there is one or more helpdesk in the system, the new emergency patient will directly enter the service desk to receive services. If the number of service stations is busy and there are no patients in the queue, the newly arrived patients will be at the head of the queue and wait for an idle service desk to receive services;
  • The capacity of the queuing system is not limited, and for the same level of patients, the queuing discipline of first-come-first-served (FCFS) must be followed [23].

3.2.2. Establishment of Priority Queuing System

Suppose there are a total of n priority customers in the system, and there are C service desks that provide services independently of each other. The arrival rate of each type of customer satisfies the corresponding Poisson distribution, and the average arrival rate of the i-th customer is λ i . The service rate of each type of customer satisfies a negative exponential distribution, the average service rate of the i-th customer is μ i , and the average service time is S i = 1 / μ i . Since both of them reach the Poisson flow distribution, there is
λ t o t a l = λ 1 + λ 2 + + λ n ,   S = λ 1 λ S 1 + λ 2 λ S 2 + + λ n λ S n ,
and we make ρ 1 = λ / μ , ρ = λ / c μ , suppose the waiting time of the first-level customer is W q 1 , and the waiting time of the j-th customer is W q j ( 1 < j c ) , so there are [20]:
W q 1 = C [ c , ρ 1 ] S c ( 1 λ 1 S c ) ,
W q j = C [ c , ρ 1 ] S C [ 1 S i = 1 j 1 λ i C ] [ 1 S i = 1 j λ i C ] ,
by Equation (3), we can obtain the following equation:
C [ c , ρ ] = n P c C ρ 1 .
Waiting time for the entire system W q :
W q = λ 1 λ W q 1 + λ 2 λ W q 2 + + λ n λ W q n .
In this article, two types of patients are involved, so n = 2.

3.3. Establishment of Analytic Hierarchy Model for Benefit Function of the Service

3.3.1. Selection of Plan Level Indicators

The rationality of emergency service should be reflected by the emergency department and the patient’s index. For hospitals, how to evaluate the service of the emergency department depends on the utilization of the source, such as the resource usage rate and turnover rate. For patients, the satisfaction can be used as an indicator of their waiting time and length of stay in the emergency department. Therefore, this paper will use the analytic hierarchy process to target the benefits of the emergency service A, source efficiency B1 and patient satisfaction B2 as criteria, resource turnover C11, resource utilization rate C12, patient waiting time C21, and length of stay C22 to build an analytic hierarchy model for the program level. The model diagram is shown in Figure 2.

3.3.2. Establishment of Benefit Function

In order to obtain the weight value of each factor layer to the target layer, this paper adopts the 1–9 scale method and constructs the judgment matrix by conducting an expert questionnaire survey [24]. Therefore, we design the questionnaire and distribute it to the emergency doctors of a hospital to evaluate the importance of the relevant factors according to the criteria of the 1–9 scale method. The results of the expert’s scoring are shown in Table 3, Table 4 and Table 5.
Therefore, the judgment matrix is constructed according to the scoring situation as follows:
A = ( 1 1 3 3 1 )   B = ( 1 1 3 3 1 )   C = ( 1 1 5 5 1 ) .
The maximum eigenvalue of matrix A is found to be 2, the maximum eigenvalue of the matrix B1 is 2, and the maximum eigenvalue of the matrix B2 is 2. The eigenvectors of matrix A are normalized to W 1 = { 0.75 , 0.25 } T . The eigenvectors of matrix B1 are normalized to W 2 = { 0.25 , 0.75 } T . The eigenvectors of matrix B2 are normalized to W 3 = { 0.1667 , 0.8333 } T . We end up with a weight vector W = { 0.1875 , 0.5625 , 0.0416 , 0.2082 } T .
Therefore, the benefit function Y is
Y = 0.1875 X 1 + 0.5625 X 2 + 0.0416 X 3 + 0.2083 X 4 .
In the actual solution process, the selected indicators need to be normalized:
x * = X X min X max X min ,
where X max the maximum is value in the sample and X min is the minimum value in the sample.
In the above multiple linear regression equation, if 0 X i 1 ( i = 1 , 2 , 3 , 4 ) , then 0 Y 1 , and the Y value is close to 1, indicating that the service of emergency department is better.

4. Motivating Case Study

4.1. Sorting Case Data

In case [1], the number of patients from 8:00 to 00:00 was targeted. According to statistics, the number of emergency patients arriving from 8:00 to 4:00 in a month was 652. After data analysis, according to the hourly statistics and after a single-sample k-s test, the arrival distribution of the emergency patients satisfies the Poisson distribution with a lambda of 1.3583. For the average service rate of the emergency patient, the χ2 test using the goodness of fit satisfies the negative exponential distribution with a μ value of 0.9517. For non-emergency patient, the total number of arrivals was 1222 using a single-sample ks test, which reached a Poisson distribution with a distribution of λ of 1.6763, and an average of non-emergency patient by the χ2 test of goodness of fit. The service rate satisfies a negative exponential distribution with a μ value of 0.7597. The identified service resources are beds, whose number is 14. Therefore, the entire queuing theory system can be regarded as the M/M/C queuing theory model. All system parameters are shown in Table 6.

4.2. Queuing Indicators under Two Rules and Comparison

4.2.1. Calculation of Queued Indicators

According to the collated data, this paper obtains the relevant queuing indicators because an infinitely long queue is generated when the service strength in the system is greater than 1. We calculated the service intensity ρ = λ / c μ = 1 and found the number of beds c to be 3.6. In order to obtain more sample data for normalization, we use the number of beds as the variable to obtain multiple sets of the selected indicators. The number of services selected in this paper is 5, 7, 9, 11, and 14.
According to the queuing model formula obtained in the fourth section, we use MATLAB to solve all the queuing indicators under the first-come-first-served system, the relevant queuing indicators of the emergency patient with the priority system, and the non-emergency patient. The relevant queuing indicators and the total queuing indicators under the priority system are individually represented in Table 7, Table 8, Table 9 and Table 10.

4.2.2. Comparison of Queuing Systems

First, after normalizing the queuing theory in 4.2.1, it is brought into the benefit function formula 13 to obtain the benefit function Y 1 under the first-come-first-served and the benefit function Y 2 under the priority system.
Y 1 = 0.1875 X 1 + 0.5625 X 2 + 0.0416 X 3 + 0.2083 X 4 = 0.5156
Y 2 = 0.1875 X 1 + 0.5625 X 2 + 0.0416 X 3 + 0.2083 X 4 = 0.5152
Based on the above results, it is found that the benefit value of the bed has not changed correspondingly to the bed lining system under the existing first-come-first-served rules after giving the emergency patient non-preemptive priority. Since there is basically no difference in the benefit value, we need to compare the various queuing factors that determine the benefit value. Since the index values have been normalized, we use the form of the chart here to make a more intuitive comparison in Figure 3 and Figure 4.
According to the above comparison results, it can be found that when the first-come-first-served and the prioritized queuing system are balanced, not only are the overall benefits not significantly changed, but the relevant indicators in the system are also basically the same. Then it can be shown that priority does not change the integrity and balance of the system.
Since there is no difference in the overall indicators, we will discuss then the indicators of the two queuing systems for the emergency patient and non-emergency patient. Based on the relevant data obtained in Section 4.2.1, we first compare the wait time with the stay time, and we present the data as a histogram in Figure 5.
According to the histogram, we can clearly see that compared with the current queuing method, after waiting for the priority of the emergency department, the waiting time and stay time are significantly reduced. At the same time, for non-emergency patients, although the relevant indicators have increased, though not obviously, and when the number of resources reaches a certain number, there is no difference between emergency patients and non-emergency patients in the priority system.
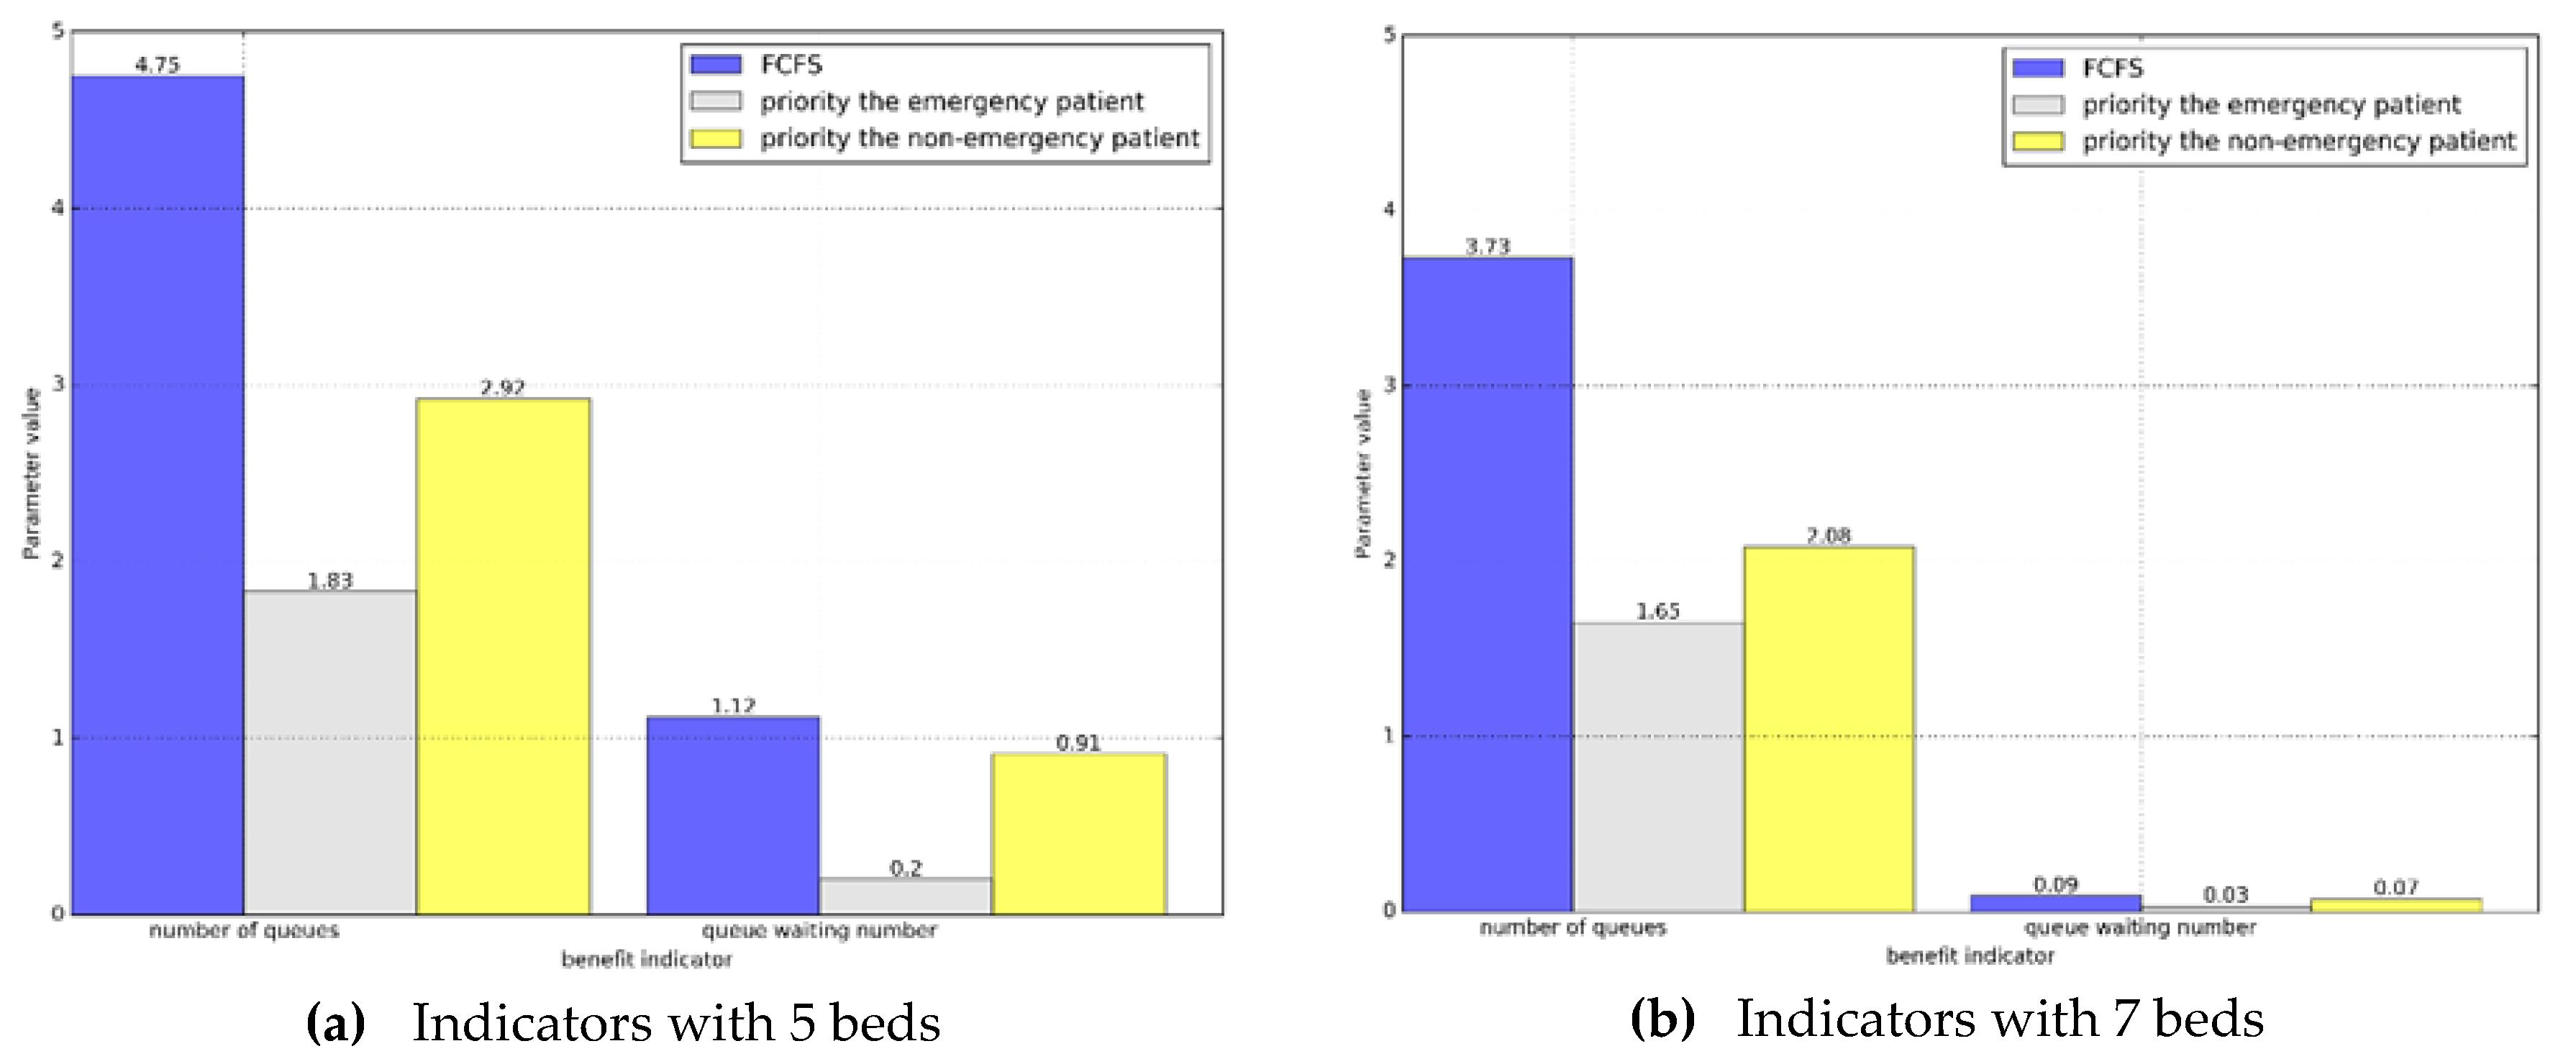
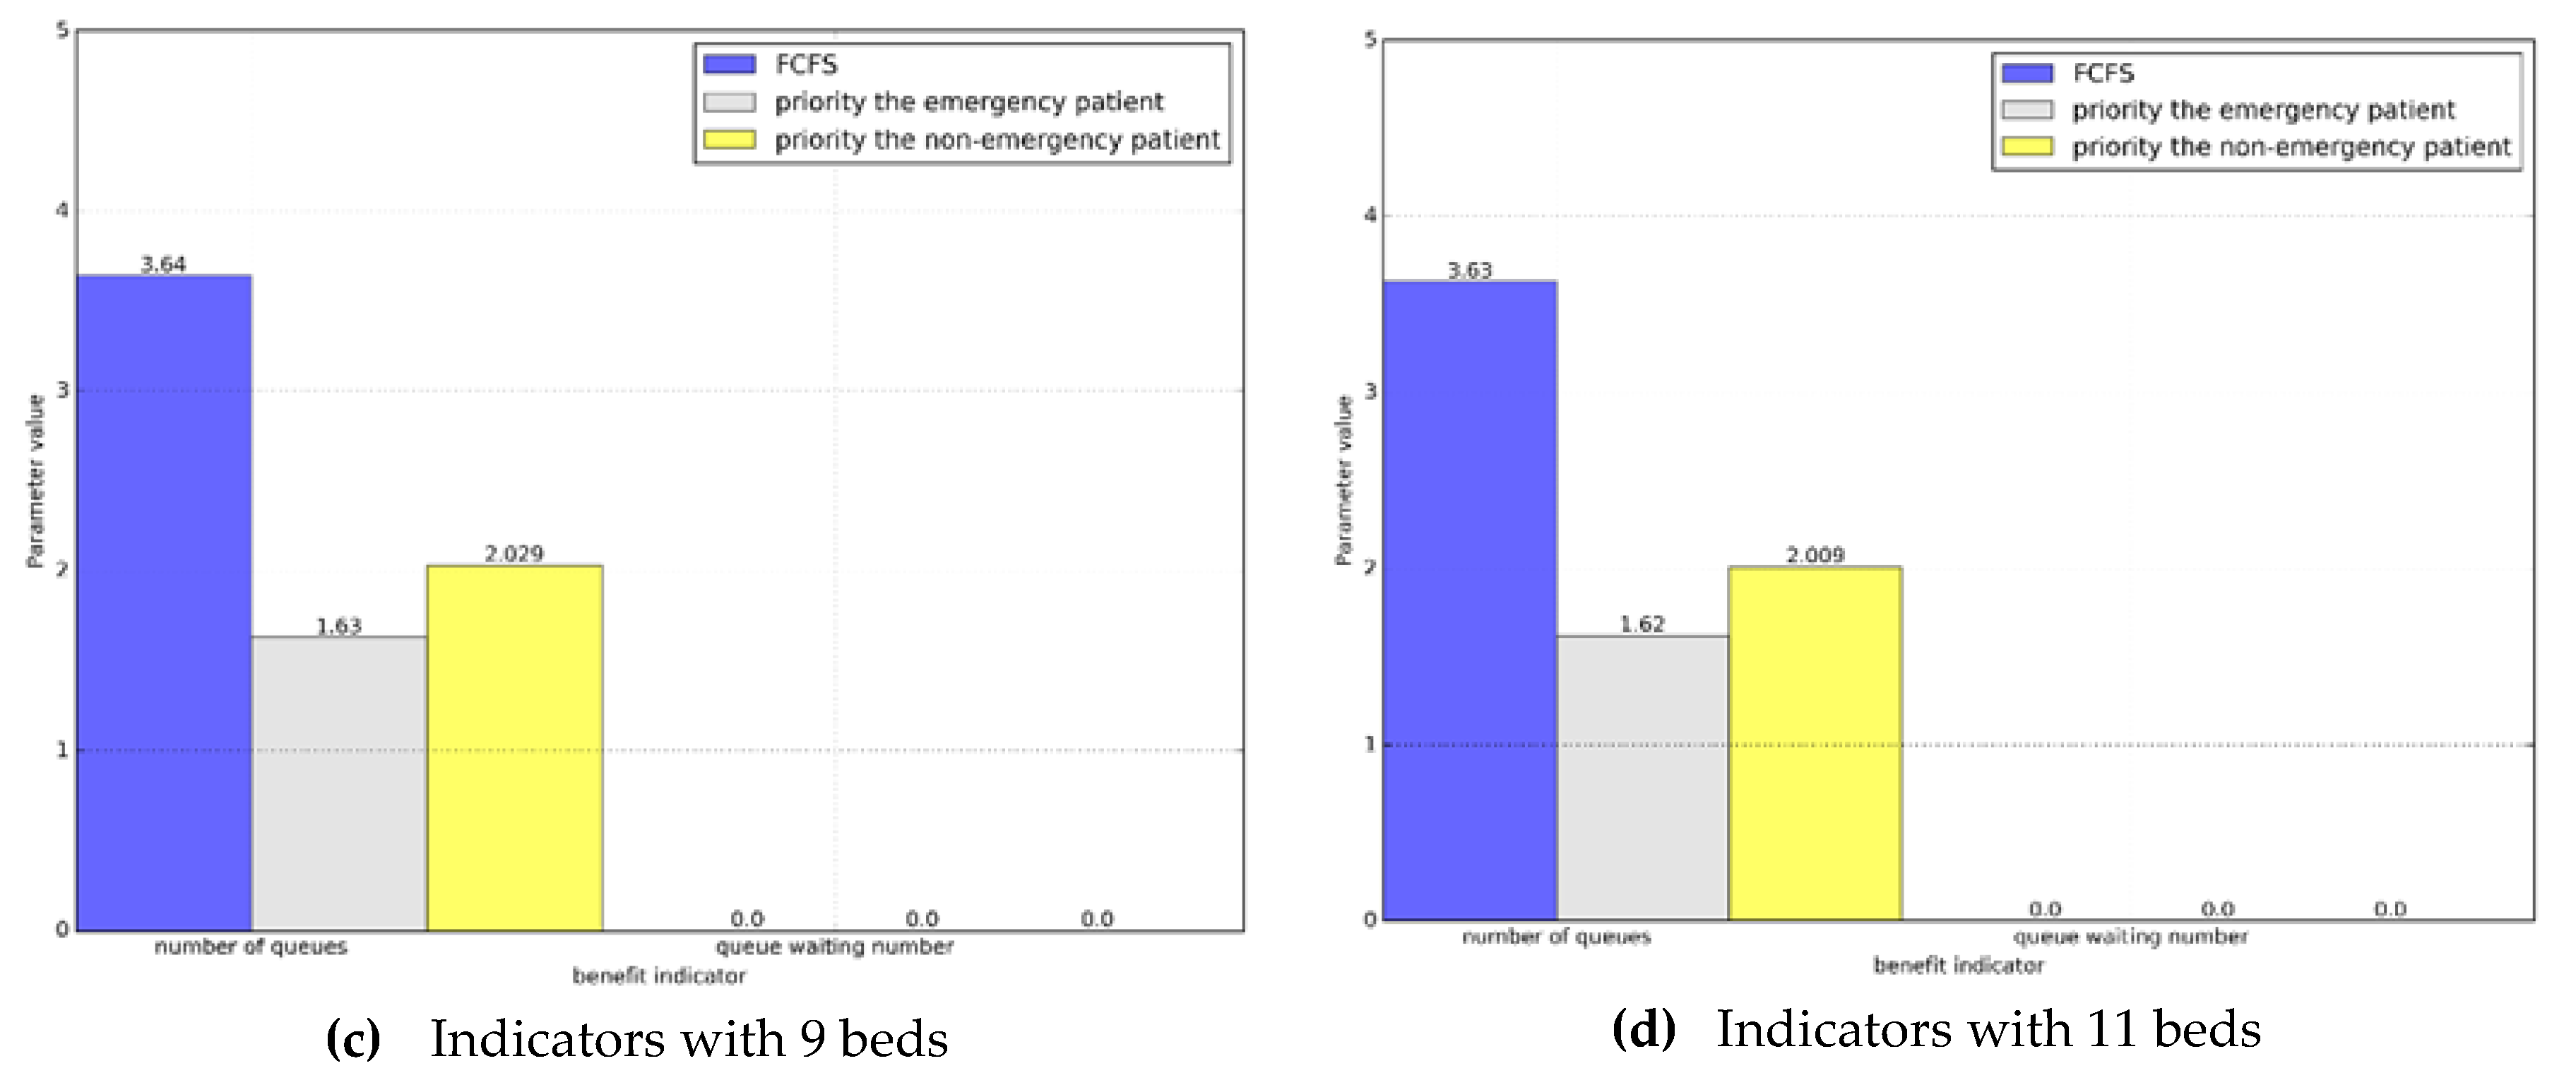
Next, we will compare the queue length and the waiting numbers. Similarly, we will display it in the form of a histogram in Figure 6.
Based on the comparison, we can see that in the priority system the average number of waiting patients and the average number of queues in the emergency department are less than those in the non-emergency patients. At the same time, we find that when the system reaches a steady state, in the priority system, the total number of emergency and non-emergency patients is the same as the number of patients in the actual situation.
Comparing these two sets of indicators, it can be found that in the priority system, the emergency service patient’s service index is indeed optimized, but it does not reflect the specific changes of the emergency service indicators of non-emergency patients. Hence, we compare them next by normalizing the data in Figure 7.
After normalization, we find that when priority is given to the emergency patients, the trend is very obvious compared with the actual situation which is the same as the above conclusion. More importantly, non-emergency patients did not change their relative indicators after the two systems reached a steady state, indicating that giving priority to emergency patients did not have a significant impact on non-emergency patients.
We now summarize the comparative analysis. After giving emergency patients a certain priority, their queuing indicators are optimized, such as the average waiting time and the length of stay in the emergency department, so that the emergency patient’s condition will not be delayed and they can get treatment earlier. At the same time, there has not been a significant change in the indicators of visits to non-emergency patients. Therefore, it can be concluded that the queuing system with priority has a certain improvement effect on the medical service of the emergency department.

5. Conclusions

This paper aimed to discuss the situation of medical services when the emergency department can only set up one section and medical resources are limited. In order to solve some of the potential problems in this current situation of the treatment, we introduced a priority queuing model to analyze the specific changes in the service. Through comparative analysis of the case, it can be found that the overall benefit of the service system has not changed significantly after giving priority to the emergency patients, which shows that the priority factor does not change the balance of the original system. Regarding the analysis of individuals within the system and, first of all, emergency patients, it can be found that after giving them priority, the indicators of their service have been significantly improved, which is of great help in solving the delay of emergency patients. Secondly, for non-emergency patients, it can be found that although there are certain declines in the indicators in the priority system, the overall service benefits have not clearly changed. This shows that the priority system has its specific advantages and a certain feasibility compared to the current service model.
At the end of the article, we discuss the future work, and two aspects which can be improved in the future. The first is the determination of the benefit function. This paper mainly uses the analytic hierarchy process to determine the benefit index and determines the benefit function through the expert scoring method and the judgment matrix. However, the method adopted in this paper is more subjective, and we consider adding the fuzzy decision theory here to make the benefit function more objective. Secondly, there are some shortcomings in the text for some indicators, with more assumptions. For example, the patient’s arrival rate can then be considered for the effects of seasonality and peaking.

Author Contributions

Conceptualization, A.Z.; Methodology, A.Z. and X.Z.; Software, A.Z.; Validation, X.Z.; Writing—Original Draft Preparation, A.Z.; Writing—Review & Editing, Q.L.; Supervision, X.Z.; Project Administration, R.Z.

Funding

This research was funded by the key program of National Natural Science Foundation of China grant number 71532002 and a key project of Beijing Social Science Foundation Research Base grant number 18JDGLA017.

Conflicts of Interest

The authors declare no conflict of interest.

References

  1. Xie, L. Queuing Theory and Emergency Bed Setting. Master’s Thesis, Sichuan University, Chengdu, China, 2005. [Google Scholar]
  2. Jeffery, K.; Kevin, T. A multi-class queuing network analysis methodology for improving hospital emergency department performance. Comput. Oper. Res. 2009, 36, 1497–1512. [Google Scholar]
  3. Zhu, M.Z.; Qi, E.S.; Yang, F.Q. Optimization of Doctor Resource in the Emergency Department Based on Triage Queuing Network. J. Tianjin Univ. 2016, 18, 129–134. [Google Scholar]
  4. Solberg, L.; Asplin, B.; Weinick, M.; Magid, D.J. Emergency department crowding: Consensus of potential measures. Ann. Emerg. Med. 2003, 42, 824–834. [Google Scholar] [CrossRef]
  5. Goodacre, S.; Webster, A. Who waits the longest in the emergency department and who leaves without being seen? Emerg. Med. J. 2005, 22, 93–96. [Google Scholar] [CrossRef] [PubMed]
  6. Rowe, B.; Channan, P.; Bullard, M.; Blitz, S.; Saunders, L.D.; Rosychuk, R.J.; Lari, H.; Craig, W.R.; Holroyd, B.R. Characteristics of patients who leave emergency departments without being seen. Acad. Emerg. Med. 2006, 13, 848–852. [Google Scholar] [CrossRef] [PubMed]
  7. Kao, E.P.C.; Tung, G.G. Bed allocation in a public health care delivery system. Manag. Sci. 1981, 27, 507–520. [Google Scholar] [CrossRef]
  8. Romanin-Jacur, G.; Facchin, P. Optimal planning of a pediatric semi-intensive care unit via simulation. Eur. J. Oper. Res. 1987, 29, 192–198. [Google Scholar] [CrossRef]
  9. Green, L.V. How many hospital beds? Inquiry 2002, 39, 400–412. [Google Scholar] [CrossRef]
  10. Griffiths, J.D.; Knight, V.; Komenda, I. Bed management in a critical care unit. J. Manag. Math. 2013, 24, 137–153. [Google Scholar] [CrossRef]
  11. Mital, K.M. Queuing analysis for outpatient and inpatient services: A case study. Manag. Decis. 2010, 48, 419–439. [Google Scholar] [CrossRef]
  12. Gorunescu, F.; McClean, S.I.; Millard, P.H. A queueing model for bed-occupancy management and planning of hospitals. J. Oper. Res. Soc. 2002, 53, 19–24. [Google Scholar] [CrossRef]
  13. Wang, Y.; Hare, W.L.; Vertesi, L.; Rutherford, A.R. Using simulation to model and optimize acute care access in relation to hospital bed count and bed distribution. J. Simul. 2011, 5, 101–110. [Google Scholar] [CrossRef]
  14. Li, X.; Tamiz, M. An integrated queuing and multi-objective bed allocation model with application to a hospital in China. J. Oper. Res. Soc. 2009, 60, 330–338. [Google Scholar] [CrossRef]
  15. Belciug, S.; Gorunescu, F. Improving hospital bed occupancy and resource utilization through queuing modeling and evolutionary computation. J. Biomed. Inform. 2015, 53, 261–269. [Google Scholar] [CrossRef] [PubMed] [Green Version]
  16. Anderson, C.; Ratnieks, F.L. Task Partitioning in Insect Societies. I. Effect of Colony Size on Queueing Delay and Colony Ergonomic Efficiency. Am. Nat. 1999, 154, 521–535. [Google Scholar] [CrossRef] [PubMed]
  17. Chaussalet, T.J.; Xie, H.; Millard, P. A closed queueing network approach to the analysis of patient flow in health care systems. Methods Inf. Med. 2006, 45, 492–497. [Google Scholar] [PubMed]
  18. Frederick, S.; Gerald, J. Introduction to Operations Research; Tsinghua University Press: Beijing, China, 2007; pp. 774–777. [Google Scholar]
  19. Wu, X. Queuing model in hospital outpatient system. China Med. Her. 2007, 4, 131–132. [Google Scholar]
  20. Sztrik, J. Basic Queueing Theory; GlobeEdit and OmniScriptum GmbH & Co, KG: Saarbrücken, Germany, 2016. [Google Scholar]
  21. Lu, C.L. Queuing Theory; Beijing University of Posts and Telecommunications Press: Beijing, China, 2009; pp. 67–155. [Google Scholar]
  22. Horvath, A.; Horvath, G.; Telek, M. A traffic based decomposition of two-class queueing networks with priority service. Comput. Netw. 2009, 53, 1235–1248. [Google Scholar] [CrossRef]
  23. Kao, E.P.C.; Wilson, S.D. Analysis of nonpreemptive priority queues with multiple servers and two priority classes. Eur. J. Oper. Res. 1999, 118, 181–193. [Google Scholar] [CrossRef]
  24. Shi, H.E.; Wang, Q. Evaluation Index System Based on AHP Auction Website. Logist. Eng. Manag. 2010, 32, 89–90. [Google Scholar]
Figure 1. The structural steps.
Symmetry 11 00796 g001
Figure 2. Hierarchical analysis structure.
Symmetry 11 00796 g002
Figure 3. Column chart comparison.
Symmetry 11 00796 g003
Figure 4. Line chart comparison.
Symmetry 11 00796 g004
Figure 5. Time comparison.
Symmetry 11 00796 g005
Figure 6. Queue comparison.
Symmetry 11 00796 g006aSymmetry 11 00796 g006b
Figure 7. Line chart comparison.
Symmetry 11 00796 g007
Table 1. Variable definitions for all computational data.
Computational VariablesDefinition
λ Patient arrival rate
μ Patient service rate
c number of resources
Table 2. Variable definitions for all results variables.
Results VariablesDefinition
C The probability that patients who come to the system must be queued
L q Average number of patients in the queue:
L s e r v i c e Average number of busy resources
L s Average number of patients in the system
W q Average patient queuing time
W s Average patient stay time
Table 3. Target layer and criteria layer.
AB1B2
B111/3
B231
Table 4. Criteria layer and plan layer (1).
B1C11C12
C1111/3
C1231
Table 5. Criteria layer and plan layer (2).
B2C21C22
C2111/5
C2251
Table 6. System parameters.
PatientsEmergency PatientsNon-Emergency Patients
Number of beds1414
Arrival rate/hour1.35831.6763
Service rate0.95170.7597
Table 7. First-come-first-served indicators.
Number of Service Beds1411975
Bed use rate25.96%33.04%40.38%51.92%72.68%
Lq (per person)0.000010.00070.00910.09701.1226
L (per person)3.63433.63503.64343.73134.7568
Wq (hour)0.0000030.00020.00300.03200.3699
W (hour)1.19761.19781.20061.22961.5675
Table 8. Emergency patient indicators within priority.
Number of Service Beds1411975
Bed use rate25.96%33.04%40.38%51.92%72.68%
Lq (per person)00.00030.0030.02720.2034
L (per person)1.62671.6271.62971.65391.8301
Wq (hour)00.00020.00220.02000.1498
W (hour)1.19761.19781.19981.21761.3474
Table 9. Non-emergency patient indicators within priority.
Number of Service Beds1411975
Bed use rate25.96%33.04%40.38%51.92%72.68%
Lq (per person)00.00050.00620.06980.9191
L (per person)2.00752.0082.03172.07742.9266
Wq (hour)00.00030.00370.04170.5483
W (hour)1.19761.19791.20131.23931.7459
Table 10. Total priority indicator.
Number of Service Beds1411975
Bed use rate25.96%33.04%40.38%51.92%72.68%
Lq (per person)00.00080.00910.09681.1224
L (per person)3.63423.63503.64343.73104.7567
Wq (hour)00.00030.00300.03190.3699
W (hour)1.19761.19791.20061.22951.5675

