Abstract
As a highly effective and environmentally benign suppression agent, liquid nitrogen (LN2) has been widely used for fire extinguishing in plants, dwellings, enclosed underground tunnels, and other confined spaces through cooling and inerting. It is of great significance to understand the cooling and inerting effects of LN2 injected into a confined space. A confined-space experimental platform was developed to study the injecting LN2 into the platform with different injection parameters, such as mass flux, pipe diameter, and inclination angle. In addition, a mathematical model of quantitatively assessing cooling and inerting effects was proposed by using heat transfer capacity, inerting coefficient, and cooling rate. Results showed that the inerting effect was gradually enhanced with a mass flux increasing from 0.014 to 0.026 kg/s and then tended to level off; an appropriate pipe diameter of 12 mm was optimal for the cooling and inerting effects in this experiment. In addition, a positively increasing inclination angle could contribute to the cooling and inerting effects. However, there was little effect on the cooling and inerting with an inclination angle less than 0°. This study can provide technical guidances for environmentally friendly fire extinguishing with LN2 in a confined space.
1. Introduction
Liquid nitrogen (LN2), as an excellent low-temperature cooling and inerting medium, has been widely used in the areas of food industry, machine manufacturing, medical treatment, and space technology [1,2,3,4]. It has a series of virtues, such as safety, reliability, low price, abundance, stable performance, etc. Besides, LN2 is also an environmentally benign and highly efficient extinguishing agent and applied in fire prevention and extinguishing due to the remarkable cooling and inerting effect [5,6,7]. The major fire extinguishing mechanisms with LN2 include: (1) refrigeration and cooling because of the very low temperature of the cryogen and the latent and sensible heat; (2) inerting of the atmosphere—the vaporization expansion times of LN2 is high in that 1 L LN2 can vaporize to 647 L gaseous nitrogen in the standard state [8].
In previous research, it has been identified that LN2 is an effective and environmentally friendly benign suppression agent for combustible metal fires, oil pool fires, and building fires. The effectiveness of LN2 for sodium fire suppression was quantified by measuring the pool temperature and the mass of LN2 delivered, and the suppression mechanism indicated that the cooling (via LN2 vaporization) of the pool and its surroundings were below the sodium self-ignition temperature [9]. Pool fire experiments were conducted with ethanol, propanol, and diesel fuel [8]. It showed that LN2 had undergone a phase change as soon as it contacted a burning surface, and the gas expanded and formed a cloud spreading over and near the surface, which revealed the fire extinguishing mechanisms of surface cooling, inerting of the atmosphere, and rapid expansion followed by gravity spread. In addition, a technique for remote-controlled application of liquid nitrogen which was effective for fire extinguishing was proposed [10]. LN2 was considered as a desirable firefighter in fighting building fires for its effectiveness and the elimination of water damage resulting from conventional firefighting methods by studying the use of LN2 in the past two decades [11]. Shi and Zhou compared the extinguishment behaviors of LN2 vertical/horizontal jets for extinguishing oil pool fires in weight, thermocouples temperature, and infrared thermal image [12]. They discovered that LN2 had an excellent performance for firefighting. The horizontal jet was more effective than the vertical jet considering the required amount of LN2 and fire extinguishing time. Fires caused by spontaneous coal combustion [13,14] are the main disaster in coal mines. LN2 also plays an important role in coal mine fire prevention and extinguishing [15,16,17]. The immediate LN2 infusion technology has been applied in coal mines [18]. The technique is efficient in absorbing heat, and displacing oxygen and combustible gases via LN2 expansion. Shi and Zhou experimented [19] by injecting LN2 into coal porous media both in the openings and in the enclosures to study the heat and mass transfer of LN2. They analyzed the mechanism of fire prevention using liquid nitrogen in the coal mine by monitoring the temperatures and oxygen concentrations in the atmosphere. Injecting LN2 into confined spaces, such as pipelines, buildings, and underground roadways, is a complicated heat and mass transfer process. The process includes phase change, thermal conductivity, convective heat transfer, gas diffusion, and so on. The heat and mass transfer of LN2 in small confined spaces such as micro-tubes, round pipes, and horizontal and vertical pipes has been investigated by many researchers [20,21,22]. However, less attention has been paid to large confined spaces. Furthermore, the cooling and inerting levels were assessed only according to the changes of temperature and oxygen concentration respectively at a given measurement point. The heat and mass transfer, as well as cooling and inerting effects of liquid nitrogen on the whole space, are not further quantitatively analyzed.
Injecting LN2 into the confined space involves the transformation of gas and liquid, gas–liquid two-phase flow, and latent heat transfer of vaporization. Using a computational fluid dynamics (CFD) modeling is difficult for simulating the process. An experimental approach is appropriate, based on which the process can be conducted intuitively, and the actual features of injecting LN2 in situ can be shown well. In this paper, a multi-dimensional (temperature, relative humidity, and oxygen concentration) and multi-measurement-point confined-space experimental platform is built. The LN2 is injected into the specific confined space with different injection conditions. The spatial distributions of the temperature and oxygen concentration in the space are obtained to reveal the heat and mass transfer characteristics of LN2. The mathematical model of assessing cooling and inerting effects of LN2 in a confined space is developed to analyze the effects of mass flux, pipe diameter, and inclination angle. Based on these experiments on ameliorating injection technology, the study will contribute to improving the availability and efficiency of LN2 application for fire prevention and extinguishing.
2. Materials and Methods
2.1. Experimental Setup
Figure 1 depicts a sketch diagram of the experimental setup. The equipment consists of a confined space, an LN2 injection system, and a data acquisition system. The experimental confined space was a cuboid steel framework (3 m in length, 2 m in width, and 2 m in height) packaged with plastic films. The symphyses between the films were conglutinated with scotch tape to ensure certain air tightness. The LN2 injection system consisted of an LN2 self-pressurization buffer tank with an effective working pressure more than 0.1 MPa, a mass flowmeter with a scale flow of 0–3000 kg/h, and an accuracy level of ±0.1% full scale (FS), and a low-temperature resistance steel pipe. The data acquisition system consisted of twenty-seven T-type thermocouples, twenty-seven OMEGA OM-62 relative humidity (RH) data loggers (a measurement range 10–90% RH and a resolution of 0.01% RH), twenty-seven 4OXV oxygen concentration sensors (a measurement range of 0–25 vol %, an offset less than 0.6 vol %, and data acquisition frequency of 0.5 Hz), two OMB-DAQ-2416 Series data acquisition modules with 16 channels and TracerDAQ software supplied, twenty-seven oxygen concentration transmitters, four controllers, and a computer. Twenty-seven measurement points were regularly arranged in the confined space, each equipped with a T-type thermocouple, a relative humidity data logger, and an oxygen concentration sensor. The temperature, relative humidity, and oxygen concentration at each measurement point could be monitored, stored, and displayed on the computer in real-time via the data acquisition system. Figure 1 also shows that a three-dimensional coordinate system is established with Point ‘O’ as the coordinate origin. The coordinate point of the LN2 injection port was set to (3.0, 1.0, 0.8).
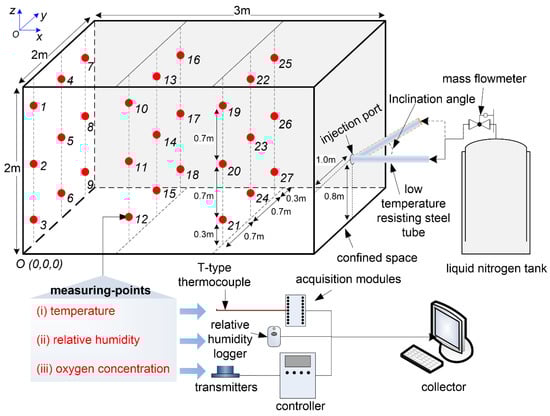
Figure 1.
Sketch view of the experimental setup.
2.2. Experimental Method
In the experimental process, LN2 was injected from the LN2 self-pressurization buffer tank to the confined space via the low-temperature resistance steel pipe with different mass fluxes (fm), pipe diameters (Φ), and inclination angles (ain). The mass flux was defined as the mass of LN2 injected into the confined space per unit of time. The inclination angle was a crossing angle between the low-temperature resistance steel pipe and horizontal plane, which represented the injection direction of LN2. The detailed parameter settings are shown in Table 1. The cooling and inerting phenomenon of LN2 in the confined space was observed with an injection duration of 180 s. The effect of a single parameter on the temperature and oxygen concentration at each measurement point was analyzed under the conditions of maintaining other parameters unchanged. For the parameter setting of each given experiment, the data values at twenty-seven measurement points would be obtained through the data acquisition system. Thus, the variations in temperatures and oxygen concentrations could be analyzed.

Table 1.
Detailed parameter settings.
2.3. Modeling
According to the Kamerlingh Onnes equation of state, the state equation of the mixed gases in the confined space can be expressed as:
where P, μ, and ρ are the pressure, molar mass, and density of the gas, respectively, and A, B, and C are the virial coefficients, all being functions of temperature (T). Equation (1) shows a probable inverse proportional relationship between T and ρ to some extent, when P is constant.
When LN2 is injected into the confined space, it absorbs the heat inside the confined space and cools the heat medium (mixed gas) in the confined space by heat transfer. At the same time, the LN2 vaporizes to a lot of gaseous nitrogen, decreasing the oxygen concentration and inerting the confined atmosphere. The above shows that the heat transfer capacity of the heat medium and the changes in oxygen concentration can represent the cooling effect and the inerting effect of LN2 to some extent, respectively. In order to calculate the heat transfer capacity of the heat medium, it is assumed that the mixed gas in confined space consists of oxygen and nitrogen. The measurement heat medium is divided into I × J× K micro units. A particular micro unit is regarded as the least unit for calculation. The heat transfer capacity of the heat medium in the whole confined space (Q) can be calculated by Equation (2).
where i, j, and k reflect the spatial orientation of the micro unit, and Qi, j, k is the heat transfer capacity of the specific micro unit with the temperature ranging from T1 to T2, which can be expressed as Equation (3) according to the heat release from the heat medium to the LN2.
where ρT, i, j, k is the dry gas density of the specific micro unit at T, which can be expressed as Equation (4) according to Equation (1), and cT, i, j, k is the specific heat of the mixed gas at T, and can be obtained by Equation (5).
where T0 is the temperature in the standard state (T0 = 273.15 K), ρO2 and ρN2 are the density of oxygen, 1.429 kg/m3, and the density of nitrogen, 1.251 kg/m3, in the standard state, respectively, and CT, i, j, k is the oxygen volume fraction in the specific micro unit at T.
where ca and cv are the specific heat of dry air and the specific heat of water vapor, respectively. They are approximately 1.01 kJ/(kg·K) and 1.88 kJ/(kg·K) in a certain temperature range, and the water vapor in the mixed gas considered during the experiment, HT, i, j, k is the mass of water vapor per kg dry-mixed gas at T, which can be obtained by Equation (6).
where dT is the water content per kg dry-mixed gas in wet-saturated mixed gas at T, g/kg and rT, i, j, k is the relative humidity of the specific micro unit, %.
Furthermore, in order to analyze the inerting effect, the average oxygen concentration in the confined space () is defined as:
In addition, the standard deviation of oxygen concentration (S) is also defined as:
and the variation coefficient (CV) is expressed as:
where CV is dimensionless. The smaller CV, the better the mixed degree is. The inerting effect can be quantified by synthesizing the decline and mixed degree of oxygen concentrations. In order to quantify the inerting degree of LN2 injected into the confined space, an inerting coefficient value (F) is defined as Equation (10) to determine the inerting effect based on the drop extant of oxygen concentration and the mixed degree of nitrogen in the confined space. The smaller F, the better the inerting effect in confined space is.
where is the oxygen volume fraction of the atmosphere in the standard state (21%).
3. Results and Discussion
3.1. Temperatures and Oxygen Concentrations Versus Time
An experiment of fm = 0.019 kg/s, Φ = 28 mm, and ain = 0° taken as an example, a three-dimensional cubic interpolation for the temperatures and oxygen concentrations from twenty-seven measurement points was conducted. Thus, the three-dimensional distributions of temperature and oxygen concentration in the confined space at 0, 90, 180, 360, 720, and 1440 s could be obtained. Figure 2 shows the values on six slices of x = 0.0, 1.0, 2.0 m, y = 1.0 m, z = 0.3, 1.0 m.
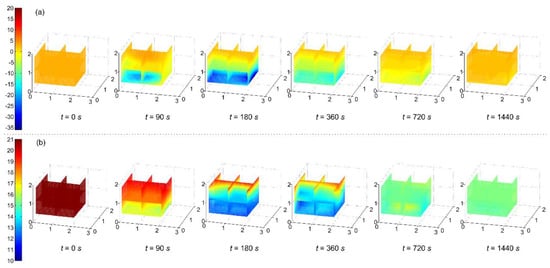
Figure 2.
Temperatures (a) and oxygen concentrations (b) on six slices of x = 0.0, 1.0, 2.0 m, y = 1.0 m, z = 0.3, 1.0 m at 0, 90, 180, 360, 720, and 1440 s.
LN2 flowing through the low-temperature resistance steel pipe gradually reduced the inner-wall surface temperature of the steel pipe, resulting in the decreasing LN2 evaporation and the decreasing gas–liquid ratio of nitrogen. Figure 2a shows the temperature distribution. There was a spray distribution on the horizontal plane of z = 0.3 m and 0 < x < 2 m with the temperatures below 0 °C at 90 s. The low-temperature area mainly occurred in z < 1.0 m at 180 s when LN2 injection was stopped. The temperatures returned to the initial state at 1440 s, while the temperatures in z > 1.0 m had a little change from 0 to 1440 s. The LN2 vaporization formed cloud spreading owing to gravity, inerted the atmosphere and settled [8,19], so a low-temperature area concentrated at the lower place, showing the cooling effect was certain and local. Figure 2b shows the oxygen concentration distribution. The oxygen concentrations in the lower space decreased firstly, while the oxygen concentrations on a horizontal plane were basically the same. At 180 s, the oxygen concentrations in z < 1.0 m decreased dramatically and mostly less than 14%. Because of the gas diffusion, the oxygen concentrations became even in the confined space at 720 s. It took about 540 s for gases to mix evenly, showing that the nitrogen was easy to diffuse in the confined space.
According to the above result analysis, there were no significant differences both among the temperatures and among the oxygen concentrations in the same horizontal plane. However, changes of both the temperatures and oxygen concentrations in the vertical direction were significant. The measurement points #13, #14, and #15 were arranged vertically in a line. Thus, they were selected to study the effects of different mass fluxes, injection velocities, injection port heights, and inclination angles on the heat and mass transfer in the confined space.
Figure 3 shows the plot of heat transfer capacity versus the time with different mass fluxes. When the mass flux was 0.019 kg/s, the heat transfer capacity ascends in a curve with time less than 80 s. The increasing rate of the heat transfer capacity increased firstly, then decreased and finally remained unchanged. Because there was a temperature difference between LN2 and the low-temperature resistance steel pipe in the LN2 flowing process, LN2 absorbed the heat and vaporized. However, as the pipe temperature decreased, the vapor–liquid ratio of LN2 gradually reached a balance. The pipe inner surface temperature decreased to a certain degree after 80 s; the gas–liquid two-phase flow was in a saturated state. There was a clear linear relationship between the heat transfer capacity and time. It could be expressed as Equation (11),
where kc was the cooling rate of LN2 when the LN2 was in a saturated state. In addition, in terms of each mass flux, the changes in heat transfer capacity with increasing time (>130 s) followed a linear trend, showing the cooling rate could be obtained during the experiments. At the same time, the cooling rate was related to the injection condition. It represented the ability to cool down the confined space quickly. Thus, the cooling rate could be used to evaluate the cooling effect of LN2 with the combination of heat transfer.
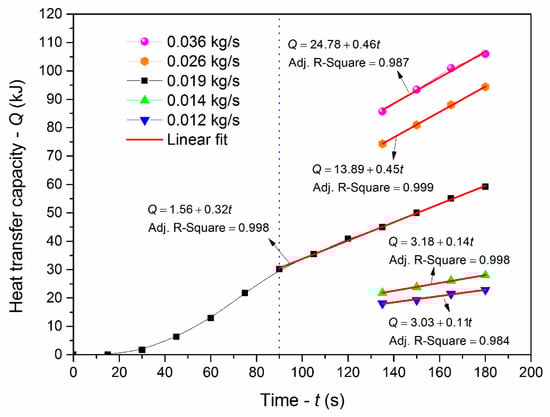
Figure 3.
Heat transfer capacity versus the time of LN2 injection with different mass fluxes.
In order to verify the sealing property of the experimental confined space, the variation of the average oxygen concentrations in the confined space with increasing time (≥1140 s) was analyzed. As shown in Figure 4, the average oxygen concentration increased slowly and linearly with time because the confined space was not completely closed. The variation rate of the average oxygen concentration was equal to the slope of a linear fitting, which was 2.91 × 10⁻⁴%/s and very small, indicating that the experimental confined space was of certain air tightness. It was feasible for revealing the cooling and inerting features of LN2 in confined spaces.
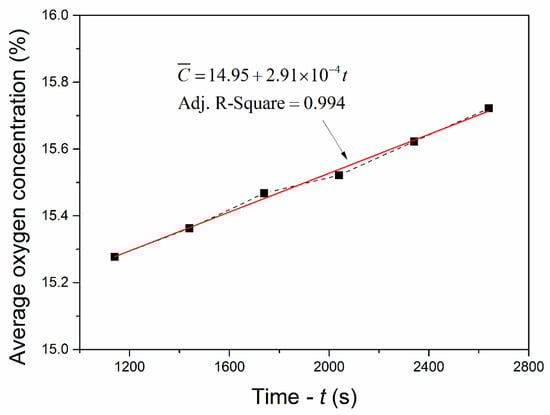
Figure 4.
Average oxygen concentrations in the confined space versus time (≥1140 s).
3.2. Effects of Mass Flux on the Cooling and Inerting Effects
In terms of the same injection duration of 180 s, the variations in the temperatures and oxygen concentrations at measuring points #13, #14, and #15 with increasing mass flux are shown in Figure 5. As shown in Figure 5a, the temperatures decreased with increasing mass flux. The maximum decrease was approximately 32 °C for #15, which was followed by approximately 13 °C for #14, and 2 °C for #13. The temperatures at #14 and #15 decreased quickly with a mass flux increasing from 0.014 to 0.026 kg/s. The temperatures at the three points decreased slowly with increasing mass flux above 0.026 kg/s. Figure 5b shows that the oxygen concentrations at the three points decreased, and began to level off with increasing mass flux above 0.026 kg/s. There was a significant decrease of approximately 6% both for #14 and for #15, while that for #13 was slight. The cooling and inerting effects at #15 became increasingly apparent with increasing mass flux, and the low-temperature low-oxygen space gradually expanded upward. For the same mass flux, the cooling effect weakened gradually with increasing height. Since the differences among the oxygen concentration at different heights in z < 1.0 m were very small, the inerting effect in the space was uniform.
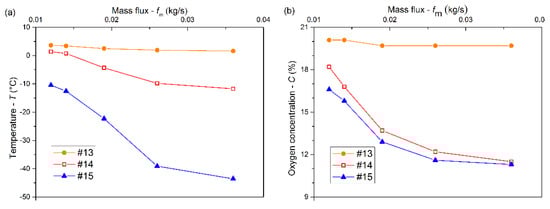
Figure 5.
Temperatures (a) and oxygen concentrations (b) at measuring points #13, #14, and #15 versus mass flux at 180 s.
Figure 6a shows the changes in the cooling rate and heat transfer capacity at 180 s with increasing mass flux. The heat transfer capacity increased gradually with a mass flux increasing from 0.014 to 0.026 kg/s and then began to flatten. The increasing rate of heat transfer capacity increased firstly when fm < 0.019 kg/s, and then decreased when fm ≥ 0.019 kg/s. In addition, the cooling rate had the same trend with increasing mass flux. The cooling rate began to flatten with mass flux above 0.026 kg/s. This was because that the cooling effect was certain and local (at the lower place). When fm < 0.019 kg/s, the mixed gas released heat easily, and the temperature decreased. When fm ≥ 0.019 kg/s, the temperature decreased to a specific value (approximately –40 °C), at which the mixed gas released heat with difficulty because of the low heat transfer efficiency. Figure 6b shows the changes in the inerting coefficient at 180 s with mass flux. The inerting coefficient gradually decreased in a concave curve. It illustrated that the inerting effect of LN2 was gradually enhanced with a mass flux increasing from 0.014 to 0.026 kg/s and then tended to level off, showing the decreasing enhancement extent.
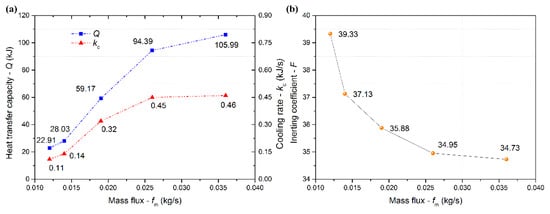
Figure 6.
Cooling rate and heat transfer capacity at 180 s (a), inerting coefficient at 180 s (b) versus mass flux.
3.3. Effects of Pipe Diameter on the Cooling and Inerting Effects
For the same injection duration of 180 s, the changes in the temperatures and oxygen concentrations at the measurement points #13, #14, and #15 with different pipe diameters are shown in Figure 7a,b, respectively. When Φ = 4 mm, the temperatures and oxygen concentrations at #13, #14, and #15 were basically the same. The injection quantity of LN2 decreased significantly in view of a small diameter. The LN2 vaporization produced large amounts of cryogenic nitrogen gas in the steel pipe. The gas pressure gradually increased as the diameter decreased, which hindered the LN2 injection to the confined space so that the cryogenic nitrogen gas was mainly injected with only a relatively small quantity of liquid nitrogen [23]. The temperature at #13 basically remained unchanged with a diameter increasing from 20 to 40 mm. This was because the low-temperature area concentrated at the lower place, and there was little influence on the top in terms of heat transfer due to the small heat transfer coefficient of gas. The initial kinetic energy of the LN2 decreased with increasing diameter, which weakened the gas mixture. Thus, the oxygen concentration at #13 increased. The temperature at #14 increased with a pipe diameter, increasing from 12 to 40 mm and the minimum was –0.2 °C, but the oxygen concentration decreased with a pipe diameter increasing from 4 to 20 mm and then slowly increased. The temperature at #15 decreased first with a pipe diameter increasing from 4 to 20 mm and then increased linearly. The oxygen concentration at #15 decreased with increasing pipe diameter. According to the above result, the cooling effect at the lower place in the confined space gradually decreased with a pipe diameter increasing from 20 to 40 mm. This could be because the increase of pipe diameter increased the contact area of LN2 with the steel pipe, increasing the amount of LN2 vaporization. In addition, the flow rate of cryogenic nitrogen gas decreased with diameter, and the mass transfer ability in the confined space weakened. Thus, the inerting effect at the lower place increased, while that at the upper place decreased.
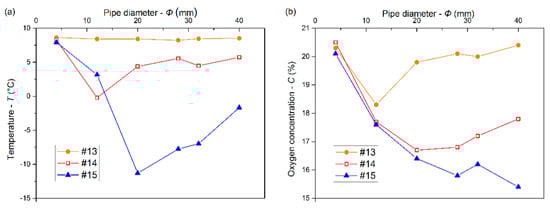
Figure 7.
Temperatures (a) and oxygen concentrations (b) at measuring points #13, #14, and #15 versus pipe diameter at 180 s.
When Φ = 4 mm, LN2 vapor impeded the continuous injection of LN2 due to the small limited diameter. Thus, the heat transfer capacity in the confined space was very small, and there was also no desirable inerting effect. The plots of the heat transfer capacity at 180 s, cooling rate, and inerting coefficient at 180 s versus pipe diameter increasing from 12 to 40 mm are shown in Figure 8. The heat transfer capacity linearly decreased with increasing pipe diameter. The cooling rate first decreased significantly with increasing pipe diameter, and then started to level off with a pipe diameter of 28 mm, so the cooling effect of LN2 was gradually weakened. It was because the path of LN2 flow was affected slightly by increasing pipe diameter more than 28 mm with a specific mass flux, resulting in the unchanged cooling effect. The inerting coefficient increased with increasing pipe diameter, illustrating that the inerting effect decreased. Hence, an appropriate diameter should be selected to improve the cooling and inerting effect in the process of LN2 injection. In this experiment, the cooling and inerting effects of LN2 was the best when Φ = 12 mm.
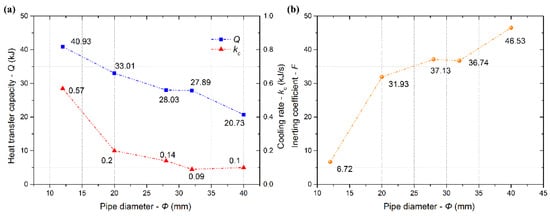
Figure 8.
Cooling rate and heat transfer capacity at 180 s (a), inerting coefficient at 180 s (b) versus pipe diameter.
3.4. Effects of Injection Angle on the Cooling and Inerting Effects
In terms of the same injection duration of 180 s, the variations in the temperatures and oxygen concentrations at the measurement points #13, #14, and #15 under different inclination angles are shown in Figure 9. As shown in Figure 9a, the temperatures at #14 and #15 decreased gradually with inclination angle ranging from –30° to +30°, while the temperature at #13 basically remained the same. It indicated that the cooling effect in the space of z ≤ 1.0 m was gradually enhanced by increasing inclination angle. As shown in Figure 9b, the oxygen concentrations at #13, #14, and #15 gradually converged with an inclination angle ranging from –30° to +30°. The mixed effect of the gases in the confined space was improved as the inclination angle increased.
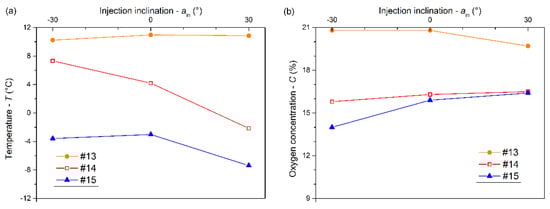
Figure 9.
Temperatures (a) and oxygen concentrations (b) at measuring points #13, #14, and #15 versus inclination angle at 180 s.
The plots of the cooling rate, heat transfer capacity at 180 s, and inerting coefficient at 180 s versus inclination angle are shown in Figure 10. As the inclination angle increased from –30° to +30°, the heat transfer capacity increased. The LN2 of a specific mass flux mainly flowed to the lower space with ain ≤ 0°, where the air molecule movement was slowed down. Thus, the cooling rate changed slightly when ain ≤ 0°, which was consistent with the inerting coefficient. Dramatically, the cooling rate increased quickly when ain > 0°. The inerting coefficient was basically unchanged when ain ≤ 0°. However, the inerting coefficient increased with the inclination angle when ain > 0°. It showed that the cooling and inerting effects of LN2 in confined spaces could be enhanced with the positive direction increase of inclination angle, because both the contact time and the contact area between LN2 and the air increased.
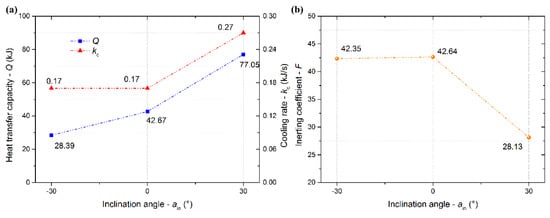
Figure 10.
Cooling rate and heat transfer capacity at 180 s (a), inerting coefficient at 180 s (b) versus inclination angle.
4. Conclusions
In this work, the spatial distributions of both the temperatures and oxygen concentrations in the space were obtained to reveal the heat and mass transfer of LN2 under different mass fluxes, pipe diameters, and inclination angles. Additionally, a mathematical model of quantitatively evaluating the cooling and inerting effects of LN2 was proposed based on the cooling indexes (heat transfer capacity and cooling rate) and the inerting index (inerting coefficient). The results proved that the model could accurately reveal the cooling and inerting phenomenon, and it could be used for the quantitative analysis of the relationships between the injection parameters and the cooling and inerting effects of LN2 in a confined space. These studies were feasible and meaningful for getting an optimal mass flux, a pipe diameter, and an inclination angle in the site implementation to improve the cooling and inerting effects of LN2 for firefighting. The following understandings and conclusions can be drawn:
- The low-temperature area mainly was located in the lower place owing to gravity. There was a linear relationship between the heat transfer capacity and time when LN2 reached a vaporization balance in the low-temperature resistance steel pipe. After LN2 injection, the cooling effect was only limited in the lower part of the confined space. However, there were no significant differences both among the temperatures and among the oxygen concentrations in the same horizontal plane.
- The low-temperature low-oxygen space gradually expanded upward with increasing mass flux. The increasing pipe diameter (>20 mm) went against the heat and mass transfer of LN2 in the confined space. Both the contact time and the contact area between LN2 and the air could increase with a positively increasing inclination angle, which strengthened the cooling and inerting.
- The inerting effect of LN2 was gradually enhanced with a mass flux increasing from 0.014 to 0.026 kg/s and then tended to level off. An appropriate pipe diameter should be selected to improve the cooling and inerting effects of LN2, the optimal one being 12 mm in this experiment. Otherwise, a positively increasing inclination angle could contribute to the cooling and inerting effects of LN2 injected into the confined space. However, there was little effect on the cooling and inerting when the inclination angle was below 0°.
Author Contributions
Conceptualization, H.S.; Data curation, H.J.; Formal analysis, H.J. and X.W.; Funding acquisition, H.J.; Investigation, Y.L.; Methodology, H.S.; Project administration, W.C.; Resources, W.C.; Software, H.J.; Supervision, H.S. and X.W.; Validation, Y.L. and W.C.; Visualization, X.W.; Writing—original draft, H.J.; Writing—review & editing, H.S.
Funding
This research was funded by the National Key Research and Development Program of China grant number [2018YFC0808100], the National Natural Science Foundation of China grant number [51604247], and the Fundamental Research Funds for the Central Universities grant number [2652017072]. And the APC was funded by the National Key Research and Development Program of China grant number [2018YFC0808100].
Acknowledgments
This study is supported by the National Key Research and Development Program of China [2018YFC0808100], the National Natural Science Foundation of China [51604247], and Fundamental Research Funds for the Central Universities [2652017072]. The authors wish to express gratitude to Prof. Bobo Shi (China University of Mining and Technology) for his critical review of this paper.
Conflicts of Interest
The authors declare no conflict of interest.
References
- Gage, A.A.; Baust, J. Mechanisms of Tissue Injury in Cryosurgery. Cryobiology 1998, 37, 171–186. [Google Scholar] [CrossRef]
- Knowlen, C.; Mattick, A.T.; Bruckner, A.P.; Hertzberg, A. High Efficiency Energy Conversion Systems for Liquid Nitrogen Automobiles. SAE Trans. 1998, 107, 1837–1842. [Google Scholar]
- Proux, O.; Nassif, V.; Prat, A.; Ulrich, O.; Lahera, E.; Biquard, X.; Menthonnex, J.J.; Hazemann, J.L. Feedback system of a liquid-nitrogen-cooled double-crystal monochromator: Design and performances. J. Synchrotron Radiat. 2010, 13, 59–68. [Google Scholar] [CrossRef]
- Ren, H. Femtosecond laser induced formation of nanostructures on silicon and silver surfaces in liquid nitrogen. Diss. Theses-Gradworks 2015. Available online: https://search.proquest.com/openview/16ae0ef5d4f7b71f02d4989dc63078b9/1?pq-origsite=gscholar&cbl=18750&diss=y (accessed on 17 April 2019).
- Beidelman, J.A. Liquid Nitrogen Fire Extinguishing System Test Report; NASA Sti/recon Technical Report N; Argonne National Lab.: Lemont, IL, USA, 1972; Volume 77. [Google Scholar]
- Klueg, E.P. Liquid nitrogen as a powerplant fire extinguishant. Fire Technol. 1969, 5, 197–202. [Google Scholar] [CrossRef]
- Torikai, H.; Ishidoya, M.; Ito, A. Examination of Extinguishment Method with Liquid Nitrogen Packed in a Spherical Ice Capsule. Fire Technol. 2016, 52, 1179–1192. [Google Scholar] [CrossRef]
- Levendis, Y.; Ergut, A.; Delichatsios, M. Cryogenic extinguishment of liquid pool fires. Process Saf. Progr. 2010, 29, 79–86. [Google Scholar] [CrossRef]
- An, D.; Sunderland, P.B.; Lathrop, D.P. Suppression of sodium fires with liquid nitrogen. Fire Saf. J. 2013, 58, 204–207. [Google Scholar] [CrossRef]
- Levendis, Y.A.; Delichatsios, M.A. Pool fire extinction by remotely controlled application of liquid nitrogen. Process Saf. Prog. 2011, 30, 164–167. [Google Scholar] [CrossRef]
- Mcguire, J. Fighting building fires with liquid nitrogen: A literature survey. Fire Saf. J. 1981, 4, 15–19. [Google Scholar] [CrossRef]
- Shi, B.; Zhou, F. Fire extinguishment behaviors of liquid fuel using liquid nitrogen jet. Process Saf. Prog. 2016, 35, 407–413. [Google Scholar] [CrossRef]
- Tang, Y. Experimental investigation of applying MgCl2 and phosphates to synergistically inhibit the spontaneous combustion of coal. J. Energy Inst. 2018, 91, 639–645. [Google Scholar] [CrossRef]
- Tang, Y.; Wang, H. Experimental investigation on microstructure evolution and spontaneous combustion properties of secondary oxidation of lignite. Process Saf. Environ. Prot. 2019, 124, 143–150. [Google Scholar] [CrossRef]
- Kim, A.G. Cryogenic injection to control a coal waste bank fire. Int. J. Coal Geol. 2004, 59, 63–73. [Google Scholar] [CrossRef]
- Mohalik, N.K.; Singh, R.V.K.; Pandey, J.; Singh, V.K. Application of nitrogen as preventive and controlling subsurface fire—Indian context. J. Sci. Ind. Res. 2005, 64, 273–280. [Google Scholar]
- Shi, B.; Ma, L.; Dong, W.; Zhou, F. Application of a Novel Liquid Nitrogen Control Technique for Heat Stress and Fire Prevention in Underground Mines. J. Occup. Environ. Hyg. 2015, 12, D168–D177. [Google Scholar] [CrossRef] [PubMed]
- Zhou, F.B.; Shi, B.B.; Cheng, J.W.; Ma, L.J. A New Approach to Control a Serious Mine Fire with Using Liquid Nitrogen as Extinguishing Media. Fire Technol. 2015, 51, 325–334. [Google Scholar]
- Shi, B.; Zhou, F. Impact of heat and mass transfer during the transport of nitrogen in coal porous media on coal mine fires. Sci. World J. 2014, 2014, 4198–4205. [Google Scholar] [CrossRef]
- Qi, S.L.; Zhang, P.; Wang, R.Z.; Xu, L.X. Flow boiling of liquid nitrogen in micro-tubes: Part II -Heat transfer characteristics and critical heat flux. Int. J. Heat Mass Transf. 2007, 50, 5017–5030. [Google Scholar] [CrossRef]
- Reid, R.C.; Brian, P.L.T.; Weber, M.E. Heat transfer and frost formation inside a liquid nitrogen-cooled tube. Aiche J. 1966, 12, 1190–1195. [Google Scholar] [CrossRef]
- Shaeffer, R.; Hong, H.; Chung, J.N. An experimental study on liquid nitrogen pipe chilldown and heat transfer with pulse flows. Int. J. Heat Mass Transf. 2013, 67, 955–966. [Google Scholar] [CrossRef]
- Wang, S.M.; Wen, J.; Li, Y.M.; Wang, S.H.; Li, Y.Z. Population balance modelling for subcooled boiling flow of liquid nitrogen in a vertical tube. Int. J. Heat Mass Transf. 2013, 60, 632–645. [Google Scholar] [CrossRef]
© 2019 by the authors. Licensee MDPI, Basel, Switzerland. This article is an open access article distributed under the terms and conditions of the Creative Commons Attribution (CC BY) license (http://creativecommons.org/licenses/by/4.0/).