Abstract
Information spreading processes are the key drivers of marketing campaigns. Activity on social media delivers more detailed information compared to viral marketing in traditional media. Monitoring the performance of outdoor campaigns that are carried out using this transportation system is even more complicated because of the lack of data. The approach that is presented in this paper is based on cellular automata and enables the modelling of the information-spreading processes that are initiated by transit advertising within an urban space. The evaluation of classical and graph cellular automata models and a coverage analysis of transit advertising based on tram lines were performed. The results demonstrated how the number of lines affects the performance in terms of coverage within an urban space and the differences between the proposed models. While research is based on an exemplary dataset taken from Szczecin (Poland), the presented framework can be used together with data from the public transport system for modelling advertising resources usage and coverage within the urban space.
1. Introduction
While spending on traditional media has decreased due to lower advertising budgets, outdoor advertising is the only type of traditional marketing with an observed growth (2.7%) in 2017 [1]. Globally, outdoor advertising spending was estimated at US $31 billion dollars in 2016 [2]. US $6.99 billion was spent on outdoor advertising in 2007, with a 6.1% growth compared to a decade earlier [3]. In China and Japan, an increase of 14% was observed, along with a similar trend in Europe, with increases of more than 10% in France and Greece and a similar pattern in Russia [4]. Outdoor media transit advertising can be considered an underutilized medium. It can be a good alternative to typical billboard-based outdoor advertising as a solution to the cluttered urban advertising space. Transit advertising is based on various techniques and methods of marketing content transmission. Advertisements can be shown on the exteriors and interiors of taxis, buses, and trains as fully branded vehicles, in the form of transit shows, interchange promotions, sample distribution and ‘transit TV’ [5,6]. Electronic signs that are placed in transit stations can be used [7]. Gray [5] emphasizes the ability to target captive audiences and that cost-effective transit advertising holds people’s attention for longer during a journey without a cluttered advertising environment.
Research studies pay very little attention to this area, and taxi advertising has been discussed mainly [4]. Transit media have an increased role in financing public transport [8]. Marketing content that is exposed using transit media is affecting outdoor audiences and has an impact on consumer behaviour. Since customer activity is not registered in electronic systems, the direct influence of visual content in an urban space is difficult to measure. In this paper, we attempt to model the influence of transit advertising on information the spreading processes in an urban space. The main goal of the current study was to model the process of information spreading initiated by transit advertising for the estimation of audiences. Audience measurements for external advertisements that are located on public transport in the form of branded vehicles have not yet been discussed in the literature and the presented study opens several directions for further development. The proposed approach has managerial implications and can help to make the urban advertising space more sustainable and better managed to avoid advertising clutter and habituation effects among target customers. The proposed approach was verified with the use of an example dataset but can be used as a basis for further expansion with the use of more detailed datasets from public transport. The remainder of this paper is organised as follows: Section 2 discusses related work. Section 3 is focused on the assumptions of the proposed approach and the use of cellular automata (a computational model that comprises a grid of cells, in which time and space are discrete). Experimental results are presented in Section 4, followed by the conclusions in Section 5.
2. Related Work
2.1. Transit Media as a Form of Outdoor Advertising
In recent years, marketing has undergone a transformation from one-to-many models within traditional media towards digital media and one-to-one communication [9]. Various forms of marketing are discussed, from traditional media, such as television, print media, and radio, to interactive media, with a current focus on social media and online marketing [10]. New forms of digital marketing provide the ability to precisely track the performance of a campaign, select target groups, and develop one-to-one communication with personalization to better fit customer needs [11].
As the main marketing channels, other forms of marketing exist in the form of out-of-home marketing. Roux et al. [12] identify four main techniques for out-of-home advertising (OOH): outdoor advertising, various forms of transit media advertising, street- and retail-furniture advertising, and digital and ambient media channels.
They are integrated with day-to-day customer activities within urban spaces with marketing messages on billboards and transit media. The slow transformation of old forms of marketing is observed with the use of new technologies [13]. Electronic profiling increased the personalization ability within urban spaces. It enables the recognition of the recipient via face recognition technologies and matching advertising content [14]. Innovative digital signage technologies provide displays with such features as transparency and flexibility, which can revolutionize their use in space [15].
Roux [16] observed that despite the many possible forms and techniques, out-of-home advertising has not received much attention in the literature. Earlier studies that were related to out-of-home advertising focused mainly on the performance of traditional billboards [17,18,19]. Osborne and Coleman [20] compared traditional billboards and billboards that are based on new technologies and digital screens in terms of effectiveness. Taylor et al. [21] proposed the use of selective-perception theory and retail-gravity models for billboard effectiveness analysis. Because of the large number of advertising messages, the selective perception mechanism helps customers to reduce the number of messages processed and, as a result, most of them are ignored. Gravity theory shows the relationship between the response to urban advertisements and the store’s location with observed dropping performance together with the increased distance.
Wilson and Till [22] analysed the role of billboard localization. When new technologies are used within urban spaces, audiences of transit media are more difficult to track because of movement and it is difficult to predict audiences and the overall performance. A study that focused on the effectiveness of taxi advertising demonstrated the potential of this form of marketing [4]. The use of attention-seeking content can differ from that of worn-out typical outdoor marketing content. Transit advertisements cannot be easily ignored and can attract more attention due to less competing content and the lack of a marketing clutter effect. Vehicle branding can be used to target public transport passengers, car drivers and pedestrians [5]. Transit advertising is discussed as a form of out-of-home advertising [7]. Jurca [23] categorizes transit advertising among unconventional forms of marketing in terms of its ability to communicate with customers who are immune to more conventional strategies. Koblinski [24] discusses several advantages of transit advertising inside and outside of vehicles, such as exclusivity in space, varied audience and flexibility of size and location. Interior transit advertising is focused on commuters inside the buses and other vehicles, while exterior transit advertising is aimed at pedestrians and people inside cars [7]. Exterior advertisements can be localized on the side, front or rear of vehicles. Interior advertisements expose content to a captive audience for a longer period of time.
Transit advertising media have been analysed for taxi advertising [4], marketing in subway train stations [25] and airport advertising [22]. A recent study explored the effectiveness of car advertising [16]. The results showed a positive recall and attitude towards car advertising for Generation Y. The level of acceptance was higher than anticipated. Transit advertising can be based on moving transit media and static or stationary advertising [12]. Integration of transit advertising is possible with other forms of advertising for better performance monitoring [5]. One possibility is screens with GPS and the ability to update content at various locations [26].
According to research, estimation methods that are used for other media do not perform well for outdoor advertising [20]. It is difficult to plan and launch experiments [27]. Although very limited effort has been expended on quantitative research of transit advertising and its effectiveness, many research questions arise: What is the coverage? How can outdoor advertising space usage be optimized? How can advertising spaces in public transport be utilized to effectively reach customers at minimal cost?
2.2. Information Spreading in Offline and Online Environments
Earlier research showed that outdoor advertising generates a word-of-mouth effect and launches a viral effect [28]. Interesting questions have been posed regarding the role of transit media advertising on word-of-mouth marketing. While many efforts have been made to better understand the information spreading processes within offline and online environments, the effect of transit media has not been explored. Gambetti [29] demonstrates the potential of out-of-home communication tools and their role in viral marketing activities. While billboard and transit advertising catches the attention of drivers, passengers and pedestrians, King and Tinkham [28] emphasized the word-of-mouth effect that is related to billboards and outdoor advertisements. Research that was conducted by Keller and Berry [30] showed that 90% of information spreading via word-of-mouth mechanics takes place offline, which was later confirmed by Reference [31].
Early-stage research on personal influence as a background factor in word-of-mouth communication and the spreading of information about products and services was initiated by Katz and Lazarsfeld [32]. It was explored in various studies, which mainly focus on offline dyadic interactions and social influence [33,34,35].
Currently, much more focus is placed on online communication and word-of-mouth communication within online environments [36]. Social networking platforms have begun to attract increasing attention in this field [37]. Online social networks are used for viral marketing and the dissemination of marketing content. Properly designed campaigns can produce better results than traditional marketing [38]. The initial research was related to the use of epidemiological models to predict and understand phenomena in complex networks and graph structures [39]. Other modelling techniques come from the field of diffusion of innovation, such as the linear threshold (LT), and are focused on social networks such as the independent cascades model (IC), which was proposed by Kempe et al. [40]. There are mathematical models for information spreading that are based on experimental [41], deterministic [42] and probabilistic approaches [43]. While it was not possible to acquire deterministic data about the analysed behaviour, the probabilistic approach was used to analyze a bigger experimental space. Methods that are based on cellular automata have been considered [44,45].
The implementation of information dissemination processes is associated with many factors, including network structures and social relations [46]. Recent research is shifting from static networks towards dynamic networks and the effects of network changes on the information dissemination process [47]. Other approaches are based on multilayer networks [48]. While early solutions were based on the initial characteristics of the network and used at all stages of the process, new adaptive approaches were recently introduced with emerging strategies that take into account network changes and process parameters [49].
Many studies and areas that are related to the information spreading processes did not consider models of information spreading within the urban space with transit media. In the current research, a model is constructed with the main objective of examining the mechanics of information spreading via the use of transit media and external advertising content. The next subsections present the methodological background on the use of cellular automata and their extension to graph form.
2.3. Information-Spreading Modelling with Cellular Automata and Graph-Based Cellular Automata
To the development of scientific applications of cellular automata (CA), many authors have contributed, such as Toffoli [50] and Toffoli and Margolus [51], who proposed the use of CA in research on dynamic models, replacing them with models that are based on differential equations. In the following years, CA was used with increasing success to simulate the complicated phenomena of propagation, biological reproduction and spatial processes. The importance of CA was revealed in works that were devoted to urban sprawl modelling [52,53,54,55,56] and land use changes [57]. As part of their research on the development of cities, Lo and Yang developed a CA model that is based on processes in Reference [58] and other authors subsequently extended it to stochastic methods [59]. Li and Yeh [60] have combined CA with neural networks and spatial systems to create a method for simulating evolution.
Analysing the diffusion aspect, CA models have been used to simulate many real-life problems, e.g., disaster spread predictions [61], fire spread predictions [62,63,64], oil spill accidents [65,66], disease propagation [67,68,69], virus dynamics [70], and information diffusion on social networks, which is one of the most significant challenges in viral marketing [71].
Hu et al. [72] have proposed a model that is based on CA and the HIR model for simulating viral propagation of phone messages. The experimental results demonstrate that the model more realistically reflects the spreading characteristics of a virus in a real network compared to the same virus propagation model in mobile phone messages in the simulation results.
Schmit et al. [73] presented an information spreading model that influences the decisions of individuals on whether to buy a product. The model of the consumer market is based on probabilistic CA and ordinary differential equations. A presented approach helps the teacher create various scenarios and provide feedback to the student at simulation runtime. The authors demonstrate the applicability of the proposed model to real-life problems.
Graph-based CA is a class of generalized CA in which the inter-cell connections define a graph of bounded degree [74]. Marr and Hütt [75] evaluated the impact of variations in topology on the dynamic behaviour of the system with local updates of the rules. One-dimensional binary CA were implemented on graphs with various topologies via the formulation of two sets of degree-dependant rules, each of which contains one parameter. The authors observed that the graph topology changes cause transitions between various dynamic domains without a formal change in the update rule. The article discusses implications in the context of information transmission in complex network systems. As presented in Reference [76], CA on graphs are a parameter-efficient framework for exploring the relationship between network architecture and dynamics from the perspective of pattern formation. Theories of spatiotemporal pattern formation have contributed fundamentally to a deep understanding of natural processes.
In Reference [77], O’Sullivan presented a new type of dynamic spatial model. The author showed that a graph-CA with specified structural properties that are defined by the relationships between the subsets of cells is a very useful generalisation of the classical CA. Moreover, O’Sullivan argues that deriving a graph-CA both from a graph and formalism of a CA enables the simultaneous application of well-developed methods of describing the model structure and the process dynamics.
For modelling information spreading on the basis of graph-CA, the diffusion model in social networks was developed [78]. The results of examinations have demonstrated that the described system can be useful in predicting the behaviour of users of social networking sites. The results demonstrated the potential of the developed simulation environment and that the effects may be observed in real systems. Graph-CA have been also used to predict the behaviour of Internet shop customers [79].
2.4. The Motivation for the Presented Study
Information spreading is a phenomenon that is associated with acquiring, processing and re-sending information in a network of contacts. This phenomenon is often considered in the context of online social networks and ads that reach users. Users’ opinions about an advertisement or product are useful for companies, which sometimes devote time and money to collect them for making future strategic decisions [73]. The consumer receives various information about a product, formulates his opinion, and begins to disseminate this information under the influence of social contacts. After some time, he stops disseminating his opinion if he does not receive more information or advertisements about the product [80]. This approach is in line with the Susceptible/Infected/Recovered (SIR) model [81,82]. The problem of information spreading by transit advertising presented in this article has hallmarks that result from the SIR model. People walking on the streets and waiting at stops may be susceptible to receiving information (Susceptible) and start to spread it (Infected). After their relatives know the information or the person is no longer interested in this information or product, it stops being spread (Recovered). Additionally, in the presented problem, a common context with Viral Marketing (VM) is identified, which is the domain of social networks [83]. Aldrees and Ykhlef observed that the customers who are responsible for information spreading are important and must be selected well [84]. The authors introduced models of seeding and diffusion in social networks and demonstrated the application of these models in VM. In information spreading by transit advertising, the main problem is to choose the route that is covered by the vehicle and, thus, the possible range over which advertisements are placed. Hence, the choice of the route of a vehicle with advertising can affect its effectiveness. Proper estimation of the effectiveness of advertising that is placed on vehicles that are running on a given line should be investigated.
CA are an effective tool for modelling and simulating phenomena from various areas of life. Many attempts have been made to connect graph theory with CA theory. The usefulness of such a concept has been proved for many applications. However, no such studies have been conducted in the field of information spreading, especially in urban spaces.
According to the literature review, advertisement on public transport vehicles has not been investigated in terms of information spreading. As the methodological background, we assume that cellular automata are used. They are an effective tool for modelling and simulating phenomena from various areas and adequate for the problem of spreading information in an urban space. The usefulness of the CA concept has been proven for many applications. However, no such studies have been conducted in the field of information spreading in urban spaces. In the next sections, the concept of measuring the effects of transit advertising on information propagation within an urban space is presented with the aim of measuring the effectiveness of an advertising medium, which seemed immeasurable until now.
3. Proposed Approach
The CA concept is connected to attempts that were made by scientists to represent seemingly complicated processes as a series of simple local decisions [85]. Implementation of this requires the representation of the analysed space as a homogeneous network of cells. The decision at the cell level is made using the transition rule (a function that changes the state of the CA), which depends on the analysed cell and the type of neighbourhood. Well-known definitions include the classical neighbourhood of von Neumann and the neighbourhood of Moore, which include some or all of the cells that are adjacent to the specified cell. Another type of neighbourhood was proposed by Hoffmann et al. [86], where the cell state consists of a data field and additional indicators. With the help of these indicators, each cell has read access to any other cell in the cell field and the indicators can be changed from generation to generation, which causes the neighbourhood to be dynamic and differ from cell to cell. The neighbourhood problem becomes more complex in irregular spaces due to issues that are related to land use changes and the adaptation of urban spaces for other purposes [87,88,89,90,91]. Each cell selects one state from a finite set of states. Networks are most commonly one- or two-dimensional. However, any finite size is possible. In the CA model, time is discreet. Adjacent cells are connected to a specified cell and do not change [92]. Due to the iterative use of rules, the CA process reflects the description of the behaviour of the global system [93]. The CA system is considered a reliable computational system [94].
In a presented approach focused on information spreading in urban space modelling, the CA cell represents a single fragment of an element of the environment, such as land, urban barriers, people, or public transport vehicles. Based on the interactions between distinguished elements like marketing content integrated with vehicles and pedestrians together with their relations with the environment, we can simulate these interactions by being susceptible to external stimuli or influencing the environment.
In this article, the CA-based approach was developed with the aim of transferring information in the immediate neighbourhood and providing the information to the environment away from the initiating location. For the first aim, a classic approach that is based on Moore’s neighbourhood (Figure 1) is used in which the spread of information can take place in each direction and information can be propagated to the nearest of eight cells that are adjacent to the initiating cell with each cell representing an element of urban space.
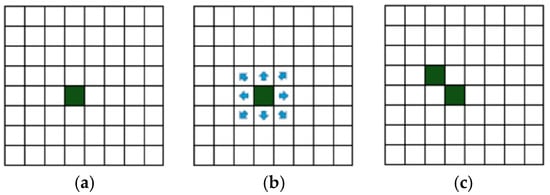
Figure 1.
Moore’s neighbourhood. (a) the initiating cell; (b) the possible directions of signal propagation; and (c) an example of signal propagation in the next iteration.
The second aim is related to the transfer of information to the more distant environment, and the approach is based on graph-CA, which uses the model of spreading information relative to the relation-based neighbourhood (Figure 2), i.e., a logically dependent neighbourhood, for example, the distance within social networks. In this case, information is disseminated by transferring it to a logically neighbouring cell, which does not have to be adjacent in the physical context. This corresponds to the real situation in which a person transfers information from one place to another by moving and/or transmitting information through an additional medium (e.g., an entry on a social network or publication of a picture that was recently taken). People who receive such a signal may be in another part of the city (or even the world) and, therefore, are not dependent on physical proximity (immediate proximity) to the initiator (in this case, a CA cell). A person who receives the signal (information) can further distribute it and share the information with people in the vicinity (move to neighbouring cells). This person may forget about the received information if he is not interested in this information or there is no reminder about this information, which will be described in more detail later in this article.
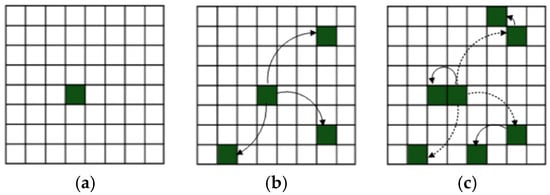
Figure 2.
Relation-based neighbourhood for graph-cellular automata (CA). (a) the initiating cell, (b) signal propagation in the first iteration, and (c) signal propagation in the next iteration.
The proposed approach uses classic CA and graph-based CA for modelling the spreading process. Used classic CA take form of:
which is described by Reference [95] as follows:
- automaton state , which depends on sets of states of individual cells;
- cell grid in (dimensional space ();
- rule defining the state of cell at time , which depends on the state of this cell and its neighbourhood at time . If is dependent on a random variable, then it is a probabilistic CA.
Automaton state S represents information in each cell within defined grid d based on urban space maps. States are based on information acquired from transit media or as a result of contact with information spreaders. States of cells are based on rules FCA defining changing states of cells as a result of information spreading with given probabilities. Classical CA used assumes information transfer only from direct neighbours as a result of physical contacts.
While in real systems information spreading can be based on non-physical contact with the use of electronic systems, we used graph based CA with structurally dynamic relative neighbourhood graph-based CA (rGCA) as:
where:
- dimension in a (dimensional space ()) that represents a cell grid;
- : activity state of an automaton, which depends on the set of activity states of individual cells;
- : state of the automaton, which depends on the set of states of individual cells;
- : directed weighted graph , which is defined by a set of nodes (hereinafter, vertices) , set of edges , set of weights and edge weight function . Function (the weight function) defines the weights of the edges of graph :where or, more generally, . Weights are values that indicate the significance of the connections between the vertices. In systems where there are many vertices that are connected to each other, not all connections have the same priority. For example, in the real world, crossing the road from one city to another may require a specific amount of time or energy; in the virtual world (in social networks), a user has various “friends” but does not have the same relationship with each of them.
- is a function that defines the state of automaton cell at time and depends on the state of this cell and its neighbourhood at time ;
- is a global rule that defines the conditions of activation or deactivation of CA cells and the rules of graph reconfiguration (defines sets of added and removed vertices and edges of graph by ), and depends on the automaton state (which represents the states of all cells); and
- is a function that reconfigures the graph and activates/deactivates cells based on conditions that are set by .
The automaton rGCA is defined by a directed weighted graph (which was discussed above) and automaton state (at time ), which means that each graph vertex corresponds to one automaton cell. A cell neighbourhood of this CA is defined by the graph edges that belong to the vertex set , which means that for every neighbourhood exists, which is described by the in-edges and out-edges of this vertex:
The sets of weights of in-edges and out-edges of a graph for neighbourhoods are sets of edge weights and that belong to a set of weights such that the edge that they describe belongs to the set of edges of the graph . They can be defined as
A neighbourhood can be defined by a neighbourhood matrix and the weights of the directed edges can be written as a weight matrix. Matrices are structures that can be easily manipulated in a computer program and can store information. If the graph has n vertices, the neighbourhood matrix of size n × n is built as follows:
where for and for .
For this graph, the weighted neighbourhood matrix of size includes the weight coefficients of the individual edges of the directed graph:
where for and for , .
The local rule depends on the state of cell which is described by the graph and the neighbouring cell states that affect it are described by neighbourhood the influence of a neighbourhood is expressed by weight of the edge in the graph that describes each neighbourhood within .
Therefore, generally:
In contrast to the classic, homogeneous CA with a regular neighbourhood, in the presented approach, we deal with two types of neighbourhoods:
- physical: corresponding to the neighbourhood of the CA cells in the d-dimensional space within urban space, and
- logical: a set of relational neighbourhoods within social networks that are described by a -graph (which is reconfigurable in time), which enables the modelling of a system with a variable number of objects in time.
Due to the relation-based neighbourhood, the graph’s weights do not represent the distance between the cells; instead, they correspond to the relations between the cell-related objects of the modelled system. In particular, such a relationship may be:
- any relation between the objects represented by the vertices of the graph (e.g., the relationship between people in an urban space or the relationship between people who are registered on the social network); or
- the distance between objects represented by the vertices of the graph.
In the discussed approach, this dependence is a relationship between members of a community (e.g., family, friends). The information is spread to another person in the community, regardless of the place where the person is currently staying, for example, by phone or via an entry on their profile. The latter case especially can cause the additional spread of information because more than one person can read the statement about noticing a specific advertisement. As a consequence, the information spreads not only in the surroundings of the public transport vehicle with the displayed advertisement but also in other areas of this space.
A person who has seen the advertisement can stop at some point in the urban space, which is connected with stopping the spread of the information that he has. The probability of stopping each cell (connected to a person) is drawn from the range from 0 to 1 (in real conditions, who stops and when are unpredictable values). The person can also forget about the advertisement; in this case, he moves on, but he does not spread the information anymore because he cannot remember it. The forgetting curve of Ebbinghaus [96], which describes the decline in the brain’s ability to retain information over time, has been used:
where denotes the retention of memory; the relative strength of memory; and , time.
If during a further movement, a person encounters a public transport vehicle with the same advertisement, then he/she remembers this advertisement and re-spreads the information. The probability of seeing an advertisement () depends on the distance of a person to a public transport vehicle with an advertisement and is determined according to the exemplary rules, which are as follows:
- if the person is up to 20 m from the vehicle with the advertisement, then ;
- if the distance is between 21 and 30 m, then ;
- if the distance is between 31 and 40 m, then ;
- if the distance is between 41 and 50 m, then ;
- if the distance is between 51 and 60 m, then ;
- if the distance is between 61 and 80 m, then ;
- if the distance exceeds 80 m, .
It should be noted that the developed model and system take into account the process of recalling the advertisement and forgetting the advertisement. The given values only symbolize these facts. However, for the actual inclusion of this process, the necessary field research should be done in order to obtain real data.
In contrast with homogeneous (classic) CA, we have the rule, which refers to the cell structure configuration and the corresponding neighbourhoods. The initial configuration of the cellular cell structure may change over time by
- activating inactive cells of the CA (which corresponds to the addition of related vertices to the graph);
- deactivating cells of the CA (which corresponds to the removal of the corresponding vertices in the graph and the edges that are associated with them); and
- adding or removing edges in a graph, which results in the establishment or breaking of a neighbourhood relationship.
Let us consider from Equation (2) for the case of information spreading. Essentially, this is a general rule that defines the conditions for activating or deactivating cells of CA and the principles of graph reconfiguration (it specifies which sets are added and deleted by the vertices and the edges of the graph ). In the analyzed case, they can be understood as a set of possible modifications of the scenario in an urban space, which changes over time. Vehicles with advertising are move along the way while being noticed or not noticed by walking people who, in turn, are approaching and/or moving away from public transport vehicles and remembering what they have seen to various degrees. In addition, the initiated information may or may not be received by the user. In this way, every move generates the need for changes to the structure of the graph that describes the area in subsequent iterations. The list of modifications to graph elements that are specified by is processed by function .
Thus, function can be understood as all possible modifications of the graph. In complex systems (e.g., social networks and information spreading), the structure of the graph that describes the system is constantly changing; hence, it is necessary to perform operations that are related to removing graph edges, deleting graph vertices, and adding edges and vertices to the graph [97].
A change in the global graph configuration can be defined by a function of global graph reconfiguration:
which is defined as a combination of a few functions that are dependent on one another:
Thus,
where is a set of vertices that are deleted from graph , is a set of vertices that are added to graph , and and are sets of edges that are deleted and added, respectively, to graph . If then . If for each and , equation is satisfied, then the graph is not reconfigurable over time.
When the configuration of the graph changes, a new graph is created, which may differ from the previous one in terms of the number of vertices, edges, or weights. This type of reconfiguration of the graph constitutes the basis for the neighbourhood in the following new graph-CA. The model that is presented above is unique due to the use of relation-based neighbourhoods for the first time in the process of modelling information spreading in an urban space.
To implement the above-described theoretical aspects, a conceptual framework was developed (Figure 3). The framework is multi-layered and universal, which makes it possible to apply the presented approach to any analysed urban area such as a city or an urban agglomeration. The first designed layer is the data acquisition layer, whose tasks are to collect data on the movement of public transport vehicles, collect quantitative measurements of the analysed urban space and prepare data storage structures. The task of the second layer is to prepare mechanisms that enable the modification and supplementing of the data that are provided by the first layer. The quantitative data are edited, for example, the number of people who are getting on and off at individual stops and other values that are needed for modelling and were not automatically obtained by the first layer. The tasks of the third layer are to model the spread of information in the urban space based on the available methodology and to present the results.
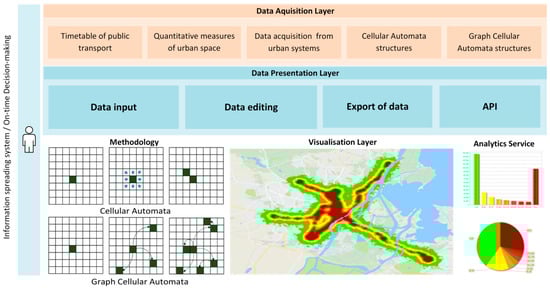
Figure 3.
The integration of used methods within the information system.
To evaluate the methodical concept, the information system “Information Spreading in Urban Space” was implemented. The developed system implements both methodological concepts (space analysis based on classic CA and graph-CA). The system allows the process of information spreading to be simulated in two ways: with the help of public transport vehicles and further propagation of information through people who have noticed the advertisement. The first method, namely, the simulation of the movement of a public transport vehicle, is based on data that were collected from the timetable (taken from the public transport authority of Szczecin city) and the actual coordinates, which are obtained from the Google Maps API. Then, the coordinates are converted to the indication for specific CA cells. The vehicle moves on individual cells while aiming at the target cell. The second way to spread the information is to simulate the movement of people who have seen the advertisement. Each person moves during every period of time, depending on the degree of map approximation. When determining the time for moving people, the average human walking speed, which is 1.34 m/s [98], was taken into account. For each moving person, the direction of his/her journey is drawn, which is consistent with the Moore neighbourhood that was discussed earlier. In the later stage of the system’s operation, the assumptions that were discussed earlier are taken into account, namely, the probability of noticing an advertisement from a distance and the forgetting curve of Ebbinghaus. The system outputs thermal maps that depict the places where information has arrived and graphs that present numerical values.
4. Results of Simulation
This section presents the results of experimental research that was carried out for transit media in the city of Szczecin, which is located in the north-western part of Poland. Szczecin ranks third in terms of the occupied area (300.55 km2, of which almost 24% is under water) and seventh in terms of the population in Poland. The city is the centre of the Szczecin agglomeration (one of eight Polish metropolises according to the European Observation Network for Territorial Development and Cohesion (ESPON). According to data from 30 June 2017, the city had 405,413 inhabitants. The Odra river flows through the city, dividing the area into two parts. The larger part (left bank) contains the city centre and the majority of the industrial and residential districts. Mostly houses and residential districts are located in the second part (right bank). In the analysed city, all trams pass through the city centre, bringing people from residential parts of the city. Studies were performed using classic CA and graph CA. All results are presented in the form of heat maps of the urban area and in the form of detailed graphs that show the areas that are reached by the information about the advertisements. Two independent research processes, which are presented in Section 4.1 and Section 4.2, were carried out, each with three independent studies, including the placement of the advertisement on several communication vehicles that are running on selected lines. The aim was to check whether the choice of the route of public transport vehicles influences the propagation of advertising in the city and how the strategies that are used affect the coverage. The following initial simulation parameters were adopted:
- timetables, which were acquired from the public transport company;
- a city map with a resolution of 640 × 640;
- the probability of stopping the person who is propagating information;
- tramway line numbers, followed by vehicles with the same advertisement, to increase the reminding effect: three tram lines: 1, 7, and 11 (Group 1); five tram lines: 2, 3, 6, 8, and 12 (Group 2); and all ten tram lines (Group 3): 1, 2, 3, 5, 6, 7, 8, 10, 11, and 12.
Tram lines were selected for experiments in such a way that the vehicle routes were as diverse as possible in terms of area (especially for the tests with 3 and 5 tram lines). The research is based on the tram communication timetable for weekdays, holidays and weekends.
4.1. Modelling Results Based on Classic Cellular Automata
The first study involved the propagation of information about advertisements on the basis of classic cellular machines, that is, the transmission of information from a cell to the nearest neighbouring cell. The data from simulations were divided into groups according to the tram line for analysis. In the first stage, the total coverage was analysed and the results, which are shown in Figure 4a–c, demonstrate the larger coverage of the area with information (26.29%) when the advertisement is placed on all available tram lines compared to the coverage of 18.16% for 3 selected lines and 21% for 5 selected lines.
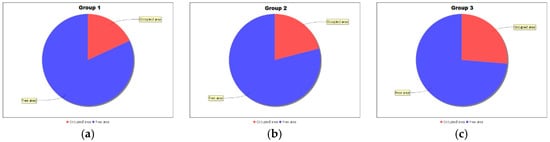
Figure 4.
The share of the reached area for (a) three lines (18.16%); (b) five lines (21%); (c) ten lines (26.29%).
A detailed analysis of the obtained results (Figure 5a–c) shows that the inclusion of all tram lines with the given advertisement causes the highest (35.45%) intensity of information about the advertisement (red colour with the label 201+) compared to the intensity of 22.08% for the advertisement that is placed on three tram lines and an intensity of 28.29% for the advertisement that is placed on five tram lines. The labels in Figure 6a–c represent the number of CA cells in which 1–25, 26–50, 51–75, 76–100, 101–125, 126–150, 151–175, 176–200 and more than 201 people saw an advertisement. The biggest difference is observed for 201+ cells, which means that increasing the coverage of advertising space on public transport vehicles translates into an increase in the probability of advertising reaching potential customers.
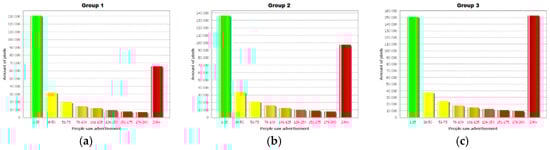
Figure 5.
The numbers of cells and people who are reached by transit advertising for (a) three lines, (b) five lines, (c) ten lines.
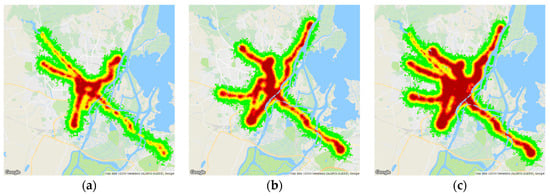
Figure 6.
The heat map for urban space coverage for (a) three lines, (b) five lines, (c) ten lines.
Simulation results were applied to the city map and they show areas that were reached by marketing content in the form of heat maps. Figure 6a–c show the obtained results for a group of tram lines, with the lowest coverage for three lines and the highest for ten lines.
Detailed results from simulations based on classical CA are presented in Table 1. Analysis of the results leads to two main conclusions: First, the largest amount of information spread occurs along the routes of public transport lines, in the tram stops, and in the centre of the city, where the most public transport lines cross.

Table 1.
The results from classical cellular automata (CA).
In the forgetting process, an information reminder (the re-appearance of a vehicle with the same advertisement) plays a very important role. Thanks to this phenomenon, information about an advertisement is further propagated and its trace is visible on the heat map. Only after moving away from the clusters of public transport lines does the spread of information begin to slow.
4.2. Modelling Results Based on Graph Cellular Automata
The next study concerned information propagation on the basis of graph cellular automata, which allowed the additional effect of the transmission of information to other segments of the network to be taken into account. In this way, information about advertising spreads not only to the nearest CA cells (as in the case that was discussed above) but also to cells that are physically separated from the initiating cell and are in a logical relation with it (this issue is described in Section 3). In the discussed studies, the same configurations of tram lines with the same advertising were used as in the previous study. The same initial simulation parameters were adopted while also taking into account the probability of informing other users via social media. Detailed results from the simulations that are based on classical CA are presented in Table 2.
Table 2.
The results from graph CA.
Land coverage proves to be much greater—from 43.07% (for three lines) to 77.87% (for all lines), as shown in Figure 7a–c. The nearest tram lines and stops receive similar amounts of information (Table 1); however, due to the larger area to which information has arrived, the share is smaller.
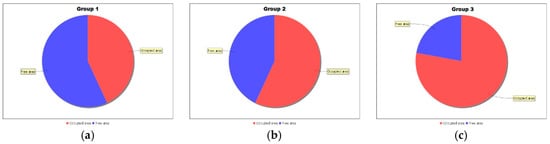
Figure 7.
The share of the reached area for (a) three lines (43.07%); (b) five lines (56.91%); (c) ten lines (77.87%), with the graph CA approach.
In contrast, the percentage share of the area that is far from the places of advertising is much larger than in previous studies and reaches 77%, which translates into the numerical values that are shown in Figure 8a–c. This means that the model is working properly and that individual cells have been relaying information to physically separated cells that satisfy a logical relation.
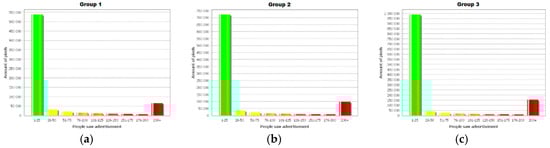
Figure 8.
The numbers of cells and people who are reached by transit advertising with the graph CA approach for (a) three lines; (b) five lines; (c) ten lines.
Heat maps of urban space coverage based on the reached cells and people for the graph CA approach are presented in Figure 9a–c.
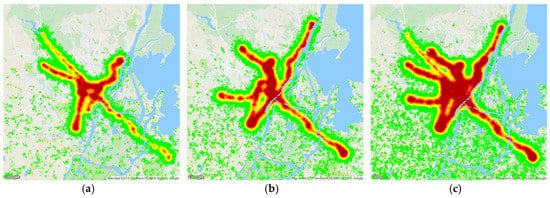
Figure 9.
The heat map for urban space coverage for three lines for the graph CA approach for (a) three lines; (b) five lines; (c) ten lines.
4.3. Symmetry Aspects
Information spreading with the use of cellular automata is symmetric itself. In this study, the authors used a symmetric neighbourhood. In the literature, CA according to Wolfram’s classification, are divided into four classes [85]. The study of symmetry in individual classes was addressed in References [99]. The author investigated the issue of development of pattern formation from the viewpoint of symmetry and he applied a two-dimensional discrete Walsh analysis to a one-dimensional cellular automata model under two types of regular initial conditions. The geometric symmetry property in CA was also used in the continuous optimization algorithm [100]. In the other article, the authors proposed a polynomial time algorithm to identify self-symmetric rules and pairwise symmetric rules in any type of symmetric lattice in a two dimensional CA, which are capable of generating symmetric patterns [101].
4.4. Limitations of the Study
In the article, the authors made several assumptions to obtain data in the system. These are the values that should be obtained through field studies: the time followed by the actual forgetfulness of the advertisement, the distance from which the man pays attention to the public transport vehicles and the advertisement located on them, the exact number of people getting on and off at stops, the value corresponding to the number of advertisements people can see on a bus or tram at any one time. For technical reasons, the authors used approximate data.
5. Conclusions
Although transit advertising is one of the commonly used forms of outdoor marketing, the analytical capabilities that are associated with this medium are limited. There are very few studies on the effectiveness of advertising activities related to transit systems. To the best of the authors’ knowledge, the presented solution is the first attempt to model phenomena related to the propagation of information in an urban space with the participation of transit advertising. The main contributions of the presented work are as follows:
- development of a model that is based on classical and cellular graph automata for the representation of information propagation within an urban space that is initiated by transit advertising;
- development of a new method for measuring the effectiveness of transit advertising within an urban space; and
- implementation of a practical framework for simulation research and verification of the presented methods.
The main objective of the work was to develop a model and, subsequently, a system for simulating the spread of information in an urban space. Information propagation processes were initiated by advertisements that were placed on transit vehicles. The simulations considered various scenarios and examined how to achieve acceptable results with few public transport lines, which translates into the possibility of reducing the cost of such advertising activities. For the simulation, cellular automata were used in both the classical and graph form.
The simulations provided data related to the effectiveness of the considered scenarios of the use of advertising space on transit media. On the basis of this research, it is concluded that a sufficient effect is achieved by advertisement on three to five lines. The lines were localized in completely different areas of the city but have common intersection points in the centre. Hence, people who knew about the advertisement but forgot about it recorded information about it after encountering another tram with the same advertisement. The difference in the city areas that were covered by advertising on ten lines compared to five was low; however, the cost of advertising was twice as high. In addition, if people are encouraged to provide information about advertising to other people, the extent of the spread of information from an advertisement increases significantly. The results of the research demonstrated that the system is suitable for forecasting the spread of information that is located on public transport vehicles.
The proposed approach leads to several managerial implications. From the perspective of companies using transit media for marketing purposes, it is the first work addressing the problem of proper allocation and usage of transit media in a detailed way. The proposed approach opens possibilities for optimization, selection of transit lines with the use of their timing and the areas covered. Companies managing advertising space within transit media can use the proposed approach to evaluate their potential and adjust pricing models to real advertising performance and potential. This research makes it possible to better allocate advertising budgets and make urban space more sustainable without overloading it with advertisements. The proper allocation of advertising content can help to avoid habituation effect when the same advertising content is presented many times to the same audience. It is an attempt to add quantitative characteristics to traditional media that are difficult to measure.
The presented research covers a fraction of the possible research questions that will be considered in future work. The system has been designed in such a way that it can be extended and used with detailed datasets from public transport systems. Currently, it counts the number of people who saw the advertisement on a public transport vehicle or obtained information about it from another person. To further develop the model, internal advertising can be included, and it is possible to use electronic displays and dynamic transit advertising that depend on the location of the vehicle and the time. While the proposed approach requires several assumptions, the future focus should be put on real data acquisition from various sources. Modern advertising techniques include elements of interaction even within traditional advertising to get feedback with the use of social media or SMS. It would be helpful to evaluate information dissemination effects. Future work can also include the usage of mobile devices and sensors for gathering more precise data about behaviours.
Author Contributions
Conceptualization, K.M. and J.J.; methodology, K.M.; software, M.S.; validation, K.M., J.J. and M.S.; formal analysis, K.M. and J.J.; writing, K.M. and J.J.
Funding
This research was partially supported by the Polish National Science Centre, Poland, grant No. 2017/27/B/HS4/01216.
Conflicts of Interest
The authors declare no conflict of interest.
References
- Broderick, F. The Biggest Data Trends for Outdoor Advertising in 2017—CARTO Blog. Available online: https://carto.com/blog/biggest-data-trends-outdoor-advertising-2017/ (accessed on 25 May 2018).
- Stillman, L.; Letang, V. Global Advertising Forecast. Available online: https://www.magnaglobal.com/wp-content/uploads/2016/12/MAGNA-December-Global-Forecast-Update-Press-Release-1.pdf (accessed on 25 May 2018).
- Fortenberry, J.L.; McGoldrick, P.J. Receptiveness of Black Americans to outdoor advertising. J. Bus. Res. 2011, 64, 586–593. [Google Scholar] [CrossRef]
- Veloutsou, C.; O’Donnell, C. Exploring the effectiveness of taxis as an advertising medium. Int. J. Advert. 2005, 24, 217–239. [Google Scholar] [CrossRef]
- Gray, J. How to move into moving media: Transit media. J. Mark. 2008, 4, 40–41. [Google Scholar]
- Pavel, C.; Cătoiu, I. Unconventional advertising for unconventional media. Rev. Econ. 2009, 2, 142–145. [Google Scholar]
- Belch, G.E.; Belch, M.A. Advertising and Promotion: An Integrated Marketing Communications Perspective; McGraw-Hill: New York, NY, USA, 2004. [Google Scholar]
- Hampp, A. Advertising Boosts Transit Budgets. Available online: http://adage.com/article/media/advertising-boosts-transit-budgets/132024/ (accessed on 13 Jun 2018).
- Hoffman, D.L.; Novak, T.P. Marketing in Hypermedia Environment Foundations: Conceptual Foundations. J. Mark. 1996, 60, 50–68. [Google Scholar] [CrossRef]
- Lamberton, C.; Stephen, A.T. A Thematic Exploration of Digital, Social Media, and Mobile Marketing: Research Evolution from 2000 to 2015 and an Agenda for Future Inquiry. J. Mark. 2016, 80, 146–172. [Google Scholar] [CrossRef]
- Chaffey, D.; Ellis-Chadwick, F.; Mayer, R.; Johnston, K. Internet Marketing:Strategy, Implementation and Practice; Pearson Education: London, UK, 2009; ISBN 9780273694052. [Google Scholar]
- Roux, T.; van der Waldt, D.L.R.; Ehlers, L. A classification framework for out-of-home advertising media in South Africa. Communicatio 2013, 39, 383–401. [Google Scholar] [CrossRef]
- Lee, S.E.; McElheny, M.J.; Gibbons, R. Driving Performance and Digital Billboards; Research report, Virginia Tech Transportation Institute: Blacksburg, VA, USA, 2007. [Google Scholar]
- Liu, X.; Krahnstoever, N.; Yu, T.; Tu, P. What are customers looking at? In Proceedings of the 2007 IEEE Conference on Advanced Video and Signal Based Surveillance, London, UK, 5–7 September 2007; pp. 405–410. [Google Scholar]
- Want, R.; Schilit, B.N. Interactive digital signage. Comput. (Long Beach Calif.) 2012, 45, 21–24. [Google Scholar] [CrossRef]
- Roux, T. The Effectiveness of Car Advertising Media: Perceptions of Generation-Y Consumers. Mediterr. J. Soc. Sci. 2014, 5, 1877. [Google Scholar] [CrossRef]
- Bhargava, M.; Donthu, N. Sales response to outdoor advertising. J. Advert. Res. 1999, 39, 7–18. [Google Scholar]
- Bhargava, M.; Donthu, N.; Caron, R. Improving the Effectiveness of Outdoor Advertising: Lessons from a Study of 282 Campaigns. J. Advert. Res. 1994, 34, 46–55. [Google Scholar]
- Woodside, A.G. Outdoor advertising as experiments. J. Acad. Mark. Sci. 1990, 18, 229–237. [Google Scholar] [CrossRef]
- Osborne, A.C.; Coleman, R. Outdoor advertising recall: A comparison of newer technology and traditional billboards. J. Curr. Issues Res. Advert. 2008, 30, 13–30. [Google Scholar] [CrossRef]
- Taylor, C.R.; Franke, G.R.; Bang, H.-K. Use and Effectiveness of Billboards: Perspectives from Selective-Perception Theory and Retail-Gravity Models. J. Advert. 2006, 35, 21–34. [Google Scholar] [CrossRef]
- Wilson, R.T.; Till, B.D. Effects of outdoor advertising: Does location matter? Psychol. Mark. 2011, 28, 909–933. [Google Scholar] [CrossRef]
- Jurca, M.A. The Forms of Unconventional Advertising—A Theoretical Approach. Manag. Mark. J. 2010, 8, 323–333. [Google Scholar]
- Kobliski, K.J. The Advantages of Transit Advertising. Available online: https://www.entrepreneur.com/article/76826 (accessed on 18 March 2018).
- Chan, K.; Fung, M. Effectiveness of subway advertising in Hong Kong. J. Mass Commun. 2013, 3, 486–501. [Google Scholar]
- Hall, E. London bus ads change as locations do. Advert. Age 2006, 77, 12. [Google Scholar]
- Donthu, N.; Cherian, J.; Bhargava, M. Factors influencing recall of outdoor advertising. J. Advert. Res. 1993, 33, 64–72. [Google Scholar]
- King, K.W.; Tinkham, S.F. The learning and retention of outdoor advertising. J. Advert. Res. 1989, 29, 47–56. [Google Scholar] [CrossRef]
- Gambetti, R.C. Ambient Communication: How to Engage Consumers in Urban Touch-Points. Calif. Manag. Rev. 2010, 52, 34–51. [Google Scholar] [CrossRef]
- Keller, E.; Keller, E.; Berry, J.; Berry, J. Word-of-mouth: The real action is offline. Advert. Age 2006, 77, 20. [Google Scholar]
- Fay, K.; Thomson, S. WOM is More Offline Than Online around Brands. Available online: https://www.warc.com/content/paywall/article/admap/wom_is_more_offline_than_online/97996 (accessed on 13 May 2018).
- Katz, E.; Lazarsfeld, P.F. Personal Influence, the Part Played by People in the Flow of Mass Communications; Transaction Publishers: Piscataway, NJ, USA, 1966. [Google Scholar]
- Brown, J.J.; Reingen, P.H. Social Ties and Word-of-Mouth Referral Behavior. J. Consum. Res. 1987, 14, 350–362. [Google Scholar] [CrossRef]
- Bone, P.F. Word-of-mouth effects on short-term and long-term product judgments. J. Bus. Res. 1995, 32, 213–223. [Google Scholar] [CrossRef]
- Sundaram, D.S.; Mitra, K.; Webster, C. Word-of-Mouth Communications: A Motivational Analysis. Available online: http://w.acrwebsite.org/search/view-conference-proceedings.aspx?Id=8208 (accessed on 13 May 2018).
- Helm, S. Viral Marketing—Establishing Customer Relationships by “Word-of-mouse”. Electron. Mark. 2000, 10, 158–161. [Google Scholar] [CrossRef]
- Chen, W.; Wang, C.; Wang, Y. Scalable influence maximization for prevalent viral marketing in large-scale social networks. In Proceedings of the 16th ACM SIGKDD international conference on Knowledge discovery and data mining—KDD ’10, Washington, DC, USA, 25–28 July 2010; p. 1029. [Google Scholar]
- Trusov, M.; Bucklin, R.E.; Pauwels, K. Effects of Word-of-Mouth Versus Traditional Marketing: Findings from an Internet Social Networking Site. J. Mark. 2009, 73, 90–102. [Google Scholar] [CrossRef]
- Kandhway, K.; Kuri, J. How to run a campaign: Optimal control of SIS and SIR information epidemics. Appl. Math. Comput. 2014, 231, 79–92. [Google Scholar] [CrossRef]
- Kempe, D.; Kleinberg, J.; Tardos, É. Maximizing the spread of influence through a social network. In Proceedings of the ninth ACM SIGKDD international conference on Knowledge discovery and data mining—KDD ’03, Washington, DC, USA, 24–27 August 2003; p. 137. [Google Scholar]
- Rosnow, R.L.; Esposito, J.L.; Gibney, L. Factors influencing rumor spreading: Replication and extension. Lang. Commun. 1988, 8, 29–42. [Google Scholar] [CrossRef]
- Pittel, B. On Spreading a Rumor. SIAM J. Appl. Math. 1987, 47, 213–223. [Google Scholar] [CrossRef]
- Kesten, H.; Sidoravicius, V. The spread of a rumor or infection in a moving population. Annu. Probab. 2005, 33, 2402–2462. [Google Scholar] [CrossRef]
- Fu, L.; Song, W.; Lv, W.; Lo, S. Simulation of emotional contagion using modified SIR model: A cellular automaton approach. Phys. A 2014, 405, 380–391. [Google Scholar] [CrossRef]
- Huang, L.; Park, K.; Lai, Y.C. Information propagation on modular networks. Phys. Rev. E-Stat. Nonlinear Soft Matter Phys. 2006, 73, 035103. [Google Scholar] [CrossRef] [PubMed]
- Bampo, M.; Ewing, M.T.; Mather, D.R.; Stewart, D.; Wallace, M. The effects of the social structure of digital networks on viral marketing performance. Inf. Syst. Res. 2008, 19, 273–290. [Google Scholar] [CrossRef]
- Aral, S.; Muchnik, L.; Sundararajan, A. Distinguishing influence-based contagion from homophily-driven diffusion in dynamic networks. Proc. Natl. Acad. Sci. USA 2009, 106, 21544–21549. [Google Scholar] [CrossRef] [PubMed]
- Sahneh, F.D.; Scoglio, C.; Van Mieghem, P. Generalized epidemic mean-field model for spreading processes over multilayer complex networks. IEEE/ACM Trans. Netw. 2013, 21, 1609–1620. [Google Scholar] [CrossRef]
- Stonedahl, F.; Rand, W.; Wilensky, U. Evolving viral marketing strategies. In Proceedings of the 12th annual conference on Genetic and evolutionary computation—GECCO ’10, Portland, OR, USA, 7–11 July 2010; ACM Press: New York, NY, USA, 2010; p. 1195. [Google Scholar]
- Toffoli, T. Cellular Automata As an Alternative To Differential Equations in Modeling Physics. Phys. D 1984, 10, 117–127. [Google Scholar] [CrossRef]
- Toffoli, T.; Margolus, N. Cellular Automata Machines: A New Environment for Modeling; MIT Press: Cambridge, MA, USA, 1988. [Google Scholar]
- White, R.; Engelen, G. Cellular Automata and Fractal Urban Form: A Cellular Modelling Approach to the Evolution of Urban Land-Use Patterns. Environ. Plan. A 1993, 25, 1175–1199. [Google Scholar] [CrossRef]
- Batty, M.; Xie, Y. From Cells to Cities. Environ. Plan. B Plan. Des. 1994, 21, S31–S48. [Google Scholar] [CrossRef]
- Wagner, D.F. Cellular automata and geographic information systems. Environ. Plan. B Plan. Des. 1997, 24, 219–234. [Google Scholar] [CrossRef]
- Li, X.; Yeh, A.G. Calibration of cellular automata by using neural networks for the simulation of complex urban systems. Environ. Plan. A 2001, 33, 1445–1462. [Google Scholar] [CrossRef]
- Dietzel, C.; Clarke, K. The effect of disaggregating land use categories in cellular automata during model calibration and forecasting. Comput. Environ. Urban Syst. 2006, 30, 78–101. [Google Scholar] [CrossRef]
- Li, X.; Yeh, A.G.O. Principal component analysis of stacked multi-temporal images for the monitoring of rapid urban expansion in the Pearl River Delta. Int. J. Remote Sens. 1998, 19, 1501–1518. [Google Scholar] [CrossRef]
- Lo, C.P.; Yang, X. Drivers of Land-Use/Land-Cover Changes and Dynamic Modeling for the Atlanta, Georgia Metropolitan Area. Photogramm. Eng. Remote Sens. 2002, 68, 1073–1082. [Google Scholar]
- Ward, D.P.; Murray, A.T.; Phinn, S.R. A stochastically constrained cellular model of urban growth. Comput. Environ. Urban Syst. 2000, 24, 539–558. [Google Scholar] [CrossRef]
- Li, X.; Yeh, A.G.-O. Neural-network-based cellular automata for simulating multiple land use changes using GIS. Int. J. Geogr. Inf. Sci. 2002, 16, 323–343. [Google Scholar] [CrossRef]
- Arai, K. Cell Based GIS as Cellular Automata for Disaster Spreading Predictions and Required Data Systems. Data Sci. J. 2013, 12, WDS154–WDS158. [Google Scholar] [CrossRef]
- Alexandridis, A.; Vakalis, D.; Siettos, C.I.; Bafas, G.V. A cellular automata model for forest fire spread prediction: The case of the wildfire that swept through Spetses Island in 1990. Appl. Math. Comput. 2008, 204, 191–201. [Google Scholar] [CrossRef]
- Gao, N.; Weng, W.; Ma, W.; Ni, S.; Huang, Q.; Yuan, H. Fire Spread Model for Old Towns Based on Cellular Automaton. Tsinghua Sci. Technol. 2008, 13, 736–740. [Google Scholar] [CrossRef]
- Progias, P.; Sirakoulis, G.C. An FPGA processor for modelling wildfire spreading. Math. Comput. Model. 2013, 57, 1436–1452. [Google Scholar] [CrossRef]
- Shyue, S.; Sung, H.; Chiu, Y. Oil Spill Modeling Using 3D Cellular Automata For Coastal Waters. In Proceedings of the The Seventeenth International Offshore and Polar Engineering Conference, Lisbon, Portugal, 1–6 July 2007. [Google Scholar]
- Gług, M.; Wąs, J. Modeling of oil spill spreading disasters using combination of Langrangian discrete particle algorithm with Cellular Automata approach. Ocean Eng. 2018, 156, 396–405. [Google Scholar] [CrossRef]
- Holko, A.; Mędrek, M.; Pastuszak, Z.; Phusavat, K. Epidemiological modeling with a population density map-based cellular automata simulation system. Expert Syst. Appl. 2016, 48, 1–8. [Google Scholar] [CrossRef]
- Ion, S.; Marinoschi, G. A Self-Organizing Criticality Mathematical Model for Contamination and Epidemic Spreading. Discret. Contin. Dyn. Syst. B 2017, 22, 383–405. [Google Scholar] [CrossRef]
- Pereira, F.M.M.; Schimit, P.H.T. Dengue fever spreading based on probabilistic cellular automata with two lattices. Phys. A Stat. Mech. Appl. 2018, 499, 75–87. [Google Scholar] [CrossRef]
- Burkhead, E.G.; Hawkins, J.M. Nondeterministic and stochastic cellular automata and virus dynamics. J. Cell. Autom. 2018, 13, 103–119. [Google Scholar]
- Daliri Khomami, M.M.; Rezvanian, A.; Bagherpour, N.; Meybodi, M.R. Irregular cellular automata based diffusion model for influence maximization. In Proceedings of the 2017 5th Iranian Joint Congress on Fuzzy and Intelligent Systems (CFIS), Qazvin, Iran, 7–9 March 2017; pp. 69–74. [Google Scholar]
- Hu, Y.; Yu, J.; Zong, F. Cellular Automata Model to Simulate the Spreading of Mobile Phone Messages Virus. J. Inf. Comput. Sci. 2013, 10, 3579–3586. [Google Scholar] [CrossRef]
- Schimit, P.H.T.; Barros Junior, D.F.; Araújo, S.A. On estimating the impact of information spreading in a consumer market modeled by probabilistic cellular automata and ordinary differential equations. Simulation 2017, 93, 1063–1072. [Google Scholar] [CrossRef]
- Wu, A.; Control, A.R.-I. Cellular graph automata. I. Basic concepts, graph property measurement, closure properties. Inf. Control 1979, 42, 305–329. [Google Scholar] [CrossRef]
- Marr, C.; Hütt, M.T. Topology regulates pattern formation capacity of binary cellular automata on graphs. Phys. A Stat. Mech. Appl. 2005, 354, 641–662. [Google Scholar] [CrossRef]
- Marr, C.; Hütt, M.T. Cellular automata on graphs: Topological properties of er graphs evolved towards low-entropy dynamics. Entropy 2012, 14, 993–1010. [Google Scholar] [CrossRef]
- O’Sullivan, D. Graph-cellular automata: A generalised discrete urban and regional model. Environ. Plan. B Plan. Des. 2001, 28, 687–705. [Google Scholar] [CrossRef]
- Małecki, K.; Jankowski, J.; Rokita, M. Application of graph cellular automata in social network based recommender system. In Lecture Notes in Computer Science (including Subseries Lecture Notes in Artificial Intelligence and Lecture Notes in Bioinformatics); Springer: Berlin/Heidelberg, Germany, 2013; Volume 8083, pp. 21–29. ISBN 9783642404948. [Google Scholar]
- Małecki, K.; Watróbski, J. The Classification of Internet Shop Customers based on the Cluster Analysis and Graph Cellular Automata. Procedia Comput. Sci. 2017, 112, 2280–2289. [Google Scholar] [CrossRef]
- Pendleton, S.C. Rumor research revisited and expanded. Lang. Commun. 1998, 18, 69–86. [Google Scholar] [CrossRef]
- Daley, D.J.; Kendall, D.G. Epidemics and Rumours. Nature 1964, 204, 1118. [Google Scholar] [CrossRef] [PubMed]
- Murray, J.D. Mathematical Biology: I. An Introduction; Springer: Berlin/Heidelberg, Germany, 2002. [Google Scholar]
- Narayanam, R.; Nanavati, A.A. Viral marketing for product cross-sell through social networks. In Lecture Notes in Computer Science (including Subseries Lecture Notes in Artificial Intelligence and Lecture Notes in Bioinformatics); Springer: Berlin/Heidelberg, Germany, 2012; Volume 7524, pp. 581–596. ISBN 9783642334856. [Google Scholar]
- Aldrees, M.; Ykhlef, M. A Seeding Cellular Learning Automata Approach for Viral Marketing In Social Network. In Proceedings of the 16th International Conference on Information Integration and Web-based Applications & Services—iiWAS ’14, Hanoi, Viet Nam, 4–6 December 2014; pp. 59–63. [Google Scholar] [CrossRef]
- Wolfram, S. A New Kind of Science; Wolfram Media: Champaign, IL, USA, 2002; ISBN 1579550088. [Google Scholar]
- Hoffmann, R.; Völkmann, K.P.; Waldschmidt, S.; Heenes, W. GCA: Global Cellular Automata. A Flexible Parallel Model. In Parallel Computing Technologies; Springer: Berlin/Heidelberg, Germany, 2001; pp. 66–73. ISBN 9783540425229. [Google Scholar]
- Barredo, J.; Kasanko, M. Modelling dynamic spatial processes: Simulation of urban future scenarios through cellular automata. Landsc. Urban Plan. 2003, 64, 145–160. [Google Scholar] [CrossRef]
- Stevens, D.; Dragićević, S. A GIS-based irregular cellular automata model of land-use change. Environ. Plan. B Plan. Des. 2007, 34, 708–724. [Google Scholar] [CrossRef]
- Santé, I.; García, A.M.; Miranda, D.; Crecente, R. Cellular automata models for the simulation of real-world urban processes: A review and analysis. Landsc. Urban Plan. 2010, 96, 108–122. [Google Scholar] [CrossRef]
- Barreira-González, P.; Barros, J. Configuring the neighbourhood effect in irregular cellular automata based models. Int. J. Geogr. Inf. Sci. 2017, 31, 617–636. [Google Scholar] [CrossRef]
- Dahal, K.R.; Chow, T.E. Characterization of neighborhood sensitivity of an irregular cellular automata model of urban growth. Int. J. Geogr. Inf. Sci. 2015, 29, 475–497. [Google Scholar] [CrossRef]
- Mamei, M.; Roli, A.; Zambonelli, F. Emergence and control of macro-spatial structures in perturbed cellular automata, and implications for pervasive computing systems. IEEE Trans. Syst. Man Cybern. Part A Syst. Hum. 2005, 35, 337–348. [Google Scholar] [CrossRef]
- Missoum, S.; Gürdal, Z.; Setoodeh, S. Study of a new local update scheme for cellular automata in structural design. Struct. Multidiscip. Optim. 2005, 29, 103–112. [Google Scholar] [CrossRef]
- Wąs, J.; Sirakoulis, G.C. Cellular Automata Applications for Research and Industry. J. Comput. Sci. 2015, 11. [Google Scholar] [CrossRef]
- Weimar, J.R. Cellular automata for reaction-diffusion systems. Parallel Comput. 1997, 23, 1699–1715. [Google Scholar] [CrossRef]
- Wixted, J.T.; Ebbesen, E.B. Genuine power curves in forgetting: A quantitative analysis of individual subject forgetting functions. Mem. Cogn. 1997, 25, 731–739. [Google Scholar] [CrossRef]
- Małecki, K. Graph cellular automata with relation-based neighbourhoods of cells for complex systems modelling: A case of traffic simulation. Symmetry (Basel) 2017, 9, 322. [Google Scholar] [CrossRef]
- Weidmann, U. Transporttechnik der Fußgänger—Transporttechnische Eigenschaften des Fußgängerverkehrs (Literaturauswertung). In Schriftenreihe des IVT (90); ETH Zürich: Zürich, Switzerland, 1992. [Google Scholar]
- Tanaka, I. Effects of initial symmetry on the global symmetry of one-dimensional legal cellular automata. Symmetry (Basel) 2015, 7, 1768–1779. [Google Scholar] [CrossRef]
- Evsutin, O.; Shelupanov, A.; Meshcheryakov, R.; Bondarenko, D.; Rashchupkina, A. The algorithm of continuous optimization based on the modified cellular automaton. Symmetry (Basel) 2016, 8, 84. [Google Scholar] [CrossRef]
- Vellarayil Mohandas, N.; Jeganathan, L. Classification of Two Dimensional Cellular Automata Rules for Symmetric Pattern Generation. Symmetry (Basel) 2018, 10, 772. [Google Scholar] [CrossRef]
© 2019 by the authors. Licensee MDPI, Basel, Switzerland. This article is an open access article distributed under the terms and conditions of the Creative Commons Attribution (CC BY) license (http://creativecommons.org/licenses/by/4.0/).