1. Introduction
As the Internet rapidly develops, more attention must be paid to the security issues. Particularly, DDOS (distributed denial of service) attacks seriously damage large-scale network hubs and threaten network operations and private user information security. Botnet formation, as a necessary condition for the DDOS attack is analogous to an “army” launching the attack. Therefore, research on botnet detection has become a key part of DDOS security and defense. A peer-to-Peer (P2P) botnet is characterized by distribution and dispersion. Additionally, it has no independent botnet mainframe. It is difficult to detect the sharing information of the infecting machine. Although much progress has been made toward efficient botnet detection, botnet developers continuously update their networks to evade these efforts. Encrypted botnet makes many detection methods invalid. In turn, botnet detection has become an important and evolving research field [
1].
Botnet has been changing as researchers carry out in-depth studies to combat them. Recently, P2P botnet was developed to avoid all kinds of detections. Researchers have carried out numerous studies on the detection of new P2P botnet. Previous research detected P2P botnet through a signature mechanism [
2]. However, the signature mechanism cannot accurately detect botnet when the host is a random port or the port is encrypted. Another approach turns to a behavioral detection of P2P botnet. However, due to the continuously evolving nature of botnet, behavioral detection cannot maintain its validity. The paper in Reference [
3] uses unsupervised machine learning approaches to separate P2P botnet traffic from benign traffic. The approach used ‘control flows’ of P2P applications to extract statistical fingerprints. P2P bots were identified based on certain features like fingerprint similarity, the number of overlapping contacts, persistent communication and so forth. However, the work can detect P2P bots inside a network only when there are multiple infected nodes belonging to the same botnet. K. Huseynov et al. [
4] compared the K-means algorithm and the ant colony system algorithm to detect the decentralized botnets. They used features based on the host and proposed a method that can detect botnets quickly and accurately. Much work focuses on classifying the network flow through the features of the flow level. In Reference [
5] proposed an approach for P2P botnet detection called node-based detection. This approach focuses on the network characteristics of individual nodes. Based on the specific model, examining node’s flows and extract the useful features over a given time period. The approach consists of four steps and monitors 7 different features. In Reference [
6], D. Zhao et. al proposed using the Reptree algorithm to detect botnets. They analyzed the detection rate and false positives of botnets with various time windows, where the best time window was 300 s. Narang [
7] et al. took the discrete Fourier transform of the data packets and time intervals to generate new features in the frequency domain for machine learning. However, computation through this method requires a large number of features and the detection precision and recall rates are relatively low.
This paper takes a data packet as the subdivision of a signal. The data packet and time interval are the corresponding two-dimensional features. Two features are proposed according to the order form 2 d graphic point coordinate. Therefore, the idea of considering the characteristics of two time sequences in the traffic, traffic data are obtained by the two-dimensional Fourier transform of frequency domain values, characteristics after data fusion, better describe the flow characteristics of the botnet, combined the theory of information entropy and traditional flow features, is regarded as the characteristic signal to detect botnet. Moreover, combined with other features, fewer features are required and the detection accuracy is improved using the REP tree algorithms. Therefore, this work provides a new idea for feature extraction of DDoS attack detection.
2. Proposed Approach
2.1. P2P Botnet Detection Model
Machine learning is a common botnet detection method. Communication information that can be classified in botnet is used as a machine learning feature. Moreover, these features can classify new communication information and detect botnet. The steps of botnet detection through machine learning are shown in
Figure 1.
The features of botnet are analyzed through training and testing. The extracted features with high relevance are chosen for further study. In order to improve the efficiency and flexibility of the features of botnets in the machine learning process, it is necessary to seek features with high relevance which are more conducive to botnet detection. Features are generally divided into two categories: the session level and the packet level. The average packet size and the average time interval belong to the features in the session. The size of each packet and time interval belong to the features at the packet level. In the P2P botnet, each node can be used as an information sharer and publisher, which enhances the detection difficulty. Hence, traditional methods require a large number of categories of features for accurate detection.
In this work, feature extraction communication information is regarded as a two-dimensional image after flow extraction. The packet sizes and time intervals in a communication are the abscissa and the ordinate. The feature can better describe the flow characteristics of the botnet and good detection results can be obtained in machine learning.
The two-dimensional Fourier transform is mostly used for image preprocessing. To express the two-dimensional image in the frequency domain and whether the Fourier transform coefficient is close to the center is to take advantage of the characteristics of fast and slow changes in the image, that is, to use the image grayscale to express [
8,
9]. In image preprocessing, gray scale processing is used to reduce the dimension of image information [
10]. In the detection method, dimensionality reduction processing of existing features is also required to maintain feature information, so the data packet size and time interval in the communication flow are processed correspondingly and dimensionality reduction processing is conducted on the premise of ensuring the integrity of feature expression.
Fourier transforms can effectively extract the contributing ingredients of any signal. In any time series, most of the energy is contained in the first few DFT coefficients itself [
11]. By modeling a network communication in the form of a signal and performing a Fourier transform over it, we aim to extract the highest contributing signals or the top peaks of the Fourier transform. We focus our attention on these peaks and utilize them as ‘features’ to build our detection models.
The Fourier transform provides a frequency domain representation of all signals, which are used to capture time and exchange data. The communication between two hosts is modeled through time series. The time interval between two packets and the size of the former load are a pair of two-dimensional features, which will be selected as the features of machine learning. The value of the Fourier transform represents the magnitude of energy and the detection model is established through values with a large energy magnitude.
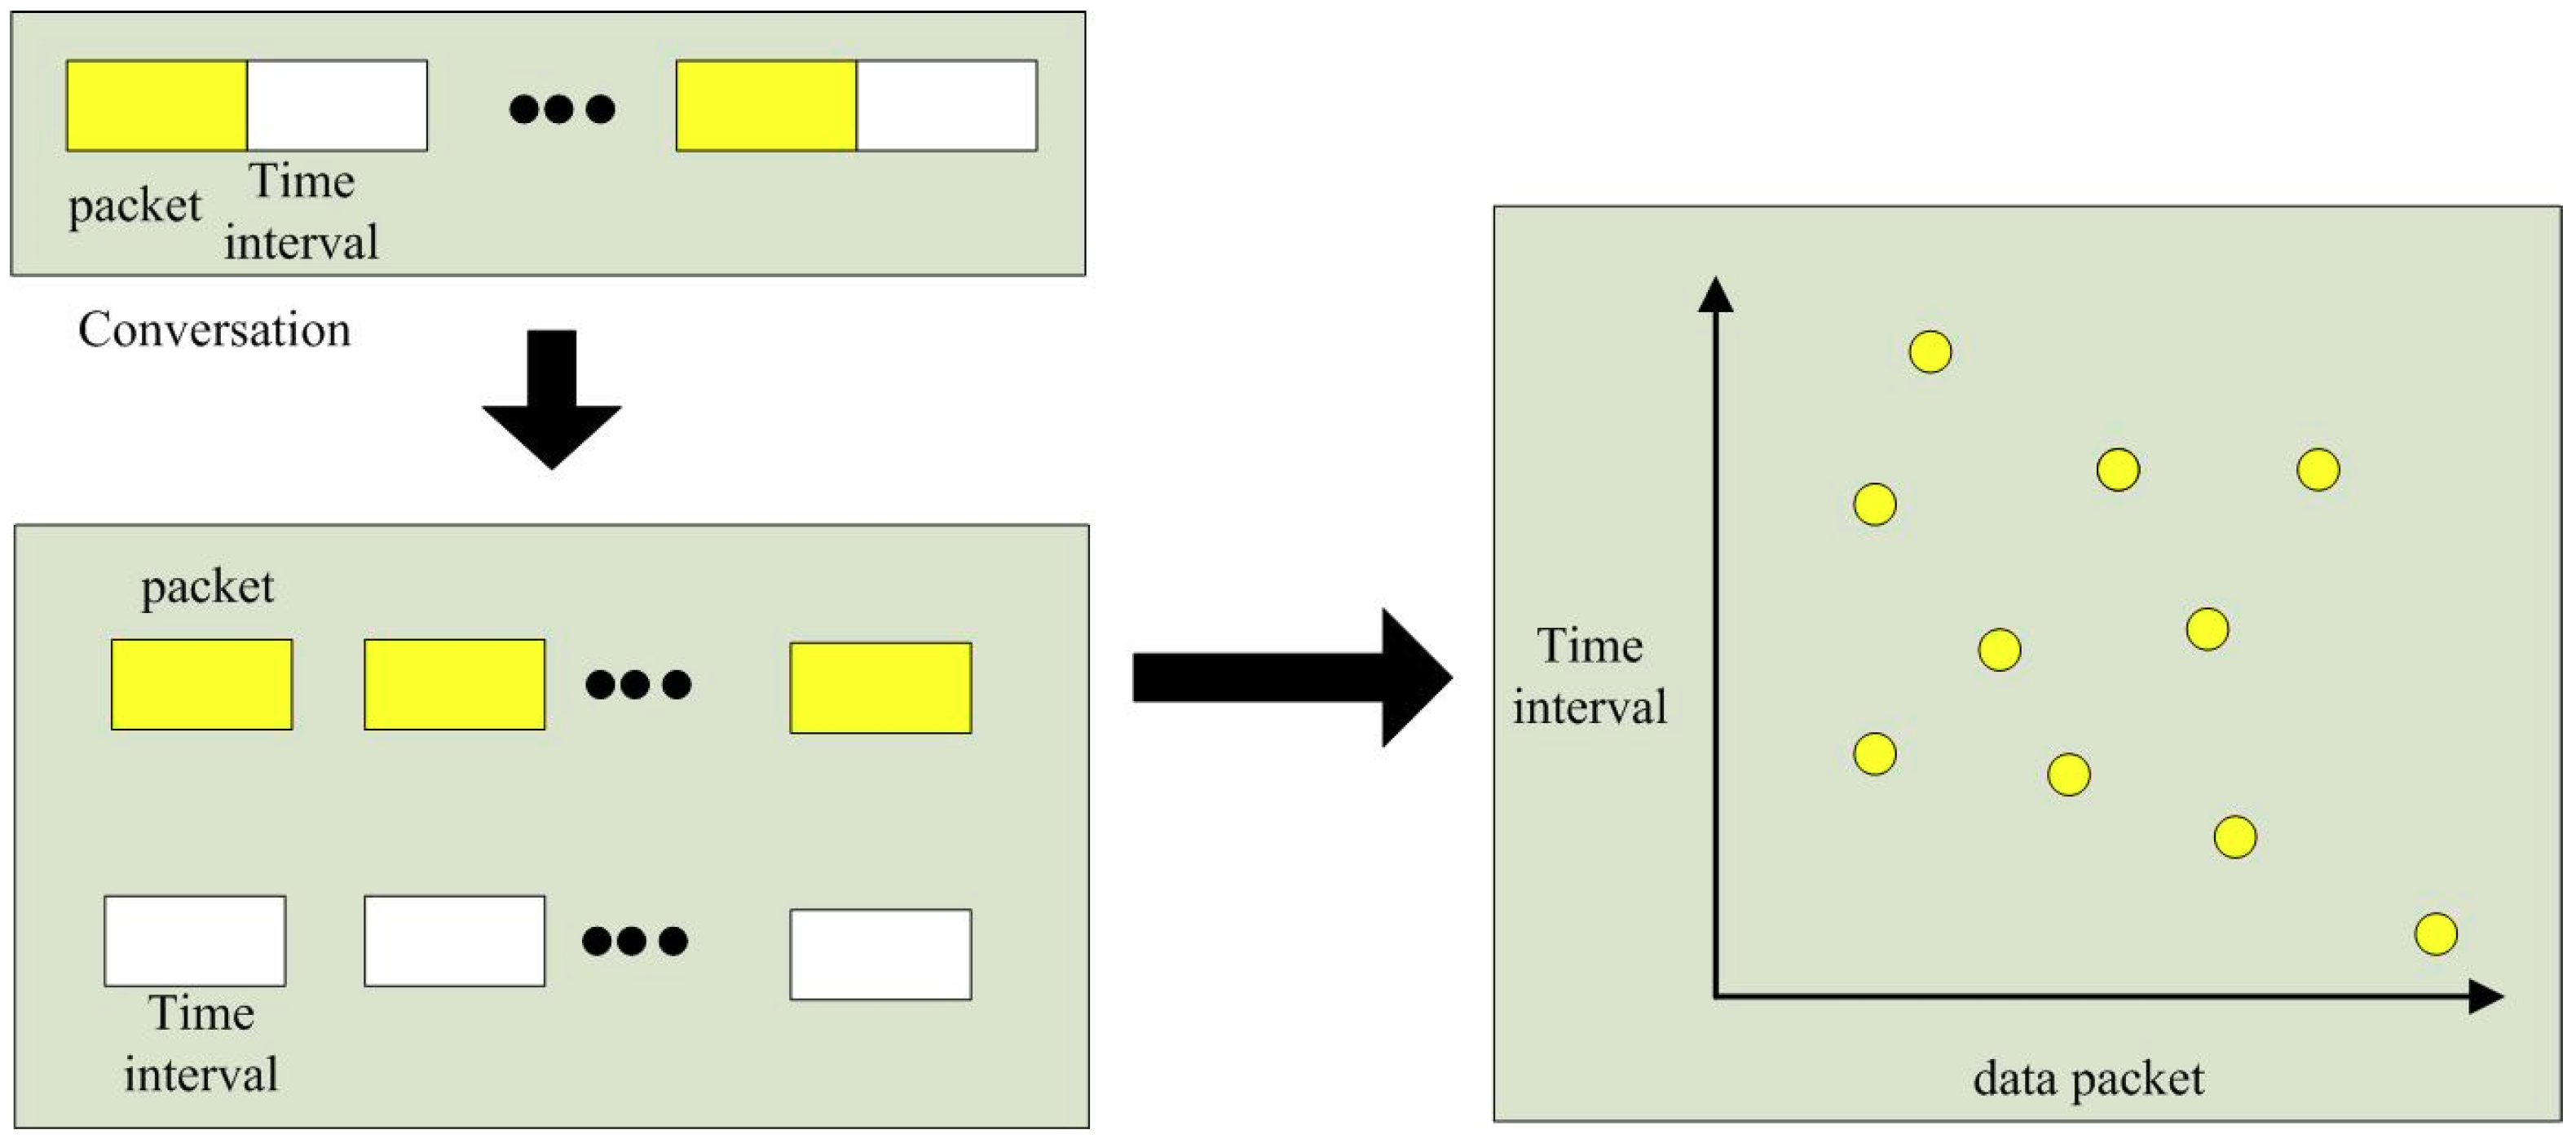
In
Figure 2, the network traffic for the graphics is sketched. The left figure shows the network conversation. Packet size and time interval in traffic are represented as the traffic features. The yellow rectangles represent the packet size and the white rectangles represent the time interval. However, the two features are two separate classed which do not consider the correlation between adjacent values in traditional traffic analysis. In the left figure, the communication process is viewed from the perspective of graphic symmetry concept to understand the connections; there are different “points” in the graphics, the abscissa and ordinate represent packet size and subsequent time interval, respectively. These points contain two types of features, associating the time series of two types of features. The two-dimensional features are represented by the image gray features obtained by the dimensionality reduction algorithm. The information entropy represents how discrete these points are. The values of the Fourier transform represent the magnitude of the energy. The detection model is constructed through the large energy values. Using the machine learning for the “points” that represent the botnet traffic sessions, that can get the energy distribution of the botnet sessions for detecting the P2P botnet.
The previously machine learning used to detect botnets has no feature fusion process after feature selection process. The
Figure 3 describes the process of feature processing in this paper.
At the same time, the one-dimensional Fourier transform was used before and the correlation between packet size and time interval was not taken into account. The feature of a single class in the feature selection result has a loss for the expression of communication features.
In this paper, based on parallel feature correlation, the frequency domain feature sorting results after feature selection are expressed by two-dimensional features and then the feature fusion is used to retain the expression of two-dimensional features for communication traffic, so as to reduce the learning feature types.
2.2. Network Traffic Reduction
Network traffic reduction for the detection of malicious activities is essential for managing enormous amounts of network traffic where resources are restricted (e.g., memory, hard disk). The most difficult part of this process is to identify the behavior of network traffic by inspecting only a small number of packets per flow. These connections are described in the way by which the Botmaster communicates with his Bots [
12] because most well-known P2P Bots communicate using TCP connections [
13] such as Waledac Bot [
14], Storm Bot [
15], Conficker Bot [
16] and Zeus Bot [
17,
18].
The most of the existing Botnet detection systems [
19,
20,
21,
22] rely on deep packet inspection (DPI) to analyze packet content, which is computationally expensive and inefficient to recognize unknown payload signature [
23]. In DPI, the system is assumed to have access to the payload of every packet. This technique can be notably accurate when the payload is not encrypted. However, the majority of new malware generation applies evasion methods such as encryption of payload, protocol encapsulation and obfuscation [
24].
Furthermore, examining all packets on a high-speed network is an expensive task because the speed of networks and the amount of the packet transferred via networks are increasing daily. Thus, the detection system which applies DPI may suffer from efficiency bounded on processing a large volume of traffic from high-volume or high-speed networks [
23]. The goal of our work is to increase the effectiveness of the detection systems by decreasing the volume of traffic to be analyzed, without affecting the accuracy of the detection process. To achieve this goal, a novel traffic reduction is proposed for a Bot detection framework by selecting only TCP control packets. The framework can efficiently and effectively reduce the amount of traffic that will be entering into the detection system. To the best of our knowledge, this first P2P Bot detection approach applies reduction technique to achieve the efficiency on Botnet detection domain.
In this study, a filtration of TCP control traffic packets is issued to reduce the volume of network traffic and improve the performance of the proposed approach. The filtering includes two steps: First, filtering all traffics related to the TCP protocol; Second, extracting the TCP control packet SYN, ACK, FIN and RST. Algorithm 1 shows the process of reduction network traffic from network traces (.PCAPfiles). In Line 2, an array of TCP_Control_Packets_list is initialized. By iterating over the packets, new packets are added to the array of (TCP_Control_Packets_List) from Line 3 to 15 till the last packet in the file is reached. Line 4examines for TCP packet header and Line 5 selects packets with no payload data. Line 6 gets the packet header. From Line 7 to 10, the code reads the packet, which is TCP and extracts the packets containing SYN, ACK, FIN and RST flags.
| Algorithm 1 Network Traffic Reduction |
1: Procedure reduction (packets)
2: ArrayList<Packet>TCP_Control_Packets_List;
3: For i=1 to size(Packets)
4: IF Packets(i) has (TCP header) then
5: IF Packets (i) has (TCP. payloadSize==0) then
6: pktheader= packet.getHeader(Packets(i));
7: IF((pktheader.flags.syn=1 OR pktheader.flags.ack=1 OR
pktheader.flags.rest=1 OR pktheader.flags.fin=1)
AND NOT (pktheader.flags.cwr=1 OR
pktheader.flags.ecn=1 OR pktheader.flags.push=1
OR pktheader.flags.urg=1))
8: TCP_Control_Packets_List.Add(packets(i));
9: ELSE
10: Discard the Packet;
11: End If
12: End IF
13: End IF
14: End For
15: For i=1 to size(TCP_Control_Packets_List)-1
16: TimeInterval[i]=TCP_Control_Packets_List[i+1].Timestamp-
TCP_Control_Packets_List[i].Timestamp
17: Return TCP_Control_Packets_list, TimeInterval;
18: End procedure |
This module takes network log files (.pcap) as the input. We keep only those packets which have a valid TCP header to reduce the volume of network traffic and improve the performance of the proposed approach. Corrupted packets with the necessary header information missing are discarded. The Source IP, Destination IP, Payload Length (TCP, as applicable) and TimeInterval of each packet are extracted. This information is used to generate conversations and develop an elaborate feature set in future modules.
2.3. Feature Extraction
2.3.1. Two-Dimensional Fourier Transform
The fast Fourier transform (FFT) is widely used in graphic signal processing to establish the transformation relation between the spatial and frequency domains. Due to long and short frequencies, the communication signal is generally regarded as a special two-dimensional graphic. In the actual detection environment, the command and control (C&C) server communication of botnet malware is periodic and will hold up for some time. New botnet can randomly change C&C communication frequency in a certain time window, which will reduce the peak value of the FFT. However, it is still detectable and remains at the same frequency. Therefore, intentionally covert botnet communications can be detected through the peak value of FFT.
In any time series, the majority of the energy is contained in the first few discrete Fourier transform (DFT) coefficients. Therefore, these coefficients are used to capture hidden communication. The effective load length and time interval in each communication are determined with the FFT and the values are sorted in descending order.
Let
N be the length of the sequence to be transformed,
u and
v be the frequency-domain ordinals and
x and
y be the time-domain ordinals. In this paper, the basic features of flow are transformed into frequency domain features to establish the model through the two-dimensional discrete Fourier transformation equation:
where the effective load length and time interval are represented by
. The frequency domain features
can be obtained through the two-dimensional discrete Fourier transformation.
The two-dimensional Fourier transformation formula is used for discrete data processing in which f(x,y) represents a space domain matrix of N × N, where x = 0,1,2,…, N − 1 and y = 0,1,2,…, N − 1. The function F(u,v) represents the Fourier transformation of f(x,y) that can be converted to a trigonometric function representation, where u and v can be used to determine the frequency of the positive cosine. The coordinate system of F(u,v) is referred to as the frequency domain and the N x N matrix defined by u = 0,1,2,…, N − 1 and v = 0,1,2,…, N − 1 is often referred to as the frequency domain matrix. Clearly, the structure of the frequency domain matrix is the same as that of the original space domain matrix. Each point in the frequency domain matrix represents the function of u and v and the combination of these functions in the space domain is the original function f(x,y).
Each session includes the transmission of multiple packets. The frequency domain features of the first seven sessions are selected by descending order and taken as the features selected for machine learning. Since the frequency domain features are two-dimensional and cannot be directly sorted in descending order, they are sorted by the effective load length and time intervals separately to obtain their first seven features. That is when , are features to be selected and likewise when , are features to be selected.
2.3.2. Flow Load Entropy
Random interference in the Internet is inevitable from the perspective of communication. The effective load of the general internet flow is random, and the effective load of many botnet hosts seldom change due to a single communication. We can find single communication data by investigating the change of communication between hosts, which can be used as a way to detect the botnet hosts.
When P2P botnet is changed for detection, the C&C channel can avoid the intrusion detection system (IDS), firewalls and other network interception modes through encryption and confusion technology. The botnet hosts are connected through encryption channels. Since the flow load is encrypted or confused, when the decoded content cannot be obtained, it is difficult to achieve botnet detection through the connection between botnet hosts. However, the encryption algorithm can not only enhance the randomness of characters in the load but also reduce the occurrence probability of each character. Botnet hosts are determined by calculating the information entropy of encrypted channels. A lower occurrence probability of each character reflects the high entropy in the calculation, which means the entropy of the encrypted channel is higher.
Shannon introduced Pohl Seidman’s concept of entropy into information theory and regarded entropy as a measure of the uncertainty of a random event. Therefore, the uncertainty entropy of occurrence is called information entropy:
where
P is the occurrence probability of characters at nodes and
H is the information entropy.
Assume a network information flow C
. The discrete information source is taken as measurement data. Each property in the data is regarded as a set of random events, which are analyzed according to the definition of information entropy. The measurement data include
N feature attributes and the
i-th attribute appears
times. The information entropy is hence defined as:
where
is the total times that all features occur. The range of possible values for the information entropy is
. When the value is 0, the maximum concentration distribution is presented. There is only one eigen value in the network. When the value is
, the maximum dispersed distribution is presented. The value of each feature is the same,
. The disorder degree of network information flow can be judged by calculating the information entropy. In this way, the change of network flow features can be intuitively understood to detect an anomaly.
Since flow load is encrypted or confused, it is difficult to extract the features of the encrypted channels and detect botnets. However, the encryption algorithm enhances the randomness of characters in load and reduces the occurrence probability of each character. That is, the entropy of the encrypted channel is higher. Therefore, channel encryption is judged through entropy in order to find a suspicious flow of botnets, which is used for machine learning feature.
2.3.3. Number of Packets Exchanged per Second in a Time Interval T
In the process of computer communication, a lot of information is transmitted, which is summarized by researchers as common machine learning features. The number of packets exchanged per second (PPS) in a time interval T can reflect the frequency of node connection.
Communication flow can be captured through Wireshark software to get the basic information in flow. The number of packets exchanged per second can be calculated. The session time is and the number of packets in a session is , hence PPS = E/T.
2.4. Symmetry Property of Parallel Feature Fusion
2.4.1. Feature Selection
After flow features are extracted through the two-dimensional Fourier transform model, the relevance between the selected feature and the information flow needs to be further verified. In order to facilitate the computation of machine learning, it is necessary to select features with high relevance. The Relief-F algorithm can solve this problem by regarding it as multiple classes. The method aims to find the nearest neighboring points of the current sample and calculate them synthetically.
ReliefF is generally utilized in the data pre-processing phase as a feature selection approach. The key idea of the ReliefF is to evaluate the quality of attributes according to how well their values discriminate between the instances that are near to each other [
25]. The ReliefF algorithm essentially consists of three important parts: firstly, estimation of the nearest miss and nearest hit; secondly, estimation of the weight of a feature; thirdly, return a ranked list of features.
Assume that a data set D contains |b| sorting categories. For example, if
belongs to the
k-th category (
k ∈ {1,2,⋯,|b|}), the Relief-F algorithm finds the nearest neighbor
of
in the
k-th category. Afterwards, the nearest neighbor
(
l = 1,2,⋯,|b|;
l ≠
k) of
is considered in each category of the sample except for that of
, the
k-th category. The component of attribute
j corresponding to the relevant statistics is:
where
p1 is the proportion of data set D in category
l. Each category gets a corresponding weight in the data set and the evaluation algorithm is used to calculate and evaluate the features after Fourier transform. The features with highly relevant classification results are selected for machine learning in order to reduce the computational cost. The pseudo code of the ReliefF algorithm is given in Algorithm 2 [
26]. Algorithm 2 shows the importance ranking of features estimated by the Relief-F algorithm.
| Algorithm 2 Pseudo code of ReliefF |
1: Input: the dataset contains an instance with class labels.
2: Output: W (f) features ranking.
3: Number of features = n;
4: Set all weight W (f) = 0;
5: Number of iterations = m;
6: For i = 1 to m do
7: Randomly select an instance Ri;
8: Find k nearest hit Hi;
9: Foreach class c <> class (Ri) do
10: From class c find k nearest misses Mj(c);
11: End For
12: For f = 1 to n
13:
14: End For
15: End For
16: Return W(f); |
The result obtained by the algorithm is the weight ranking of the one-dimensional features to be selected. We divide the features that rank high into packet size and time interval and take the parallel features related to the selected features as the two-dimensional features after screening. In this way, not only the highly correlated features selected by the algorithm are taken into account but also the parallel features related to them are taken as learning objects. That is when , are features to be selected. and likewise, when , are features to be selected. So, the two-dimensional features set selected by the algorithm is .
2.4.2. Feature Fusion
The difference of feature extraction or measurement might lead to the numerical unbalance between the two features A and B of the same pattern [
27]. For instance, given two feature vectors, A = (10, 11, 9)
T and B = (0. 1, 0. 9)
T, corresponding to one sample, assume that they are combined as C = A + iB, which implies that the feature A plays a more important role than B in the process of fusion. Consequently, in order to counteract the numerical unbalance between features and gain satisfactory fusion performance, our suggestion is to initialize the original feature A and B, respectively, before the combination.
However, if the above feature initialization method is employed, it is more difficult to evaluate the combination coefficient i when the dimensions of A and B are unequal. Here, we give the selection scope by experience. Suppose the combination form of A and B is denoted by C = A + iB, the dimensions of A and B are n and m, respectively, and n = m, let i = 1.
The two-dimensional features set is fused into the one-dimensional features set . Since the packet size in the parallel feature corresponds to the time interval one by one, n=m, so the combination coefficient i = 1 is taken, the data set after fusion .
3. Experimental Methods and Details
3.1. Data Preparation
To evaluate the performance of the model in detecting botnet, an experimental flow is studied, which is retrieved from the ISOT data set issued by the International Conference on Network Security [
28]. This data set represents the mixed flow extracted after integrating the representative P2P Botnet Storm, Waledac and common network flow through local area network (LAN) communication. There are a total of 10,000 packets, 5.8% of which represent botnet flow. A total of 78,000 conversations of ‘clean’ data were sampled from the entire clean dataset. 10,000 conversations each of Storm and Waledac were sampled from their respective datasets.
Black Energy is a new botnet developed by Russian hackers and it was originally used for DDOS attacks, spam distribution and bank fraud. Recently, it has been used to attack government institutions and private enterprises through a series of actions. Black Energy uses encryption technology to avoid the detection of the executable files by anti-virus software [
29].
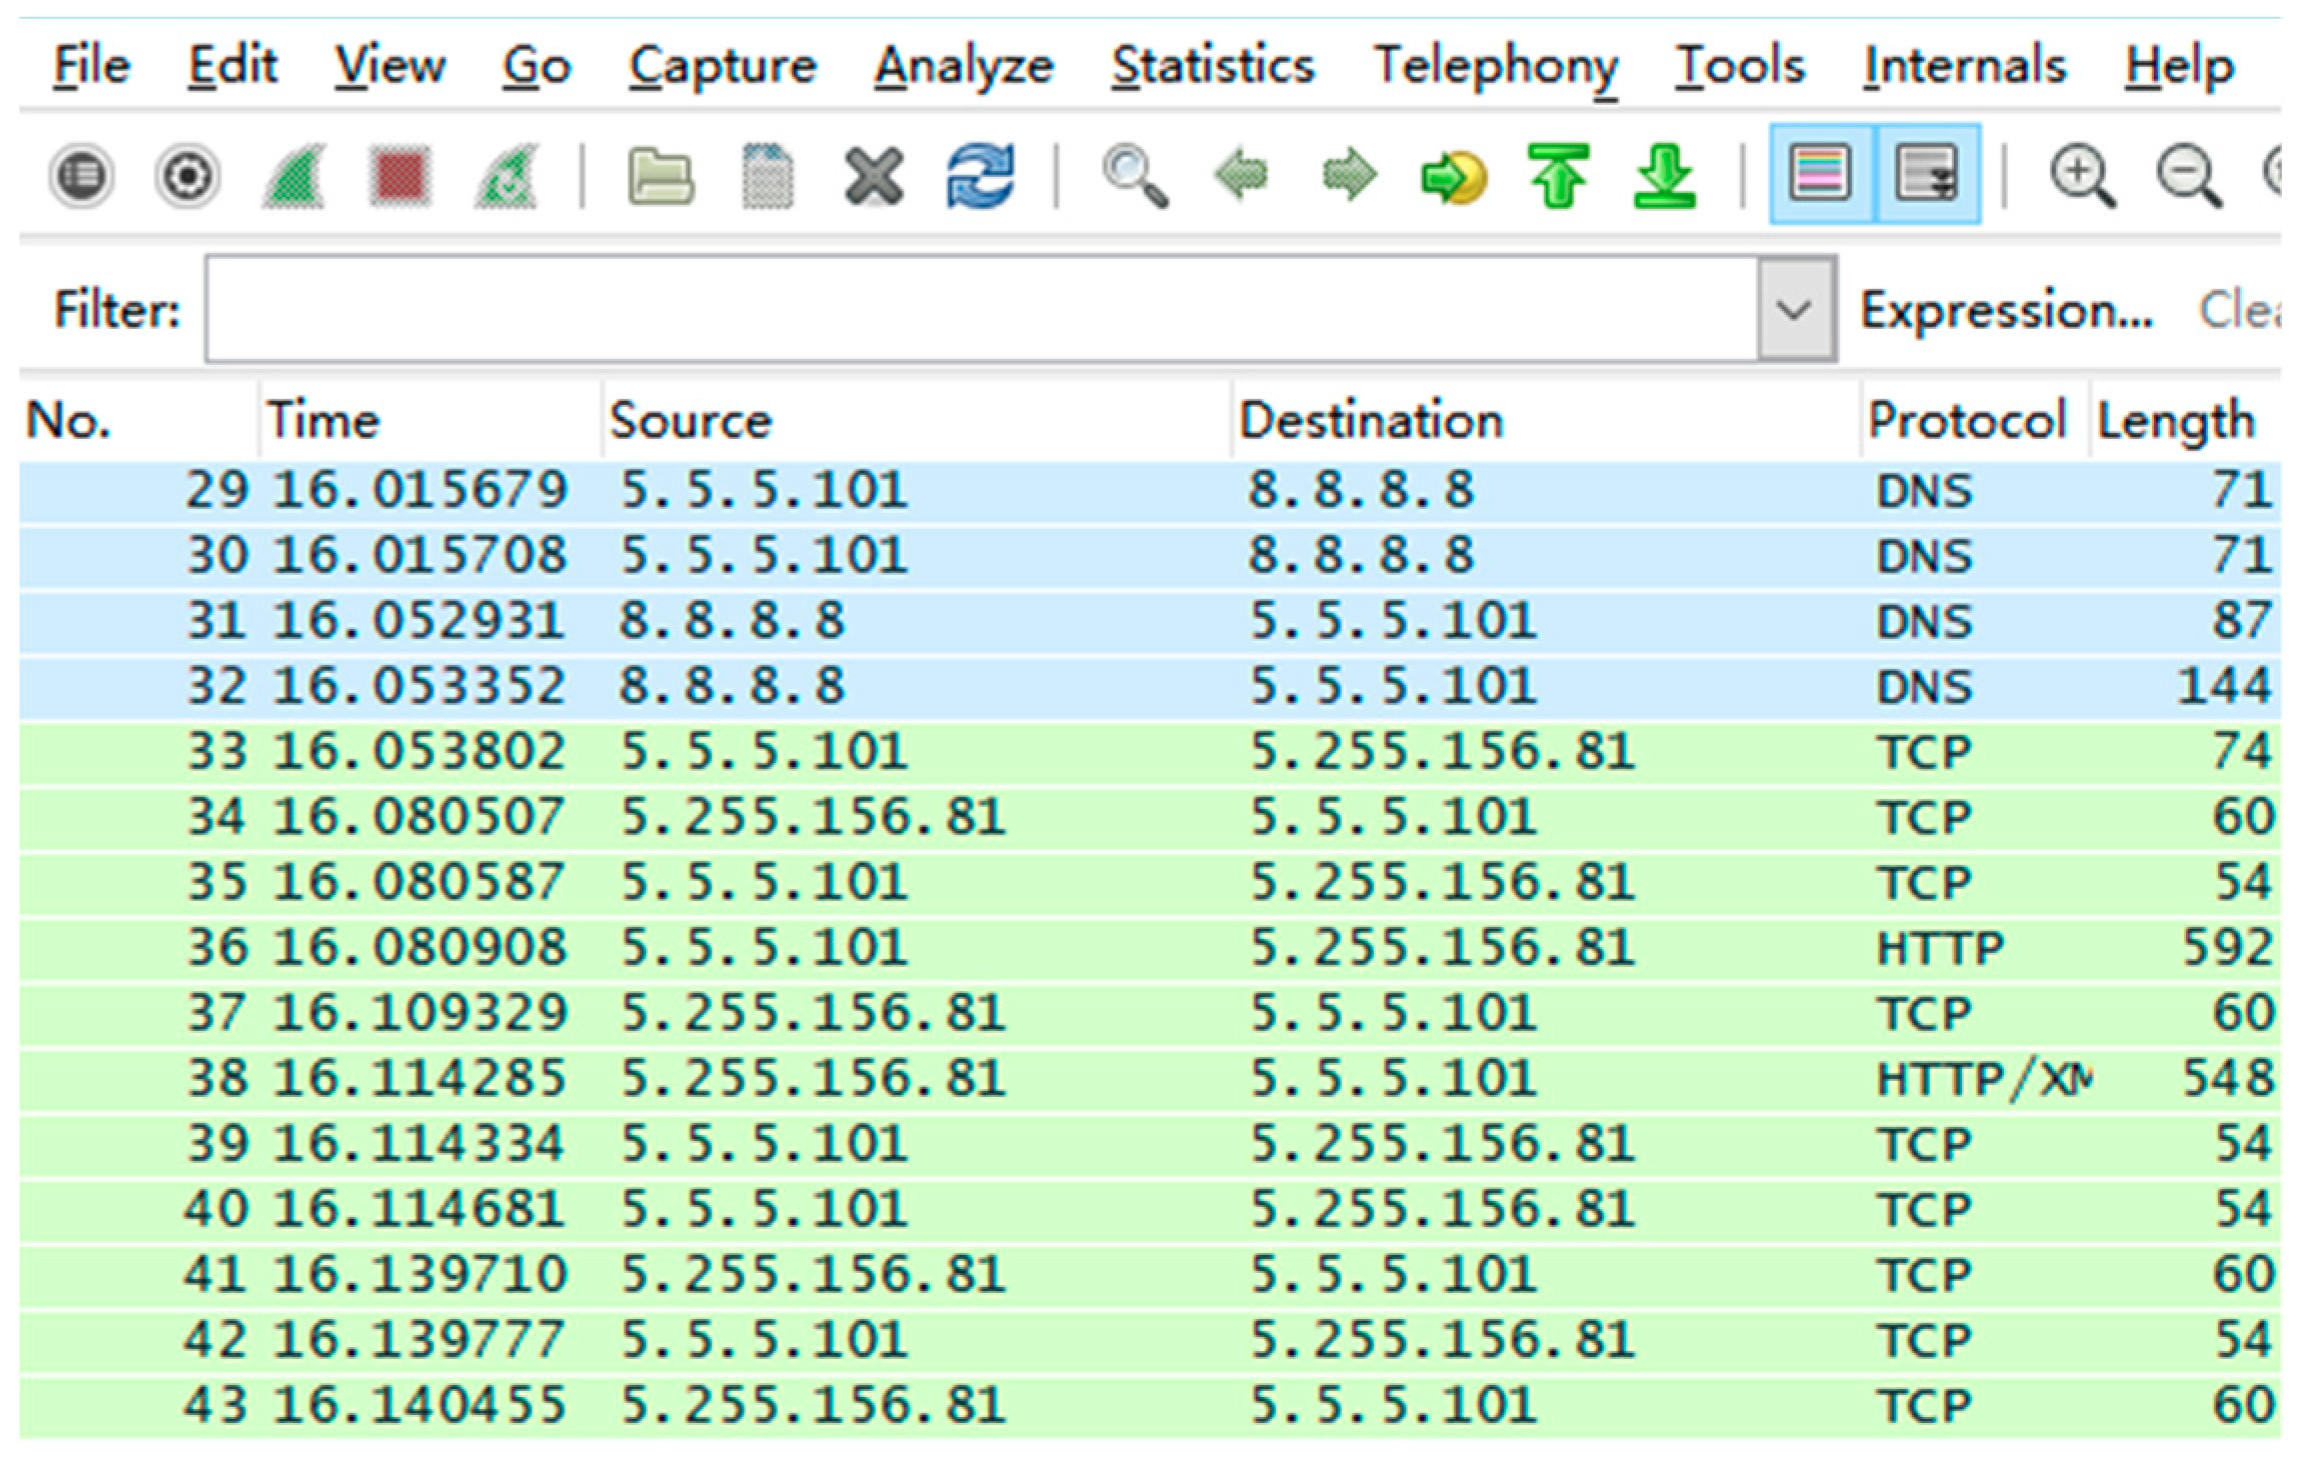
Based on Wireshark, the network flow data of such network monitoring software is obtained with the data packet as a unit. Because of the format and software representation, it cannot be directly used for detection and analysis. The traffic we get is made up of packets in the network. To extract the characteristics of the traffic, these packets need to be divided into different sessions. The output of the Packet filter module is fed to this module to create conversations. Conversations are created by aggregating packet-level data. Each Conversation is identified by <IP1, IP2> and a FLOWGAP parameter. FLOWGAP is defined as the maximum permissible inter-arrival time between 2 packets in a conversation. If a packet arrives which belongs to the IP pair of a conversation and its timestamp lies within FLOWGAP time from the beginning or the end of that conversation, the packet will be added to the conversation. Else a new conversation will be created for that IP pair.
In this paper, we use the Wireshark to open and replay the ISOT data for own dataset and
Figure A1 and
Figure A2 are attached in
Appendix, after using the Python code to filter, we can get the data in session form, which are classified via the conditions:
The communication between two endpoints is regarded as the same session.
In the same session, when the sending and receiving interval is T > 300 s, it is regarded as a second separate session.
The packet features are conducted with the two-dimensional discrete Fourier transformation equation and transformation results of each packet and time interval are obtained, as described in
Section 2. In each packet selected in this paper, the data with the first seven values in two dimensions are selected as alternative features. Therefore, we obtain at most 14 relevant features in a session. The number of packets exchanged per second and information entropy are also calculated. Therefore, a maximum total of 16 alternative features are obtained.
The features of the Fourier transform are represented by FFT. Through the Relief-F feature selection algorithm, 14 relevant features are obtained, as shown in
Table 1.
The FFT1 represents the feature of packet size after the FFT and the FFT_1 represents the feature of time interval after the FFT. Through the evaluation algorithm, it can be seen that, after Fourier transformation, the higher the correlation between the frequency features and the classification results, the better different classifications can be reflected. Moreover, the relevance has dropped by 4. Therefore, we choose the first four Fourier transformation values and the traditional features as detection features.
The parallel features corresponding to FFT1 are represented by FFT1′ and the parallel features corresponding to FFT_1 are represented by FFT_1′, so the data set after fusion .
3.2. Classification Calculation
The features with high relevance in the last four groups of Fourier transformation are obtained through the feature selection algorithm. The information entropy and the number of packets exchanged per second are taken as additional features used in machine learning.
The mixed flow data of the ISOT data set and the new hidden botnet Black Energy are selected as the data set. The common Storm and Waledac botnet are extracted from the ISOT data set. Therefore, there are three kinds of botnets, namely, Storm, Waledac and Black Energy in the mixed flow. In the meantime, the ISOT data set includes multiple P2P common software flows. Different flows are marked and classified to form a mixed flow dominated by benign flow and botnet flow accounts for 5.3%.
The proposed approach is validated using several supervised machine learning algorithms. The traditional flow-based classification approach may not give a correct view of the network communications in P2P applications. This paper solves the classification problem by using three algorithms—the K-nearest neighbor, the REP tree and the support vector machine (SVM). The machine learning of the three algorithms is completed by weka software and
Figure A3,
Figure A4 and
Figure A5 are attached in
Appendix.
For each algorithm, we utilize the training data set with 10-time cross validation to ensure the randomness of the training data and the test data. We use the K nearest neighbors’ algorithm because of its inherent simplicity which does not over-fit the training data [
30,
31]. Based on experience, the adjacent number is set to be ten. The REP tree is a fast algorithm and it can prune unrelated descriptors. To prevent from over learning which can result in erroneous accuracy, the maximum depth limit of the representative tree is six. Although the training precision is reduced to some extent, it is conductive to avoiding over learning and achieving the accuracy of detection results for botnets. We also present our results with Support Vector Machines (SVM) that is a supervised learning approach and it is one of the three major learning types in machine learning [
32,
33,
34,
35,
36,
37,
38]. SVMs are known to be “large margin classifiers” and we expect them to perform well in situations which require good generalization. Support vector machines can deal with complex data. The paired classification method is used to solve the multi-class problem.
4. Experimental Result Comparison
To evaluate the performance of the proposed feature extract method, measures such as accuracy, recall and the False positive rate are calculated as follows:
- –
True positive (TP) the number of malicious behaviors correctly detected as malicious activities.
- –
True negative (TN) the number of normal behaviors correctly detected as normal activities.
- –
False positive (FP) the number of normal behaviors detected as malicious activities.
- –
False negative (FN) the number of malicious behaviors detected as normal activities.
Accuracy indicates the percentage of correct predictions of all instances.
Detection rate (DR), also called recall, indicates the percentage of Bot instances that were predicted as Bot instances.
False positive rate (FPR) shows the percentage of legitimate instances misclassified as Bot instances.
The idea of this paper is verified through comparative experiments. Firstly, three machine learning algorithms are used to detect the method in this paper. The three different machine learning algorithms have different detection results for the botnets in the dataset. The corresponding accuracy, recall and FPR are listed in
Table 2.
It can be observed that the three machine learning methods have high accuracy rates and recall rates for Storm botnet with the new features and the FPR are low. The accuracy rate of the K-nearest method in Waledac detection is relatively low but the accuracy rate of the SVM method in Waledac detection is only 89.2%. According to the comparison results, the REP tree algorithm has better detection results and the accuracy rates for the Waledac and Storm botnet are up to 97%. Black Energy uses basic encryption technology to make the executable file escape the detection of anti-virus software, which disturbs the communication through Base64 coding. Although the detection precision is lower than that of the other two kinds of botnet detection, the detection level is satisfactory.
By verifying the detection through machine learning,
Figure 4 shows that feature extraction through two-dimensional Fourier transform is effective for the detection of botnet. This method gives full play to the flexibility of data. It can get better accuracy by extracting fewer original features of botnet and expand the idea of botnet detection.
In order to further verify the efficiency of the method, the results of the two-dimensional Fourier transformation are compared with the results of other methods. Traditional features are those with the largest number of feature categories. One-dimensional Fourier transform reduces feature categories. In this paper, feature fusion of two-dimensional Fourier transform further reduces feature categories. We detect botnet through the traditional features and the features of good detection results selected by previous researchers are chosen, including the average size of the packet, the number of the packet in a session, the size of the first packet in a session and the total number of sessions in each address. Similarly, machine learning methods are used to detect and obtain the results, as shown in
Table 3.
According to the comparison of results in
Table 2 and
Table 3, we can see that the feature detection using Fourier transform is higher than that of traditional feature detection. Particularly, the detection accuracy and the recall rate are significantly improved in the detection of encrypted network.
Compared with the single Fourier transformation method of literature [
7], the average detection accuracy results of different machine learning methods are shown in
Table 4.
As shown in
Table 4, in the two-dimensional Fourier transformation model, both the accuracy and the recall rates are improved compared with those of one-dimensional Fourier transformation under the same machine learning algorithm.
As shown in
Table 5, we find that the detection accuracy of the REP tree algorithm is better than the other two machine learning algorithms. The number of features can significantly influence the machine learning results. The accuracy and the recall rates of the REP tree algorithm detection are compared by decreasing the number of machine learning features. The average packet size, the number of packets in a session and the size of the first packet in a session are selected as the traditional features and other three categories of features of the one-dimensional and two-dimensional Fourier transformation methods are included. The results are shown in
Table 6.
As shown in
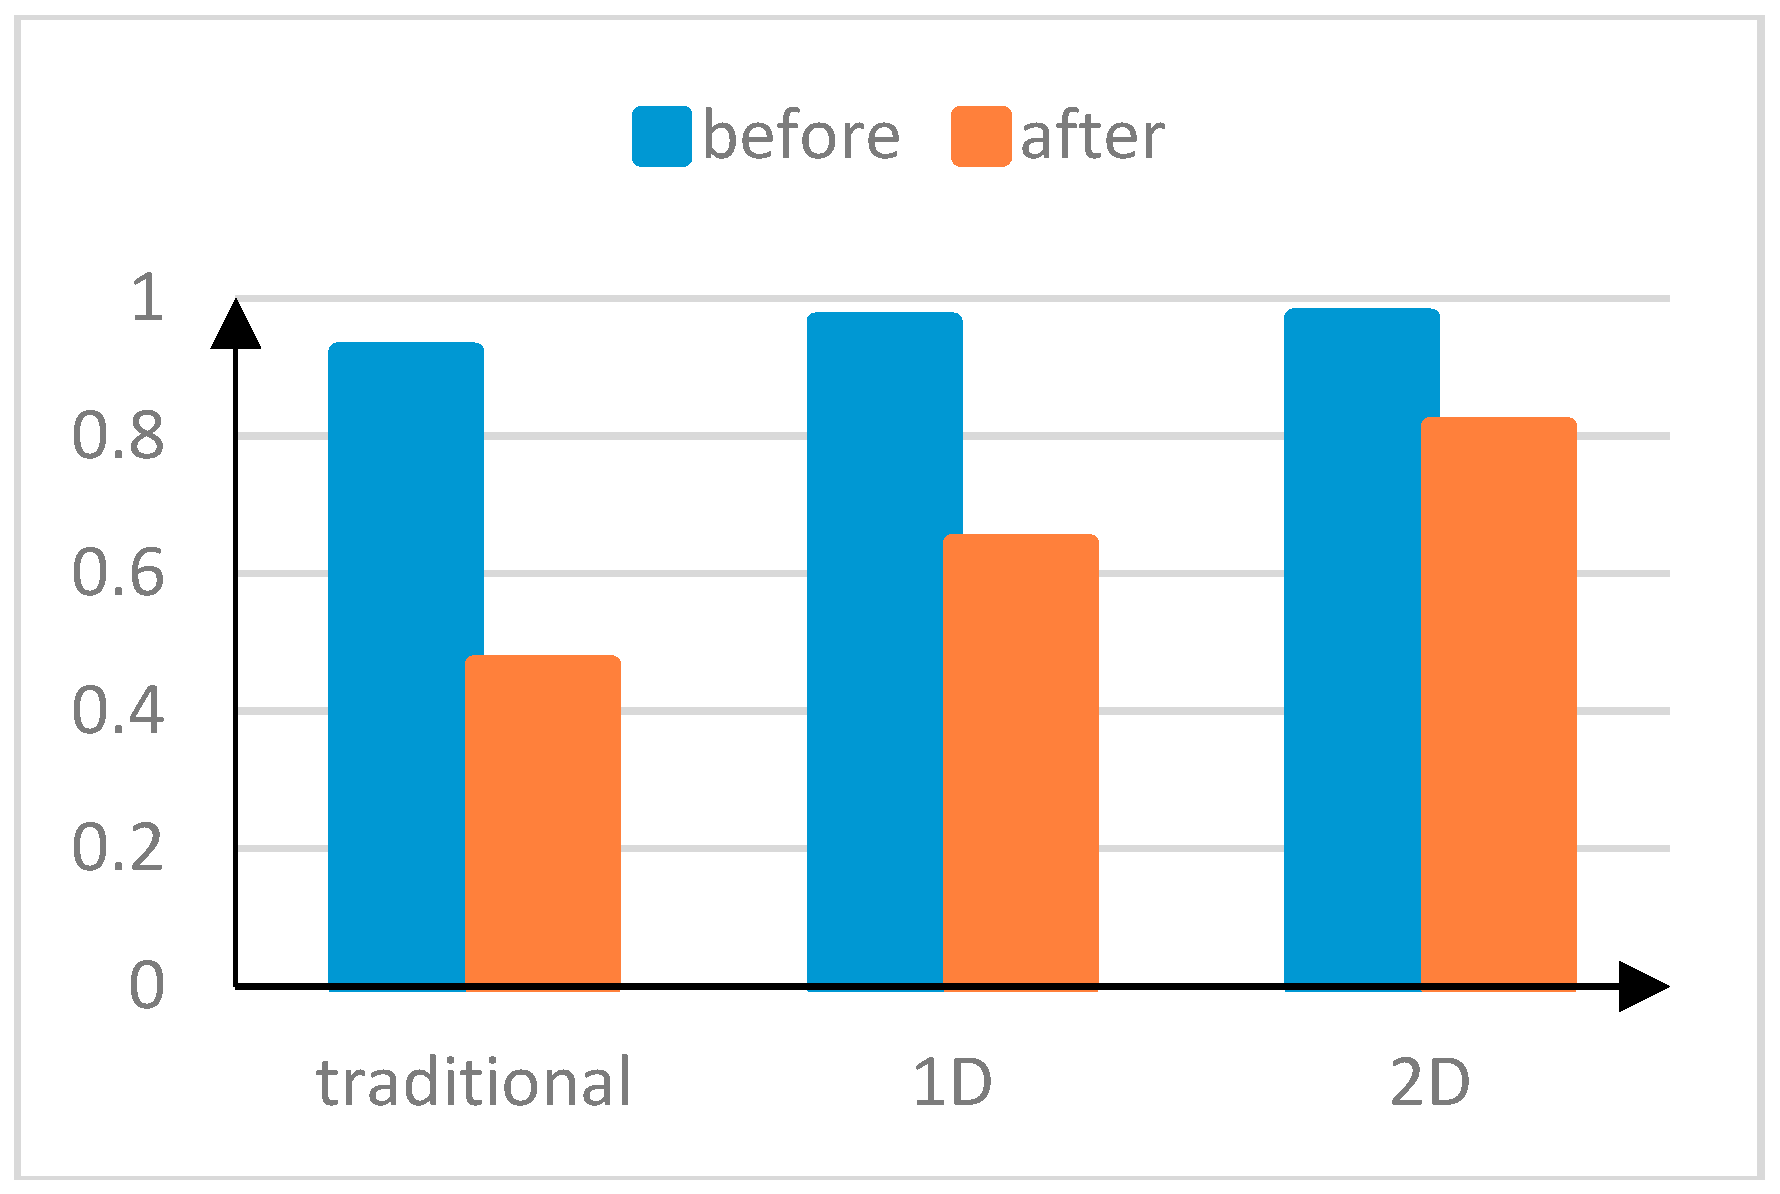
Figure 5, the accuracy rate of the traditional features is lower after reducing the number of feature categories. The feature detection results of the one-dimensional Fourier transformation also significantly decrease. The decrease amplitude of the two-dimensional Fourier transformation is smaller compared with the other methods and its superiority in detection accuracy is enhanced.
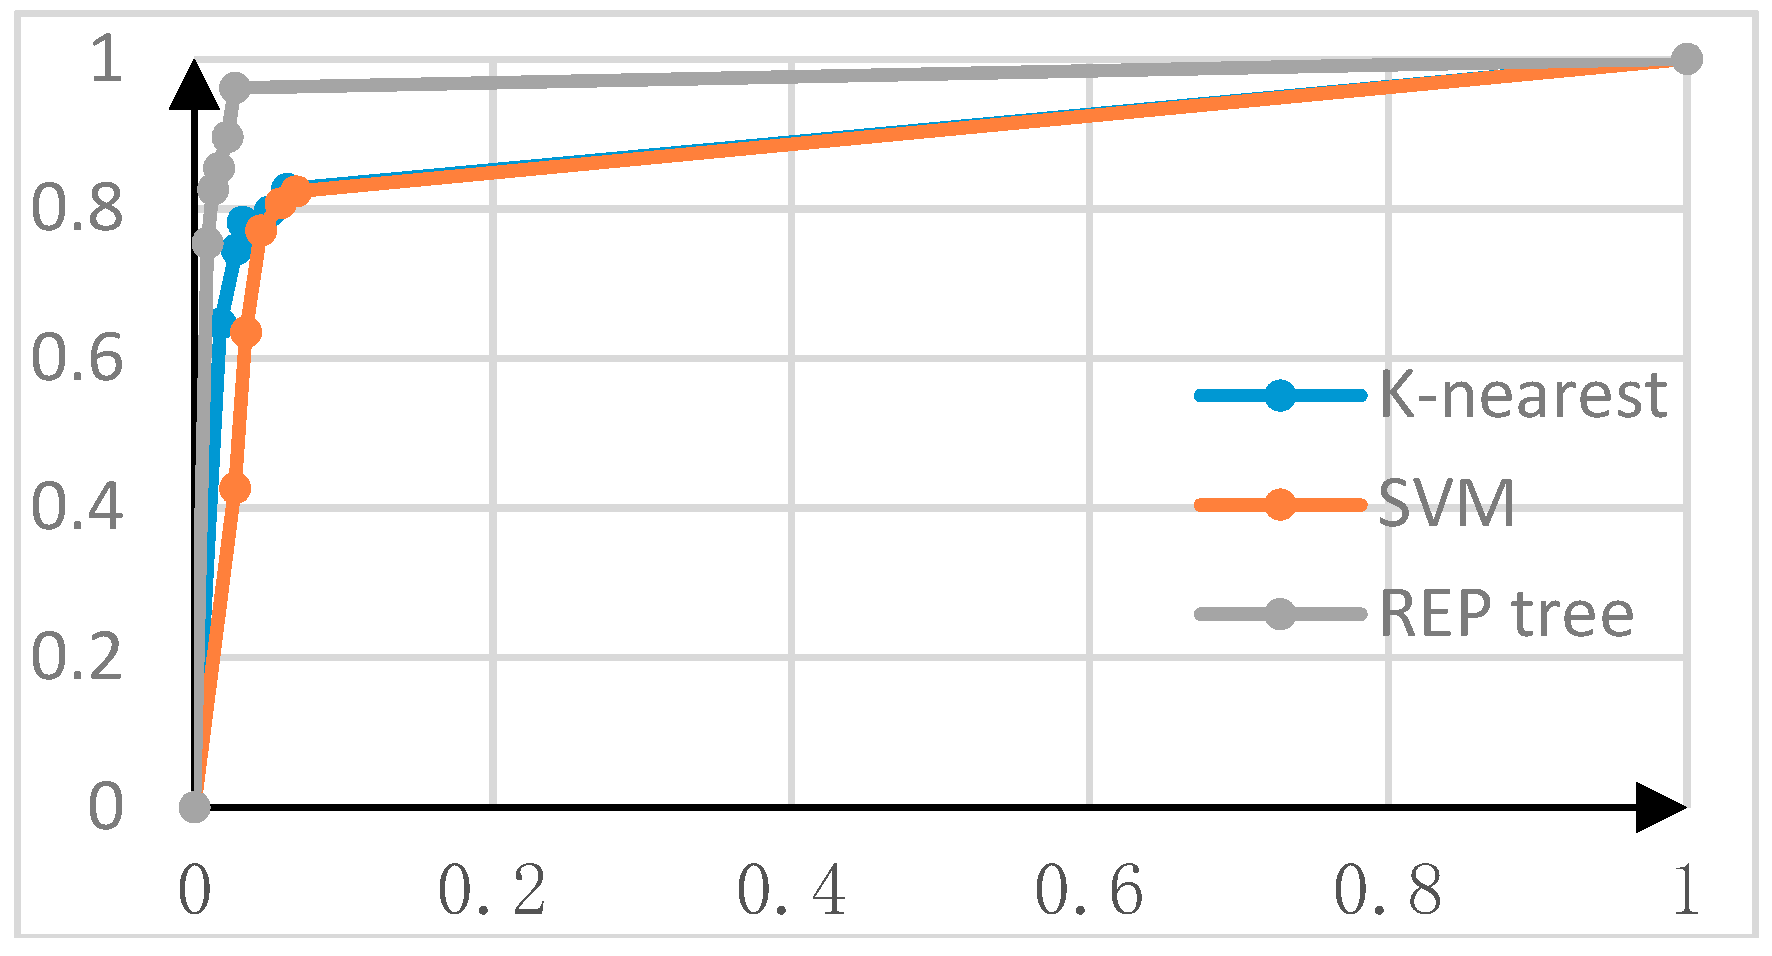
The ROC curve is used to indicate the detection effect of different algorithms on the experimental data. The horizontal coordinate represents the FPR, while the vertical coordinate represents the recall rate. The area under the ROC curve is called the AUC area, which represents the detection effect of the corresponding method. While a better detection rate is signified by an AUC area close to one, denotes adequate detection. When the area is less than 0.5, the detection is invalid.
As shown in
Figure 6 and
Figure 7, the detection accuracy can be guaranteed in the one-dimensional or two-dimensional detection methods. Additionally, the AUC of the REP tree algorithm is the largest, which is the closest to one. Therefore, its detection is the best.
As shown in
Figure 8, after reducing the number of features, the AUC for the traditional features is less than 0.5, which shows that the traditional detection method is basically invalid. By comparing the one-dimensional and two-dimensional methods, it can be found that the two-dimensional Fourier transformation method is advantageous under the reduced features set. In this case, the accuracy can reach 70% and the false positive rate is as low as 20%.
In summary, the proposed method is effective in botnet detection and has high detection accuracy. Moreover, it has significant detection for encrypted botnet and improves the detection accuracy when there are fewer categories of features.


