Grey Regulatory Focus Theory Weighting Method for the Multi-Criteria Decision-Making Problem in Evaluating University Reputation


Abstract
:
1. Introduction
2. Literature Review
2.1. Hybrid MCDM Methods
2.2. Grey System Theory
2.3. Regulatory Focus Theory
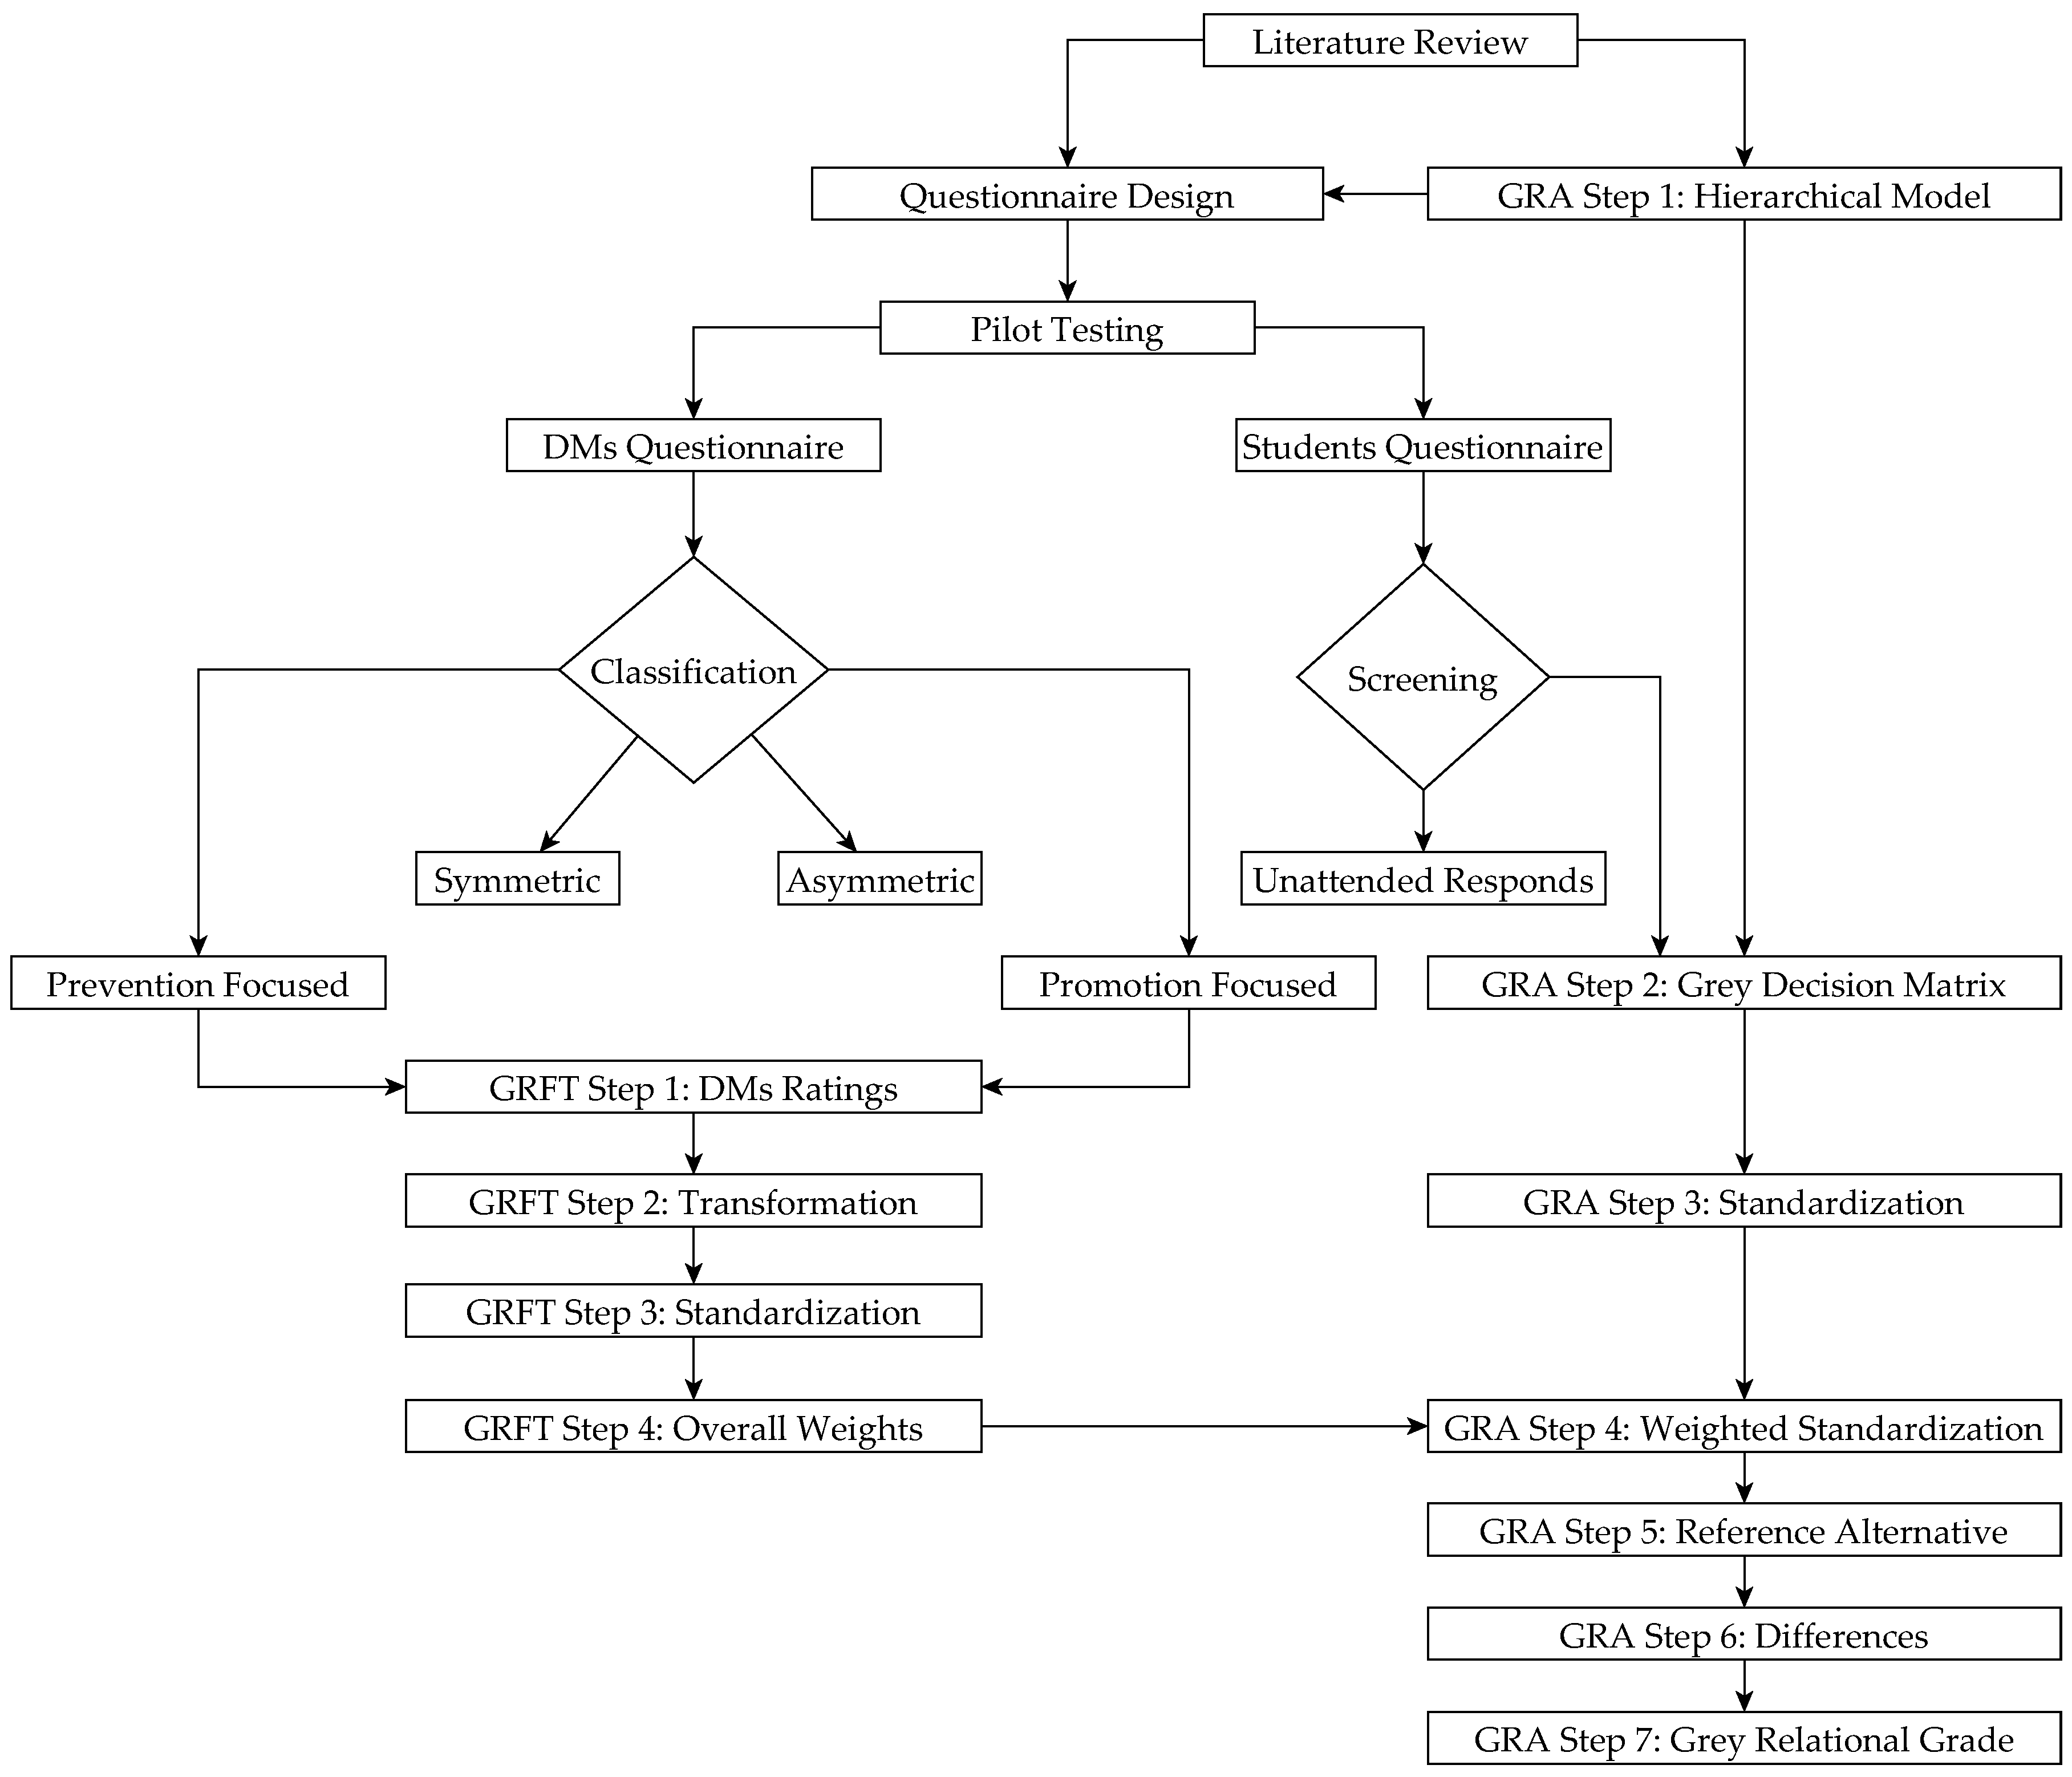
3. Methodology
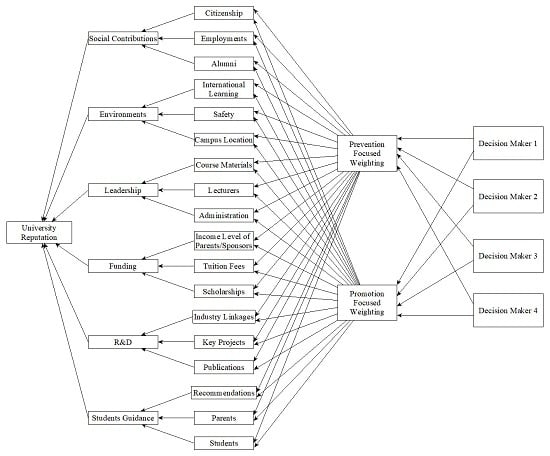
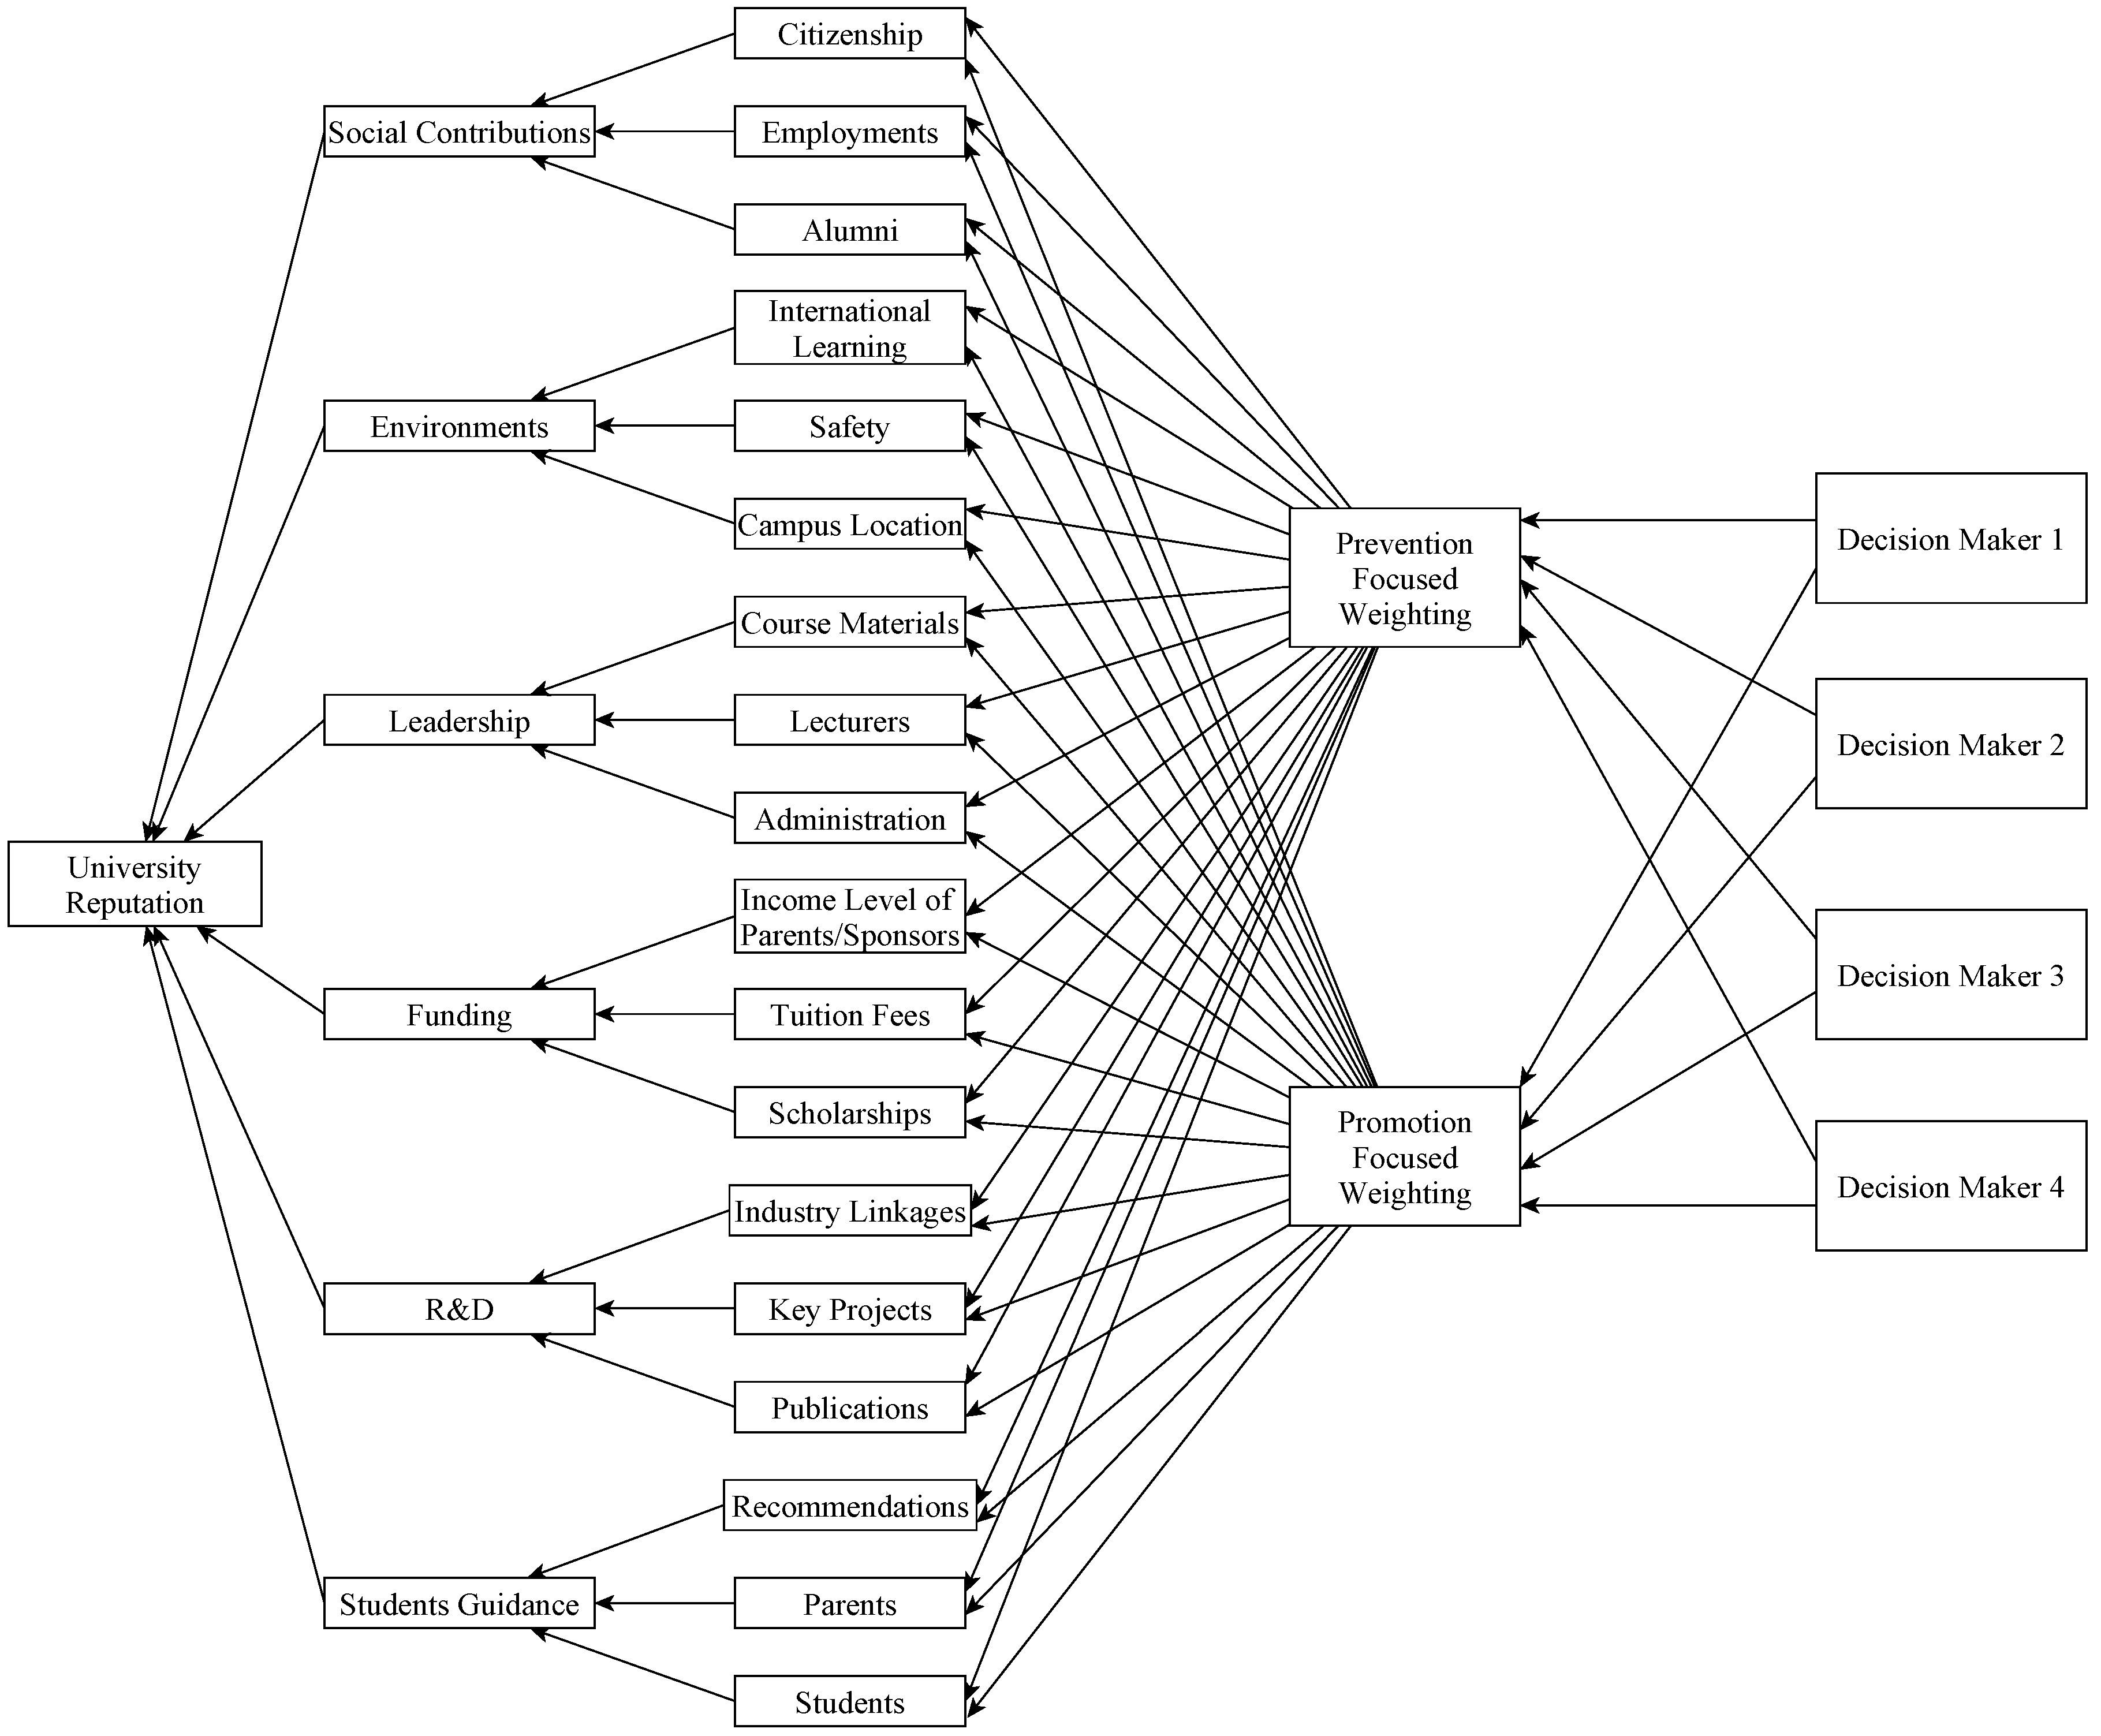
3.1. Measurement and Weighting Criteria
3.2. Grey Regulatory Focus Theory (GRFT) Weighting Method
- Addition,
- Multiplication,
- Subtraction,
- Division,
- For the first-level criteria. The standardized weight for the first-level criteria, is the grey weight for the th criteria is where and .Thus,
- For the second-level criteria. The standardized weight for the second-level criteria, is the grey weight for the criteria is where and .Thus,
3.3. Grey Relational Analysis with Grey Numbers
4. Results and Analysis
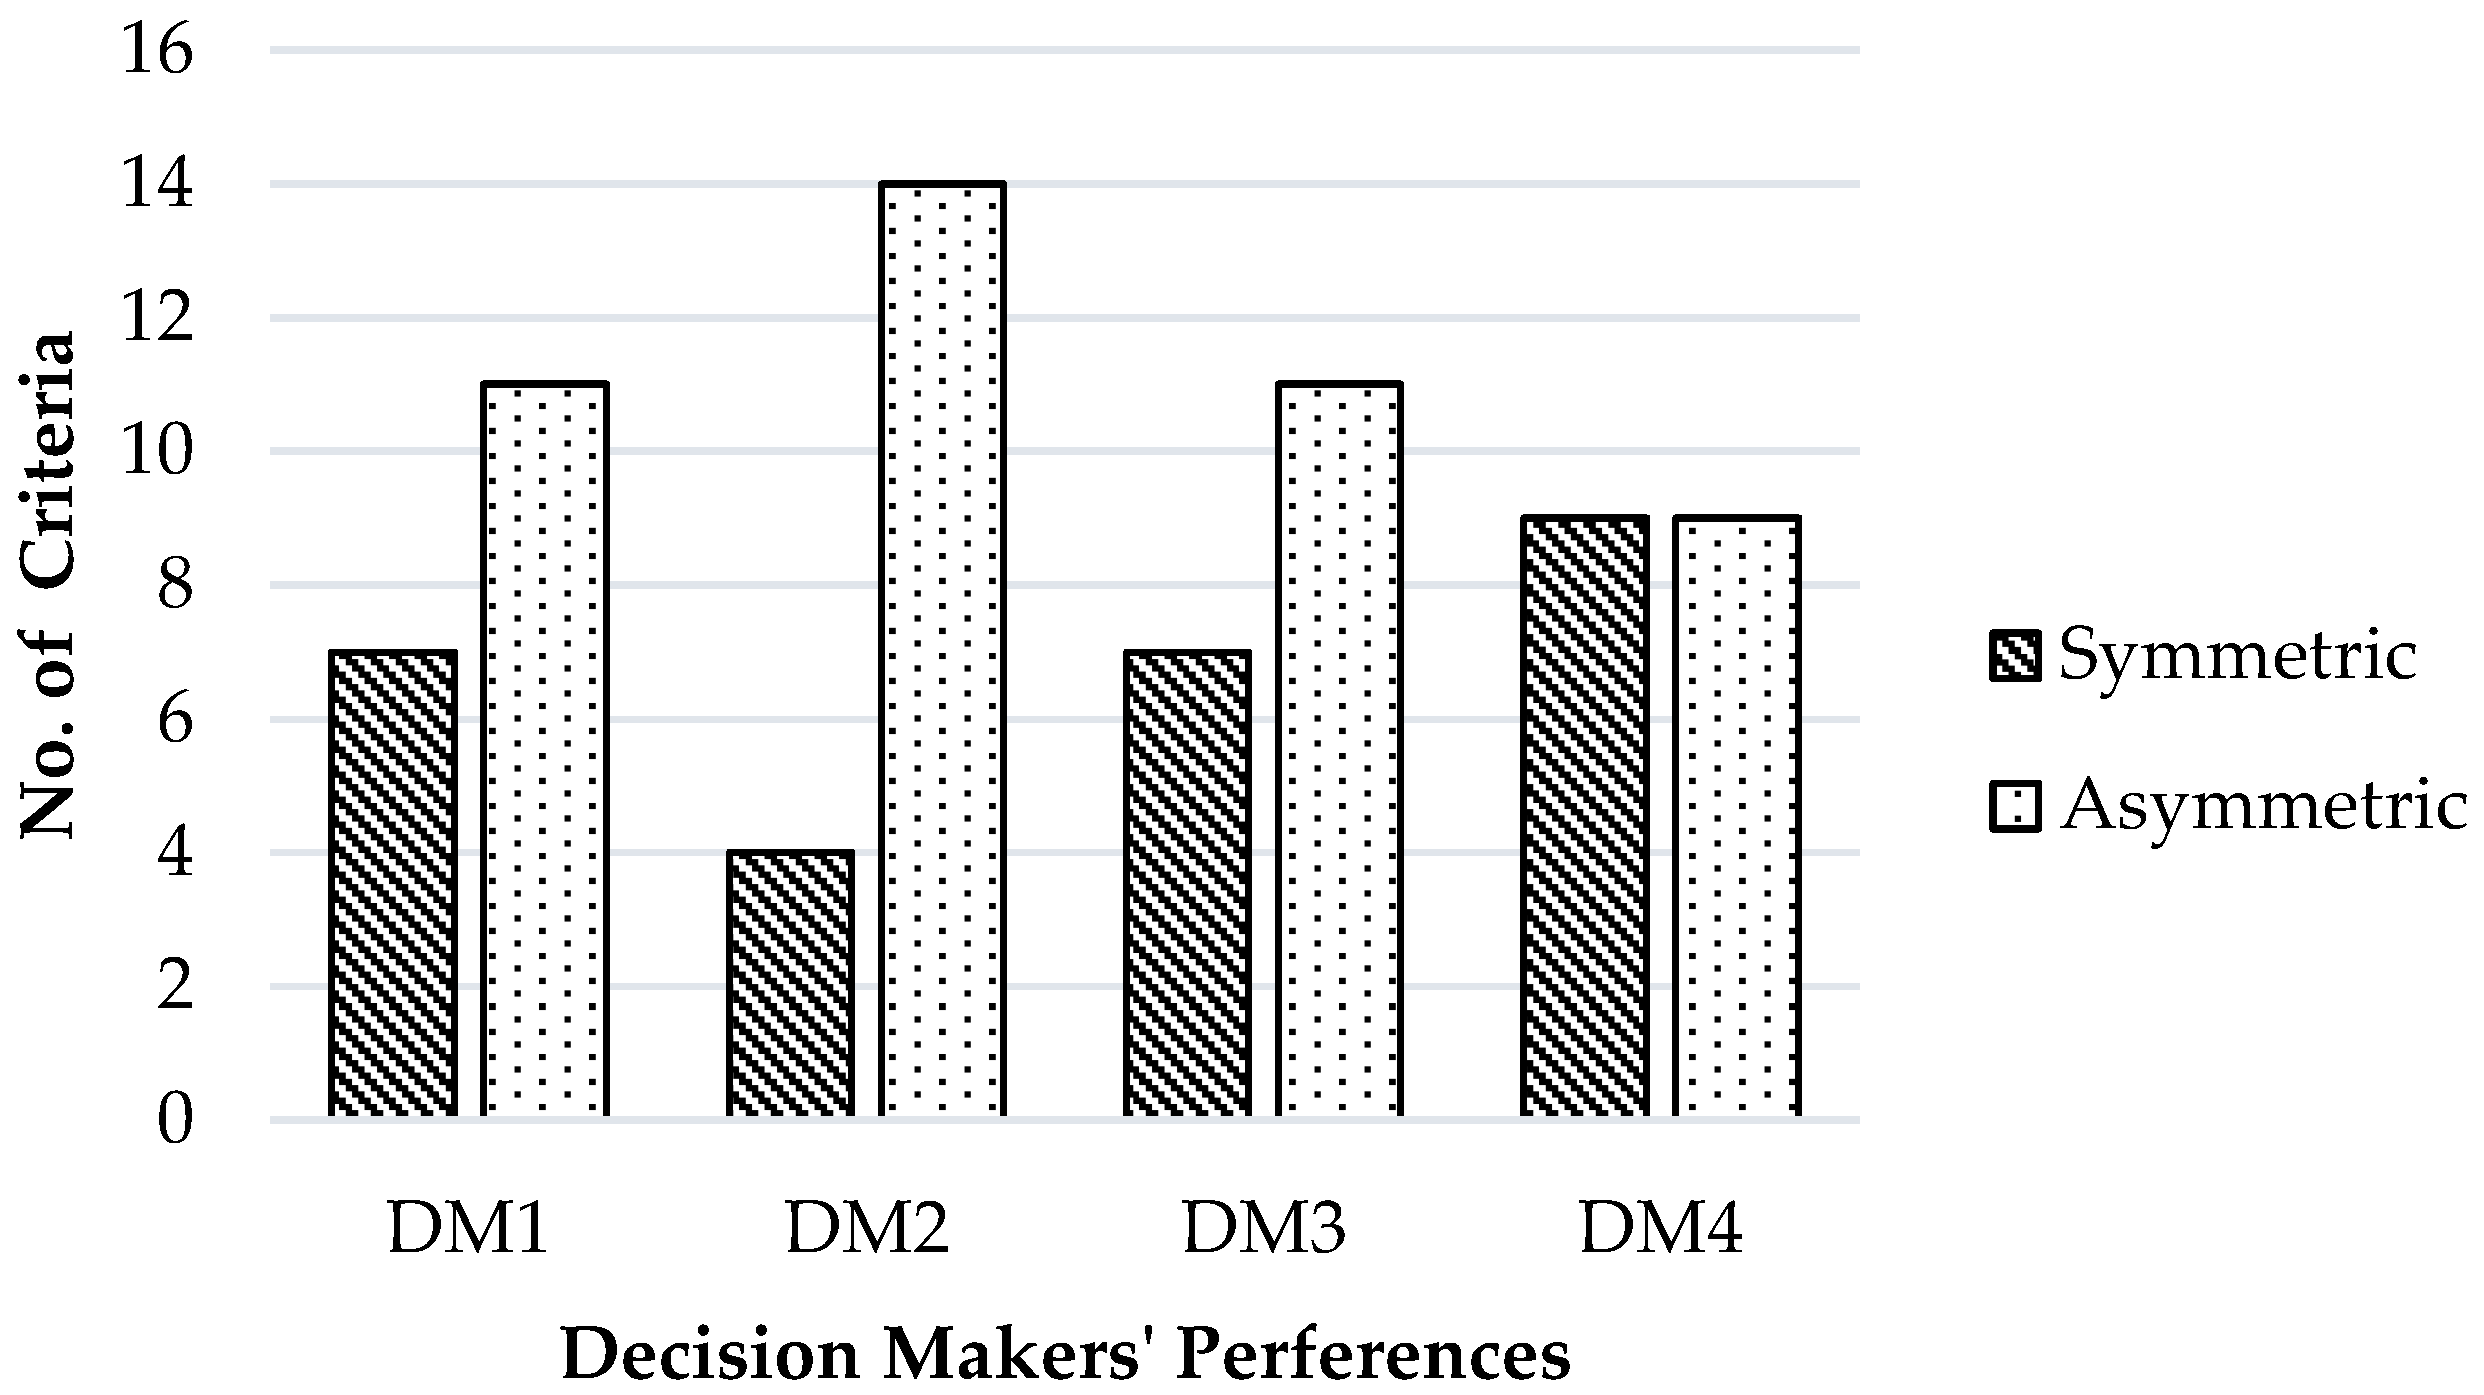
4.1. Sample Data and Screening
4.2. Application of the GRFT Weighting Method
4.3. University Rankings
5. Conclusions
Author Contributions
Funding
Conflicts of Interest
References
- Brown, R.M.; Mazzarol, T.W. The importance of institutional image to student satisfaction and loyalty within higher education. High. Educ. 2009, 58, 81–95. [Google Scholar] [CrossRef]
- MOE List of National Colleges and Universities. Available online: http://www.moe.edu.cn/srcsite/A03/moe_634/201706/t20170614_306900.html (accessed on 2 December 2018).
- Colman, A.M. What is Psychology? Psychology Press: Hove, UK, 1999; ISBN 978-0-415-16901-1. [Google Scholar]
- Henriques, G.R. Psychology defined. J. Clin. Psychol. 2004, 60, 1207–1221. [Google Scholar] [CrossRef] [PubMed]
- Higgins, E.T. Beyond pleasure and pain. Am. Psychol. 1997, 52, 1280–1300. [Google Scholar] [CrossRef] [PubMed]
- Chelst, K.; Canbolat, Y.B. Value-Added Decision Making for Managers; CRC Press: Boca Raton, FL, USA, 2011; ISBN 978-1-4200-7572-4. [Google Scholar]
- Deng, J. The Primary Methods of Grey System Theory, 1st ed.; Huazhong University of Science and Technology Press: Wuhan, China, 1987; ISBN 7-5609-0045-3. [Google Scholar]
- Liu, S.; Lin, Y. Introduction to Grey Systems Theory. In Grey Systems Theory and Applications; Understanding Complex Systems; Springer: Berlin/Heidelberg, Germany, 2010; ISBN 978-3-642-16157-5. [Google Scholar]
- ARWU World University Rankings 2017 | Academic Ranking of World Universities 2017 | Top 500 universities | Shanghai Ranking - 2017. Available online: http://www.shanghairanking.com/ARWU2017.html (accessed on 25 January 2018).
- Studies (CWTS), C. for S. and T. CWTS Leiden Ranking. Available online: http://www.leidenranking.com (accessed on 25 January 2018).
- Huang, M.-H. Performance Ranking of Scientific Papers for World Universities. Available online: http://nturanking.lis.ntu.edu.tw/Others/AboutUS-enus.aspx (accessed on 25 January 2018).
- University Rankings. Available online: https://www.topuniversities.com/university-rankings (accessed on 25 January 2018).
- World University Rankings 2016–2017 Methodology. Available online: https://www.timeshighereducation.com/world-university-rankings/methodology-world-university-rankings-2016-2017 (accessed on 17 July 2017).
- Akbulut, U. University Ranking by Academic Performance (URAP) Press Release. Available online: http://www.urapcenter.org/2018/ (accessed on 14 February 2019).
- ARWU Ranking Methodology of Academic Ranking of World Universities. Available online: http://www.shanghairanking.com/ARWU-Methodology-2014.html (accessed on 3 December 2018).
- Quacquarelli Symonds QS World University Rankings—Methodology | Top Universities. Available online: https://www.topuniversities.com/qs-world-university-rankings/methodology (accessed on 3 December 2018).
- THE World University Rankings 2018 Methodology. Available online: https://www.timeshighereducation.com/world-university-rankings/methodology-world-university-rankings-2018 (accessed on 3 December 2018).
- Saisana, M.; d’Hombres, B.; Saltelli, A. Rickety numbers: Volatility of university rankings and policy implications. Res. Policy 2011, 40, 165–177. [Google Scholar] [CrossRef]
- Yu, D.; Wang, W.; Zhang, W.; Zhang, S. A Bibliometric Analysis of Research on Multiple Criteria Decision Making. Curr. Sci. 2018, 114, 747. [Google Scholar] [CrossRef]
- MacCrimmon, K.R. Decisionmaking among Multiple-Attribute Alternatives: A Survey and Consolidated Approach; RM-4823-ARPA; The Rand Corporation: Santa Monica, CA, USA, 1968; pp. 1–63. [Google Scholar]
- Dinçer, H.; Yüksel, S.; Martínez, L. Balanced scorecard-based analysis about European energy investment policies: A hybrid hesitant fuzzy decision-making approach with Quality Function Deployment. Expert Syst. Appl. 2019, 115, 152–171. [Google Scholar] [CrossRef]
- Sullivan, L.P. Quality function deployment. Qual. Prog. 1986, 19, 39–50. [Google Scholar]
- Saaty, T.L. Decision making—The Analytic Hierarchy and Network Processes (AHP/ANP). J. Syst. Sci. Syst. Eng. 2004, 13, 1–35. [Google Scholar] [CrossRef]
- Hwang, C.L.; Yoon, K. Multiple attribute decision making, methods and applications. In Lecture Notes in Economics and Mathematical Systems; Springer-Verlag: New York, NY, USA, 1981; Volume 186. [Google Scholar]
- Petrović, I.; Kankaraš, M. DEMATEL-AHP multi-criteria decision making model for the determination and evaluation of criteria for selecting an air traffic protection aircraft. Decis. Mak. Appl. Manag. Eng. 2018, 1, 93–110. [Google Scholar] [CrossRef]
- Hu, J.W.-S.; Hu, Y.-C.; Tsai, A.C.-H. Multiple Criteria Decision Making and General Regression for Determining Influential Factors on S&P 500 Index Futures. Symmetry 2018, 10, 5. [Google Scholar]
- Roy, J.; Pamučar, D.; Adhikary, K.; Kar, K. A rough strength relational DEMATEL model for analysing the key success factors of hospital service quality. Decis. Mak. Appl. Manag. Eng. 2018, 1, 121–142. [Google Scholar] [CrossRef]
- Shariat, R.; Roozbahani, A.; Ebrahimian, A. Risk analysis of urban stormwater infrastructure systems using fuzzy spatial multi-criteria decision making. Sci. Total Environ. 2019, 647, 1468–1477. [Google Scholar] [CrossRef] [PubMed]
- Ali, S.; Taweekun, J.; Techato, K.; Waewsak, J.; Gyawali, S. GIS based site suitability assessment for wind and solar farms in Songkhla, Thailand. Renew. Energy 2019, 132, 1360–1372. [Google Scholar] [CrossRef]
- Arabameri, A.; Rezaei, K.; Cerda, A.; Lombardo, L.; Rodrigo-Comino, J. GIS-based groundwater potential mapping in Shahroud plain, Iran. A comparison among statistical (bivariate and multivariate), data mining and MCDM approaches. Sci. Total Environ. 2019, 658, 160–177. [Google Scholar] [CrossRef] [PubMed]
- Sahu, A.K.; Sahu, N.K.; Sahu, A.K.; Rajput, M.S.; Narang, H.K. T-SAW methodology for parametric evaluation of surface integrity aspects in AlMg3 (AA5754) alloy: Comparison with T-TOPSIS methodology. Measurement 2019, 132, 309–323. [Google Scholar] [CrossRef]
- Zhang, L.; Xin, H.; Yong, H.; Kan, Z. Renewable energy project performance evaluation using a hybrid multi-criteria decision-making approach: Case study in Fujian, China. J. Clean. Prod. 2019, 206, 1123–1137. [Google Scholar] [CrossRef]
- Aghdaie, M.H.; Hashemkhani Zolfani, S.; Zavadskas, E.K. A Hybrid Approach for Market Segmentation and Market Segment Evaluation and Selection: An Integration of Data Mining and Madm. Transform. Bus. Econ. 2013, 12, 431–458. [Google Scholar]
- Keršuliene, V.; Zavadskas, E.K.; Turskis, Z. Selection of rational dispute resolution method by applying new step-wise weight assessment ratio analysis (Swara). J. Bus. Econ. Manag. 2010, 11, 243–258. [Google Scholar] [CrossRef]
- Kaklauskas, A.; Zavadskas, E.K.; Raslanas, S.; Ginevicius, R.; Komka, A.; Malinauskas, P. Selection of low-e windows in retrofit of public buildings by applying multiple criteria method COPRAS: A Lithuanian case. Energy Build. 2006, 38, 454–462. [Google Scholar] [CrossRef]
- Aghdaie, M.H. Data Mining Group Decision-Making with FAHP: An Application in Supplier Evaluation and Segmentation. In Fuzzy Analytic Hierarchy Process; CRC Press: Boca Raton, FL, USA, 2017; ISBN 978-1-4987-3248-2. [Google Scholar]
- Wang, H.; Jiang, Z.; Zhang, H.; Wang, Y.; Yang, Y.; Li, Y. An integrated MCDM approach considering demands-matching for reverse logistics. J. Clean. Prod. 2019, 208, 199–210. [Google Scholar] [CrossRef]
- Pamučar, D.; Ćirović, G. The selection of transport and handling resources in logistics centers using Multi-Attributive Border Approximation area Comparison (MABAC). Expert Syst. Appl. 2015, 42, 3016–3028. [Google Scholar] [CrossRef]
- Kamari, A.; Jensen, S.R.; Corrao, R.; Kirkegaard, P.H. A Holistic Multi-Methodology for Sustainable Renovation. Int. J. Strateg. Prop. Manag. 2019, 23, 50–64. [Google Scholar] [CrossRef]
- Nie, R.-X.; Tian, Z.-P.; Wang, J.-Q.; Hu, J.-H. Pythagorean fuzzy multiple criteria decision analysis based on Shapley fuzzy measures and partitioned normalized weighted Bonferroni mean operator. Int. J. Intell. Syst. 2019, 34, 297–324. [Google Scholar] [CrossRef]
- Rezaei, J. Best-worst multi-criteria decision-making method. Omega 2015, 53, 49–57. [Google Scholar] [CrossRef]
- Badi, I.; Ballem, M. Supplier selection using the rough BWM-MAIRCA model: A case study in pharmaceutical supplying in Libya. Decis. Mak. Appl. Manag. Eng. 2018, 1, 16–33. [Google Scholar] [CrossRef]
- Pamučar, D.; Stević, Ž.; Sremac, S. A New Model for Determining Weight Coefficients of Criteria in MCDM Models: Full Consistency Method (FUCOM). Symmetry 2018, 10, 393. [Google Scholar] [CrossRef]
- Pamučar, D.; Lukovac, V.; Božanić, D.; Komazec, N. Multi-criteria FUCOM-MAIRCA model for the evaluation of level crossings: case study in the Republic of Serbia. Oper. Res. Eng. Sci. Theory Appl. 2018, 1, 108–129. [Google Scholar] [CrossRef]
- Nunić, Z.B. Evaluation and selection of Manufacturer PVC carpentry using FUCOM-MABAC model. Oper. Res. Eng. Sci. Theory Appl. 2018, 1, 13–28. [Google Scholar] [CrossRef]
- Aghdaie, M.H.; Tafreshi, P.F. (Eds.) A new perspective on RFM analysis. In Intelligent Systems: Concepts, Methodologies, Tools, and Applications; IGI Global: Hershey, PA, USA, 2018; ISBN 978-1-5225-5643-5. [Google Scholar]
- Stanujkić, D.; Karabašević, D. An extension of the WASPAS method for decision-making problems with intuitionistic fuzzy numbers: a case of website evaluation. Oper. Res. Eng. Sci. Theory Appl. 2018, 1, 29–39. [Google Scholar] [CrossRef]
- Zavadskas, E.K.; Turskis, Z.; Antucheviciene, J.; Zakarevicius, A. Optimization of weighted aggregated sum product assessment. Elektron. Ir Elektrotechnika 2012, 122, 3–6. [Google Scholar] [CrossRef]
- Singh, S.; Garg, H. Symmetric Triangular Interval Type-2 Intuitionistic Fuzzy Sets with Their Applications in Multi Criteria Decision Making. Symmetry 2018, 10, 401. [Google Scholar] [CrossRef]
- Dursun, M.; Arslan, Ö. An Integrated Decision Framework for Material Selection Procedure: A Case Study in a Detergent Manufacturer. Symmetry 2018, 10, 657. [Google Scholar] [CrossRef]
- Ye, D.; Liang, D.; Hu, P. Three-Way Decisions with Interval-Valued Intuitionistic Fuzzy Decision-Theoretic Rough Sets in Group Decision-Making. Symmetry 2018, 10, 281. [Google Scholar] [CrossRef]
- Deng, J. Introduction to Grey System Theory. J. Grey Syst. 1989, 1, 1–24. [Google Scholar]
- Sifeng, L.; Lin, Y. Grey information: theory and practical applications; Advanced information and knowledge processing; Springer: London, UK, 2006; ISBN 978-1-85233-995-1. [Google Scholar]
- Liu, C.-Y.; Tong, L.-I. Developing Automatic Form and Design System Using Integrated Grey Relational Analysis and Affective Engineering. Appl. Sci. 2018, 8, 91. [Google Scholar] [CrossRef]
- Yazdani, M.; Kahraman, C.; Zarate, P.; Onar, S.C. A fuzzy multi attribute decision framework with integration of QFD and grey relational analysis. Expert Syst. Appl. 2019, 115, 474–485. [Google Scholar] [CrossRef]
- Sefidian, A.M.; Daneshpour, N. Missing value imputation using a novel grey based fuzzy c-means, mutual information based feature selection, and regression model. Expert Syst. Appl. 2019, 115, 68–94. [Google Scholar] [CrossRef]
- Ramesh, K.; Baranitharan, P.; Sakthivel, R. Investigation of the stability on boring tool attached with double impact dampers using Taguchi based Grey analysis and cutting tool temperature investigation through FLUKE-Thermal imager. Measurement 2019, 131, 143–155. [Google Scholar] [CrossRef]
- Lai, F.; Li, Z.; Zhang, T.; Zhou, A.; Gong, B. Characteristics of microscopic pore structure and its influence on spontaneous imbibition of tight gas reservoir in the Ordos Basin, China. J. Pet. Sci. Eng. 2019, 172, 23–31. [Google Scholar] [CrossRef]
- Zare Mehrjerdi, Y. Strategic system selection with linguistic preferences and grey information using MCDM. Appl. Soft Comput. 2014, 18, 323–337. [Google Scholar] [CrossRef]
- Wu, C.-Y.; Chan, H.-T.; Wang, S.-H. Using modified grey relational analysis approach for ERP system providers. In Proceedings of the 2011 6th International Conference on Computer Sciences and Convergence Information Technology (ICCIT), Seogwipo, Korea, 29 November–1 December 2011; pp. 333–337. [Google Scholar]
- Kang, H.K.; Kim, D.G.; Jeong, H.W.; Park, G.Y.; Youn, H.-Y. A Novel Interval Grey Number and Entropy-based Solution for Multiple-Criteria Group Decision Making Problem. In Proceedings of the 2012 9th International Conference on Ubiquitous Intelligence Computing and 9th International Conference on Autonomic Trusted Computing (UIC/ATC), Fukuoka, Japan, 4–7 September 2012; pp. 349–356. [Google Scholar]
- Zhang, N. Method for aggregating correlated interval grey linguistic variables and its application to decision making. Technol. Econ. Dev. Econ. 2013, 19, 189–202. [Google Scholar] [CrossRef]
- Ma, Z.-J.; Zhang, N.; Dai, Y. Some Induced Correlated Aggregating Operators with Interval Grey Uncertain Linguistic Information and Their Application to Multiple Attribute Group Decision Making. Math. Probl. Eng. 2013, 2013, e160610. [Google Scholar] [CrossRef]
- Jin, F.; Liu, P.; Zhang, X. The multi-attribute group decision making method based on the interval grey linguistic variables weighted harmonic aggregation operators. Technol. Econ. Dev. Econ. 2013, 19, 409–430. [Google Scholar] [CrossRef]
- Crowe, E.; Higgins, E.T. Regulatory Focus and Strategic Inclinations: Promotion and Prevention in Decision-Making. Organ. Behav. Hum. Decis. Process. 1997, 69, 117–132. [Google Scholar] [CrossRef]
- Higgins, E.T. Making a good decision: Value from fit. Am. Psychol. 2000, 55, 1217–1230. [Google Scholar] [CrossRef]
- Aaker, J.L.; Lee, A.Y. “I” seek pleasures and “we” avoid pains: The role of self-regulatory goals in information processing and persuasion. J. Consum. Res. 2001, 28, 33–49. [Google Scholar] [CrossRef]
- Forster, J.; Higgins, E.T.; Idson, L.C. Approach and avoidance strength during goal attainment: regulatory focus and the “goal looms larger” effect. J. Pers. Soc. Psychol. 1998, 75, 1115–1131. [Google Scholar] [CrossRef]
- Shah, J.; Higgins, T.; Friedman, R.S. Performance incentives and means: How regulatory focus influences goal attainment. J. Pers. Soc. Psychol. 1998, 74, 285–293. [Google Scholar] [CrossRef]
- Zhao, G.; Pechmann, C. The Impact of Regulatory Focus on Adolescents’ Response to Antismoking Advertising Campaigns. J. Mark. Res. 2007, 44, 671–687. [Google Scholar] [CrossRef]
- Dijk, D.V.; Kluger, A.N. Task type as a moderator of positive/negative feedback effects on motivation and performance: A regulatory focus perspective. J. Organ. Behav. 2011, 32, 1084–1105. [Google Scholar] [CrossRef]
- Bullens, L.; van Harreveld, F.; Förster, J.; Higgins, T.E. How decision reversibility affects motivation. J. Exp. Psychol. Gen. 2014, 143, 835–849. [Google Scholar] [CrossRef] [PubMed]
- Kuhn, K.M. Selecting the Good vs. Rejecting the Bad: Regulatory Focus Effects on Staffing Decision Making. Hum. Resour. Manage. 2015, 54, 131–150. [Google Scholar] [CrossRef]
- Ahmadi, S.; Khanagha, S.; Berchicci, L.; Jansen, J.J.P. Are Managers Motivated to Explore in the Face of a New Technological Change? The Role of Regulatory Focus, Fit, and Complexity of Decision-Making. J. Manag. Stud. 2017, 54, 209–237. [Google Scholar] [CrossRef]
- Lai, C.-Y.; Hsu, J.S.-C.; Li, Y. Leadership, regulatory focus and information systems development project team performance. Int. J. Proj. Manag. 2018, 36, 566–582. [Google Scholar] [CrossRef]
- Liao, Z.; Long, S. CEOs’ regulatory focus, slack resources and firms’ environmental innovation. Corp. Soc. Responsib. Environ. Manag. 2018, 25, 981–990. [Google Scholar] [CrossRef]
- Song, J.; Kim, J.; Triche, J.; Kim, M.; Chai, S. The Effects of Institution-Based Trust on Community Commitments: A Regulatory Focus Perspective. SIGMIS Database 2018, 49, 34–53. [Google Scholar] [CrossRef]
- Higgins, E.T.; Cornwell, J.F.M. Securing foundations and advancing frontiers: Prevention and promotion effects on judgment & decision making. Organ. Behav. Hum. Decis. Process. 2016, 136, 56–67. [Google Scholar]
- Lo Gerfo, E.; Pisoni, A.; Ottone, S.; Ponzano, F.; Zarri, L.; Vergallito, A.; Varoli, E.; Fedeli, D.; Lauro, L.J.R. Goal Achievement Failure Drives Corticospinal Modulation in Promotion and Prevention Contexts. Front. Behav. Neurosci. 2018, 12, 71. [Google Scholar] [CrossRef]
- Plewa, C.; Ho, J.; Conduit, J.; Karpen, I.O. Reputation in higher education: A fuzzy set analysis of resource configurations. J. Bus. Res. 2016, 69, 3087–3095. [Google Scholar] [CrossRef]
- Verčič, A.T.; Verčič, D.; Žnidar, K. Exploring academic reputation – is it a multidimensional construct? Corp. Commun. Int. J. 2016, 21, 160–176. [Google Scholar] [CrossRef]
- Vidaver-Cohen, D. Reputation Beyond the Rankings: A Conceptual Framework for Business School Research. Corp. Reput. Rev. 2007, 10, 278–304. [Google Scholar] [CrossRef]
- Chen, C.; Esangbedo, M.O. Evaluating University Reputation Based on Integral Linear Programming with Grey Possibility. Math. Probl. Eng. 2018, 2018. [Google Scholar] [CrossRef]
- Liu, S.F.; Forrest, J. The current developing status on grey system theory. J. Grey Syst. 2007, 19, 111–123. [Google Scholar]
- Li, Q.; Zhao, N. Stochastic interval-grey number VIKOR method based on prospect theory. Grey Syst. Theory Appl. 2015, 5, 105–116. [Google Scholar] [CrossRef]
- Dawood, H. Theories of Interval Arithmetic: Mathematical Foundations and Applications; LAP LAMBERT Academic Publishing: Saarbrücken, Germany, 2011; ISBN 978-3-8465-0154-2. [Google Scholar]
- Zhang, J.; Wu, D.; Olson, D.L. The method of grey related analysis to multiple attribute decision making problems with interval numbers. Math. Comput. Model. 2005, 42, 991–998. [Google Scholar] [CrossRef]
- Li, G.-D.; Yamaguchi, D.; Nagai, M. A grey-based decision-making approach to the supplier selection problem. Math. Comput. Model. 2007, 46, 573–581. [Google Scholar] [CrossRef]
- Deng, J. The Primary Methods of Grey System Theory; Huazhong University of Science and Technology Press: Wuhan, China, 2005; ISBN 7-5609-3436-6. [Google Scholar]
- ARWU World University Rankings 2018 | Academic Ranking of World Universities 2018 | Top 500 universities | Shanghai Ranking - 2018. Available online: http://www.shanghairanking.com/ARWU2018.html (accessed on 20 December 2018).
- Centre for Science and Technology Studies (CWTS) CWTS Leiden Ranking. Available online: http://www.leidenranking.com (accessed on 20 December 2018).
- Performance Ranking of Scientific Papers for World Universities China World University Rankings By 2018. Available online: http://nturanking.lis.ntu.edu.tw/ByCountry/2018/CN (accessed on 20 December 2018).
- QS University Rankings: Asia 2019. Available online: https://www.topuniversities.com/university-rankings/asian-university-rankings/2019 (accessed on 20 December 2018).
- Times Higher Education World University Rankings 2019. Available online: https://www.timeshighereducation.com/world-university-rankings/2019/world-ranking (accessed on 20 December 2018).
- University Ranking by Academic Performance URAP 2018-2019 Ranking by Country. Available online: http://www.urapcenter.org/2018/country.php?ccode=CN&rank=all (accessed on 20 December 2018).
- Roy, B. Classement et choix en présence de points de vue multiples (The ELECTRE method). RAIRO Oper. Res. Rech. Opérationnelle 1968, 2, 57–75. [Google Scholar]


| Criteria | Description |
|---|---|
| Social Contribution | The feedback of a university to the community, such as in services. |
| Citizenship | The university’s ethical contribution and responsibility to the society. |
| Employment | The university’s human resource contribution to industries as graduates. |
| Alumni | The testament of the education they received as former students. |
| Environments | Academic conditions that affect students’ and lecturers’ developments. |
| International Learning | The platform in which students can interact with other cultures. |
| Safety | University’s ability to protect students from danger. |
| Campus Location | Learning and social place provided for students. |
| Leadership | A clear vision for development shown as competency. |
| Course Materials | The use of quality teaching resources. |
| Lecturers | The academic staff that present teaching materials. |
| Administration | Organizational characteristics that include the student’s perception. |
| Funding | The financial roles attached to the institution. |
| Income Level of Parents/Sponsors | The financial contributor to student’s education base on their income. |
| Tuition | The primary cost of receiving an education. |
| Scholarships | The ability to attract top talents through financial support. |
| Research & Development (R&D) | Knowledge transfer and innovation that can promote economic growth. |
| Industry Linkage | Enhancing technological and scientific industrial infrastructure. |
| Key Project | The university participating in large-scale government projects. |
| Publications | Publications, citation, and industry-university co-publications. |
| Students’ Guidance | The advice students receive from guidance counsellors, family and friends. |
| Recommendations | Schoolteachers and people opinions that molds students view. |
| Parents | Parental control that shapes the perspective of a child. |
| Students | Perceived education service quality received through word-of-mouth from other students. |
| First-Level Criteria | DM1 (%) | DM2 (%) | DM3 (%) | DM4 (%) |
|---|---|---|---|---|
| 85 | 90 | 85 | 100 | |
| 90 | 90 | 86 | 95 | |
| 85 | 90 | 95 | 100 | |
| 70 | 80 | 96 | 100 | |
| 75 | 80 | 96 | 95 | |
| Students’ Guidance | 70 | 80 | 96 | 100 |
| Second-Level Criteria | Second-Level Criteria INDEX (v) | Prevention Measurements (p) (%) | Promotion Measurements (q) (%) | ||||||
|---|---|---|---|---|---|---|---|---|---|
| DM1 | DM2 | DM3 | DM4 | DM1 | DM2 | DM3 | DM4 | ||
| Citizenship () | 1 | 100 | 90 | 100 | 95 | 100 | 90 | 100 | 98 |
| Employment () | 2 | 100 | 81 | 85 | 100 | 70 | 50 | 85 | 100 |
| Alumni () | 3 | 80 | 90 | 91 | 100 | 100 | 70 | 100 | 100 |
| ) | 4 | 90 | 70 | 100 | 90 | 95 | 70 | 100 | 90 |
| ) | 5 | 85 | 90 | 100 | 98 | 85 | 90 | 100 | 98 |
| ) | 6 | 80 | 60 | 90 | 100 | 85 | 80 | 95 | 90 |
| ) | 7 | 90 | 90 | 100 | 92 | 70 | 30 | 90 | 85 |
| ) | 8 | 90 | 70 | 98 | 100 | 90 | 90 | 95 | 100 |
| ) | 9 | 85 | 70 | 90 | 100 | 85 | 90 | 90 | 95 |
| ) | 10 | 50 | 70 | 30 | 80 | 50 | 40 | 30 | 90 |
| ) | 11 | 50 | 20 | 85 | 80 | 70 | 70 | 88 | 80 |
| ) | 12 | 70 | 90 | 90 | 100 | 85 | 90 | 95 | 100 |
| ) | 13 | 75 | 40 | 85 | 90 | 70 | 30 | 81 | 90 |
| ) | 14 | 90 | 80 | 95 | 98 | 90 | 90 | 92 | 100 |
| ) | 15 | 85 | 90 | 95 | 100 | 85 | 80 | 95 | 100 |
| ) | 16 | 90 | 90 | 100 | 100 | 85 | 50 | 50 | 85 |
| ) | 17 | 80 | 30 | 25 | 80 | 85 | 90 | 50 | 78 |
| ) | 18 | 100 | 90 | 62 | 100 | 85 | 60 | 82 | 96 |
| DM1 | DM2 | DM3 | DM4 | ||
|---|---|---|---|---|---|
| [100, 100] | [90, 90] | [100, 100] | [95, 98] | [385, 388] | |
| [70, 100] | [50, 81] | [85, 85] | [100, 100] | [305, 366] | |
| [80, 100] | [70, 90] | [91, 100] | [100, 100] | [341, 390] | |
| [85, 90] | [50, 90] | [50, 100] | [85, 100] | [270, 380] | |
| [80, 85] | [30, 90] | [25, 50] | [78, 80] | [213, 305] | |
| [85, 100] | [60, 90] | [62, 82] | [96, 100] | [303, 372] |
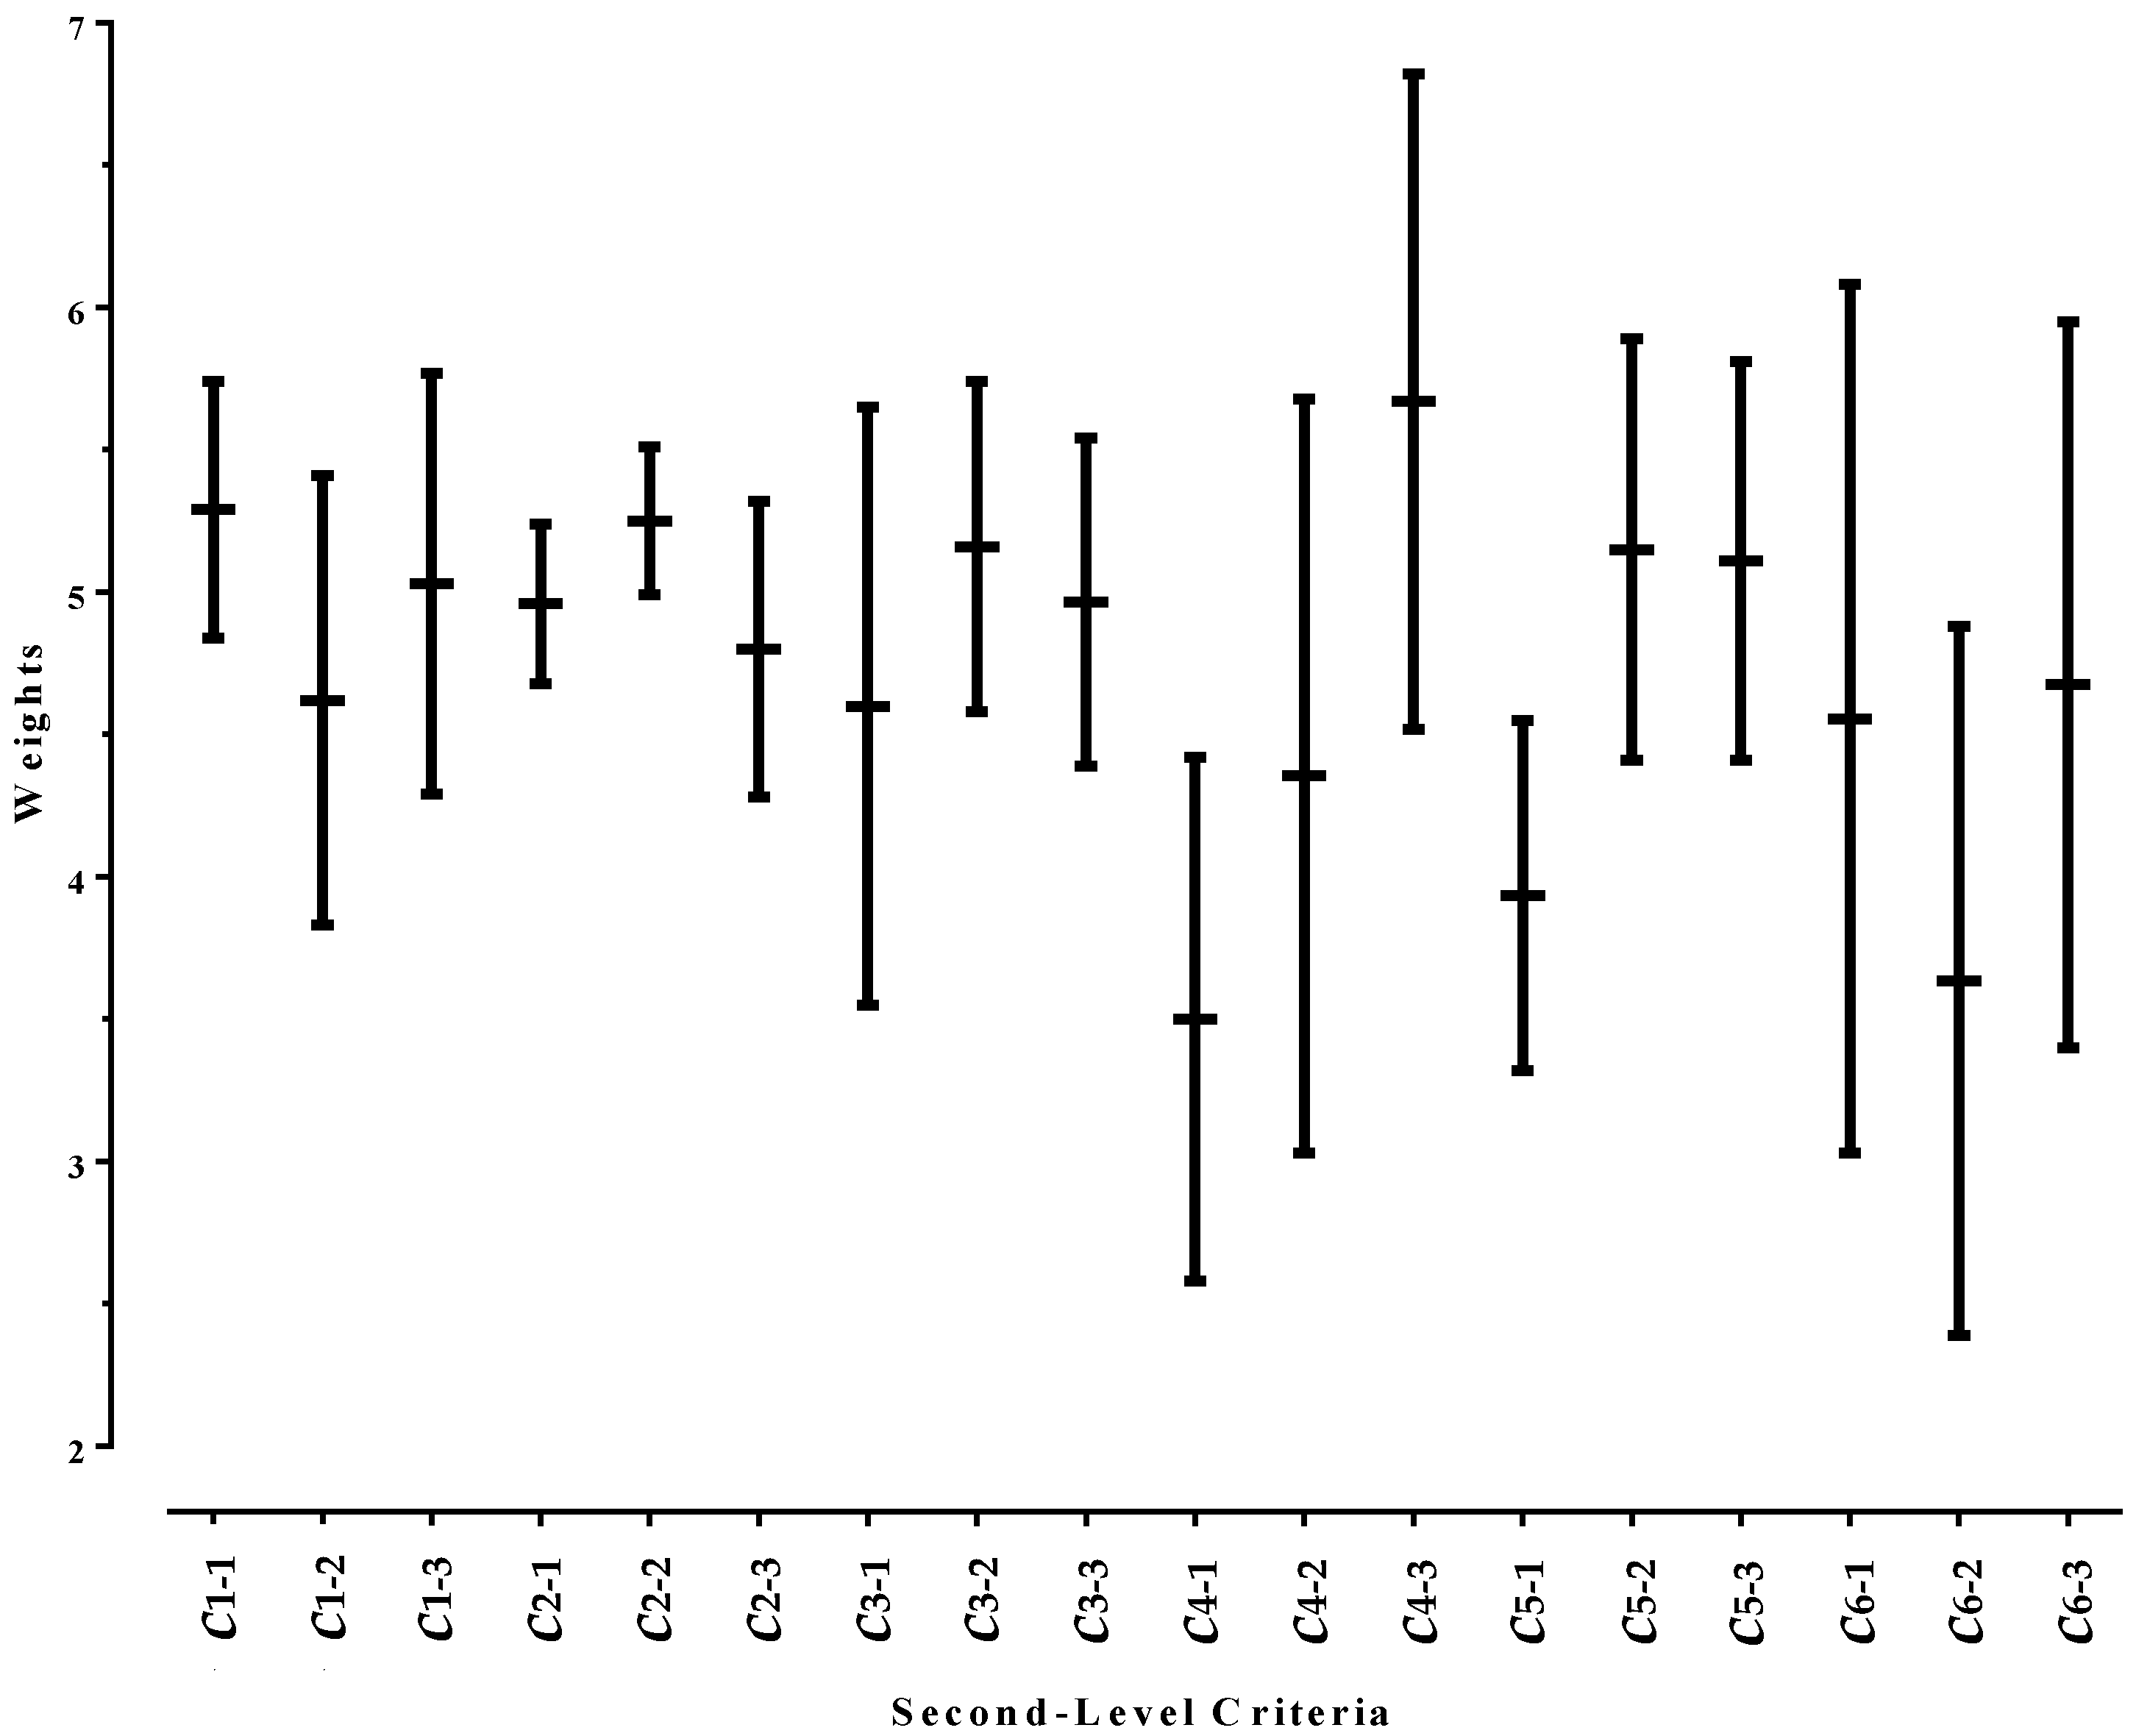
| First-Level Criteria | Local Weights | Second-Level Criteria | Local Weights | Effective Weights in % (W) |
|---|---|---|---|---|
| [0.1438, 0.1692] | [0.3365, 0.3392] | [4.84, 5.74] | ||
| [0.2666, 0.3199] | [3.83, 5.41] | |||
| [0.2981, 0.3409] | [4.29, 5.77] | |||
| [0.1455, 0.1607] | [0.3217, 0.3263] | [4.68, 5.24] | ||
| [0.3428, 0.3428] | [4.99, 5.51] | |||
| [0.2941, 0.3309] | [4.28, 5.32] | |||
| [0.1438, 0.1692] | [0.2466, 0.3336] | [3.55, 5.65] | ||
| [0.3184, 0.339] | [4.58, 5.74] | |||
| [0.3049, 0.3274] | [4.39, 5.54] | |||
| [0.1184, 0.1692] | [0.2179, 0.2614] | [2.58, 4.42] | ||
| [0.256, 0.3355] | [3.03, 5.68] | |||
| [0.3813, 0.4031] | [4.52, 6.82] | |||
| [0.1269, 0.1624] | [0.2618, 0.2802] | [3.32, 4.55] | ||
| [0.3478, 0.3623] | [4.41, 5.89] | |||
| [0.3478, 0.3575] | [4.41, 5.81] | |||
| [0.1184, 0.1692] | [0.2554, 0.3595] | [3.03, 6.08] | ||
| [0.2015, 0.2886] | [2.39, 4.88] | |||
| [0.2867, 0.3519] | [3.4, 5.95] |
| Criteria Index v/Universities | A1 | A2 | A3 | A4 |
|---|---|---|---|---|
| 1 | [4.0548, 4.5871] | [1.7762, 2.1434] | [1.669, 2.1725] | [1.8451, 2.3204] |
| 2 | [3.2, 4.2677] | [2.0559, 2.7028] | [2.0986, 2.9437] | [2.2746, 2.9507] |
| 3 | [4.2839, 4.471] | [1.8497, 2.042] | [1.8275, 2.1127] | [2.0317, 2.3627] |
| 4 | [3.9677, 4.7548] | [1.7762, 3.1608] | [1.9472, 3.3521] | [1.5634, 3.5599] |
| 5 | [4.1323, 4.4419] | [1.8077, 2.3007] | [1.9014, 2.3415] | [1.9014, 2.1585] |
| 6 | [3.4419, 4.2645] | [2.4056, 3.0175] | [2.3592, 2.7852] | [2.3662, 3.1408] |
| 7 | [3.8097, 4.0839] | [2.2238, 2.521] | [2.1408, 2.5845] | [2.3204, 2.6092] |
| 8 | [3.9839, 4.4161] | [2.1189, 2.3636] | [2.1338, 2.4401] | [2.2077, 2.6092] |
| 9 | [3.5355, 4.2065] | [2.2448, 2.6119] | [2.1338, 2.4401] | [2.243, 2.5845] |
| 10 | [3.8161, 4.3419] | [1.9685, 2.7657] | [2.1056, 2.7782] | [1.8697, 2.919] |
| 11 | [2.4903, 4.2968] | [1.7343, 3.0699] | [1.8345, 3.1831] | [1.7852, 3.2218] |
| 12 | [4.2226, 4.529] | [1.7308, 2.2343] | [1.75, 2.1796] | [1.7324, 2.1338] |
| 13 | [3.5774, 4.1097] | [2.1434, 2.2762] | [2.2042, 2.4085] | [2.2958, 2.5282] |
| 14 | [4.0419, 4.5097] | [2.0699, 2.465] | [2.1338, 2.4859] | [2.2254, 2.507] |
| 15 | [4.1903, 4.4452] | [2.0385, 2.2692] | [2.2535, 2.4366] | [2.331, 2.5387] |
| 16 | [3.0484, 4.1677] | [2.3531, 3.0559] | [2.4401, 3.2077] | [2.5739, 3.3944] |
| 17 | [2.1645, 3.9903] | [2.3497, 3.3741] | [2.5176, 3.6761] | [2.5739, 3.5352] |
| 18 | [3.771, 4.0806] | [2.2797, 2.6538] | [2.2782, 2.7746] | [2.4542, 2.9824] |
© 2019 by the authors. Licensee MDPI, Basel, Switzerland. This article is an open access article distributed under the terms and conditions of the Creative Commons Attribution (CC BY) license (http://creativecommons.org/licenses/by/4.0/).
Share and Cite
Esangbedo, M.O.; Bai, S. Grey Regulatory Focus Theory Weighting Method for the Multi-Criteria Decision-Making Problem in Evaluating University Reputation. Symmetry 2019, 11, 230. https://doi.org/10.3390/sym11020230
Esangbedo MO, Bai S. Grey Regulatory Focus Theory Weighting Method for the Multi-Criteria Decision-Making Problem in Evaluating University Reputation. Symmetry. 2019; 11(2):230. https://doi.org/10.3390/sym11020230
Chicago/Turabian StyleEsangbedo, Moses Olabhele, and Sijun Bai. 2019. "Grey Regulatory Focus Theory Weighting Method for the Multi-Criteria Decision-Making Problem in Evaluating University Reputation" Symmetry 11, no. 2: 230. https://doi.org/10.3390/sym11020230
APA StyleEsangbedo, M. O., & Bai, S. (2019). Grey Regulatory Focus Theory Weighting Method for the Multi-Criteria Decision-Making Problem in Evaluating University Reputation. Symmetry, 11(2), 230. https://doi.org/10.3390/sym11020230