Numerical Research on Energy Evolution in Granite under Different Confining Pressures Using Otsu’s Digital Image Processing and PFC2D


Abstract
:1. Introduction
2. Methodology
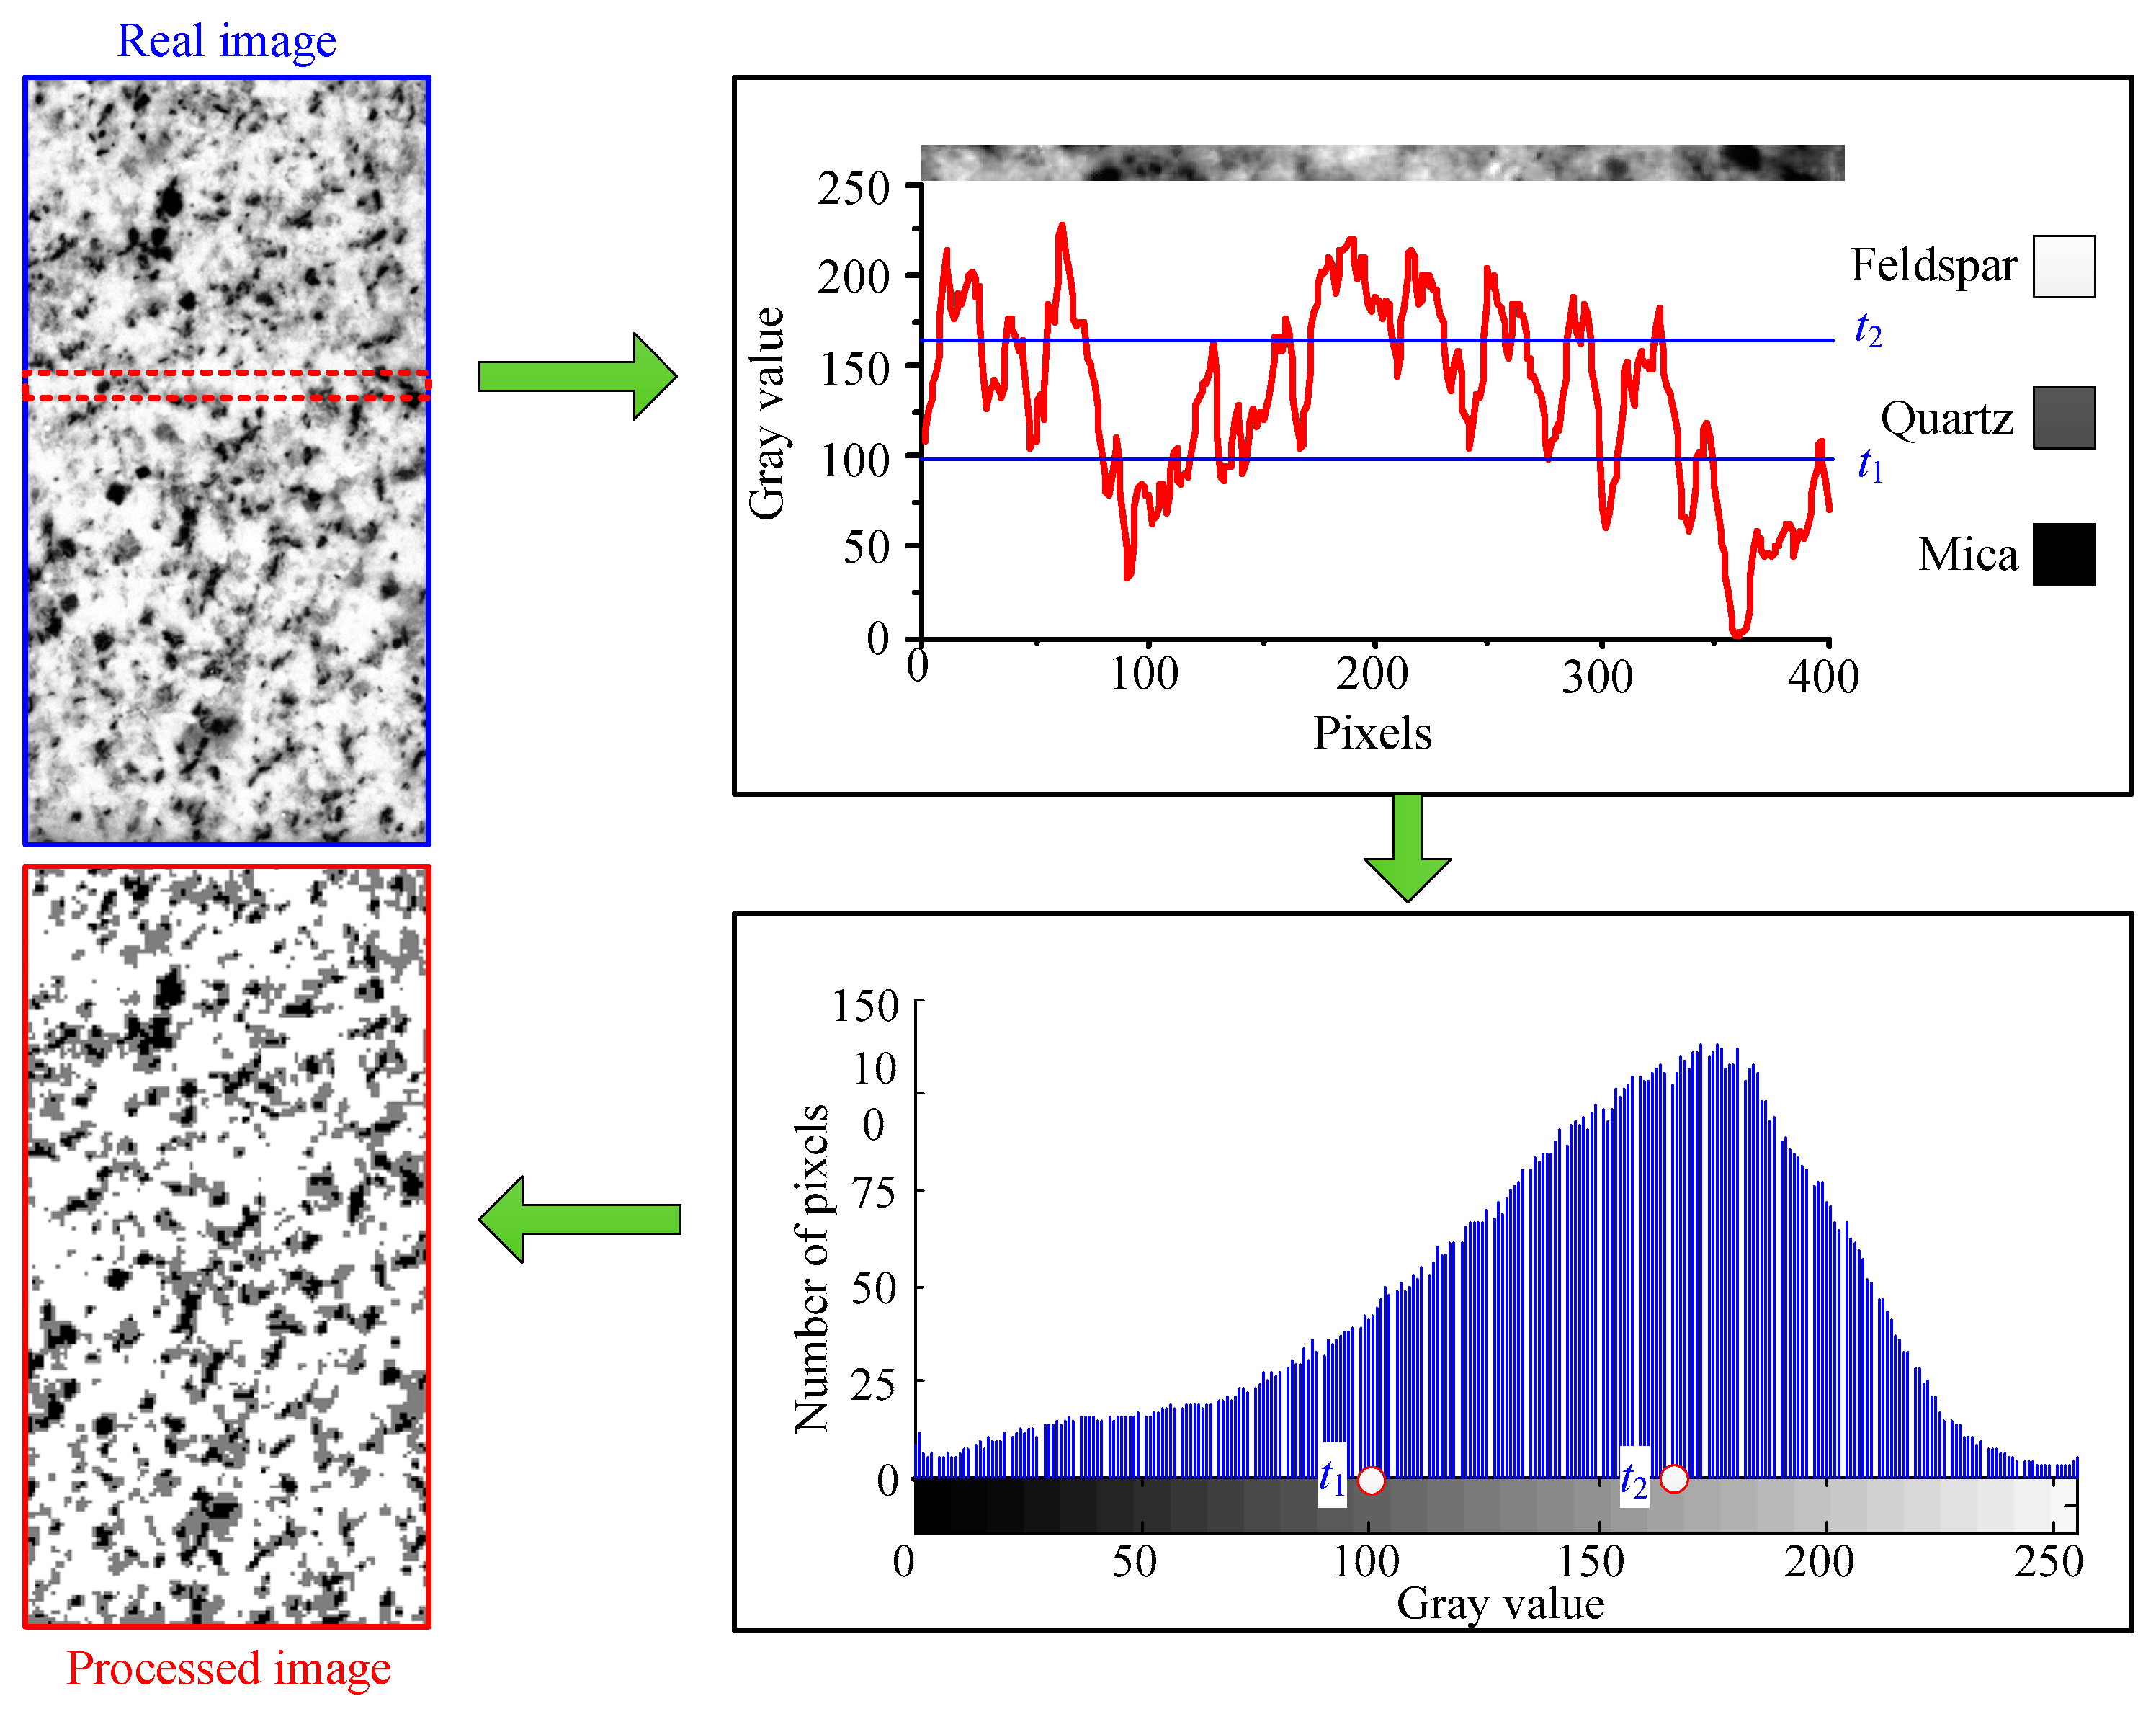
2.1. Acquisition and Characterization of Microstructures in Rock
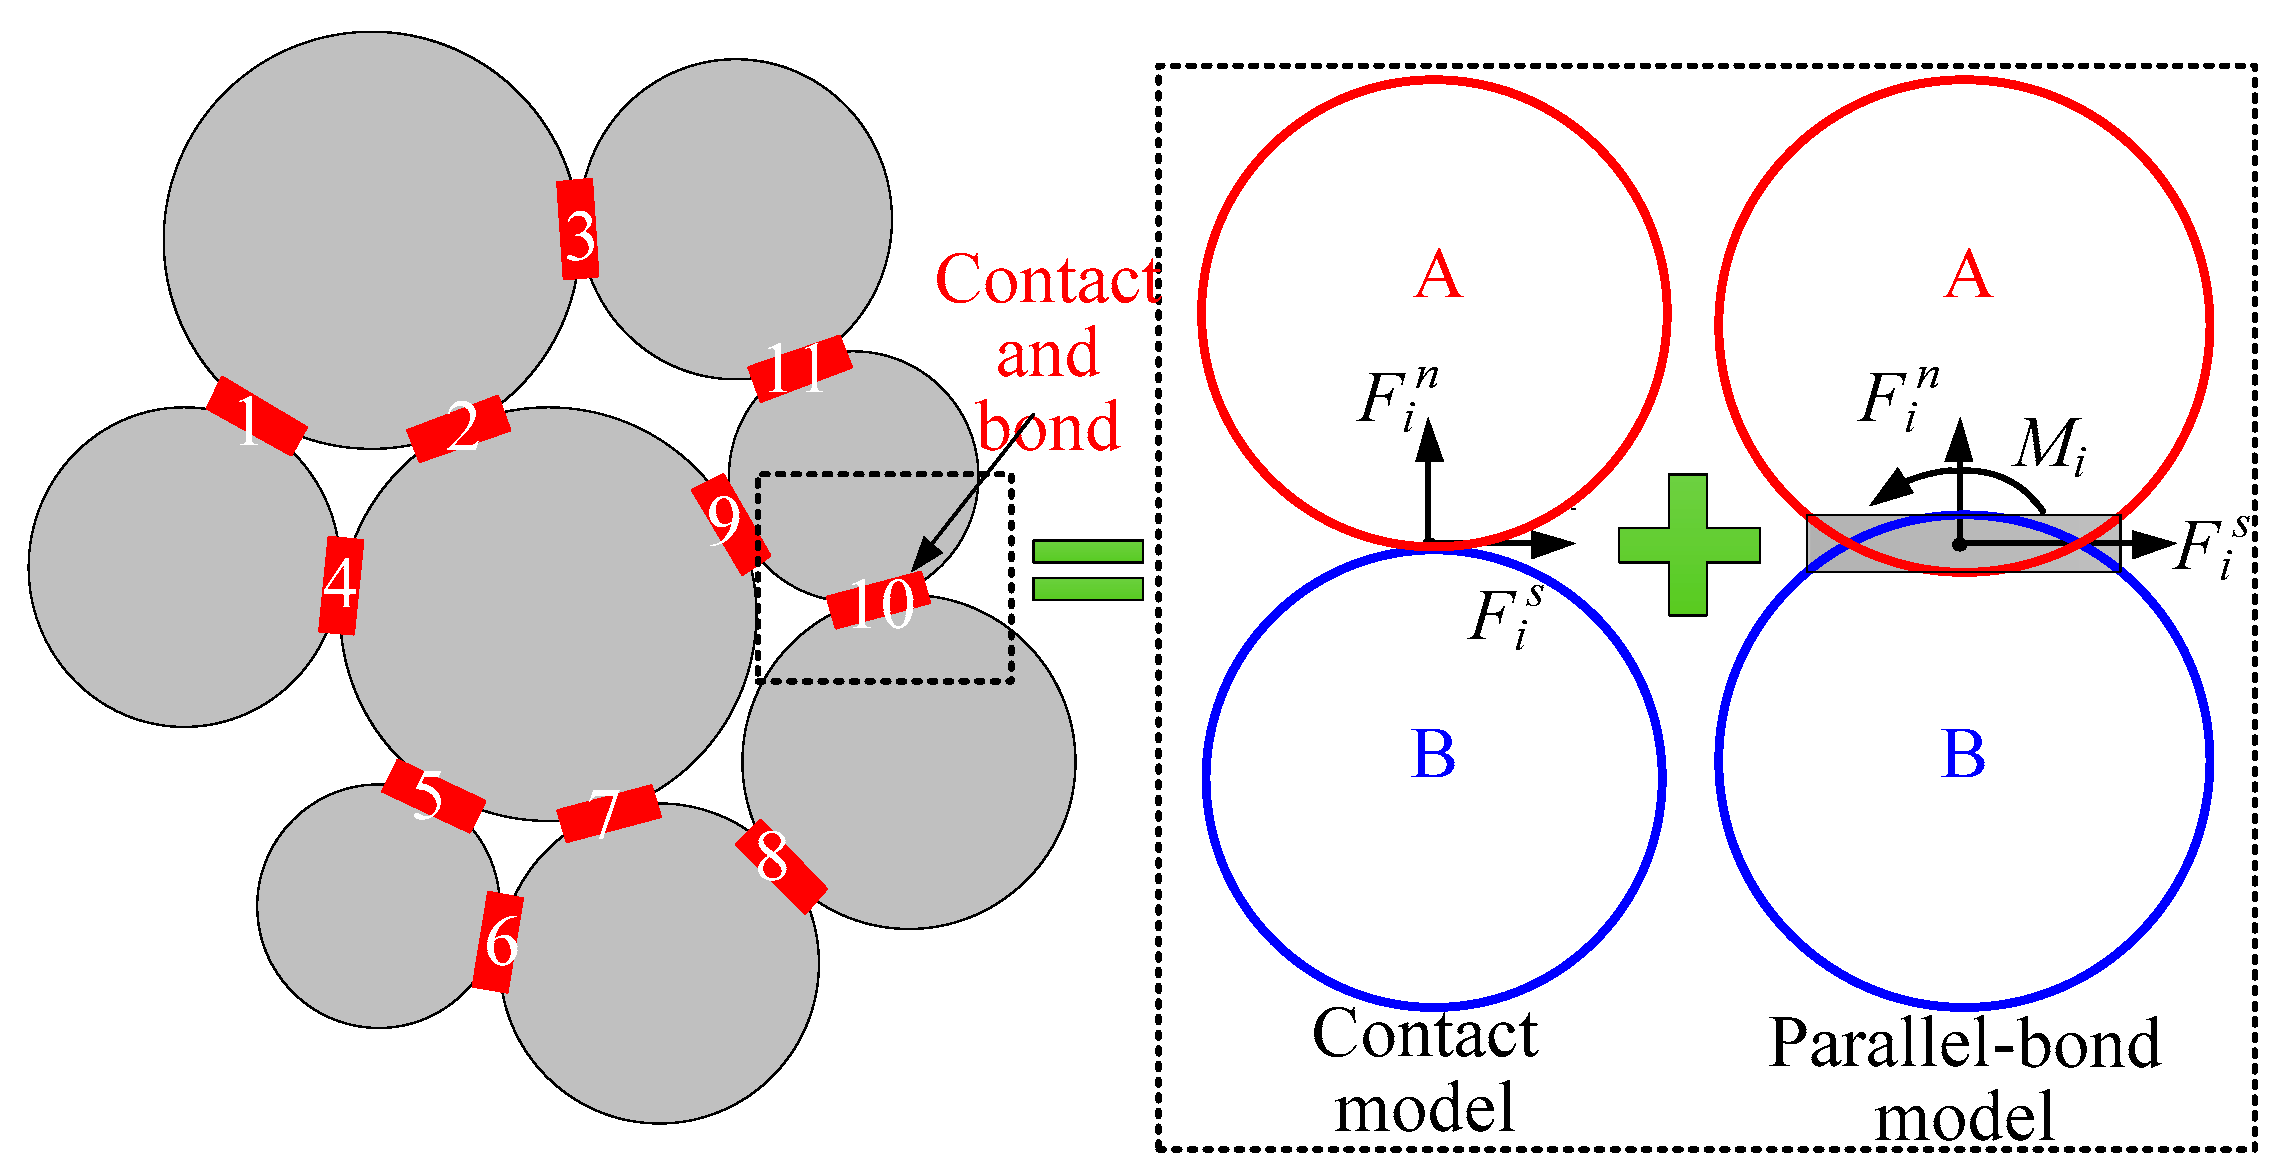
2.2. Microstructural Model Reconstruction Using PFC2D
- (1)
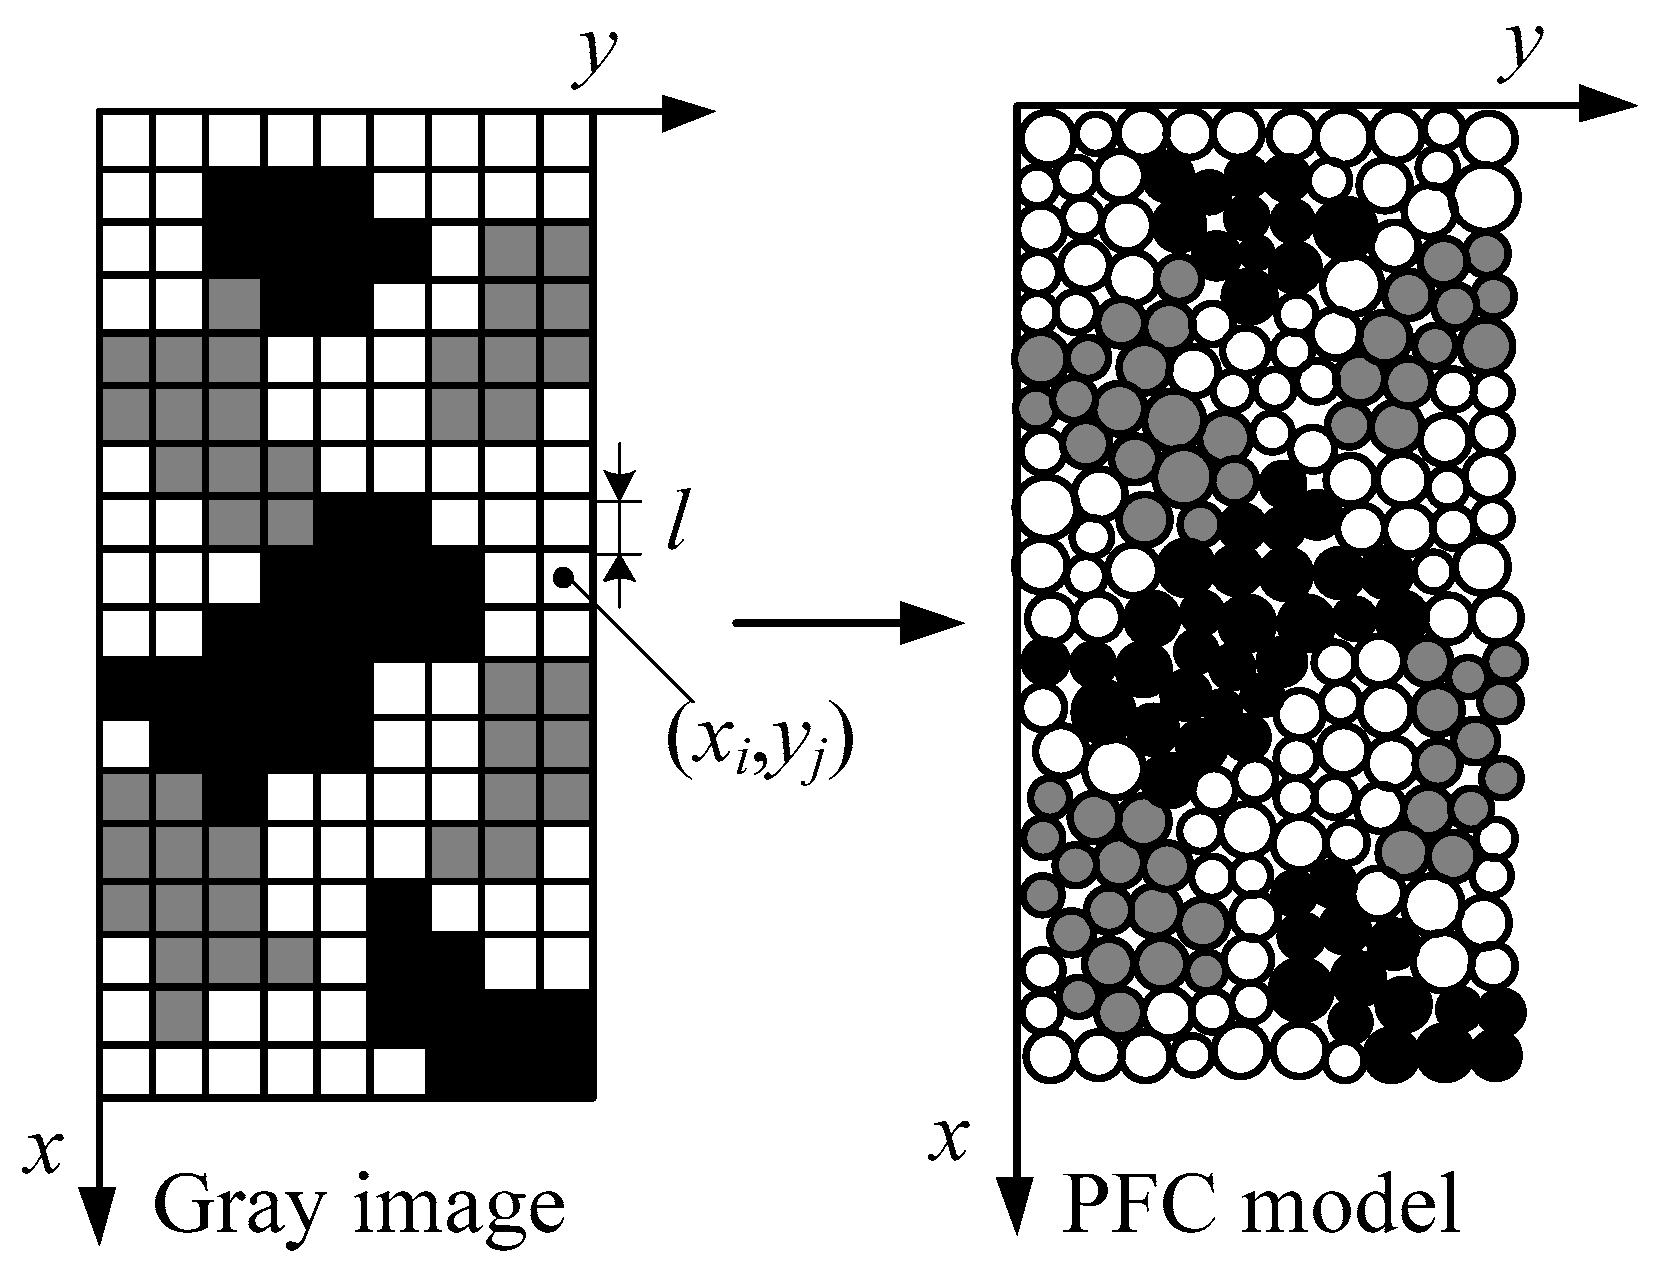
- Exporting the coordinates and gray values of the pixels. The pixel size of an image is always different from the actual size. Before exporting, there should be a scale conversion. It is supposed that the image’s actual size is a × b, and the pixel number is M × N. Each pixel’s length l and coordinate (xi, yj) can be calculated by Equation (2):where s is the scale factor and equals a/M or b/N, accordingly.l = s; xi = s × i; yj = s × j
- (2)
- Importing data into the PFC2D. In this paper, uniaxial compression tests were carried out and the dimension of the sample model was 50 mm × 100 mm. The diameter of the sample’s particles ranged from 0.25 to 0.75 mm, and the average value was 0.5 mm which equaled the converted pixel’s length l in the processed image (Figure 1). Then, the coordinates and gray values of the pixels were imported into the particle flow model. In the PFC2D model, particles were distributed randomly. A Fish function (a built-in programming langue in PFC2D) was written to find the pixel which was closest to the particle. The particle’s color code was set equal to the pixel’s gray value. Figure 2 shows an example of incorporating a gray image into the particle flow model.
- (3)
- Assigning microscopic parameters to the microstructures. Because the mechanical properties of minerals in rock are different, the respective microscopic parameters should be assigned to the different minerals. Based on the aforementioned particle color codes, the different minerals could be identified and assigned the appropriate parameters.
2.3. The Energy Calculation Method
3. Macro Characteristics of Energy Evolution in Granite
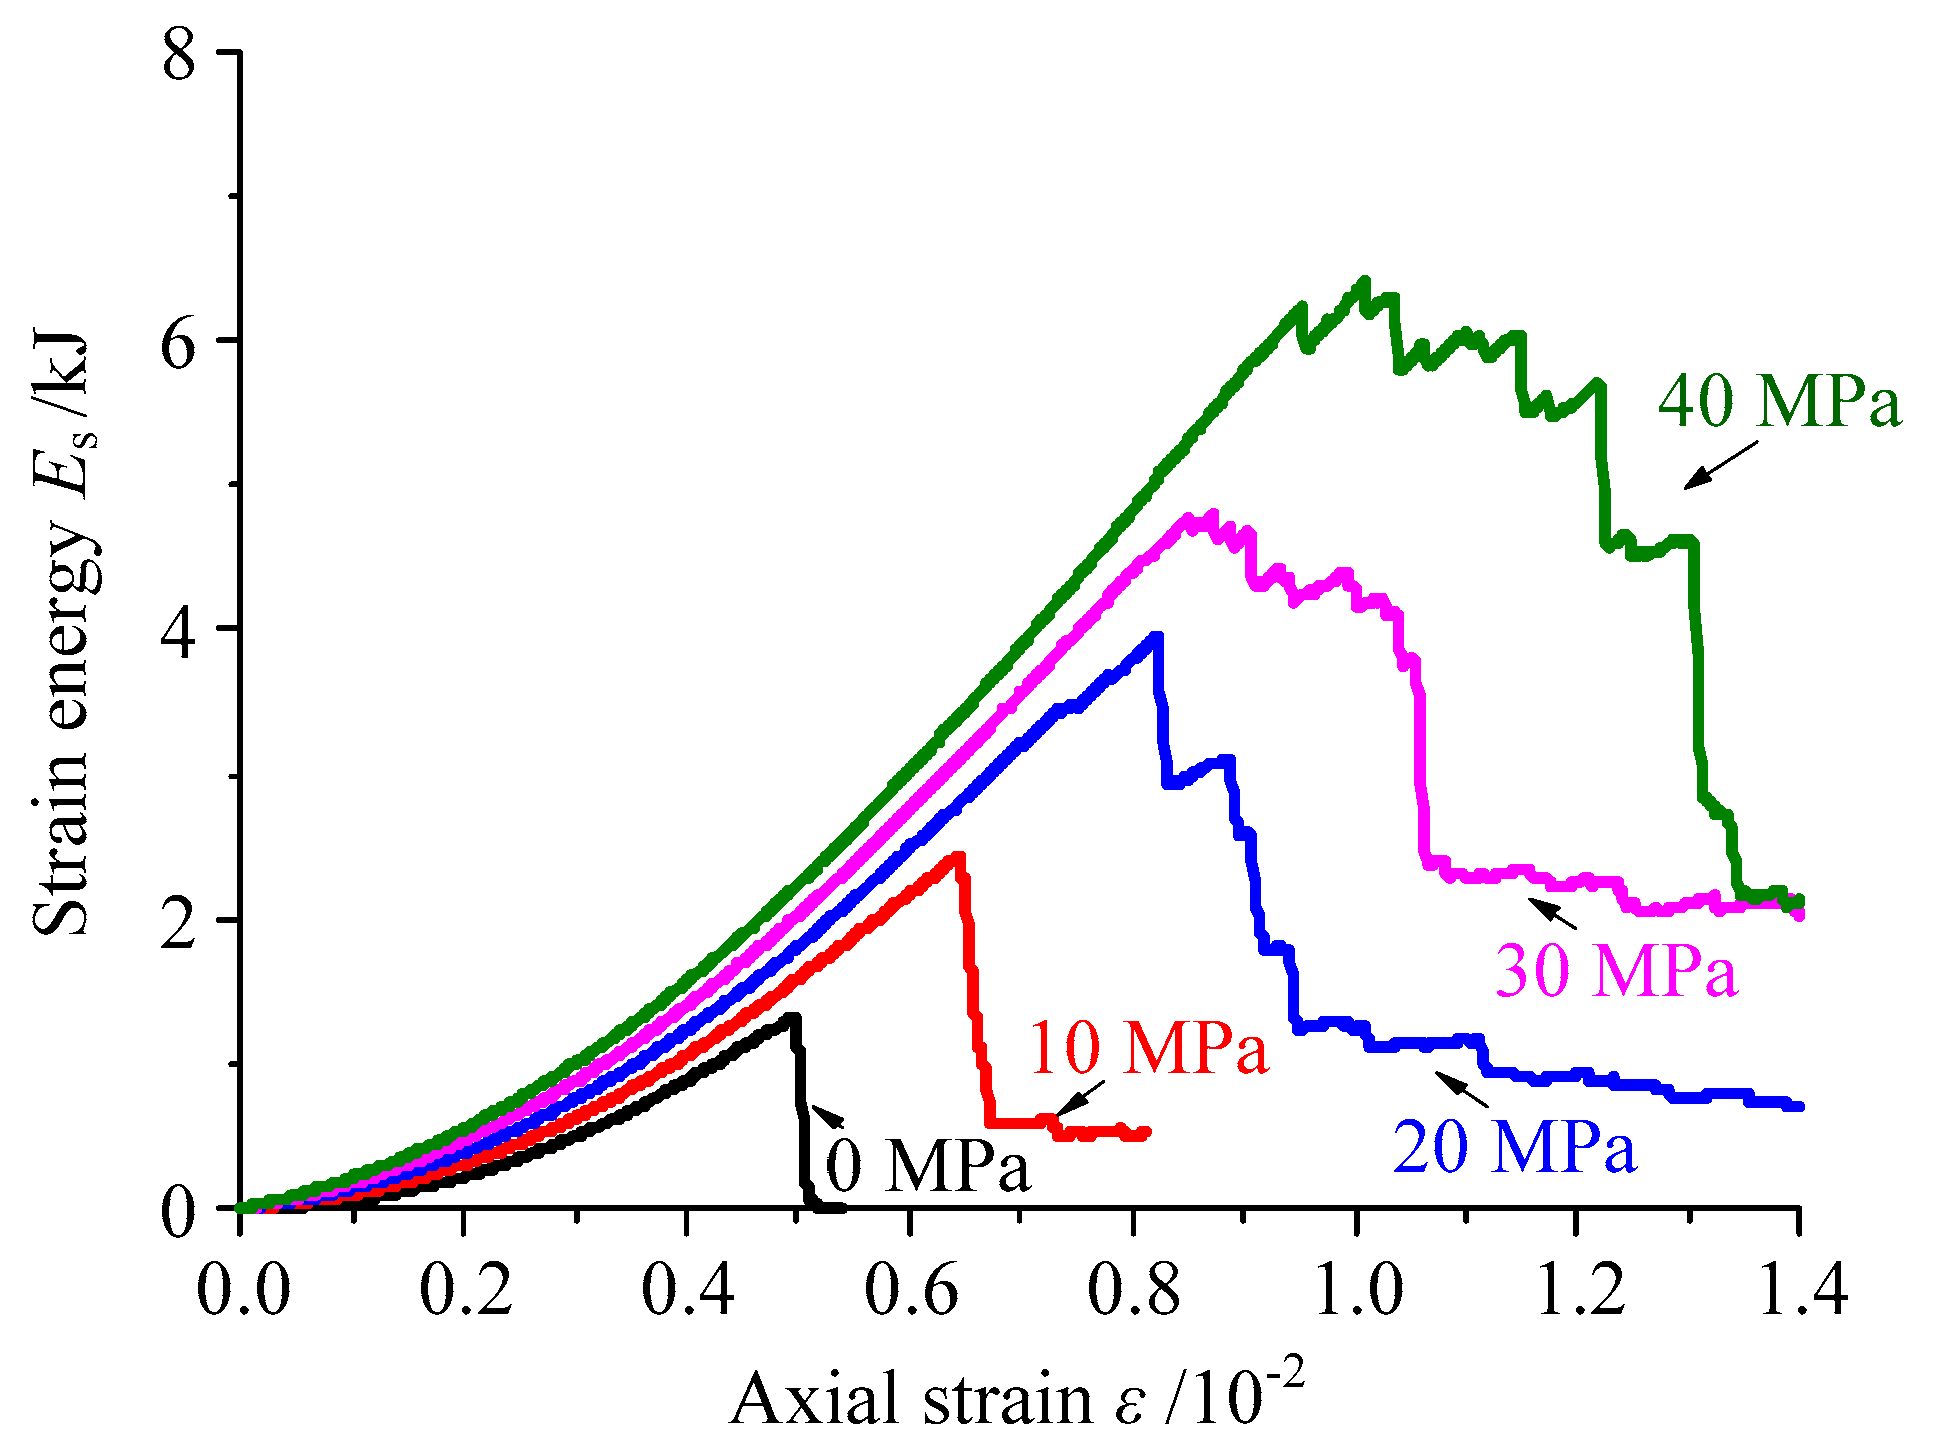
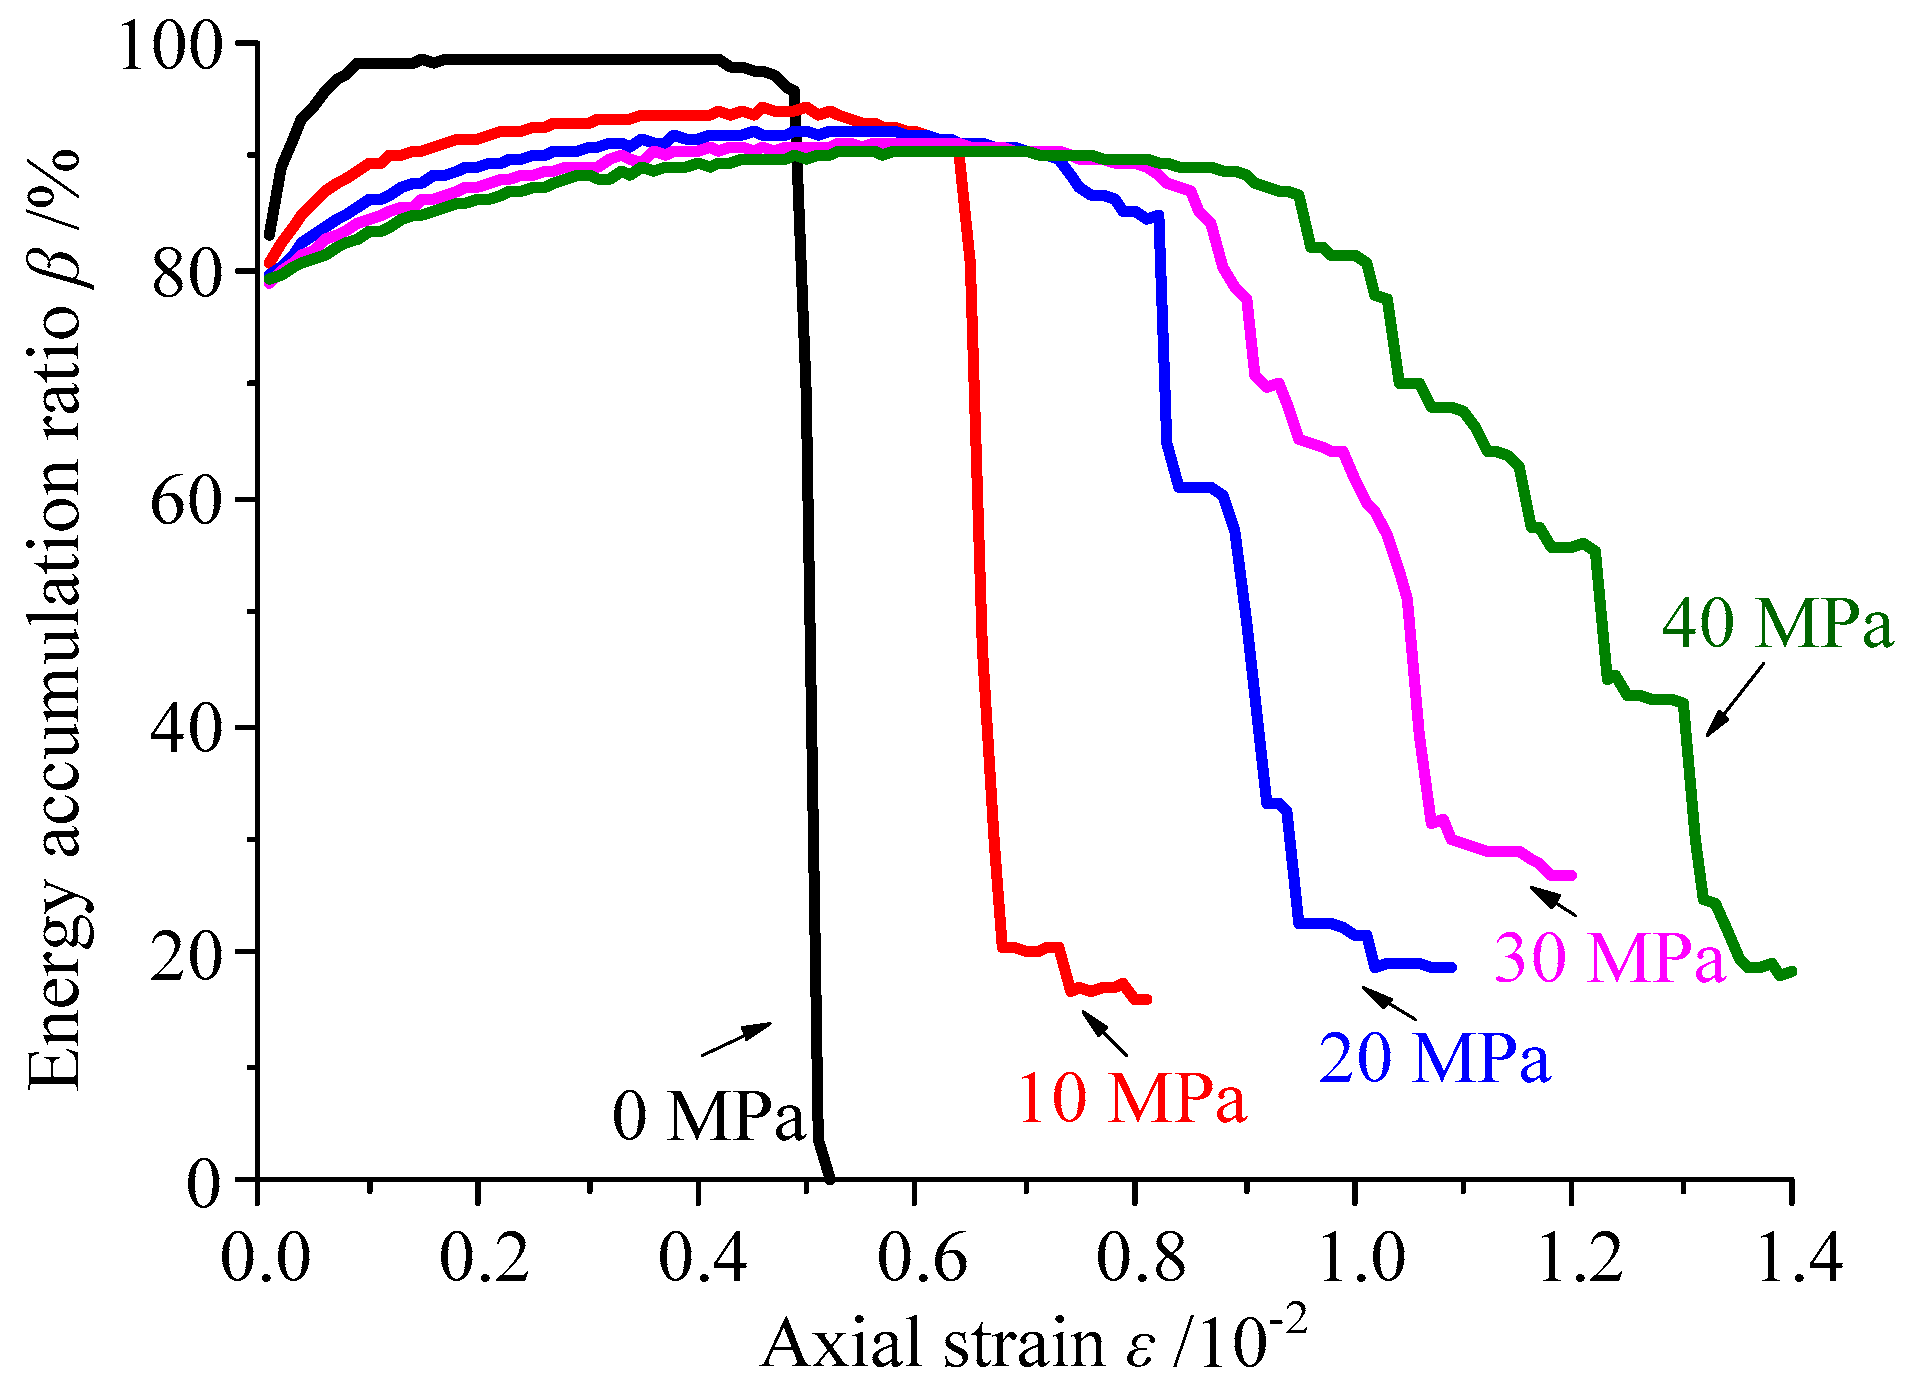
3.1. Energy Accumulation and Release
3.2. Effect of Confining Pressure
4. Energy Characteristics of Microstructures in Granite
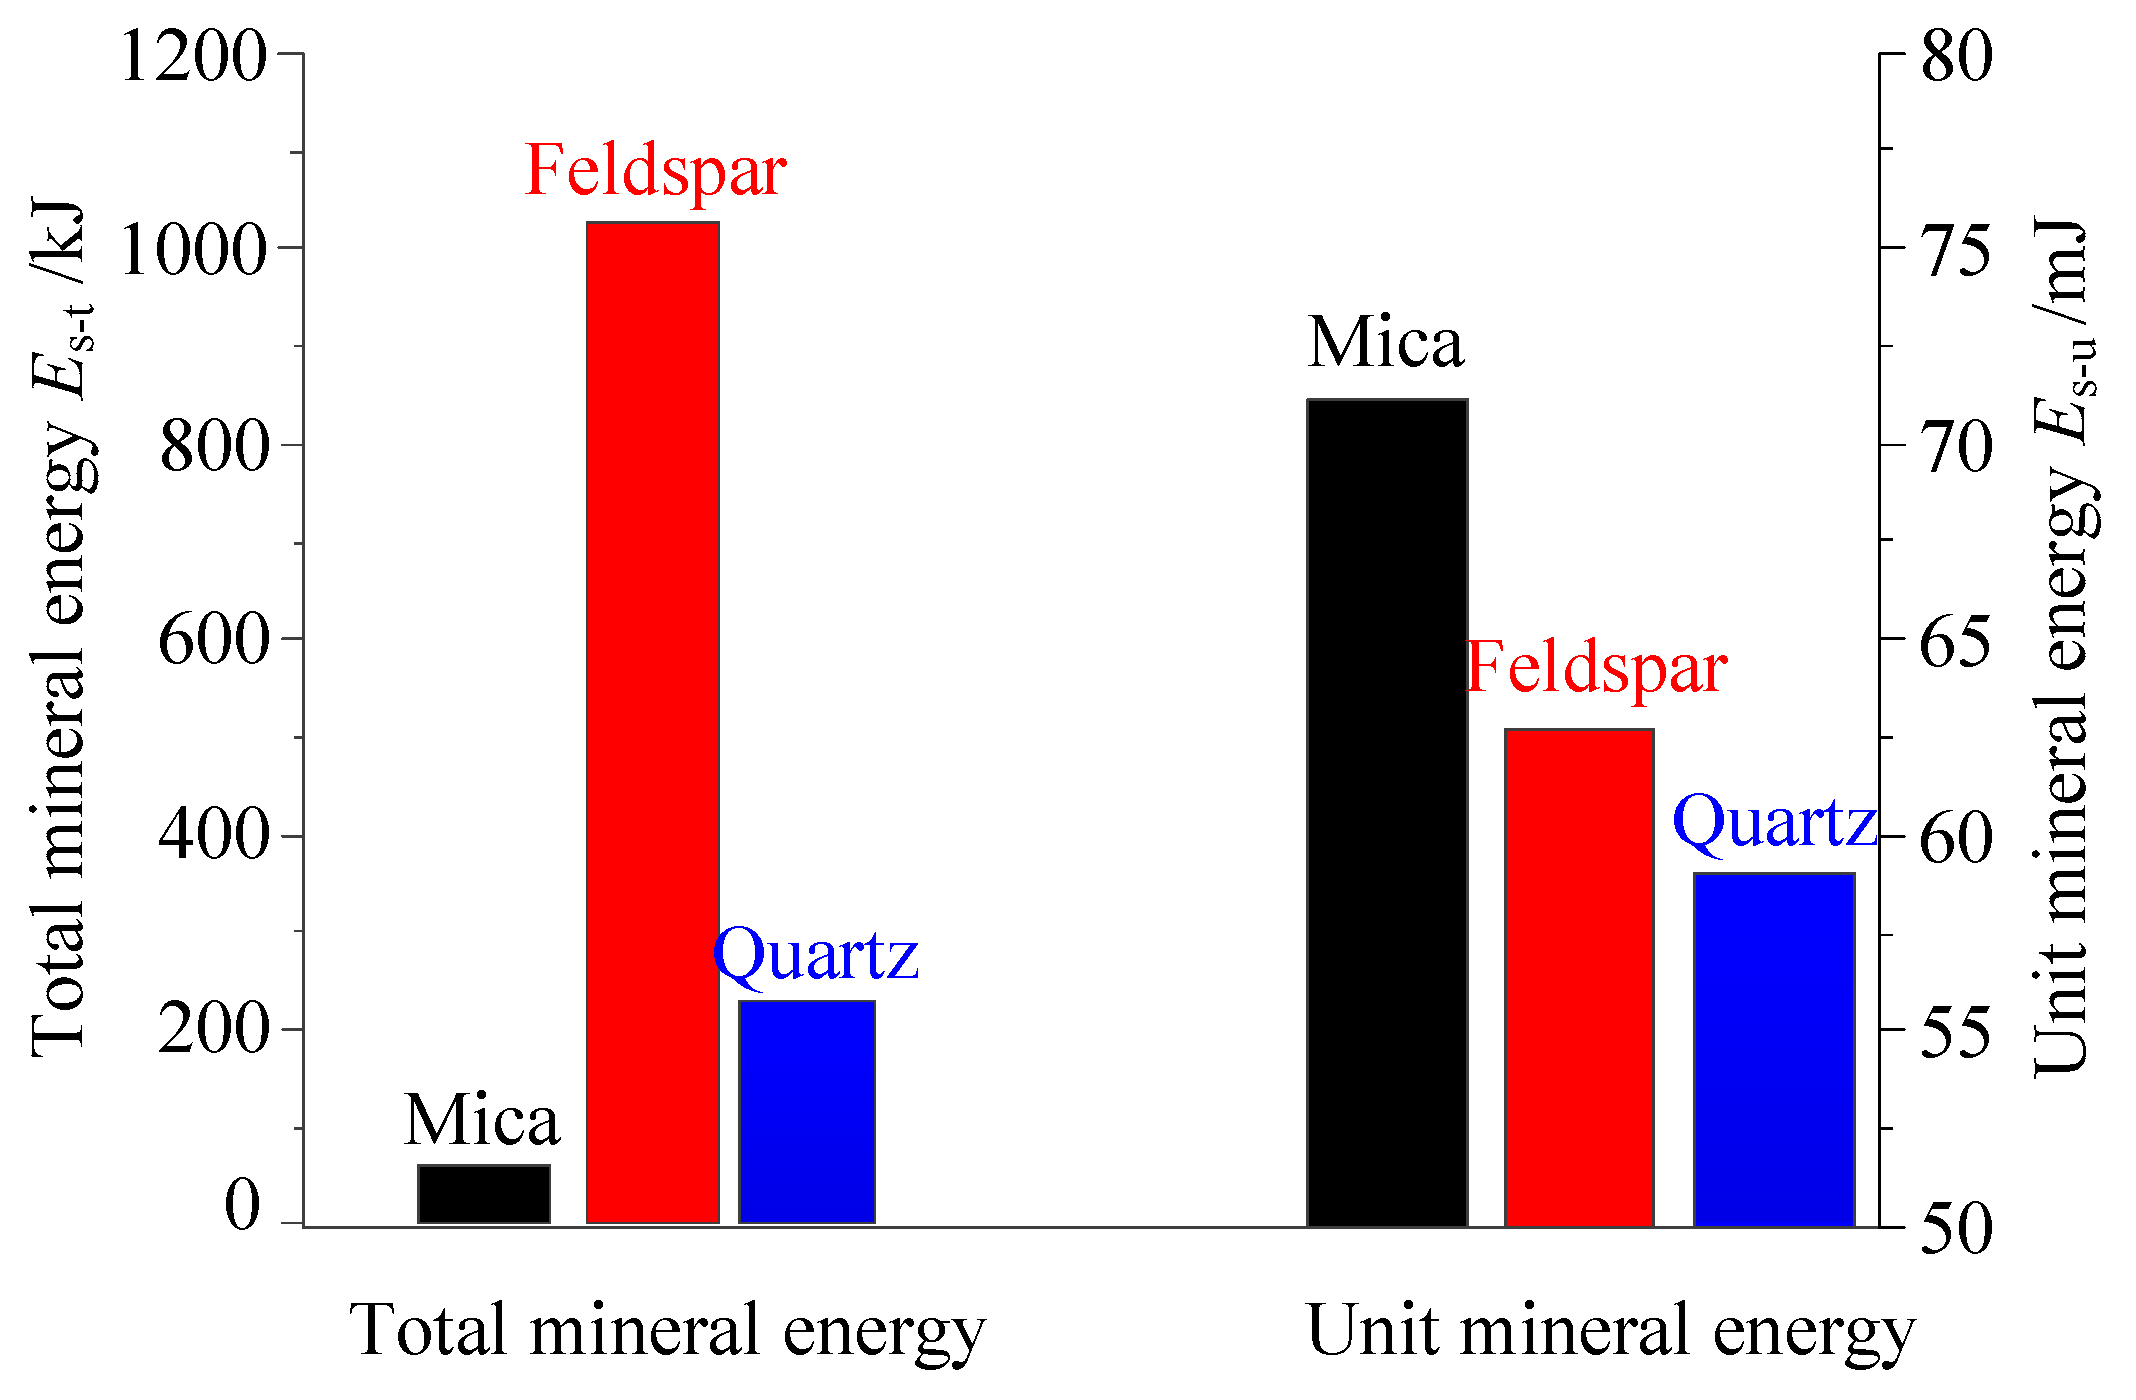
4.1. Energy Distribution of Microscopic Minerals
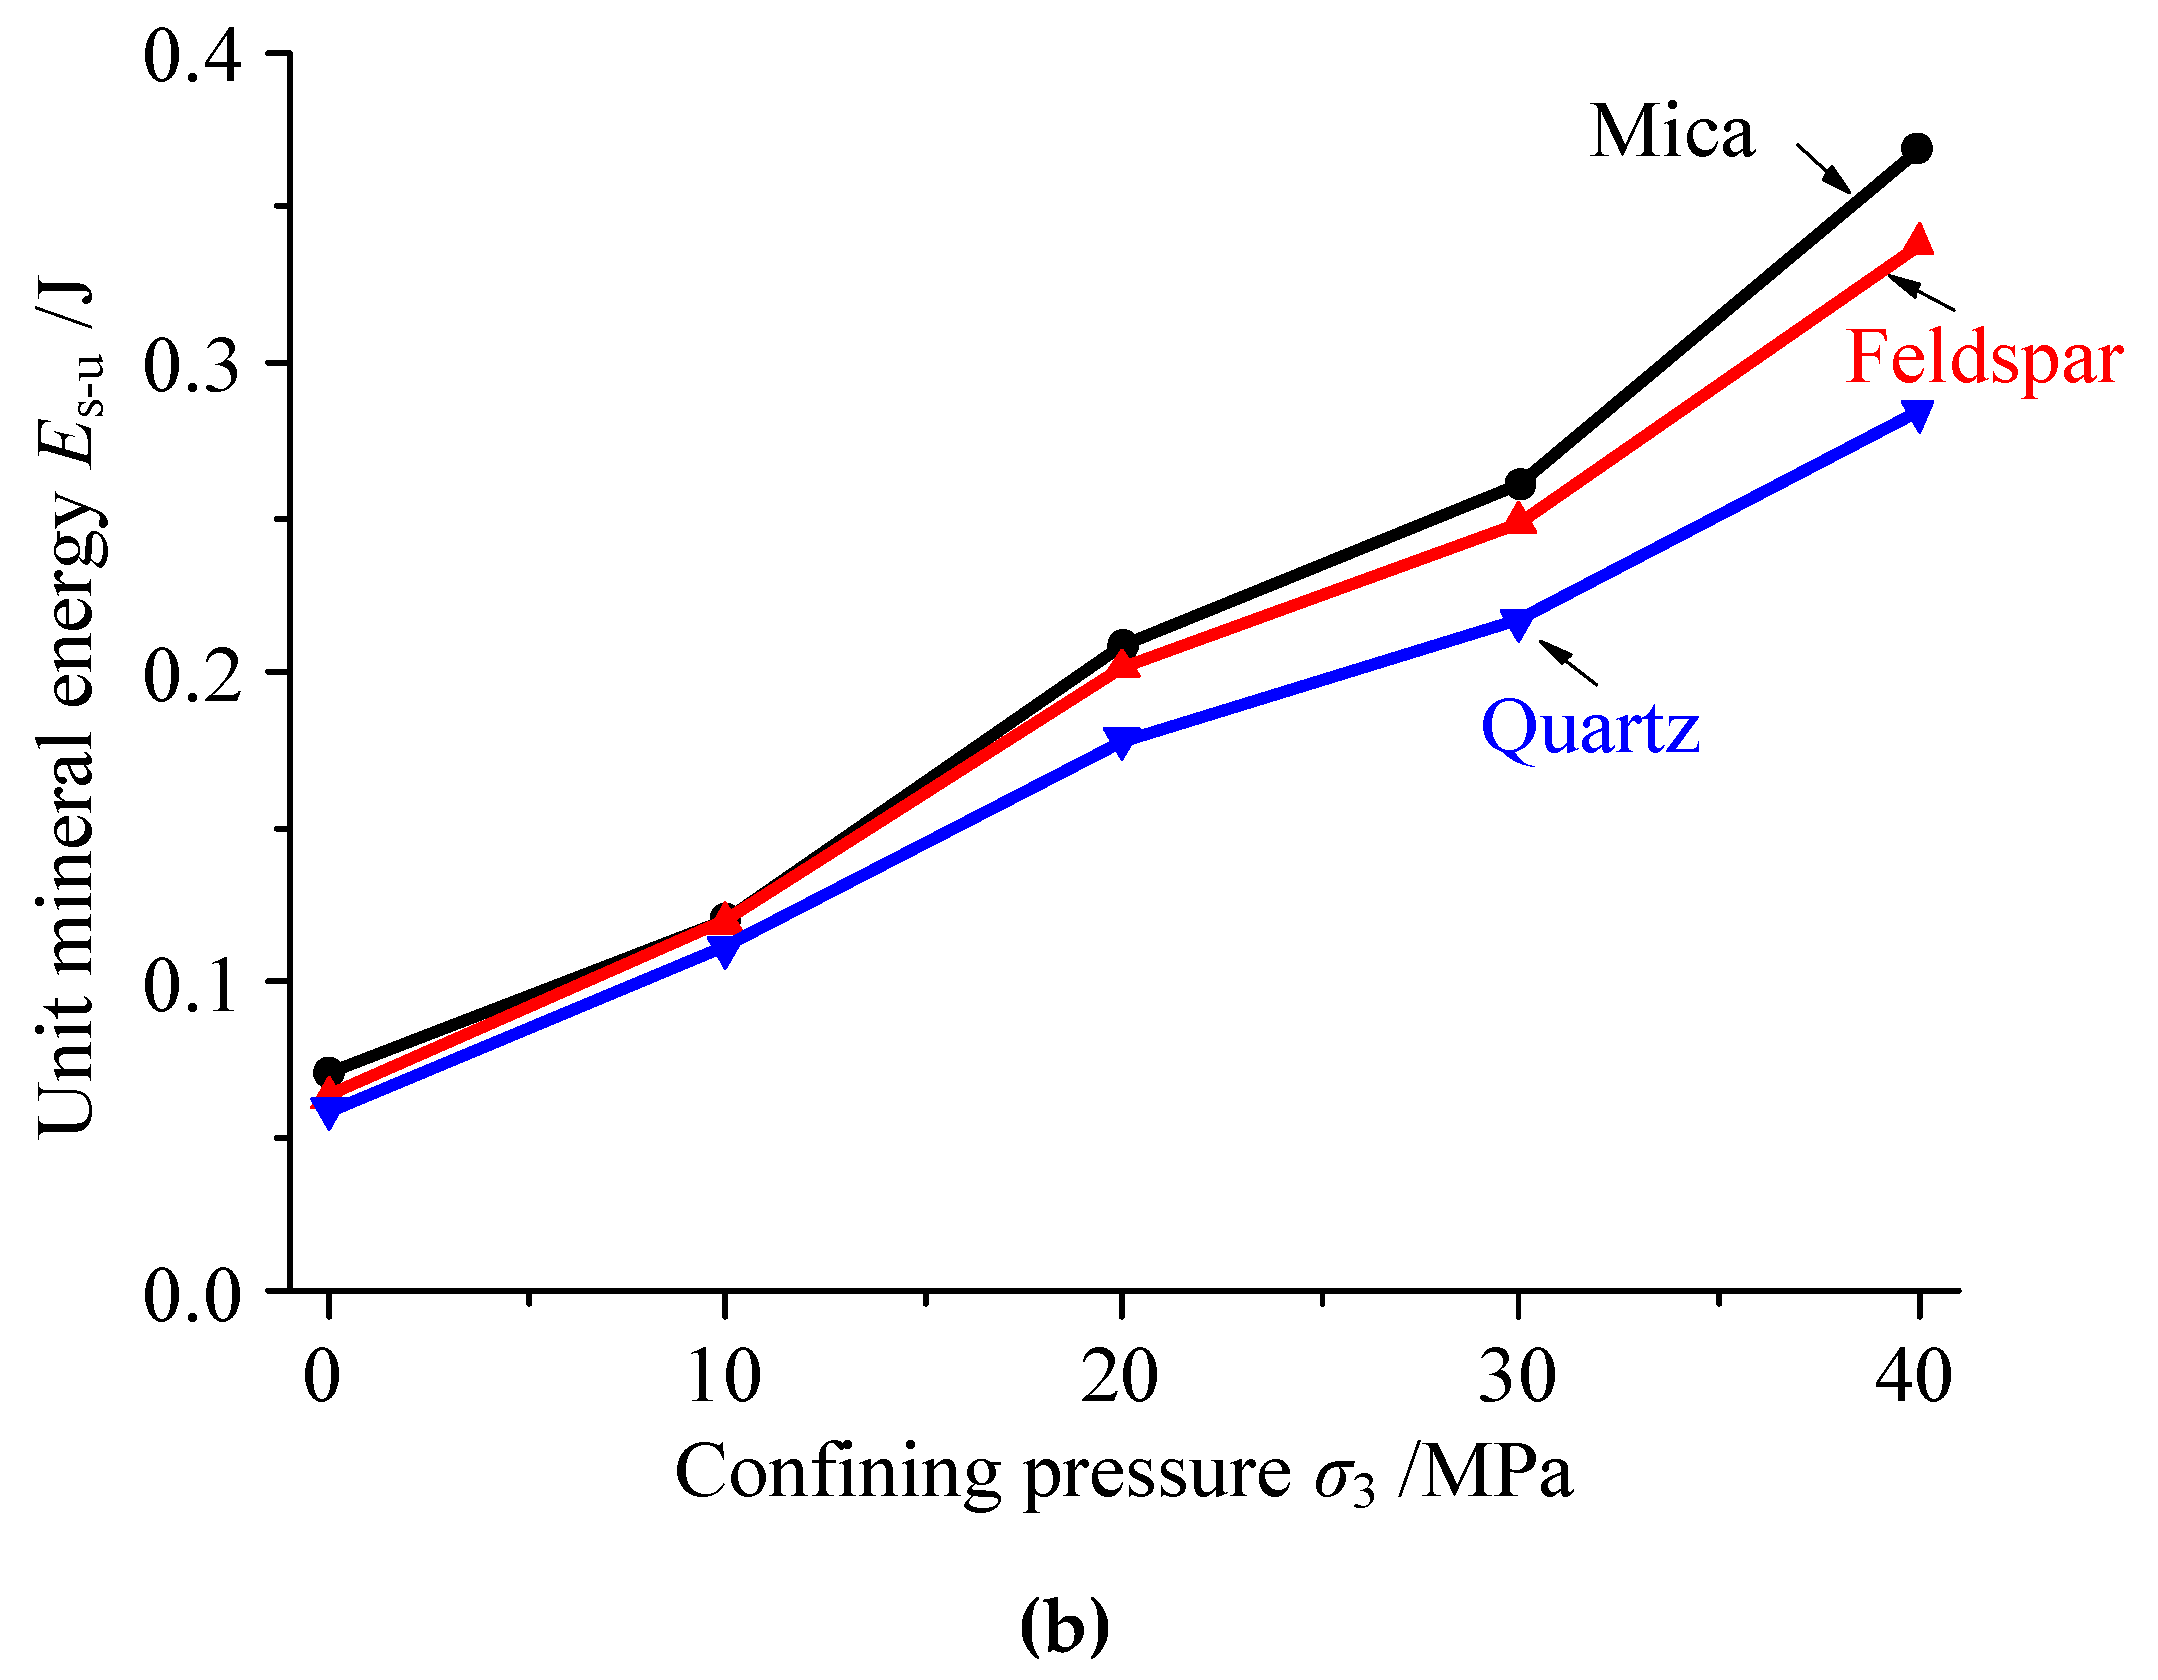
4.2. Discussion
5. Conclusions
- (1)
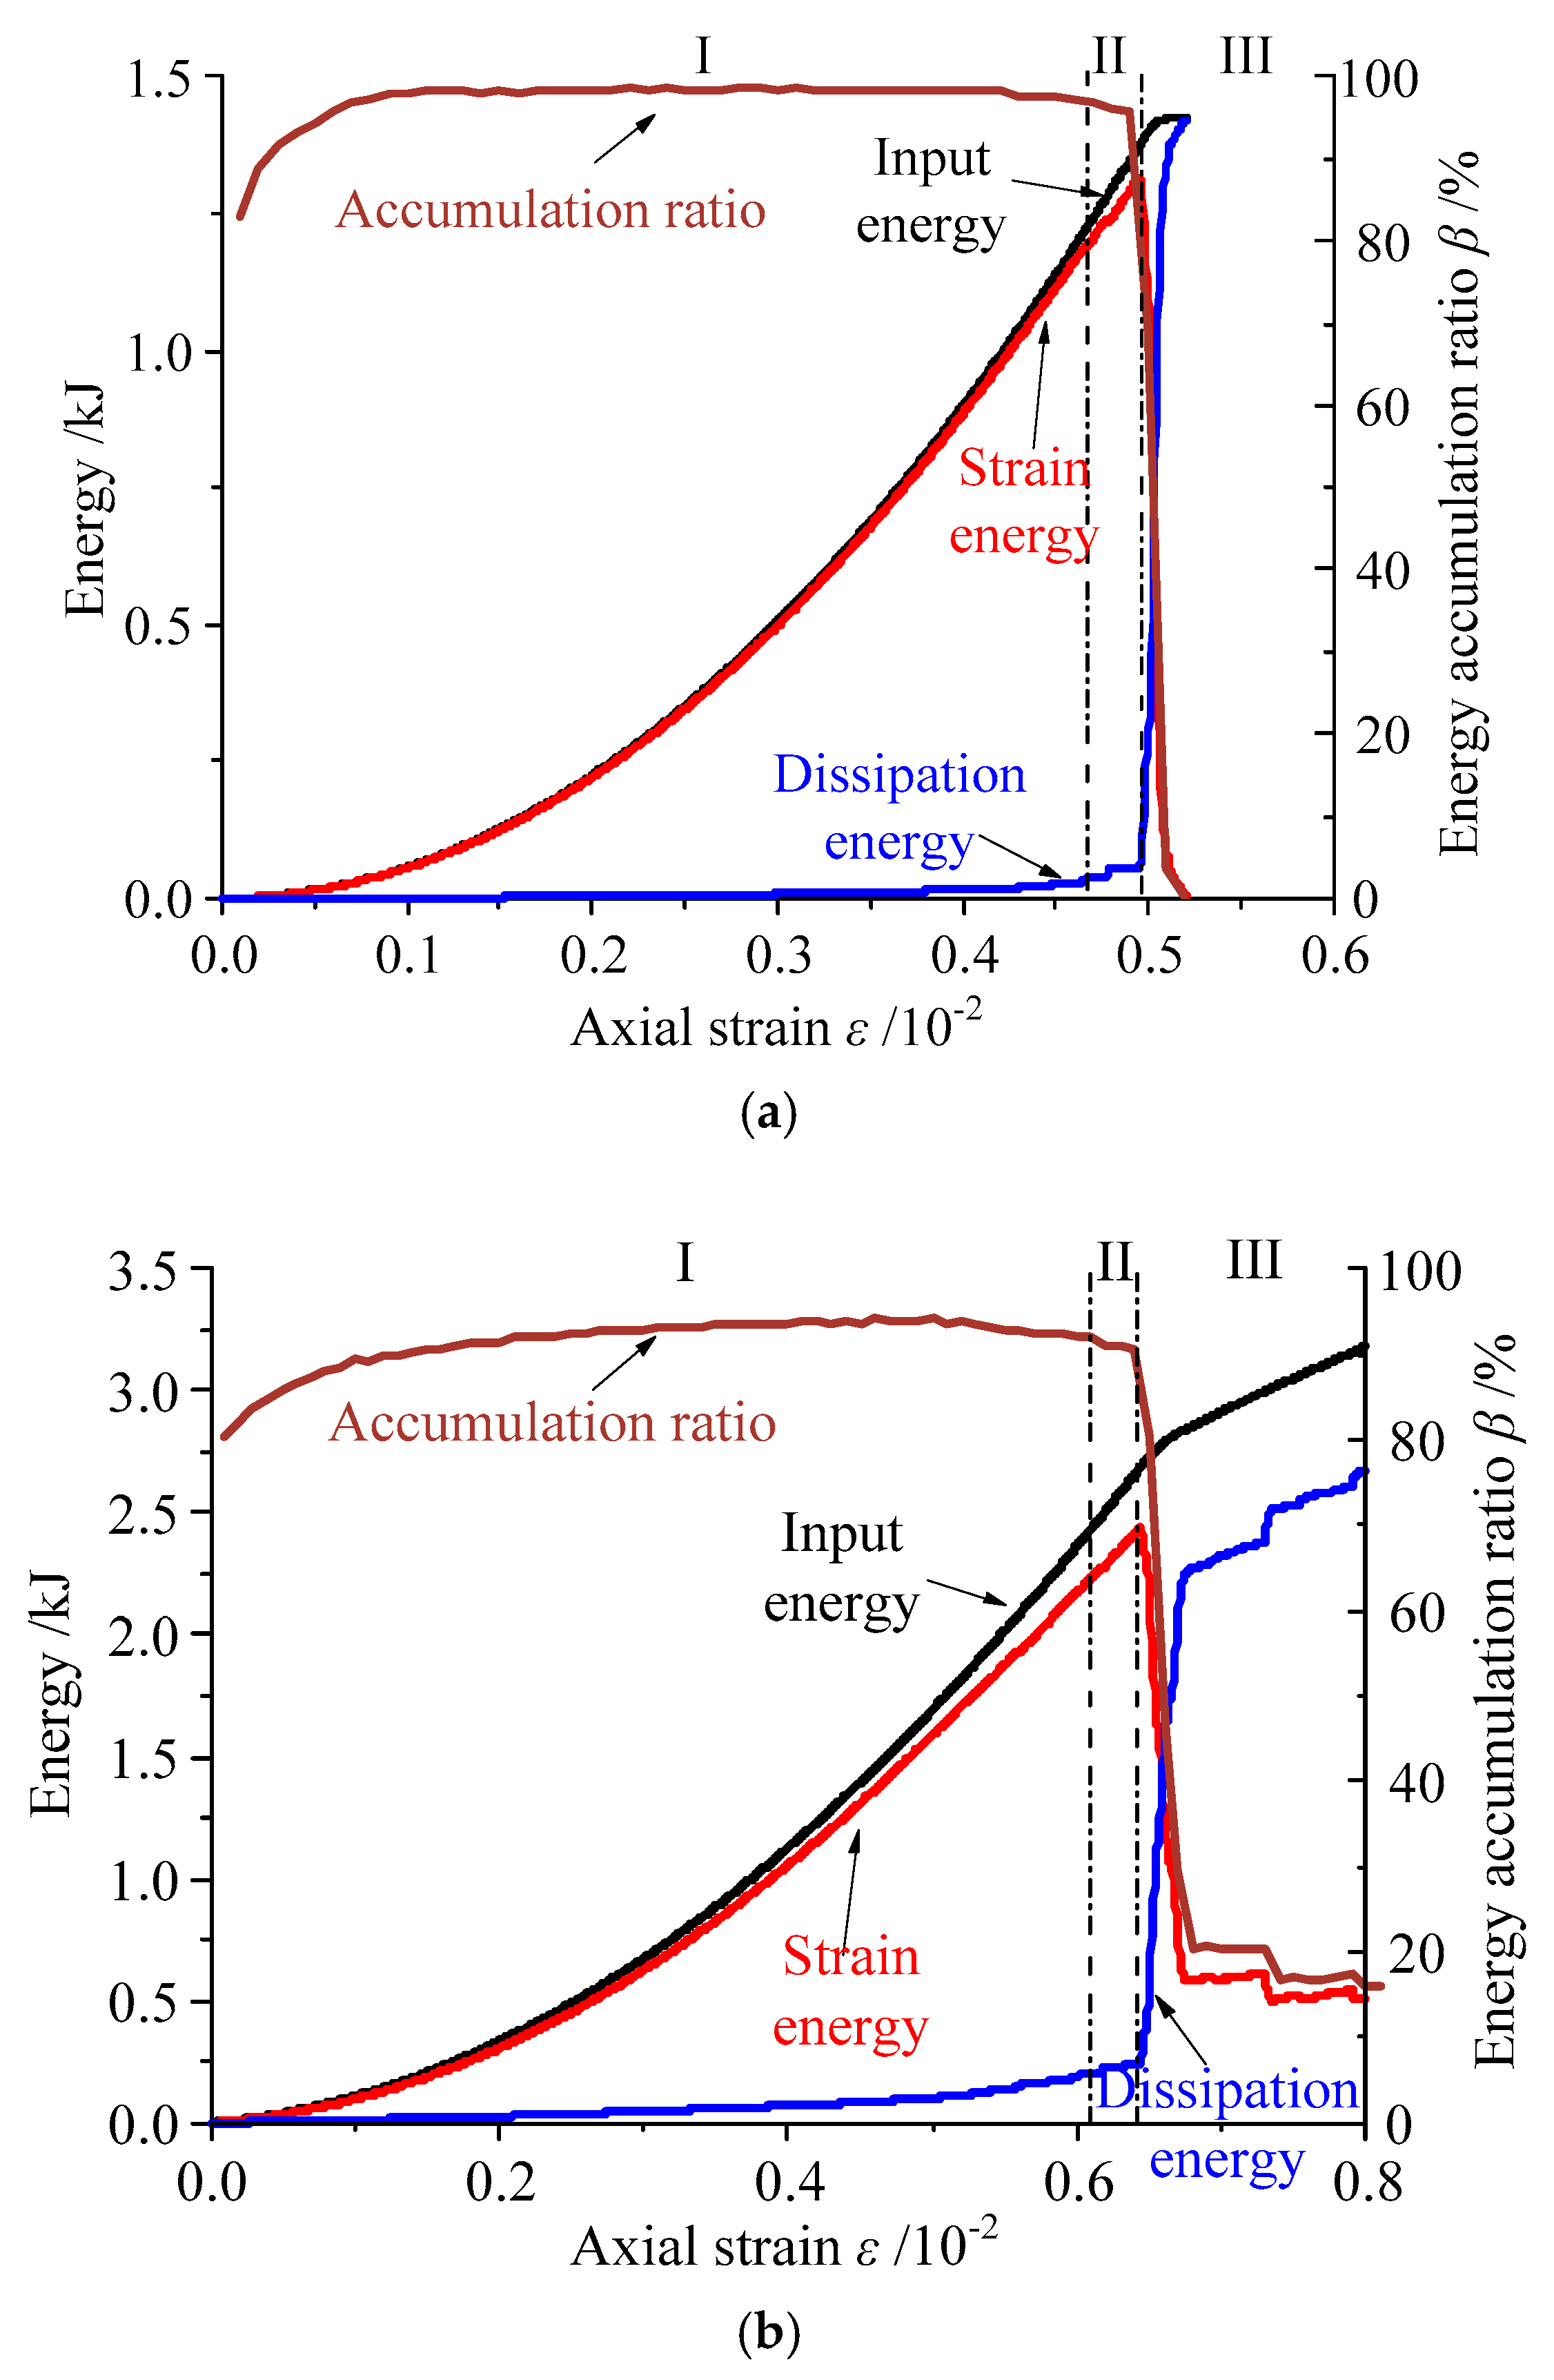
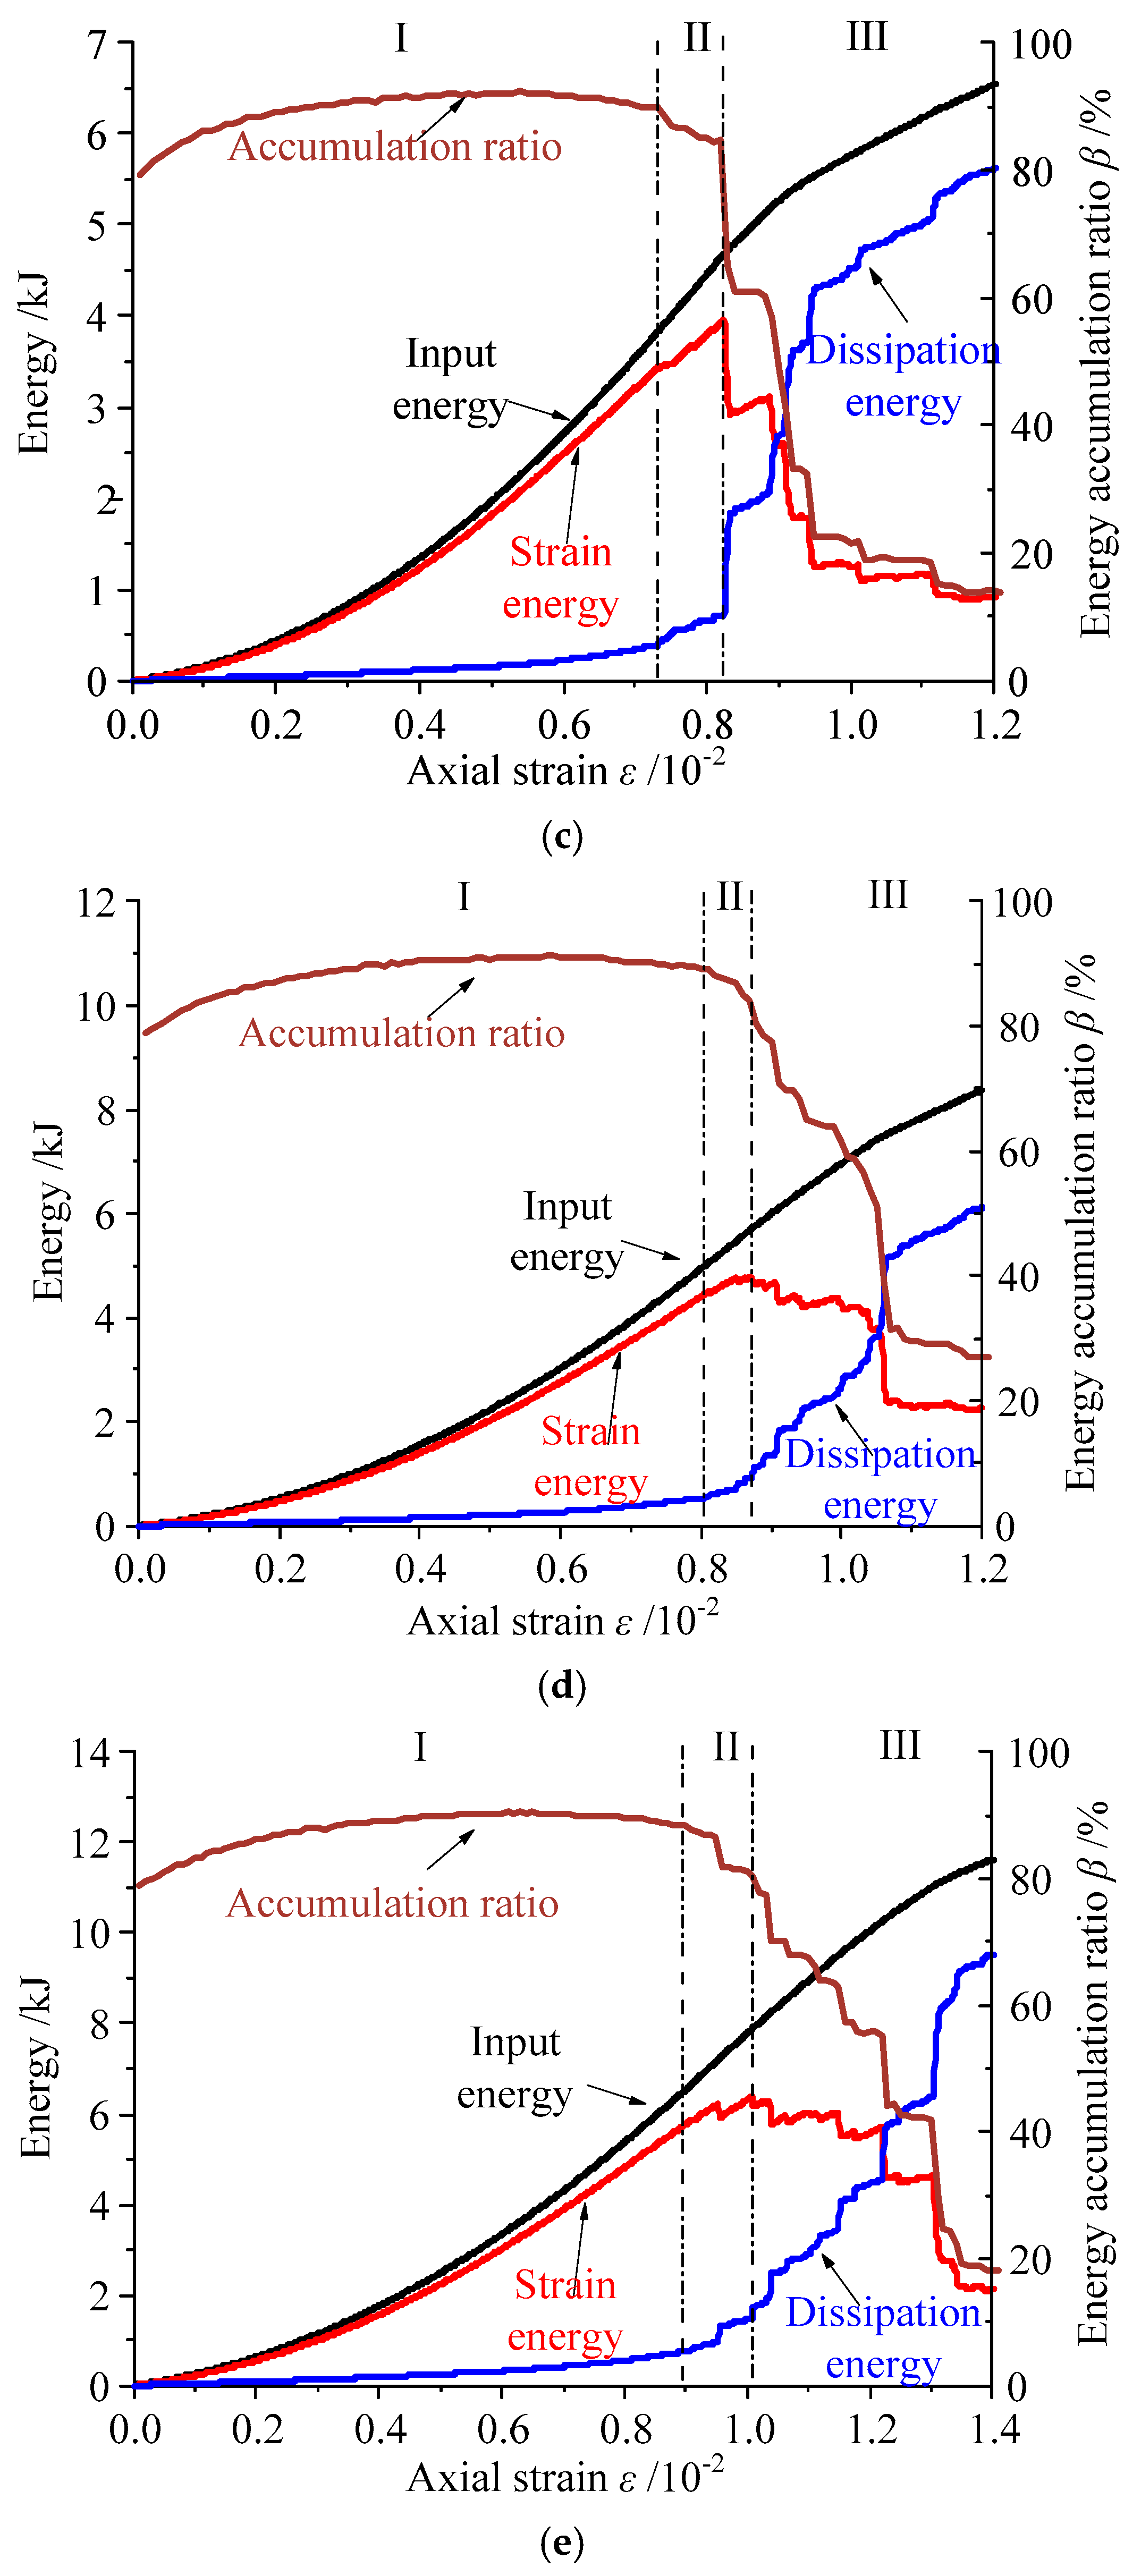
- The macro characteristics of energy evolution in granite can be divided into three stages: stable energy accumulation (Stage I), slow energy dissipation (Stage II), and rapid energy release (Stage III).
- (2)
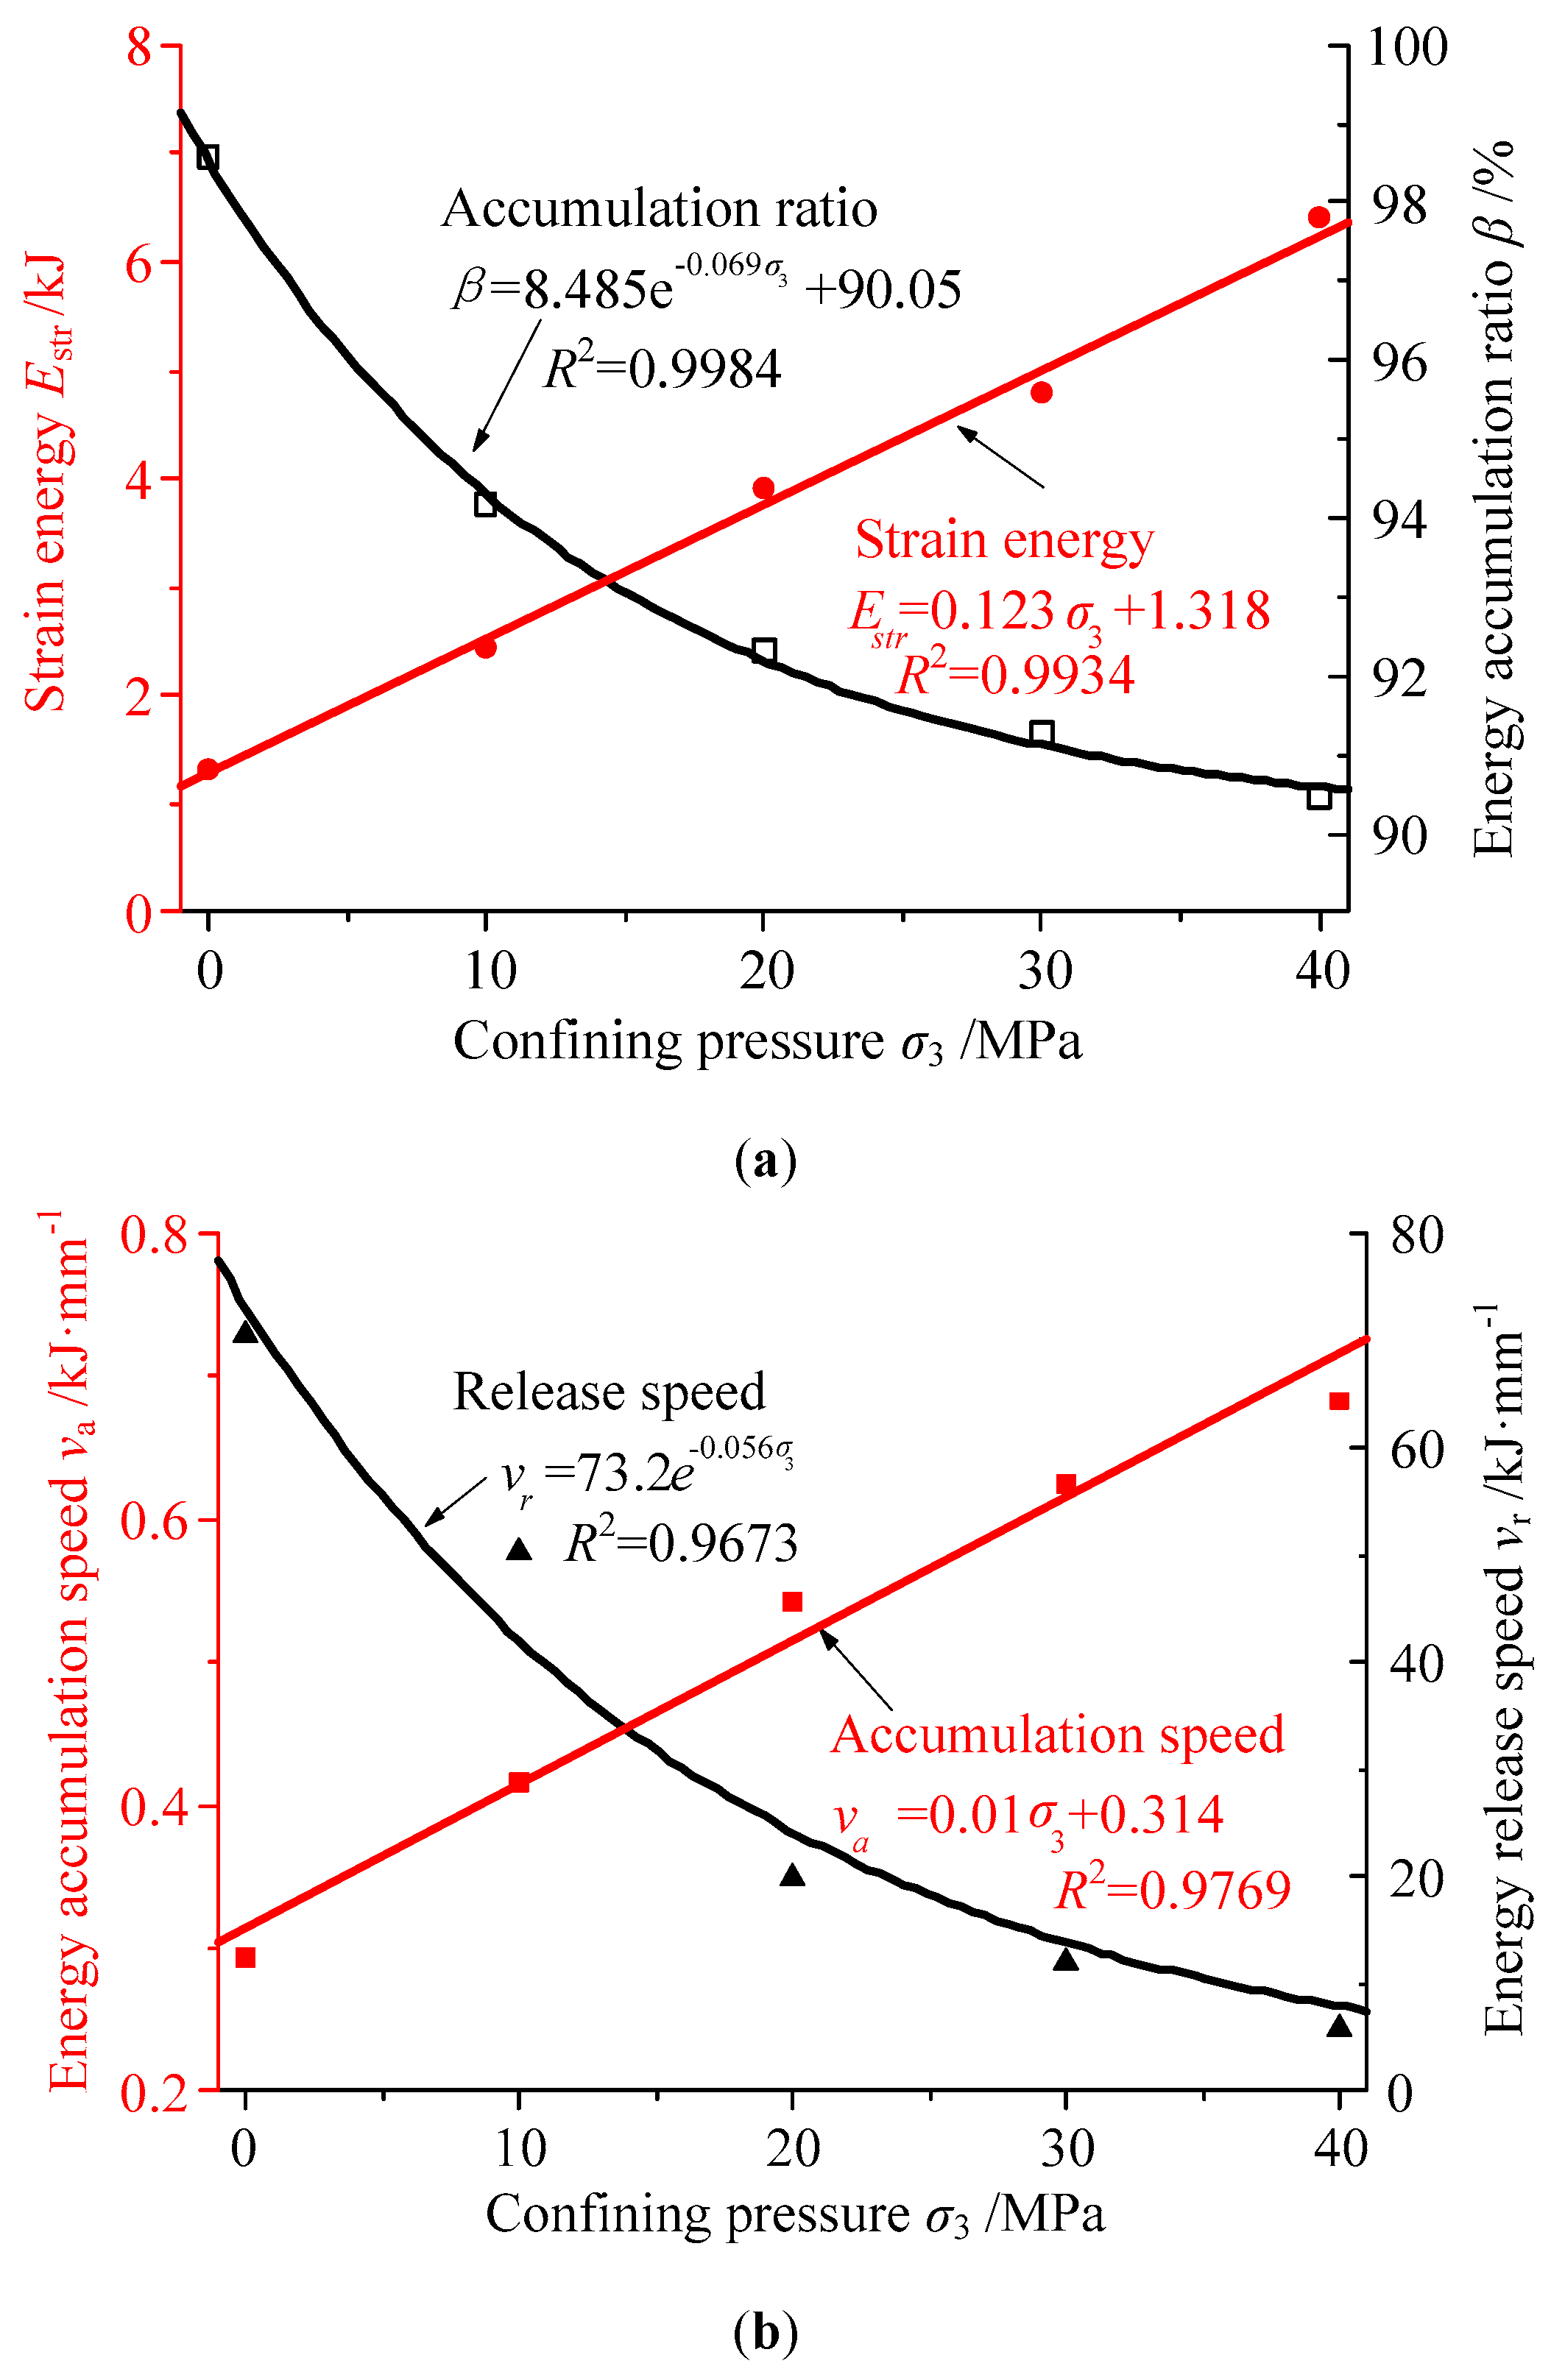
- With increasing confining pressure, the strain energy accumulation ratio decreased exponentially and the peak values of accumulated strain energy increased linearly. The energy accumulation speed increased in the form of a linear function in the pre-peak stage. In addition, the energy release speed decreased in the form of an exponential function in the post-peak stage.
- (3)
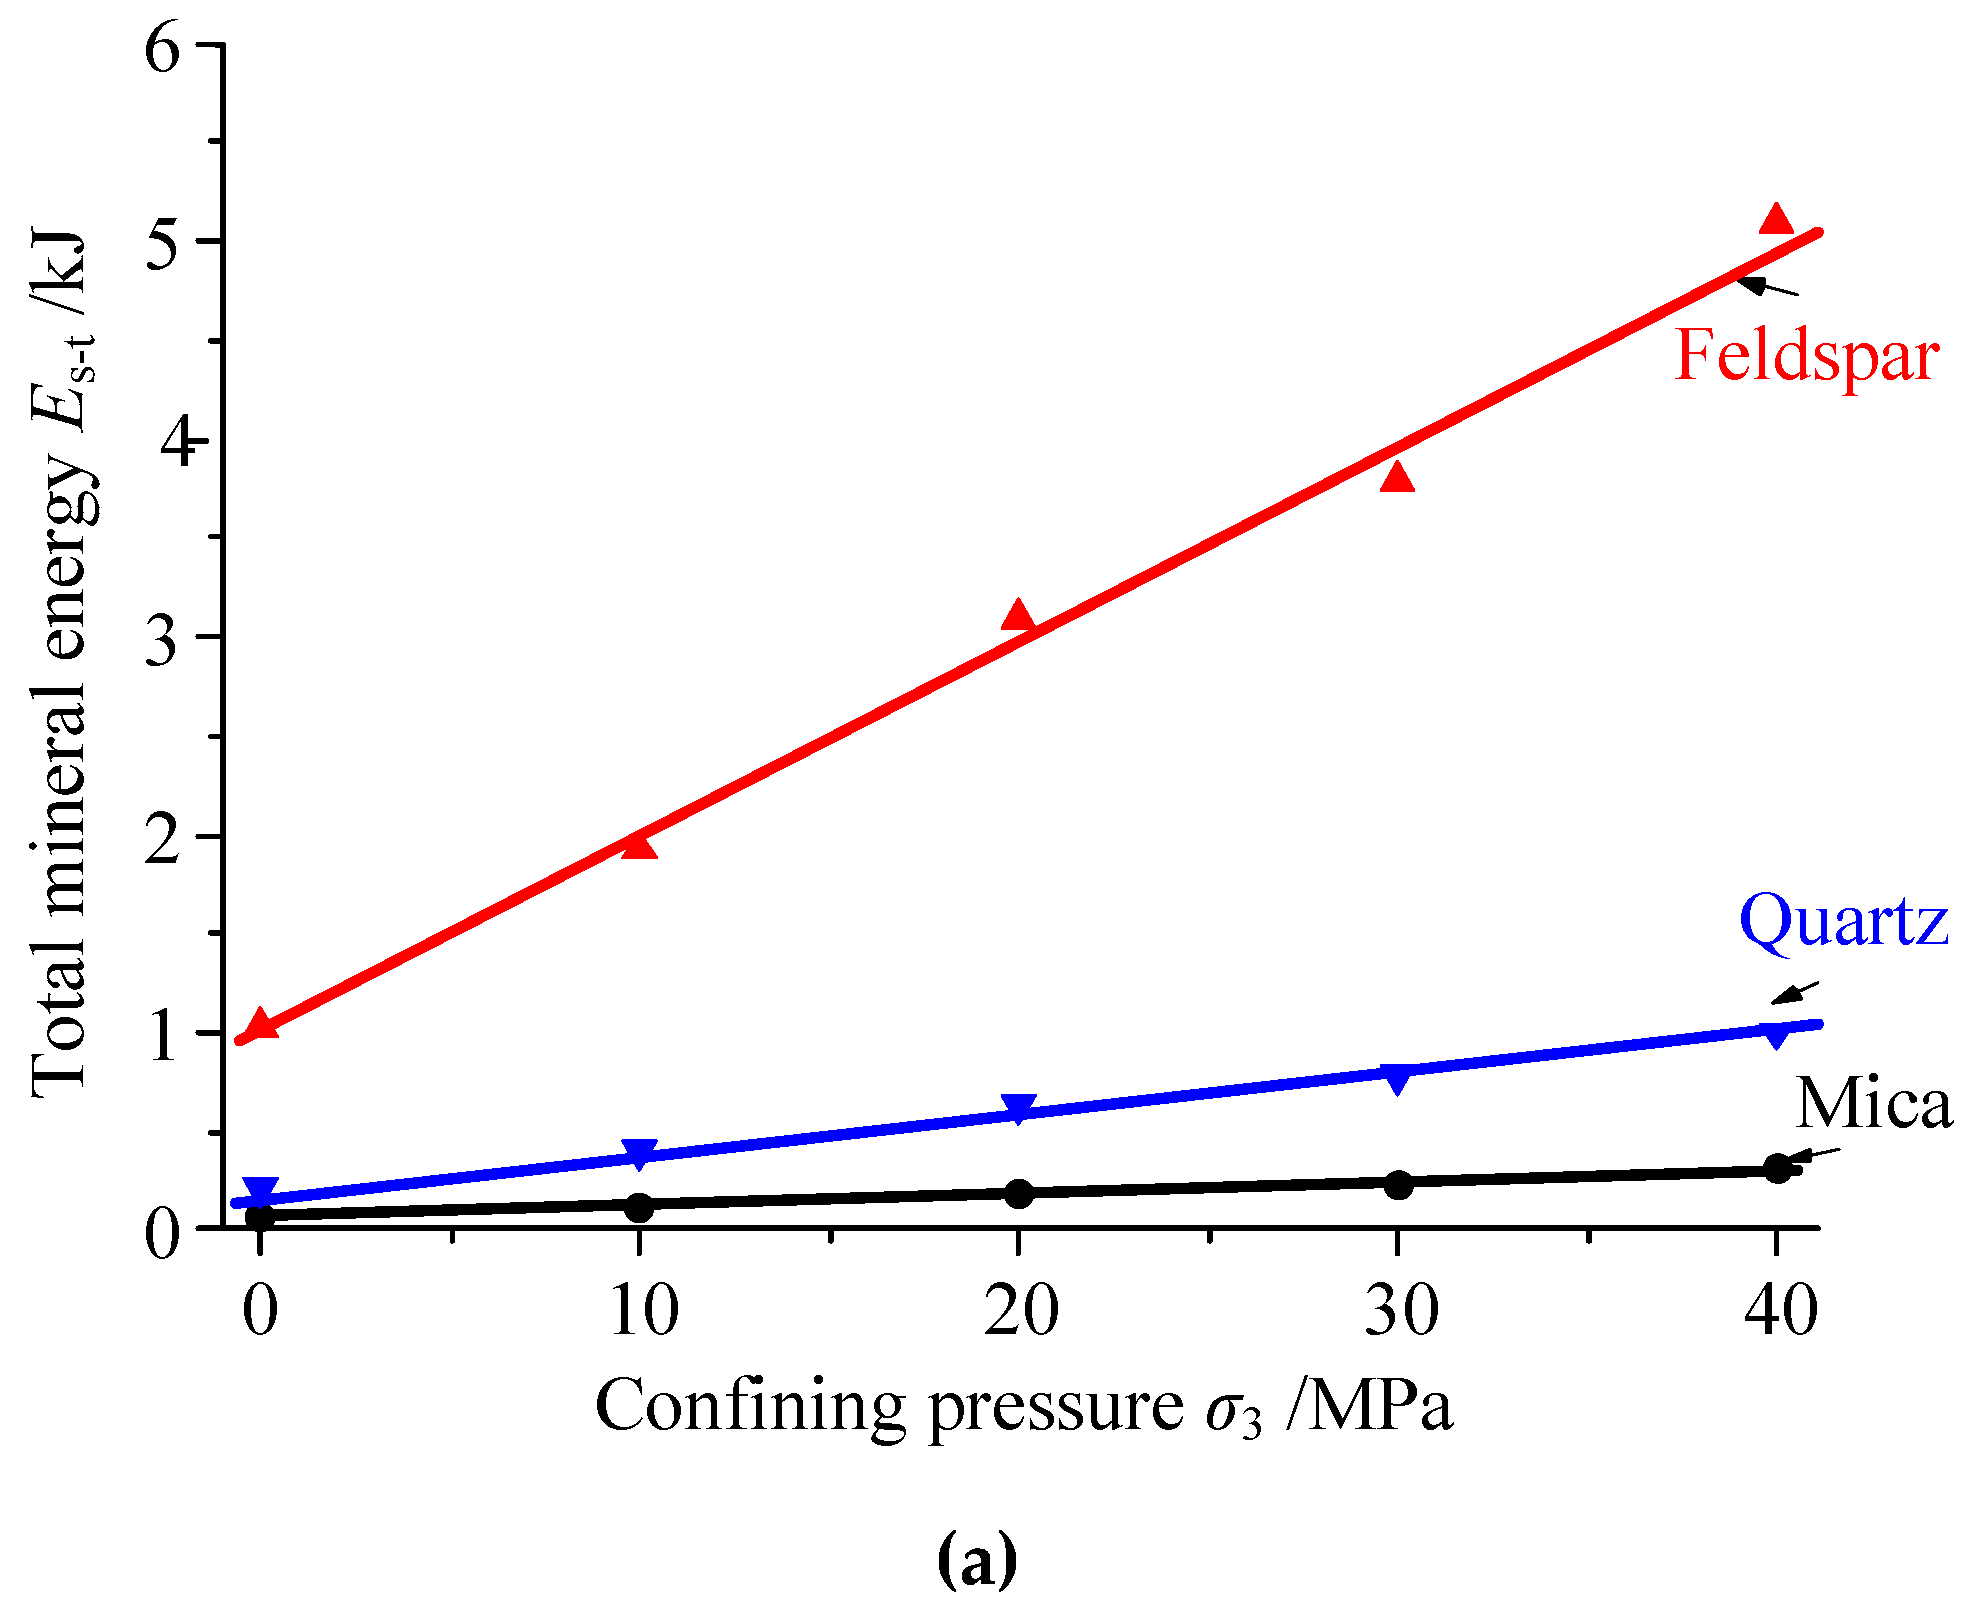
- The feldspar was the main microstructure which played a major part in accumulating energy in granite. However, the unit mineral energy of mica particles was bigger than those of feldspar and quartz. Subjected to the influence of confining pressure, the growth rate of the total energy in feldspar was the fastest. However, the growth rate of the unit mineral energy of mica was the fastest.
Author Contributions
Funding
Conflicts of Interest
References
- Peng, R.D.; Ju, Y.; Wang, J.G.; Xie, H.P.; Gao, F.; Mao, L.T. Energy dissipation and release during coal failure under conventional triaxial compression. Rock Mech. Rock Eng. 2015, 48, 509–526. [Google Scholar] [CrossRef]
- Zhao, G.Y.; Dai, B.; Dong, L.J.; Yang, C. Energy conversion of rocks in process of unloading confining pressure under different unloading paths. Trans. Nonferr. Met. Soc. 2015, 25, 1626–1632. [Google Scholar] [CrossRef]
- Li, X.B.; Li, C.J.; Cao, W.Z.; Tao, M. Dynamic stress concentration and energy evolution of deep-buried tunnels under blasting loads. Int. J. Rock Mech. Min. Sci. 2018, 104, 131–146. [Google Scholar] [CrossRef]
- Su, G.S.; Hu, L.H.; Feng, X.T.; Yan, L.B.; Zhang, G.L.; Yan, S.Z.; Zhao, B.; Yan, Z.F. True triaxial experimental study of rockbursts induced by ramp and cyclic dynamic disturbances. Rock Mech. Rock Eng. 2018, 51, 1027–1045. [Google Scholar] [CrossRef]
- Tan, Y.L.; Yu, F.H.; Ning, J.G.; Zhao, T.B. Design and construction of entry retaining wall along a gob side under hard roof stratum. Int. J. Rock Mech. Min. Sci. 2015, 77, 115–121. [Google Scholar] [CrossRef]
- Munoz, H.; Taheri, A.; Chanda, E. Fracture energy-based brittleness index development and brittleness quantification by pre-peak strength parameters in rock uniaxial compression. Rock Mech. Rock Eng. 2016, 49, 1–20. [Google Scholar] [CrossRef]
- Munoz, H.; Taheri, A.; Chanda, E. Rock Drilling Performance Evaluation by an Energy Dissipation Based Rock Brittleness Index. Rock Mech. Rock Eng. 2016, 49, 3343–3355. [Google Scholar] [CrossRef]
- Weng, L.; Huang, L.; Taheri, A.; Li, X. Rockburst characteristics and numerical simulation based on a strain energy density index: A case study of a roadway in Linglong gold mine, China. Tunn. Undergr. Space Tech. 2017, 69, 223–232. [Google Scholar] [CrossRef]
- Zhao, T.B.; Guo, W.Y.; Tan, Y.L.; Lu, C.P.; Wang, C.W. Case histories of rock bursts under complicated geological conditions. Bull. Eng. Geol. Environ. 2018, 77, 1529–1545. [Google Scholar] [CrossRef]
- Li, D.Y.; Sun, Z.; Xie, T.; Li, X.B.; Ranjith, P.G. Energy evolution characteristics of hard rock during triaxial failure with different loading and unloading paths. Eng. Geol. 2017, 228, 270–281. [Google Scholar] [CrossRef]
- Yang, R.S.; Ding, C.X.; Yang, L.Y.; Chen, C. Model experiment on dynamic behavior of jointed rock mass under blasting at high-stress conditions. Tunn. Undergr. Space Tech. 2018, 74, 145–152. [Google Scholar] [CrossRef]
- Zhang, C.G.; Tahmasebinia, F.; Canbulat, I.; Vardar, O.; Saydam, S. Analytical Determination of Energy Release in a Coal Mass. Energies 2018, 11, 285. [Google Scholar] [CrossRef]
- Ning, J.G.; Wang, J.; Jiang, J.Q.; Hu, S.C.; Jiang, L.S.; Liu, X.S. Estimation of crack initiation and propagation threshold of confined brittle coal specimens based on energy dissipation theory. Rock Mech. Rock Eng. 2018, 51, 119–134. [Google Scholar] [CrossRef]
- Chen, C.; Li, X. Cyclic experimental studies on damage evolution behaviors of shale dependent on structural orientations and confining pressures. Energies 2018, 11, 160. [Google Scholar] [CrossRef]
- Liu, X.S.; Tan, Y.L.; Ning, J.G.; Lu, Y.W.; Gu, Q.H. Mechanical properties and damage constitutive model of coal in coal-rock combined body. Int. J. Rock Mech. Min. Sci. 2018, 110, 140–150. [Google Scholar] [CrossRef]
- Guo, W.Y.; Tan, Y.L.; Yu, F.H.; Zhao, T.B.; Hu, S.C.; Huang, D.M.; Qin, Z. Mechanical behavior of rock-coal-rock specimens with different coal thickness. Geomech. Eng. 2018, 15, 1017–1027. [Google Scholar] [CrossRef]
- Wang, Q.S.; Ma, G.W.; Wang, X.J. Numerical simulation on tensile failure of rock-like heterogeneous material using a modified SPH method. Int. J. Comput. Methods 2015, 12. [Google Scholar] [CrossRef]
- Wang, J.C.; Wang, Z.H.; Yang, S.Q. A coupled macro- and meso-mechanical model for heterogeneous coal. Int. J. Rock Mech. Min. Sci. 2017, 94, 64–81. [Google Scholar] [CrossRef]
- Pan, X.H.; Xiong, Q.Q.; Wu, Z.J. New method for obtaining the homogeneity index m of Weibull distribution using peak and crack damage strains. Int. J. Geomech. 2018, 18. [Google Scholar] [CrossRef]
- Wang, G.; Chu, X.Y.; Yang, X.X. Numerical simulation of gas flow in artificial fracture coal by three-dimensional reconstruction based on computed tomography. J. Nat. Gas Sci. Eng. 2016, 34, 828–831. [Google Scholar] [CrossRef]
- Liu, X.F.; Wang, J.F.; Ge, L.; Hu, F.L.; Li, C.L.; Li, X.; Yu, J.; Xu, H.J.; Lu, S.F.; Xue, Q.Z. Pore-scale characterization of tight sandstone in Yancheng Formation Ordos Basin China using micro-CT and SEM imaging from nm- to cm-scale. Fuel 2017, 209, 254–264. [Google Scholar] [CrossRef]
- Munawar, M.J.; Lin, C.; Cnudde, V.; Bultreys, T.; Dong, C.M.; Zhang, X.G.; De, W.; Zahid, M.A.; Wu, Y.Q. Petrographic characterization to build an accurate rock model using micro-CT: Case study on low-permeable to tight turbidite sandstone from Eocene Shahejie Formation. Micron 2018, 109, 22–33. [Google Scholar] [CrossRef] [PubMed]
- Li, A.; Shao, G.J.; Du, P.R.; Ding, S.Y.; Su, J.B. Numerical studies on stratified rock failure based on digital image processing technique at mesoscale. Comput. Mater. Contin. 2015, 45, 17–38. [Google Scholar] [CrossRef]
- Munoz, H.; Taheri, A.; Chanda, E. Pre-peak and post-peak rock strain characteristics during uniaxial compression by 3D digital image correlation. Rock Mech. Rock Eng. 2016, 49, 2541–2554. [Google Scholar] [CrossRef]
- Islam, A.; Chevalier, S.; Sassi, M. Structural characterization and numerical simulations of standard and reservoir carbonate rocks using micro-tomography. Comput. Geosci. 2018, 113, 14–22. [Google Scholar] [CrossRef]
- Molladavoodi, H.; RahimiRezaei, Y. Heterogeneous rock simulation using DIP-micromechanics-statistical methods. Adv. Civ. Eng. 2018. [Google Scholar] [CrossRef]
- Chen, S.; Yue, Z.Q.; Tham, L.G. Digital image-based numerical modeling method for prediction of inhomogeneous rock failure. Int. J. Rock Mech. Min. Sci. 2004, 41, 939–957. [Google Scholar] [CrossRef]
- Yin, Y.C.; Zhao, T.B.; Tan, Y.L.; Yu, F.H. Reconstruction and numerical test of the mesoscopic model of rock based on Otsu digital image processing. Rock Soil Mech. 2015, 36, 2532–2540. [Google Scholar] [CrossRef]
- Potyondy, D.O.; Cundall, P.A. A bonded-particle model for rock. Int. J. Rock Mech. Min. Sci. 2004, 41, 1329–1364. [Google Scholar] [CrossRef]
- Tian, W.L.; Yang, S.Q.; Huang, Y.H. Macro and micro mechanics behavior of granite after heat treatment by cluster model in particle flow code. Acta Mech. Sin. 2018, 34, 175–186. [Google Scholar] [CrossRef]
- Peng, J.; Wong, L.N.Y.; Teh, C.l.; Li, Z. Modeling micro-cracking behavior of Bukit Timah granite using grain-based model. Rock Mech. Rock Eng. 2018, 51, 135–154. [Google Scholar] [CrossRef]
- Cundall, P.; Strack, O. Particle Flow Code in 2 Dimensions; Itasca Consulting Group, Inc.: Minneapolis, MN, USA, 1999. [Google Scholar]
- Zhang, Z.Z.; Gao, F. Confining pressure effect on rock energy. Chin. J. Rock Mech. Eng. 2015, 34, 1–11. (In Chinese) [Google Scholar]
- Wang, S.R.; Hagan, P.; Zhao, Y.H.; Chang, X.; Song, K.; Zou, Z.S. The effect of confining pressure and water content on energy evolution characteristics of sandstone under stepwise loading and unloading. Adv. Civ. Eng. 2018. [Google Scholar] [CrossRef]


| Parameters | ρ/kg·m−3 | kn/GPa | ks/GPa | /GPa | /GPa | σn/MPa | σs/MPa | λ | μ |
|---|---|---|---|---|---|---|---|---|---|
| Mica | 2800 | 20 | 8 | 40 | 16 | 115 | 115 | 1 | 0.5 |
| Feldspar | 2700 | 28 | 11.2 | 56 | 22.4 | 130 | 130 | 1 | 0.5 |
| Quartz | 2650 | 36 | 14.4 | 72 | 28.8 | 175 | 175 | 1 | 0.5 |
© 2019 by the authors. Licensee MDPI, Basel, Switzerland. This article is an open access article distributed under the terms and conditions of the Creative Commons Attribution (CC BY) license (http://creativecommons.org/licenses/by/4.0/).
Share and Cite
Zhang, Y.; Zhao, T.; Yin, Y.; Tan, Y.; Qiu, Y. Numerical Research on Energy Evolution in Granite under Different Confining Pressures Using Otsu’s Digital Image Processing and PFC2D. Symmetry 2019, 11, 131. https://doi.org/10.3390/sym11020131
Zhang Y, Zhao T, Yin Y, Tan Y, Qiu Y. Numerical Research on Energy Evolution in Granite under Different Confining Pressures Using Otsu’s Digital Image Processing and PFC2D. Symmetry. 2019; 11(2):131. https://doi.org/10.3390/sym11020131
Chicago/Turabian StyleZhang, Yubao, Tongbin Zhao, Yanchun Yin, Yunliang Tan, and Yue Qiu. 2019. "Numerical Research on Energy Evolution in Granite under Different Confining Pressures Using Otsu’s Digital Image Processing and PFC2D" Symmetry 11, no. 2: 131. https://doi.org/10.3390/sym11020131
APA StyleZhang, Y., Zhao, T., Yin, Y., Tan, Y., & Qiu, Y. (2019). Numerical Research on Energy Evolution in Granite under Different Confining Pressures Using Otsu’s Digital Image Processing and PFC2D. Symmetry, 11(2), 131. https://doi.org/10.3390/sym11020131