Abstract
When detecting micro-distortion of lidar scanning signals, current hardwires and algorithms have low compatibility, resulting in slow detection speed, high energy consumption, and poor performance against interference. A geometric statistics-based micro-distortion detection technology for lidar scanning signals was proposed. The proposed method built the overall framework of the technology, used TCD1209DG (made by TOSHIBA, Tokyo, Japan) to implement a linear array CCD (charge-coupled device) module for photoelectric conversion, signal charge storage, and transfer. Chip FPGA was used as the core component of the signal processing module for signal preprocessing of TCD1209DG output. Signal transmission units were designed with chip C8051, FT232, and RS-485 to perform lossless signal transmission between the host and any slave. The signal distortion feature matching algorithm based on geometric statistics was adopted. Micro-distortion detection of lidar scanning signals was achieved by extracting, counting, and matching the distorted signals. The correction of distorted signals was implemented with the proposed method. Experimental results showed that the proposed method had faster detection speed, lower detection energy consumption, and stronger anti-interference ability, which effectively improved micro-distortion correction.
1. Introduction
The recent development of wireless information has promoted the maturity of laser lidar mapping technology. As a key technology in the field of surveying and mapping, lidar scanning has received more and more attention from relevant experts and scholars [1,2]. Lidar mapping technology quickly and accurately acquires three-dimensional information of objects, making it widely used in production and life [3]. However, due to factors, such as the outdoor light, the lidar scanning signal is slightly distorted, which affects the accuracy of the acquired information [4]. Detection for micro-distortion of lidar scanning signals improves the quality of the acquired lidar scanning signal, which is of great significance for ensuring the utilization efficiency of lidar scanning signals [5]. However, existing distortion detection technologies of lidar scanning signals only detect the region where the target’s distortion of three-dimensional information is severe. With the popularity of lidar scanning applications, accuracy requirements for lidar scanning are getting higher [6]. Since current complicated micro-distortion detection technologies of lidar scanning signals have poor anti-interference, micro-distortion detection technology of scanning signals has become the focus of research in this area. With the deepening of the research content, some mature theories and applications have been produced [7].
Different experts and scholars realized the detection of micro-distortion for scanning signals by different methods in years. However, there are still some shortcomings in this research domain and need follow-up experts and scholars to study. A micro-distortion detection technology based on fiber optic gyroscope was proposed by Zheng et al. [8]. The calibrated signal structure was tested linearly by achieving a level gauge of horizontal and vertical signal distortion calibration. Micro-distortion detection was further realized by the calibration result. However, this method did not pre-process scanning signals, so its distortion detection was easily interfered by factors, such as illumination change. Lupi et al. [9] proposed a distortion detection technique for lidar scanning signals based on active panoramic vision. Lidar scanning signal information was obtained by acquiring three-dimensional coordinates of point clouds for lidar scanning signals. Then, lidar scanning signals were preprocessed, and their three-dimensional coordinates of the feature points for lidar scanning signals were determined to realize quantitative analysis. According to the analysis results, a three-dimensional model was constructed to realize distortion detection for lidar scanning signals. However, the detection process of this method was complicated, which affected high time-consuming detection. Xu et al. [10] proposed a distortion detection technique based on ASODVS (Active Stereo Omni-Directional Vision Sensing) for lidar scanning signals. The midpoint of the lidar scanning signal was determined by a Gaussian curve. The waveform of the lidar signal was smoothed by the Bezier curve. Lidar scanning signal was calibrated by ASODVS, and its distortion detection was realized by qualitative analysis. However, in the process of detecting the distortion signal designed by this method, more energy was consumed, and its detection cost was higher. In [10], it was proposed to use FPGA (Stratix, made by ALTERA, San Jose, California, USA) as the main control equipment, design a general echo signal acquisition card with 20 MHz sampling rate, filtering and hardware accumulation functions, and configurable parameters. For the design of the analog-to-digital conversion circuit and its peripheral circuit, signal conditioning circuit, level conversion circuit, RS232 interface circuit, and power circuit in the analog board card, the logic design of FPGA was given in that circuit too. For the radar scanning signal detection, the basic parameter configuration function and accumulation function were implemented, but the method had poor detection accuracy for long-distance signal detection.
Therefore, a micro-distortion detection method for lidar scanning signals with geometric statistical characteristics was proposed in this paper. The experimental study of lidar with a frequency of 500 MHz was carried out. The proposed method used TCD1209DG to model the linear array CCD (charge-coupled device), reverse optoelectronics, and store and transmit the signal charge. It improved the time-consuming and energy consumption of [9,10], respectively. The linear CCD module was designed according to LS series lidar. FPGA was used for signal preprocessing of TCD1209DG output. C8051, FT232, and RS-485 were used to reduce the loss of signal transmission. The signal TRAM publishing unit sent the distortion information of the radar scanning signal to the control host computer for micro-distortion detection of the radar scanning signal. The anti-interference ability of the method in [8] was improved. Through the experiment of micro-distortion correction, compared with the existing methods, this method had faster detection speed, lower detection energy consumption, and stronger anti-interference ability.
2. Hardware Support for the Technology
2.1. Overall Framework of the Technology
In order to realize micro-distortion detection of lidar scanning signals, technical modules, such as linear array CCD module, signal processing module, signal transmission unit, and PC control program, were designed according to LS series laser lidar. The overall framework of technology is shown in Figure 1.
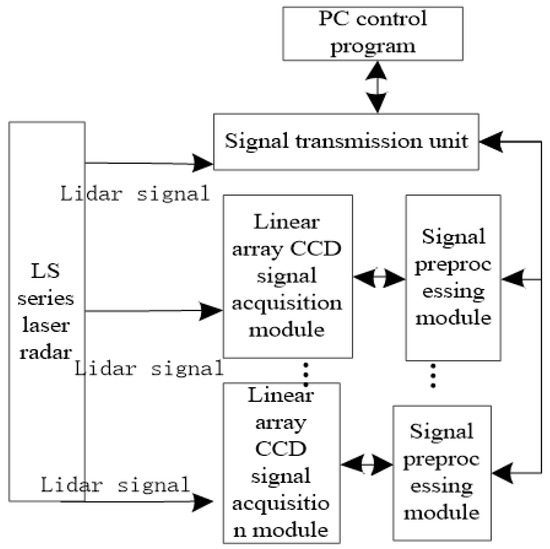
Figure 1.
The overall framework of the proposed method.
According to Figure 1, each linear CCD module in the method received a word line laser emitted by the horizontal line lidar and outputted a corresponding signal through the lidar signal. When the lidar scanning signal changed slightly, its signal output from the line CCD module changed. The signal acquisition module collected the output signal and then digitized the acquired signal to determine micro-distortion information for the scanning signal. The signal transmission unit transmitted distortion information of the lidar scanning signal to the control host to realize micro-distortion detection for the lidar scanning signal. The control host could implement the setting of technical parameters and receive and process signals.
2.2. Development of Linear Array CCD Module
A charge-coupled device (CCD) [11] is a sensor that uses charge to realize signal transmission, enabling photoelectric conversion and signal charge storage and transfer. According to the working content of the linear array CCD module, chip TCD1209DG [12] with high sensitivity and high resolution is used as a chip of the linear array CCD module. The size of each photosensitive unit of tcd1209dg was 14 μm × 14 μm × 14 μm, the total length of the photosensitive array was 28.6 mm, the best working frequency was 1 MHz, and the maximum working frequency could reach 201 MHz. Because of its anti-interference advantages compared with the traditional chip, this paper chose this chip. The design of this hardware was to detect the micro-distortion signal effectively, so as to realize the detection of radar scanning signal. Using photodiode as the used pixel, the size of each pixel was set to 9.33 μm × 9.33 μm. The line CCD is shown in Figure 2.
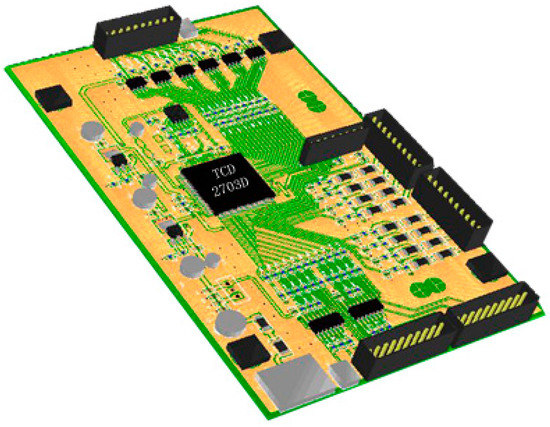
Figure 2.
A general linear array CCD (charge-coupled device).
2.3. Signal Preprocessing Module
In order to realize the output of red, green, and blue light, chip TCD1209DG realized two channels of six frames of output, and its output signal size of each frame was 3984.2 × 16 bits. In the process of using TCD1209DG, the light entering the linear array CCD was made red by providing a red filter lens in front of it. It only processed the red light output and reduced the effect of external stray light on signal processing.
Chip TCD1209DG had five driving signals, including two-phase clock signals φ1A and φ2A, a charge conversion signal SH, a reset signal RS, and a clamp signal CP. There was a strict timing and phase relationship between the signals in TCD1209DG. Drive signal circuit diagram of TCD1209DG is shown in Figure 3a. When TCD1209DG was operating normally, the two-phase clock signal contained a high-level clamp signal and a reset signal, and the clamp signal lagged behind the reset signal. When the scanning signal was distorted, the clamp signal and the reset signal were low.
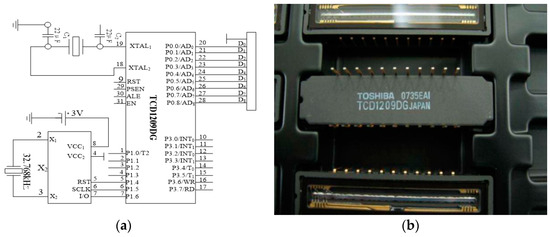
Figure 3.
TCD1209DG driver and its circuit. (a) TCD1209DG drive signal circuit, (b) A real TCD1209DG driver.
TCD1209DG drive signal was generated by the internal logic of FPGA and was implemented by VHDL programming [13]. Drive resulting from TCD1209DG is shown in Figure 3b.
The signal processing module mainly adjusted the signal output by TCD1209DG, digitized the processed signal, and stored the processed signal.
For signal output features of chip TCD1209DG, it was necessary to preprocess the output signal of each frame. The signal threshold processing was outputted for each frame, and the processed signal was transmitted to the signal acquisition module. The high sensitivity of TCD1209DG made the light have a greater impact on the output signal. By processing the threshold, interference of the light could be effectively reduced, and the quality of the output signal with the linear array CCD module was improved.
2.4. Signal Transmission Unit
In order to realize the lossless signal transmission for the lidar scanning signals of the control host and other slaves, a signal transmission unit was designed. The unit used FPGA as the core device of the signal processing module and adopted EP1C6Q144 [14] as the chip FPGA. After processing by FPGA, the micro-distortion information of the lidar scanning signal was stored in the off-chip SRAM.
The signal transmission unit was mainly composed of chip C8051 [15], chip FT232, and chip RS-485 [16]. In technology, the signal transmission unit host could be connected to any slave to realize communication. However, communication between slaves was impossible.
In order to realize the signal transmission unit, the connection between the USB interface with RS-232 and RS-485 interfaces was completed by using chip FT232. RS-232 interface was connected to the RS-485 interface through chip RS-485. Using C8051F (made by Silicon Labs, Austin, Texas, USA) as an MCU, the timing between the chips was controlled to avoid communication interruption caused by bus conflicts. The specific implementation process of the signal transmission unit is shown in Figure 4.
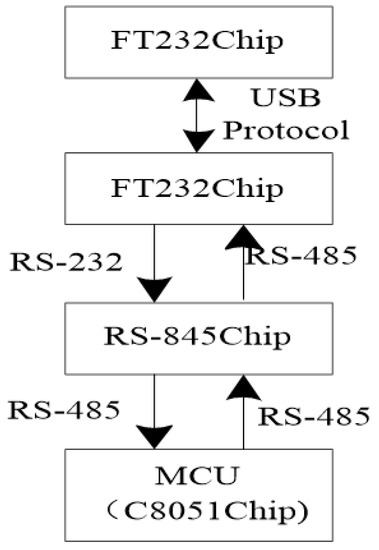
Figure 4.
Composition of the signal transmission unit.
Through the above discussion, based on the requirements of the micro-distortion detection of the lidar scanning signals, the overall framework of the technology was analyzed. Designs of the linear array CCD module, the signal processing module, and the signal transmission unit for implementation determined the detection process of the micro-distortion detection technology for the lidar scanning signal.
3. Feature Matching Algorithm for Micro-Distortion Signal Based on Geometric Statistics
3.1. Frequency Matching of Micro-Distortion Based on Geometric Statistical Algorithm
The premise of realizing the detection of micro-distortion for the lidar scanning signals was the need to describe the lidar scanning signals. By accurately scanning the local properties of a signal, the frequency of the distortion signal was matched. According to the principle of lidar scanning and mapping, combined with the geometric statistical algorithm, a feature frequency band of the distorted signal was matched.
The distortion feature of the scanning point band on the segment was introduced. A coordinate system was constructed by taking the scanning point band as the origin and the normal [17] direction as the abscissa. A tangent along the point was equally divided into two sides. The length of was set to . Each micro-segment was recorded as by projecting the points on into in sequence until the end of . Using statistics for a continuous segment on , the distortion feature of the scanning point band thus obtained is:
In the above Equation (1), represents the boundary farthest from the origin projection, represents the set of all distortion feature points, and represents the number of associated with the scan point band.
Micro-segment associated with the scanning point band was used as a segment with coordinate system information, and its distortion feature could be expressed as:
In the above Equation (2), and , respectively, represent the length and overall unevenness of each micro-segment after division. represents the vertical distance distribution range of the projected scan point band and point [18]. represents the average off-angle of the normal direction for the scanning point band with in each micro-segment . represents the off-angle of the normal direction for the scanning point band with in each micro-segment . The normal direction of the micro-segment was set to satisfy consistent distribution. The associated microsegment was simplified into a distorted feature segment or arc. The range of the central angle was represented by . and were used to determine the position in the coordinate system. The direction of the opening was determined by and .
The segmentation distortion feature could be seen as a special form of the associated segment distortion feature :
The similarity between different micro-segments and was calculated by micro-segment similarity , which is:
In the above Equation (4), RL represents the length ratio of each micro-segment in a lidar scanning signal. represents the overlap ratio of the central angle range between micro-segments. represents the projection distribution ratio. According to the above equation, , and increases as the similarity increases.
In order to ensure the accuracy of distortion detection for the lidar scanning signal, it was necessary to accurately match the scanning point’s frequency bands. For any of the scanning point bands and , their coordinate systems were overlapped. Then, the matching degree of the scanning point band could be expressed as:
In the above Equation (5), and , respectively, describe the average similarity of the corresponding micro-segment and the matching micro-segment. represents overlap ratio of lidar scanning signal distortion feature span . indicates the proportion of matching micro-segments. The average match case was described using and . and were used to improve the matching of scanning point bands. The highest matching degree was set to , and the matching degree could be expressed as:
In the above Equation (6), , represents the weights of the distortion feature matching degree vector. indicates an influencing factor of the matching. , the larger , the higher the matching. The geometrical statistical algorithm was used to match frequency bands of micro-distortion signals, and the geometrical statistical algorithm was combined according to frequency bands.
3.2. Nonlinear Micro-Distortion Signal Detection
During the process of signal scanning, the scanning signal is distorted due to the influence of illumination and scanning target chromatic aberration. Some obvious distortions can be easily detected by linear detection algorithms [3]. However, some distortion signals are nonlinear due to their distortion features, which are often overlooked by monitoring algorithms. Therefore, this paper adopted a nonlinear micro-distortion detection algorithm to detect micro-distortion signals based on the matched distortion signal frequency band. Figure 5 shows the nonlinear detection processing in this paper.
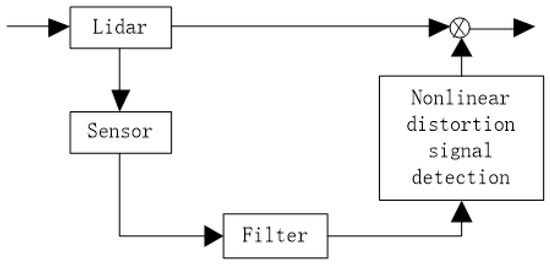
Figure 5.
Nonlinear detection process of the micro-distortion signal.
The state of laser lidar scanning was fully considered. An output source of laser and the scanning signal were used as a basis for distortion detection. The analysis of the band structure for the distorted optical signal was as follows:
where is the normal lidar signal scanning shape, is the scanning result output, is the disturbance output, is the micro-distortion signal, and are distortion dimension constant matrixes.
A lidar would have distortion problems during the scanning process. Therefore, a nonlinear state detection method was needed to detect the signal scanning with the sensor reaching the filter. Let the micro-distortion signal be ; then, its initial output signal could be expressed as:
In the above Equation (8), is the output of dividing the micro-distortion signal set. , where is the lower bound of the micro-distortion signal, is the upper bound of the micro-distortion signal, and is the matrix of the distortion constant for the distortion signal.
Common micro-distortion signal structures, such as the nonlinear micro-distortion state detection mechanism, could be expressed as Equation (9):
where is the control host status detection situation. is a micro-distortion output with a micro-distortion signal. is the detection output. is the residual signal with a micro-distortion signal. L and M are a gain matrix of the micro-distortion detection and the gain matrix of the residual signal, respectively [4].
3.3. Distortion Correction of Lidar Scanning Micro
The detected micro-distortion signal existing in the process of nonlinear micro-distortion detection was fully considered. According to the distortion distribution sequence, statistical signal features were:
Detection signal in the scanning and the random micro-distortion signal of lidar scanning signal were represented by in Equation (8) and in Equation (10), respectively. Where indicates the detection signal received by the control host, and indicates the lidar signal received by the control host. At this time, and indicate that the lidar signal had slight distortion. and indicate that the host did not receive the detection signal and the scanning signal, respectively. At this time, and , indicating that there was no micro-distortion signal in this frequency band.
The nonlinear state detection method was used to detect signal scanning with the sensor reaching the detection filter. According to this situation, a nonlinear micro-distortion state detection flow was designed. The micro-distortion state detection mechanism was set, the micro-distortion signal condition was analyzed, and the signal features were statistically reported to detect the micro-distortion [5].
In order to make an analysis of lidar problem more precise, the following distortion correction rules should be set:
- (1)
- In order to improve the performance of the control host, the sensor design of the entire lidar needs to use the clock as the corrective drive, and the controller uses the event as the corrective drive.
- (2)
- Data is scanned in a single package.
- (3)
- The local scanning state of the micro-distortion signal is controllable.
When the lidar signal showed random micro-distortion, its output was:
where is the output of the micro-distortion detection, and is the matrix of the micro-distortion dimension constant.
According to the micro-distortion structure of the lidar signal, a nonlinear micro-distortion state correction mechanism, such as Equation (12), was constructed:
where is the nonlinear control master state. is the micro-distortion signal input of the lidar. is a micro-distortion signal input without a lidar scanning signal. are the observer gain matrix and controller gain matrix for minor distortion correction, respectively [9].
The combined variable obeyed Bernoulli distribution, and the statistical signal features were:
where in Equation (11) and in Equation (13) that obey Bernoulli distribution represent the distortion that occurs when the sensor transmits to the controller and the controller transmits to the actuator. indicates that the sensor successfully scans the signal set to the controller, and indicates that the sensor is distorted when transmitting the signal set to the controller. indicates that the controller successfully scans the signal set to the actuator, and indicates that the controller is distorted when scanning the signal set to the actuator.
According to the block diagram of the micro-distortion structure containing lidar, the nonlinear state correction method was used to describe the micro-distortion signal structure of the lidar scanning signal. According to stated problems of micro-distortion signal structure, the reasonable correction rule was analyzed, and the output result when the micro-distortion had a random distortion phenomenon was calculated. Signal features under the distortion phenomenon were statistically combined with the variable obeying Bernoulli distribution to correct the small lidar distortion.
When there was no micro-distortion of a lidar signal, the error caused by other interference factors of the control host could be ignored. At this time, the control host output result was 0, and the micro-distortion observation error was also 0. When micro-distortion of the lidar signal occurred, the output of the control host at this time was not 0, and the observation error of the micro-distortion was not 0. The magnitude of the error changed as the output was processed. Using the nonlinear feedback control law, when the micro-distortion control error increased, the micro-distortion observation error needed to be used as the residual. The entire scanning state of the micro-distortion was analyzed by observing the change in the residual. It completed the correction of micro-distortion for the lidar scanning signal.
According to the above description, these correction principles should be followed. If the absolute value of the error was less than the output result threshold, then the lidar was in a normal scanning state. If the absolute value of the error was greater than or equal to the output result threshold, then the scan signal was slightly distorted. According to this principle, the distortion correction mechanism could be designed to complete the fault-tolerant control for micro-distortion laser lidar, and the fault-tolerant phenomenon in the distortion correction process was divided and compensated.
4. Results and Analysis of Simulation Experiments
In order to test the detection time and the detection degree of the proposed geometric statistics-based micro-distortion detection technology for lidar scanning signals, the experiment was compared with methods in [8,9]. The experimental platform was built by the control host of Intel B360 i7-8700. Using Windows 2010 as the operating system, MATLAB was used to simulate the process. The detection interface of distortion signals is shown in Figure 6.
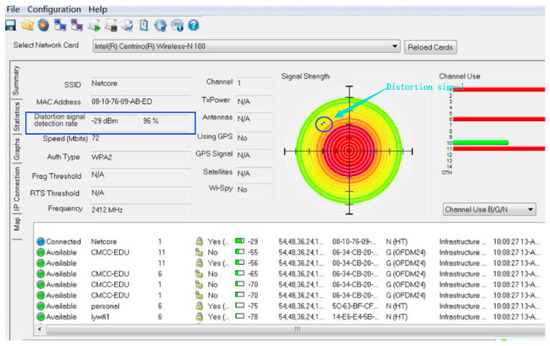
Figure 6.
Detection interface of lidar signal distortion.
The proposed method and methods in [8,9] were used to detect the micro-distortion of 3000 sets for lidar scanning signals. Through experiments, time-consuming results of the three methods were recorded, as shown in Table 1.

Table 1.
Comparison of time-consuming for micro-distortion detection by different methods.
It could be seen from Table 1 that it took less time to detect micro-distortion for the lidar scanning signal by the proposed method. It showed that its detection speed was faster, and the detection efficiency was higher. The proposed method directly matched scanning points in the process of detecting micro-distortion for lidar scanning signals. Calculation steps of the micro-distortion detection for lidar scanning signals were reduced, and its detection speed was improved. Therefore, the detection of micro-distortion for lidar scanning signals took a short time.
In order to ensure the reliability of the research and development technology, a noise signal was added through MATLAB and then connected to software Original Pro 7.0 (Website: www.Originlab.com). Using the proposed method and methods in [8,9], the micro-distortion of the lidar scanning signal was detected in a strong interference environment. The three-dimensional output of the three methods is shown in Figure 7.
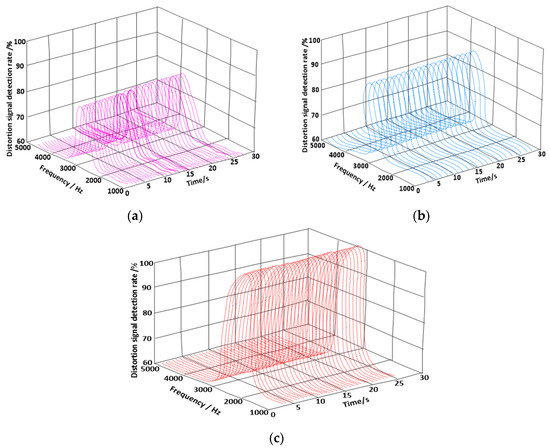
Figure 7.
Comparison of detection rates for distortion signals. (a) Distortion detection rate of the method in [8], (b) Distortion detection rate of the method in [9], (c) Distortion detection rate of the proposed method.
It could be seen from Figure 7 that the proposed method had a high detection rate of the distortion signal in the process of monitoring micro-distortion for the lidar scanning signal. It showed that the external factor had the least influence on the detection rate of the distortion signal, and the proposed detection method had the strongest anti-interference. In the process of detecting micro-distortion of the lidar scanning signal, the proposed method effectively reduced interference of the light and improved the anti-interference of the signal.
An experiment used the proposed method and the classical methods to compare the energy consumption of micro-distortion detection for lidar scanning signals. During the experiment, the results obtained are shown in Table 2.

Table 2.
Comparison of energy consumption (nJ) for distortion signals detected by different methods.
It could be seen from Table 2 that the lidar scanning signal detected by the proposed method had the least energy consumption. It showed that the proposed method was less costly for distortion signal detection. In the process of energy consumption detection, the proposed method had fewer modules, which required less energy consumption. In order to ensure the correct performance of the distortion signal for the R&D technology, MATLAB was used to connect an oscilloscope software. The detected micro-distortion signal was corrected by the proposed method. Its correction result is shown in Figure 8.
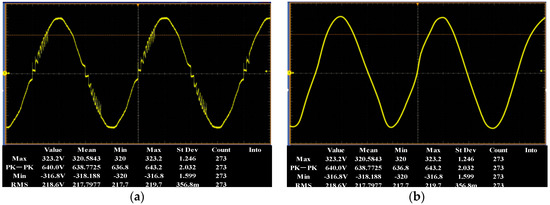
Figure 8.
Comparison of micro-distortion signals before and after correction. (a) Minor distortion signal before correction, (b) Corrected micro-distortion signal.
It could be seen from Figure 8 that there were five micro-distortion signal bands in the lidar scanning signal samples selected before the correction. After the lidar scanning micro-distortion signal was corrected by the proposed method, the signal waveform before the correction was smoother, and there was no distortion phenomenon. It was proved that the proposed method had strong feasibility in the function of micro-distortion correction.
5. Conclusions
Micro-distortion detection of the lidar scanning signal could be used to improve the lidar systems. Existing micro-distortion detection technologies of lidar scanning signal have the problems of long detection time, high energy consumption, and poor performance against interference [19,20]. To deal with these problems, a technique based on geometric statistics for micro-distortion detection of the lidar signal was proposed. This project built an overall framework for the micro-distortion detection using TCD1209DG in linear array CCD module for photoelectric conversion, signal charge storage, and transfer. FPGA chip was used for the signal preprocessing of TCD1209DG output. C8051, FT232, and RS-485 were used for signal transmission. The signal distortion features were analyzed by geometric statistics for micro-distortion detection. Experimental results showed the effectiveness of the proposed method. The following conclusions were drawn:
- (1)
- In the process of micro-distortion monitoring of radar scanning signal, this method had a high detection rate of distortion signal compared with the methods in [8,9].
- (2)
- The energy consumption of the radar scanning signal detected by this method was the least compared with the methods in [8,9].
- (3)
- This method could effectively correct the distorted signal using the frequency difference formula “f = −2v/Lamda” for the change of the Doppler principle compared with the methods in [8,9].
Author Contributions
Conceptualization, S.L. and X.C. (Xiaochun Cheng); methodology, Y.L.; software, X.C. (Xiang Chen); validation, X.C. (Xiang Chen) and Y.L.; formal analysis, S.L.; investigation, X.C. (Xiaochun Cheng); resources, X.C. (Xiang Chen); data curation, X.C. (Xiang Chen); writing—original draft preparation, X.C. (Xiang Chen) and S.L.; writing—review and editing, X.C. (Xiaochun Cheng); visualization, X.C. (Xiang Chen); supervision, S.L.; project administration, S.L.; funding acquisition, S.L.
Funding
This work is supported by the Open Project Program of the State Key Laboratory of Complex Electromagnetic Environment Effects on Electronics and Information System under Grant 2019K0104B. National Natural Science Foundation of China project under Grant 61502254, Program for Yong Talents of Science and Technology in Universities of Inner Mongolia Autonomous Region under Grant NJYT-18-B10.
Acknowledgments
We want to give our sincere gratitude for the effective work of the editorial board of journal “Symmerty”, as well as the guest editors of the special section “Recent Advances in Social Data and Artificial Intelligence 2019”.
Conflicts of Interest
The authors declare no conflict of interest.
References
- Aubry, A.; Maio, A.D.; Pallotta, L.A. Geometric Approach to Covariance Matrix Estimation and its Applications to Radar Problems. IEEE Trans. Signal Process. 2018, 66, 907–922. [Google Scholar] [CrossRef]
- Muqaibel, A.H.; Abdalla, A.T.; Alkhodary, M.T.; Alawsh, S.A. Through-the-wall radar imaging exploiting Pythagorean apertures with sparse reconstruction. Digit. Signal Process. 2017, 61, 86–96. [Google Scholar] [CrossRef]
- Lin, Y.; Wang, C.; Wan, J.; Dou, Z. A Novel Dynamic Spectrum Access Framework Based on Reinforcement Learning for Cognitive Radio Sensor Networks. Sensors 2016, 16, 86–96. [Google Scholar]
- Rakesh, P.R.; Narayanan, G. Investigation on Zero-Sequence Signal Injection for Improved Harmonic Performance in Split-Phase Induction Motor Drives. IEEE Trans. Ind. Electron. 2017, 64, 2732–2741. [Google Scholar] [CrossRef]
- Lin, Y.; Zhu, X.; Zheng, Z.; Dou, Z.; Zhou, R. The individual identification method of wireless device based on dimensionality reduction and machine learning. J. Supercomput. 2017, 75, 3010–3027. [Google Scholar] [CrossRef]
- Liu, S.; Bai, W.; Zeng, N.; Wang, S. A Fast Fractal Based Compression for MRI Images. IEEE Access 2019, 7, 62412–62420. [Google Scholar] [CrossRef]
- Piazzo, L.; Raguso, M.C.; Seu, R.; Mastrogiuseppe, M. Signal enhancement for planetary radar sounders. Electron. Lett. 2019, 55, 153–155. [Google Scholar] [CrossRef]
- Zheng, Y.; Zhang, C.; Li, L. Influences of optical-spectrum errors on excess relative intensity noise in a fiber-optic gyroscope. Opt. Commun. 2018, 410, 504–513. [Google Scholar] [CrossRef]
- Lupi, S.M.; Galinetto, P.; Cislaghi, M.; y Baena, A.R.; Scribante, A.; y Baena, R.R. Geometric distortion of panoramic reconstruction in third molar tilting assessments: A comprehensive evaluation. Dentomaxillofacial Radiol. 2018, 47, 20170467. [Google Scholar] [CrossRef] [PubMed]
- Wu, T.; Lu, S.; Tang, Y. Research on panoramic point cloud data acquisition technology based on ASODVS. J. Comput. Meas. Control 2014, 22, 2284–2287. [Google Scholar]
- Hua, X.; Cheng, Y.; Wang, H.; Qin, Y.; Li, Y. Geometric means and medians with applications to target detection. IET Signal Process. 2017, 11, 711–720. [Google Scholar] [CrossRef]
- Gui, R.; Wang, W.Q.; Cui, C.; So, H.C. Coherent Pulsed-FDA Radar Receiver Design with Time-Variance Consideration: SINR and CRB Analysis. IEEE Trans. Signal Process 2017, 66, 200–214. [Google Scholar] [CrossRef]
- Le, Z.; Wang, X. Super-Resolution Delay-Doppler Estimation for OFDM Passive Radar. IEEE Trans. Signal Process. 2017, 65, 2197–2210. [Google Scholar]
- Zhang, Y.; Pan, S. Broadband Microwave Signal Processing Enabled by Polarization-Based Photonic Microwave Phase Shifters. IEEE J. Quantum Electron. 2018, 54, 1–12. [Google Scholar] [CrossRef]
- Engels, F.; Heidenreich, P.; Zoubir, A.M.; Jondral, F.K.; Wintermantel, M. Advances in Automotive Radar: A framework on computationally efficient high-resolution frequency estimation. IEEE Signal Process. Mag. 2017, 34, 36–46. [Google Scholar] [CrossRef]
- Wanchun, L.; Qiu, T.; Chengfeng, H.; Yingxiang, L. Location algorithms for moving target in non-coherent distributed multiple-input multiple-output radar systems. IET Signal Process. 2017, 11, 503–514. [Google Scholar] [CrossRef]
- Pan, Z.; Liu, S.; Sangaiah, A.K.; Muhammad, K. Visual attention feature (VAF): A novel strategy for visual tracking based on cloud platform in intelligent surveillance systems. J. Parallel Distrib. Comput. 2018, 120, 182–194. [Google Scholar] [CrossRef]
- Cheng, Z.; Liao, B.; He, Z.; Li, Y.; Li, J. Spectrally Compatible Waveform Design for MIMO Radar in the Presence of Multiple Targets. IEEE Trans. Signal Process. 2018, 66, 3543–3555. [Google Scholar] [CrossRef]
- Duan, K.; Wang, Z.; Xie, W.; Chen, H.; Wang, Y. Sparsity-based STAP algorithm with multiple measurement vectors via sparse Bayesian learning strategy for airborne radar. IET Signal Process. 2017, 11, 544–553. [Google Scholar] [CrossRef]
- Zhang, W.; Fu, Y.; Nie, L.; Zhao, G.; Yang, W.; Yang, J. Parameter estimation of micro-motion targets for high-range-resolution radar using high-order difference sequence. IET Signal Process. 2018, 12, 1–11. [Google Scholar] [CrossRef]
© 2019 by the authors. Licensee MDPI, Basel, Switzerland. This article is an open access article distributed under the terms and conditions of the Creative Commons Attribution (CC BY) license (http://creativecommons.org/licenses/by/4.0/).