1. Introduction
Fertilizers used in agriculture, household, and other fields usually are bulk, spherical, fine particles. The process of chemical fertilizer particle formation can be either wet or dry. Depending on the chemical composition of the fertilizer, it may be pelletizing or prilling. One of the most common methods of pelletizing [
1] is wet prilling. During the prilling process, molten fertilizers are converted into liquid drops. As they fall through the prilling tower (shot tower), they are cooled and form pellets. In comparison with a mixture of chemicals, a pelleted product has the following advantages [
2]:
More convenient storage, transportation;
Rare adhesion of fertilizer particles;
Even distribution of chemicals during fertilization; and
Increased distance of fertilization.
Another important parameter is the pellet size. Smaller particles are characterized by faster disintegration in solution and result in higher fluid viscosity. Furthermore, small pellets (2–5 µm) or chemical mixture more easily disperse in the environment and penetrate into the lungs. This can lead to suffocation of animals fed with supplements. In addition, the pellet size influences the effectiveness of fertilization. Geometric properties of chemical particles and their mass distribution have significant influence on spreading and transportation. At higher bulk density, the fall trajectory of a pellet is also higher [
3]. However, the pellet distribution interval must also be optimal, ideally with a mean distribution in the range of 0.8 mm (width). The sphericity and size of the pellets determine the distance the pellets are thrown by a fertilizer spreader. Meanwhile, the shape and size of the pellets are influenced by the compatibility of the chemicals [
4].
Vibratory granulators are common in manufacturing of ammonium nitrate and urea fertilizers [
5]. This technology is characterized by high capacity and high output quality-monodisperse particle-size distribution. During manufacturing, a vibratory granulator breaks down the chemical alloy into drops. The system of rotating or stationary perforated plates, designed for forced spraying of molten fertilizer mixture is used for splitting. When falling through the prilling tower, the particles collide with the opposite air flow and crystallize [
6,
7,
8,
9,
10]. Perforated plates have resonators, the vibration frequency of which determines the particle size [
11]. The resulting pellets are spherical in shape. This shape has the largest surface area per unit volume, which is important given the mass transfer limitations. Furthermore, the larger contact area facilitates the dissolution of fertilizer [
12].
During prilling, residues of the chemical melt settle on the perforated plates. It should be noted that contaminated equipment results in reduced production volumes, increased fine fraction content, and qualitative parameters below the tolerance limits. The contaminated perforated cover dampens the vibrations of the resonators. As a result, the dispersion of the pellet diameter increases. Upon identifying the changes in products, equipment should be cleaned. In most cases, these cleanings are carried out periodically without taking into account the pellet parameters, which itself is not an optimal solution. The system does not have a feedback assessment subsystem, it is based on the operator experience.
The article analyzes the relationship between the pellet measurement results and the equipment contamination parameters. The results can be used in the complex system with feedback. Accurate assessment of the system status reduces the number of low-quality products.
Section 2 (Materials and Methods) analyzes the pellet measurement and the system status monitoring methods. The current methods of measurement are discussed and the choice of the measurement method is justified. The third section presents the advisory model for the operator to make objective decisions related to the pellet production. The system helps the operator to react faster to production changes. This, in turn, allows a reduction in the amount of poor-quality production. The fourth section introduces the improved combined system control model. Advisory systems that allow inexperienced operators to quickly make the right decisions have not been analyzed in pellet production. The advisory system not only reduces the quality of output but also facilitates the cleaning process.
Section 6 (Discussion) provides information on the improved control of the manufacturing line. Meanwhile, conclusions are given in the final section.
2. Materials and Methods
In most cases, especially when working with older equipment, the method used to identify the contamination of vibratory granulators in the chemical industry is based on the experience of operators. This means that the operator evaluates the level of contamination based on his competence. This subjective judgment is limited as it is not expressed in any numerical terms but simply determined by personal experience. In order to make a more accurate decision, the laboratory measurements are made using the sieve method. Interpretation of additional information reduces the risk of incorrect decision making, especially for less experienced operators. However, the frequency of these measurements is too rare, i.e., measurements are made every 2–3 h, and the production amounts to 50–80 tons of fertilizer per hour. This delay of measurements and the current feedback is too high; therefore, the operator is often required to make subjective decisions.
Control of the resonant frequency influences the dispersion of the pellet diameter distribution. Adjusting the frequency with partially soiled equipment can still result in quality output, thus, extending the manufacturing period between washes.
The quality assessment of products, according to the resonant frequency, may be used for control of pellet production parameters [
13]. Efficiency of the prilling process is closely related with control of the vibration frequency of the resonator. Ultrasonic sensors are useful for identification of changes in resonant frequency. After performing a Fourier transform (FT) and filtering out the noise, the frequency suppression due to contaminated equipment is analysed (
Figure 1). Upon detecting these changes at an early stage, the resonant frequency may be adjusted to extend the equipment life [
14]. However, this methodology does not consider other parameters, e.g., temperature and humidity. Therefore, there is a lack of data related to the assessment of raw material and environmental parameters.
In addition, pellet diameter measurement may be used as an alternative solution to assess the changes in production. It is possible to adjust the vibration frequency according to the change in the diameter. However, the usual laboratory measurements with the sieve technique are not frequent enough. Applied indirect pellet measurements are accelerated using computer hardware resource capabilities [
15].
Dust and larger dispersions of the pellet diameter distribution lead to lower qualitative parameters. Image processing is used to analyse the size of the emerging drops adjacent to the perforated plate [
16]. This method assesses the size of the pellets, according to which the operating frequency of the resonator is adjusted. The authors of the publication [
16] claim to have reduced the dispersion of the particle size. At this point, however, the influence of the resonator on the formation of the final product, i.e., pellets, remains unclear. The analysis uses sophisticated and expensive equipment—a high-speed video camera. When measuring inside a high-capacity vibratory granulator, several video cameras are required. Furthermore, a special lens cleaning system is needed.
The quality of the pellets depends on their uniformity or on the elimination of fine fraction and dust from the products. The research papers tend to solve these issues by modelling the real conditions of manufacturing processes. Product viscosity, pellet velocity in the prilling tower and surface tension forces are evaluated. The latter determine the shape and brittleness of the particles [
16]. These are complex processes, the analysis of which requires a detailed description of the solid structures. Research emphasizes the need of three-dimensional image processing techniques using sophisticated data assessment [
17]. The surface roughness of the particle can be estimated by analysing the three-dimensional image of the granules [
18].
Alternative methods of the pellet size and velocity analysis may be based on optical fibre spatial filtering. Scientific publications [
19,
20] report the results of the research, carried out by using Parsum Gmbh equipment. Measurements were made with particles in the range of 50–6000 µm. Real-time measurements can be helpful for development of the particle models. Meanwhile, the latter are used to control the particle size and to define the critical parameters.
Digital image processing [
21] is used for the pellet size measurements. Along with indirect measurements of particles, the moisture content of the products is also measured. Measurements are made directly on the prilling tower. Video cameras and LED lights were installed on the opposite sides of the tower at different height levels. The same sample is analysed in the laboratory for evaluation of the results. The accuracy of the results, presented by the authors, depends on the speed of the manufacturing process. Particle measurement results agree with the laboratory results at a flow rate of 130 mL/min. Increasing the flow rate to 172 mL/min results in a shift of the pellet size distribution curve by ~0.03 mm to the larger side. Furthermore, the system is complex in structure. It consists of many measuring units that are integrated—embedded in production equipment. The research does not include modelling of the manufacturing process control.
Digital image processing techniques for measuring pellet products were described in the patent material long ago. With the rapid growth in computer performance, this area has been gaining popularity. It is essential to evaluate the quality of the image [
22] as it affects the reliability of the metrological measurements. In summary of the literature review, several key features can be distinguished among the methods described:
Continuously operating light [
28,
30] or strobe light [
23,
33] is used;
Sample pellets are illuminated from front [
33,
34] or from behind (backlight) [
26,
31,
35];
Pellet monolayer [
23,
30] or the pellet structure on conveyor or other surfaces is analysed [
36,
37,
38,
39,
40,
41]; and
Three-dimensional images [
42,
43] or complex data from hybrid (combining several measuring methods) systems are analysed [
44].
Indirect measurement shortens the duration of analysis from a few hours to several minutes [
45]. The duration of analysis also depends on the number of pellets in the sample. Measurements made with a computer vision system not only provide the information needed to monitor production parameters but can also be used for detailed analysis of number, shape, and volume of particles. Proper image binarization [
46] is essential to evaluate the pellets with enough accuracy. Additional information on the production quality:
Aspect ratio;
Circularity;
Convexity;
Elongation;
Sphericity;
Surface roughness;
Compactness;
Symmetry;
Length;
Width;
Perimeter; and
Area.
3. System Model
The base model of the system follows the subjective opinion of the operator when assessing the level of equipment contamination. Thus, reliability of this decision is directly linked to the operator’s competence. The data analysed in the paper were collected at the fertilizer plant. Measurements were made under the real production conditions. Special equipment was used for pellet measurements (more info about measurement was submitted in the previous paper [
45]; the measuring system is shown in
Figure 2).
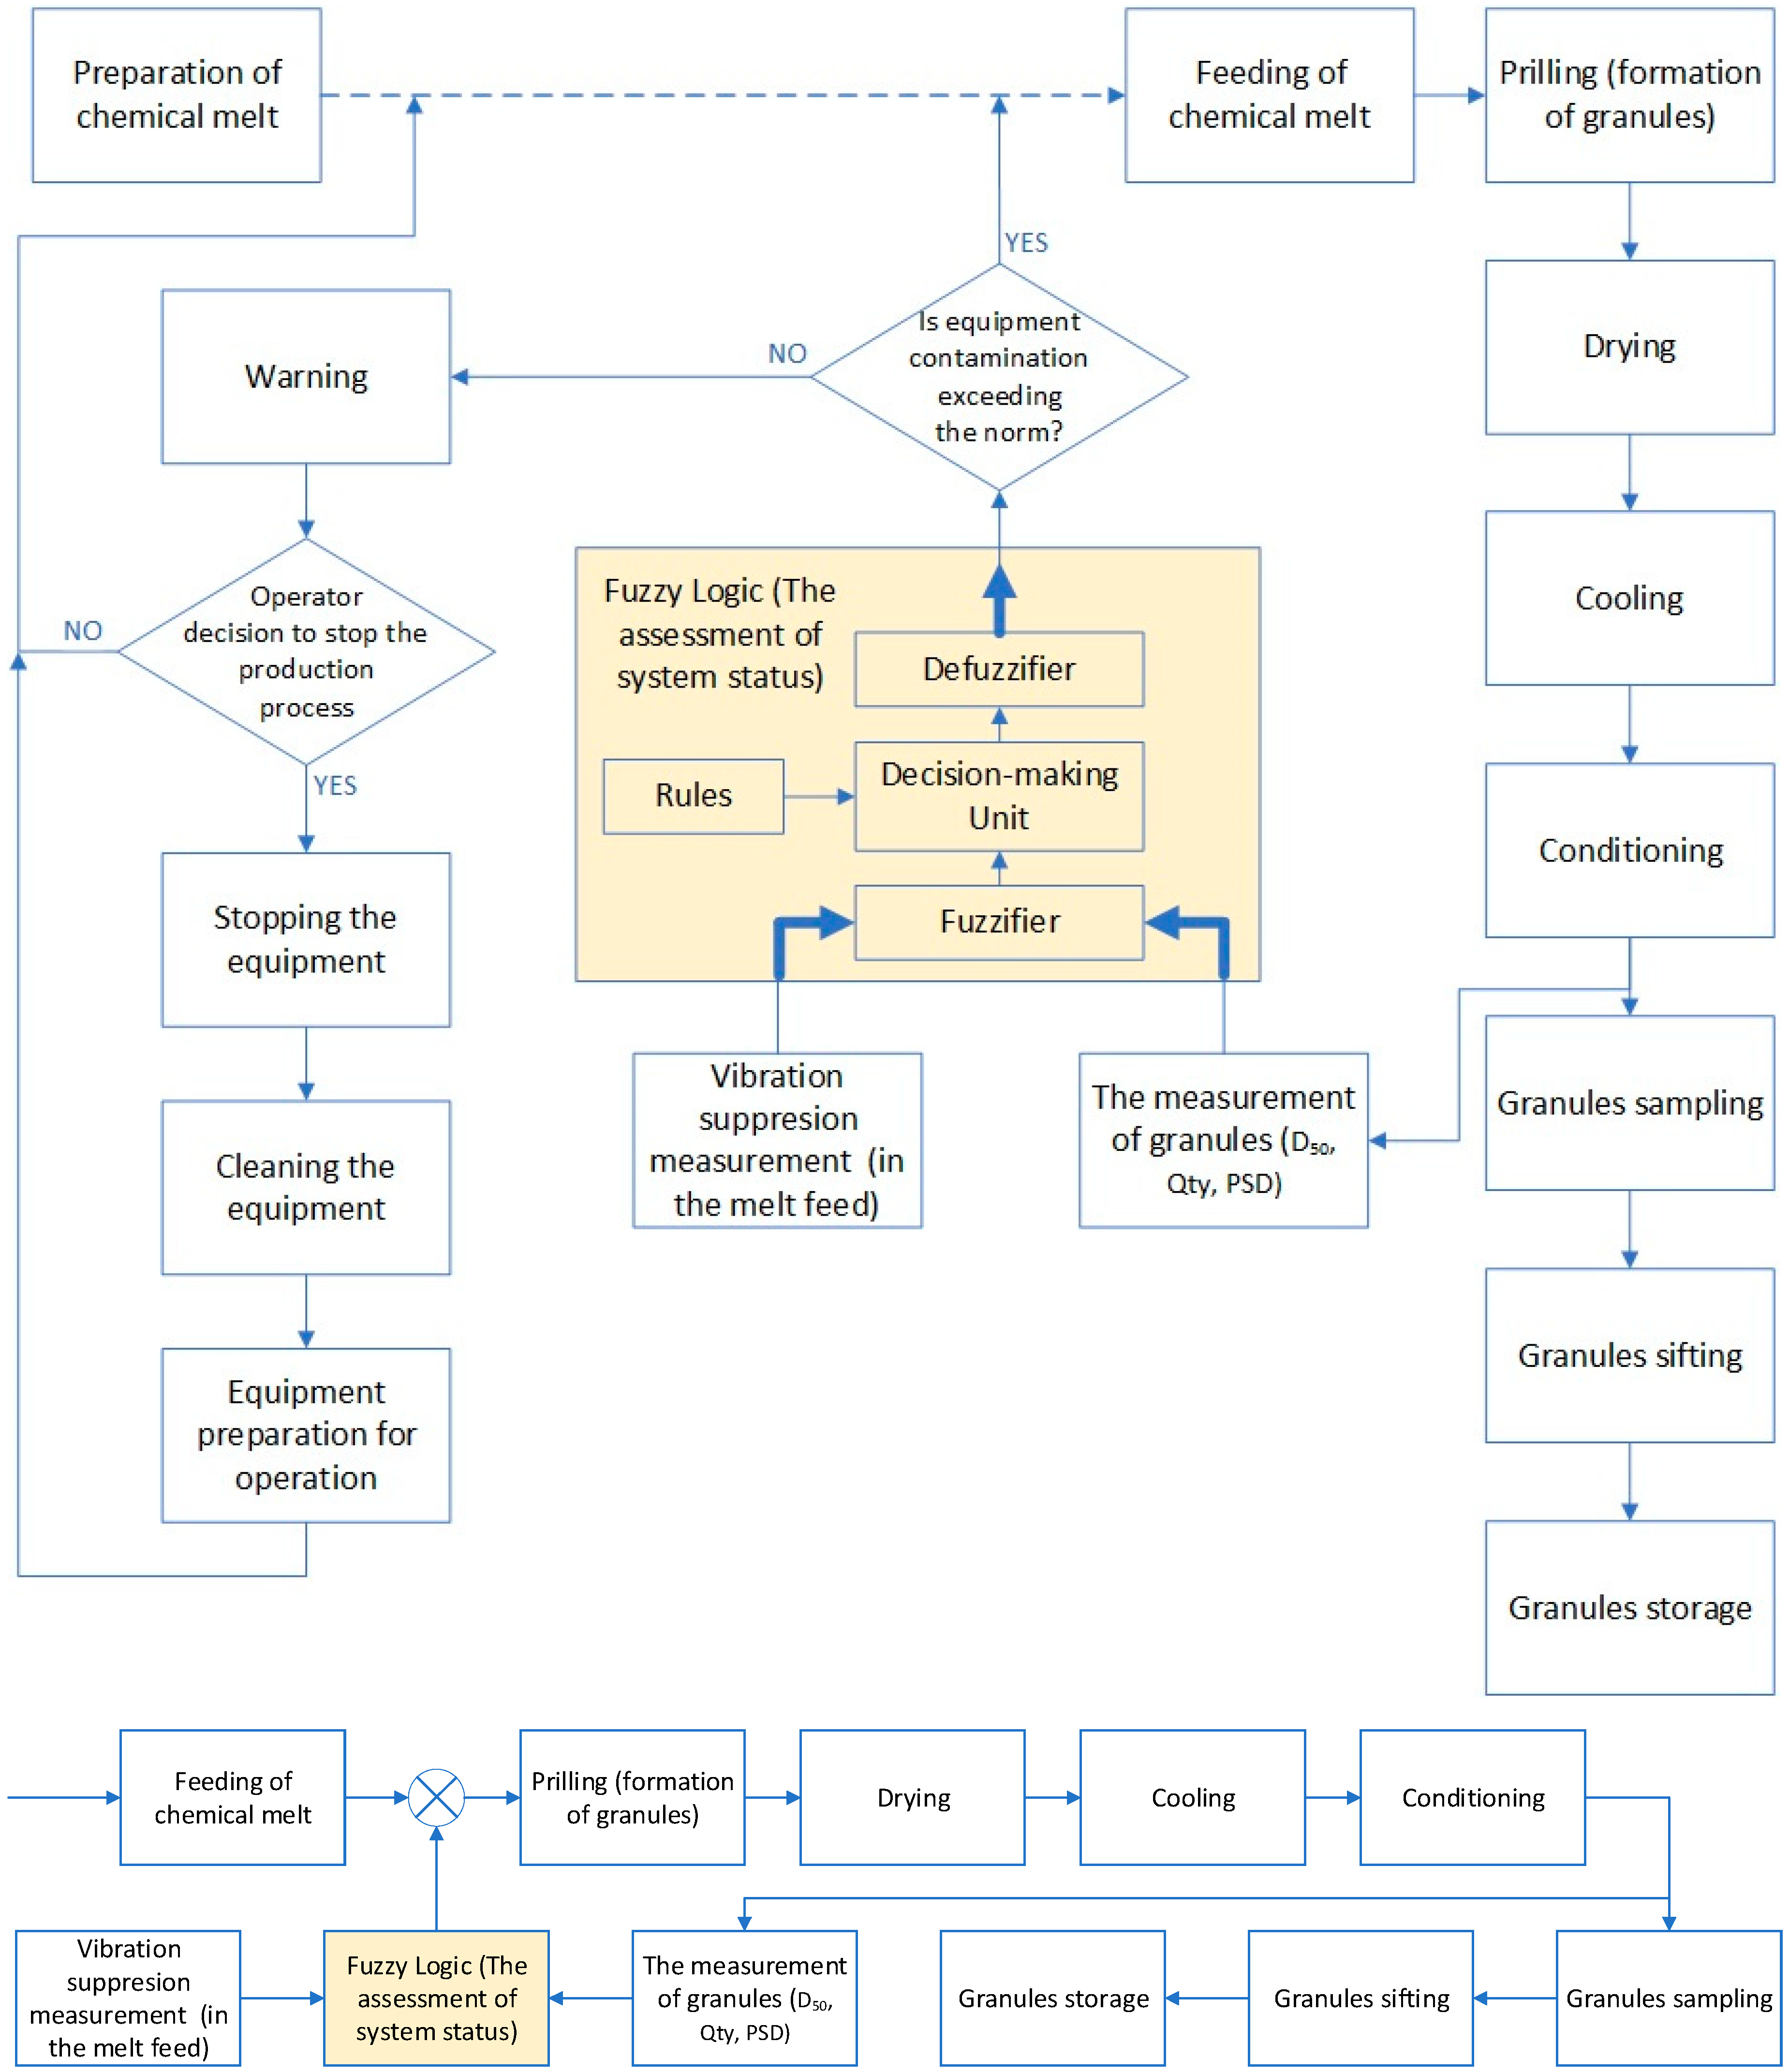
Ammonia gas and nitric acid, resulting in ammonium nitrate solution, are used for the production of ammonium nitrate. Thus, an ammonium nitrate solution of 83% is usually obtained, which is then used for evaporating to an ammonium nitrate content of 95–99.9%. In addition, various accessories are often needed. If, during the manufacturing process, the operator of the equipment observes a trendy change in the granulometric composition, it is assumed that the quantity of melt is too high in the system. This, in turn, shows that the perforated plates used for prilling are contaminated—there is no leakage of melt. The production process is then stopped for cleaning the equipment. The current control algorithm is presented in
Figure 3.
One of the most important parameters in the prilling process is the size of the pellets. The fertilizer manufacturer defines the precise range within which the pellet size distribution is likely. The plant, where the research was carried out, used sieve sets to ensure a pellet size range of 1–4 mm.
The statistical parameters of granules size and vibrations of the melt feeding system was used to create the advisory system. It should be noted that pellet measurement calibration and mathematical models were used in the previous publication [
45]. The model for indirect particle measurements was based on the evaluation of particle roundness. This paper evaluates the correlation between fertilizer granules measurement results and other indirect measurements (chemical feed system vibration). Based on the experience of the operators, a rule base for the fuzzy logic controller was created. Importantly, the final decision on contamination of the production line is made by the operator.
The paper presents an improved advisory system model. The solution involves indirect measurements of particle distribution. Moreover, the indirect digital image processing method, used for the particle analysis, increases the sampling frequency of measurements. Measurements were made by using specially designed software (one of the software screenshots is given in
Figure 4 and a measurement photo is presented in
Figure 5).
The information obtained is analysed along with other input parameters and, then a decision about the system status is made. Ancillary information allows to justify the operator’s actions. In addition, particle temperature and relative humidity are analysed. All measurements were made using non-interventional measurement methods: humidity was measured using NIR moisture sensor (Moistech IR-3000FP (manufacturer—Moistech, Sarasota, Florida, United States; supplier—Elintos MS, Kauno raj., Lithuania); moisture ranges: 0–0.1%, 0–100%), temperature, using PIR sensors (pyrometer integrated in the Moistech IR-3000FP moisture sensor (manufacturer—Moistech, Sarasota, Florida, United States; supplier—Elintos MS, Kauno raj., Lithuania); measuring temperature range: 0–100 °C with an accuracy of 0.1 °C). The block structure of the advanced auxiliary system assessment algorithm is presented in
Figure 6.
4. Evaluation of the Prilling Process
Upon analysing the data for a period of six months, the equipment washing moments were identified. The main reason for stopping the prilling process is equipment contamination without considering other technical failures. When the line is stopped, the equipment is washed. Washings can be divided into two groups: instant and long-term (preventive) ones. Instant equipment washings can be performed several times per shift. They are mainly related to the additives used in the chemicals and performed as required rather than periodically. This process cleans chemical mixing and feeding systems. Long-term washes are performed at longer intervals and last up to 4–8 h. The equipment is completely cleaned.
Figure 7 presents the data of a shorter period with vibration damping (data from one of the sensors).
The graph shows the equipment contamination moments (numbered 1–9). This is reduced vibration frequency. In all these cases, instant washings were performed. Depending on the composition of the used raw materials, the number of washings varied from day to day. As the operator cannot accurately assess the system status and detect contamination at an early stage of the process, manufacturing lasted 1 h and 48 min longer on average. The average time of cleaning was determined of 1 h and 28 min.
During measurements, the pellet size was also analysed by indirect measurement (
Figure 8). The graph shows the change in the number of pellets with a diameter in the range of 1–4 mm (see
Section 3) relative to the total sample. These measurements reveal trends in the dispersion growth. This is a direct loss of profit for the manufacturer due to poor quality products.
Pellet temperature and relative humidity measurements were made at intermediate position of pellet transportation. Measurements revealed that the ambient temperature (in the range of 5–45 °C) and the relative humidity of the air (in the range of 10–90%) have no significant influence on the particle production process (
Figure 9). Furthermore, the moisture content of the pellets must not exceed 0.30% of the relative humidity. The optimum value for the relative humidity of the pellets is 0.21%. However, relative humidity fluctuations within the range of 0.05% are possible at different times of the year—lower relative humidity in winter and higher in autumn. The measurements do not allow the assessment of the equipment contamination and qualitative parameters of particles. The measurement results show no relationship between the pellet size distribution and temperature and relative humidity.
Every manufacturer attempts to avoid quality “pits”. Thus, it is necessary to optimize the production process, i.e., to select the correct parameters for different situations. Early identification of equipment contamination and the extension of manufacturing time increases the production efficiency. The completed measurements of the pellet size and vibrations of the melt feeding system revealed a relationship between the quality of products and the equipment contamination (
Figure 10). By using these measured parameters as feedback, the resonant frequency of the prilling equipment can be controlled, thus, increasing the time period between washings. In addition, it is possible to accurately determine the washing time of equipment based on the objective measurements.
The operator can decide on the equipment contamination by taking into account not only the vibration damping, but also the changes in the pellet size. In this case, the operator’s decision is based on additional information about the product. Following the results of different measurements, it is possible to avoid an incorrect assessment of the system status (ellipse 9 in
Figure 10). However, the decision-making, based on the operator’s competence, is still undefined. For elimination of human error, the relationship between the resonator vibration damping and the particle size distribution can be evaluated by implementing a complex feedback system. While implementing the works, the equipment control model was improved to help to identify the equipment contamination levels at an early stage of manufacturing and to inform the operator, in order to increase the time between equipment washes, i.e., to increase the system efficiency.
5. Combined Advisory System Model
Fertilizer prilling equipment is a sophisticated control system of chemical processes. Installation of auxiliary system must be considered as an advisory option to the operator. In this case, the person who oversees the process, may rely on additional comments about the status of the prilling process. The final decision is made by the operator, but with enough data on the quality of the products. The fertilizer prilling process is presented in
Figure 11.
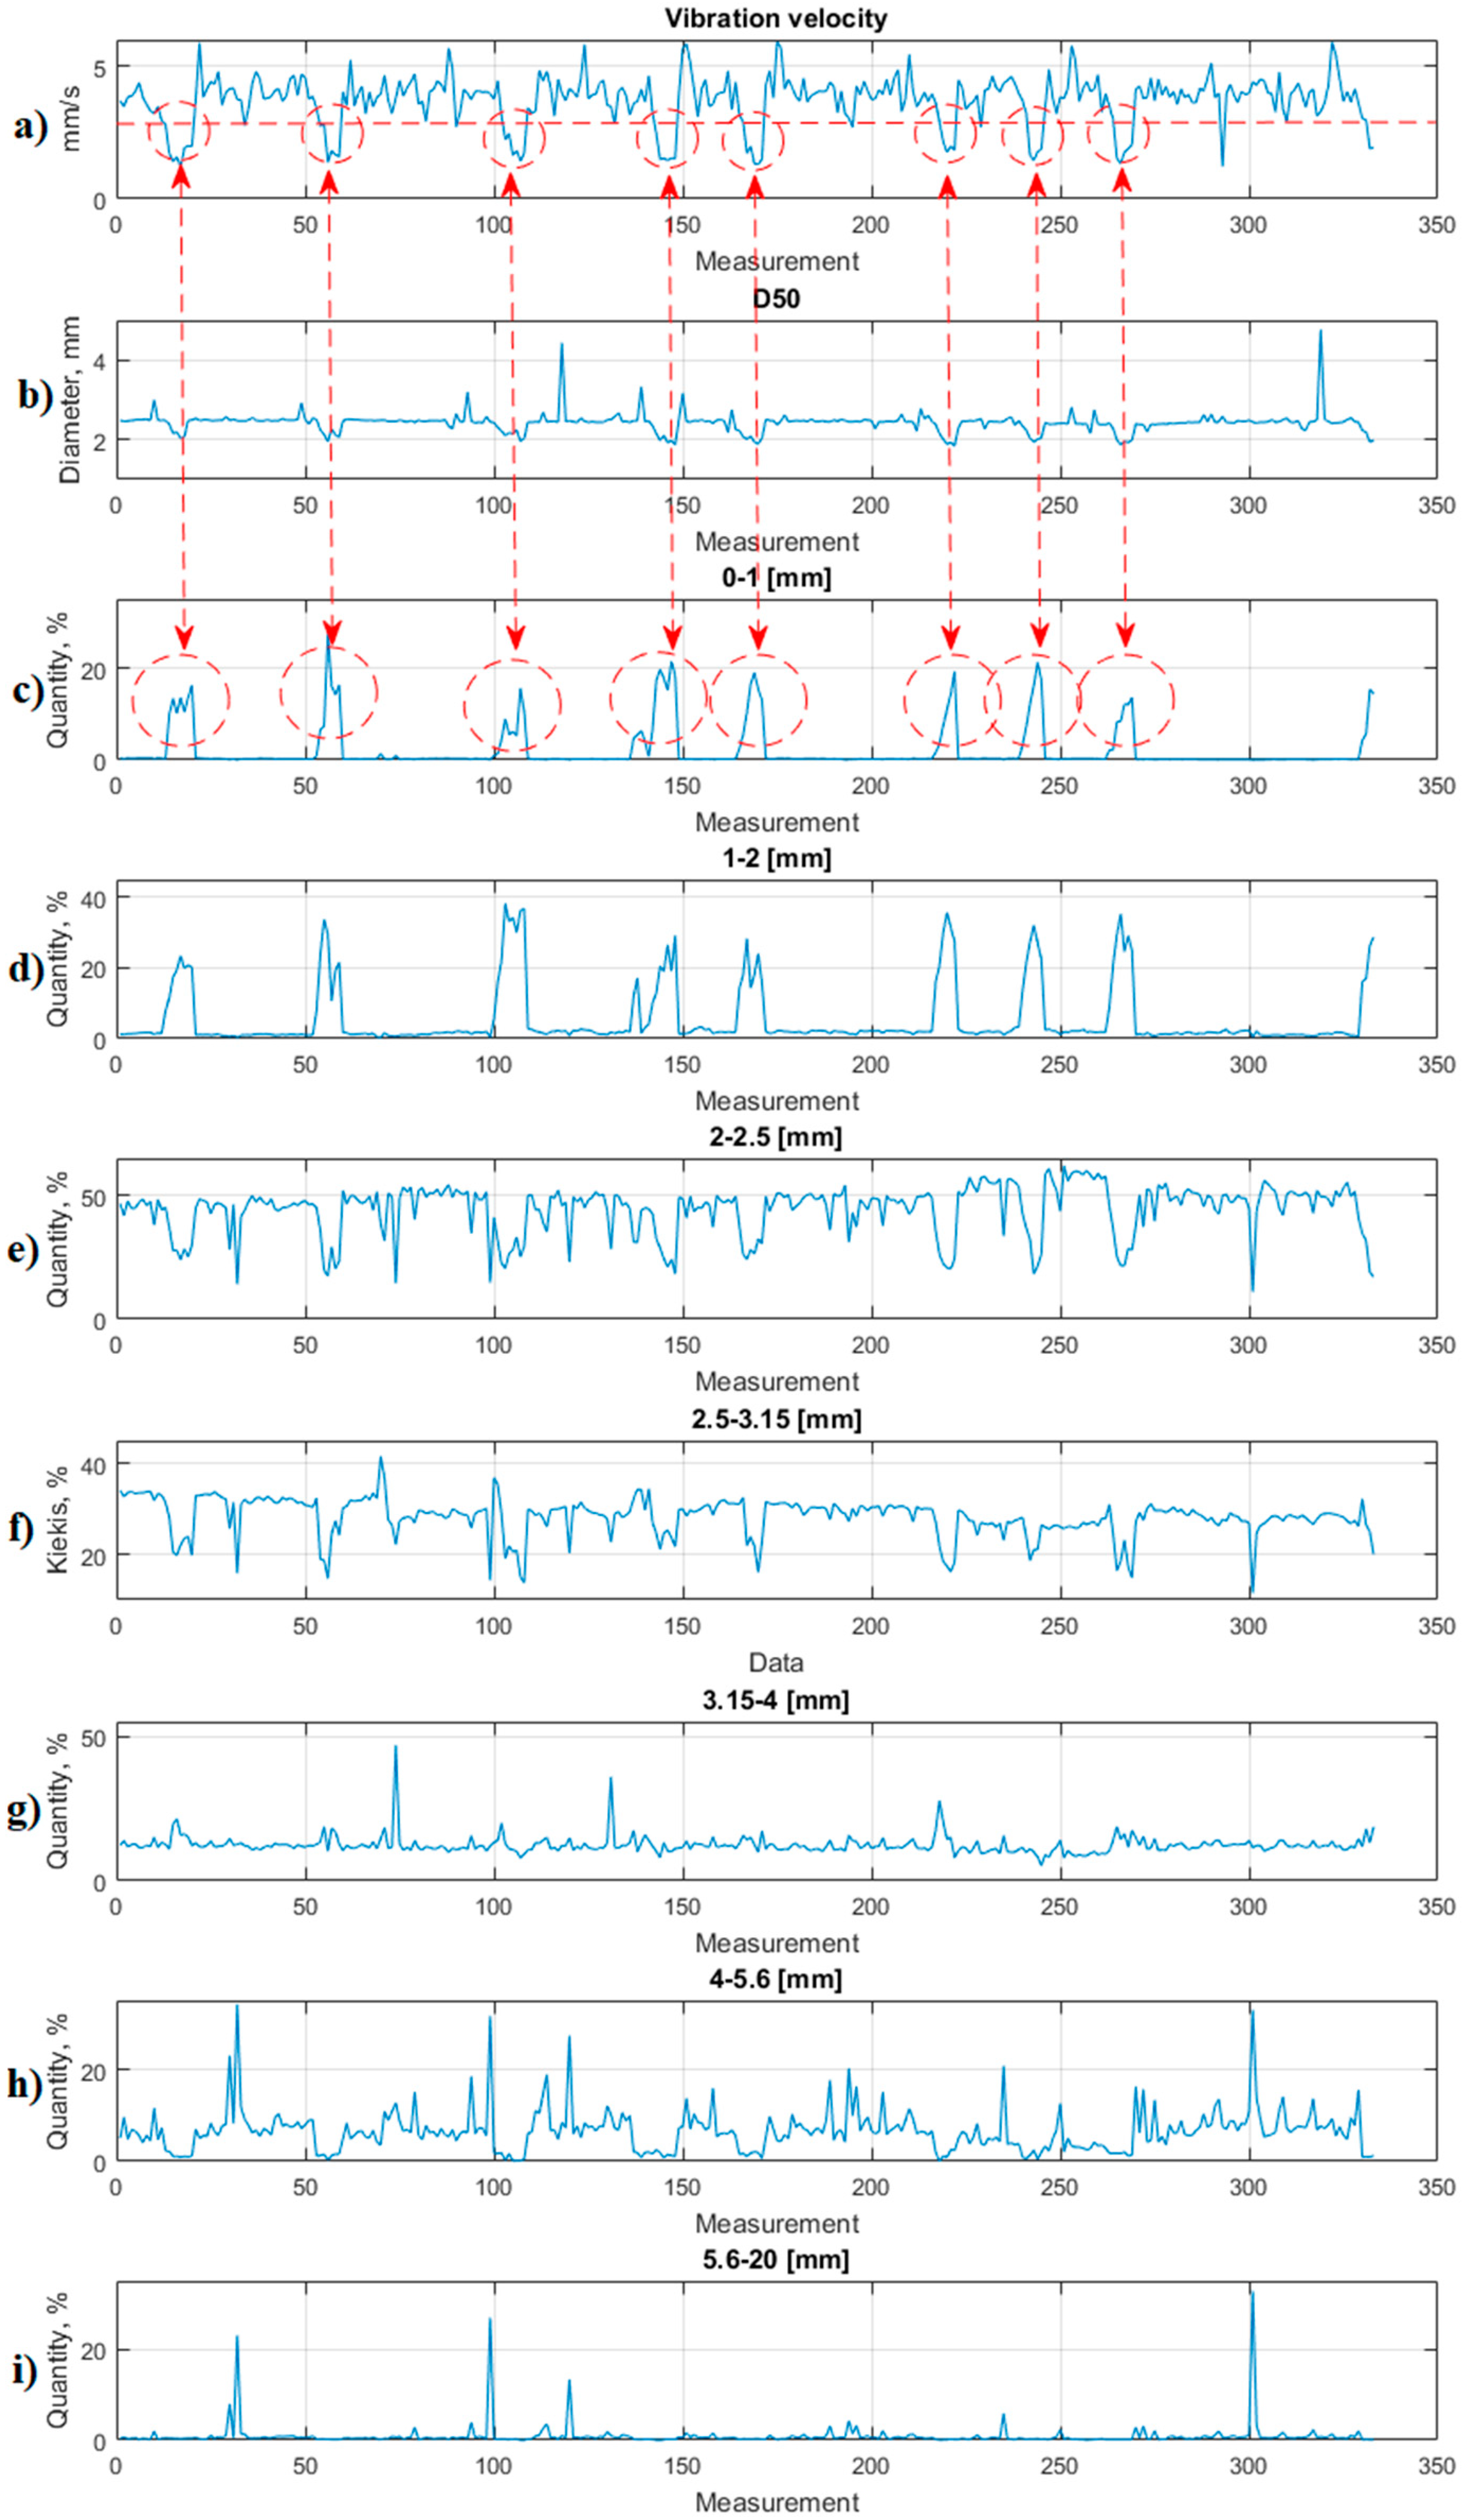
It can be argued that the results of frequent indirect particle measurements contribute to the overall assessment of the system status. Objective evaluation requires an estimate that defines the direction and magnitude of changes in system production. The measurement results for the different particle fractions are shown in
Figure 12 (according to the sieve sets, used by the manufacturer).
Upon improving the system, the operator is warned about the expected degradation of the system. The final decision on equipment contamination is made by the operator. Preparation of chemical melt was not analysed because it is the same process for all manufacturing lines. Seeking to assess the process, particle measurement results were used along with vibration damping data. The results were evaluated by using the fuzzy logic module (
Figure 13 shows the process control block). Fuzzy logic was chosen as one of the most popular decision-making models [
48]. As a result, the estimate for perforated plate contamination was obtained. The fuzzy logic simulation results are given in
Figure 13.
Mean values of the pellet size, distribution of pellets according to the sieves used, damping of the sieve vibrations were presented for the fuzzy logic model:
[1–4] mm particles make > 97% of the total particles
Average particle size D50 ≈ 2.5 mm
During the experiment, the sample analysed consists of 40,000–50,000 particles on average
The logic of the advisory model was described based on the experience and information gathered by the operators involved in the pellet manufacturing process. Fuzzy logic sets are described by S-shaped membership functions:
where
a and
b are allowable acquired values for the particle granulometric composition (
Table 1).
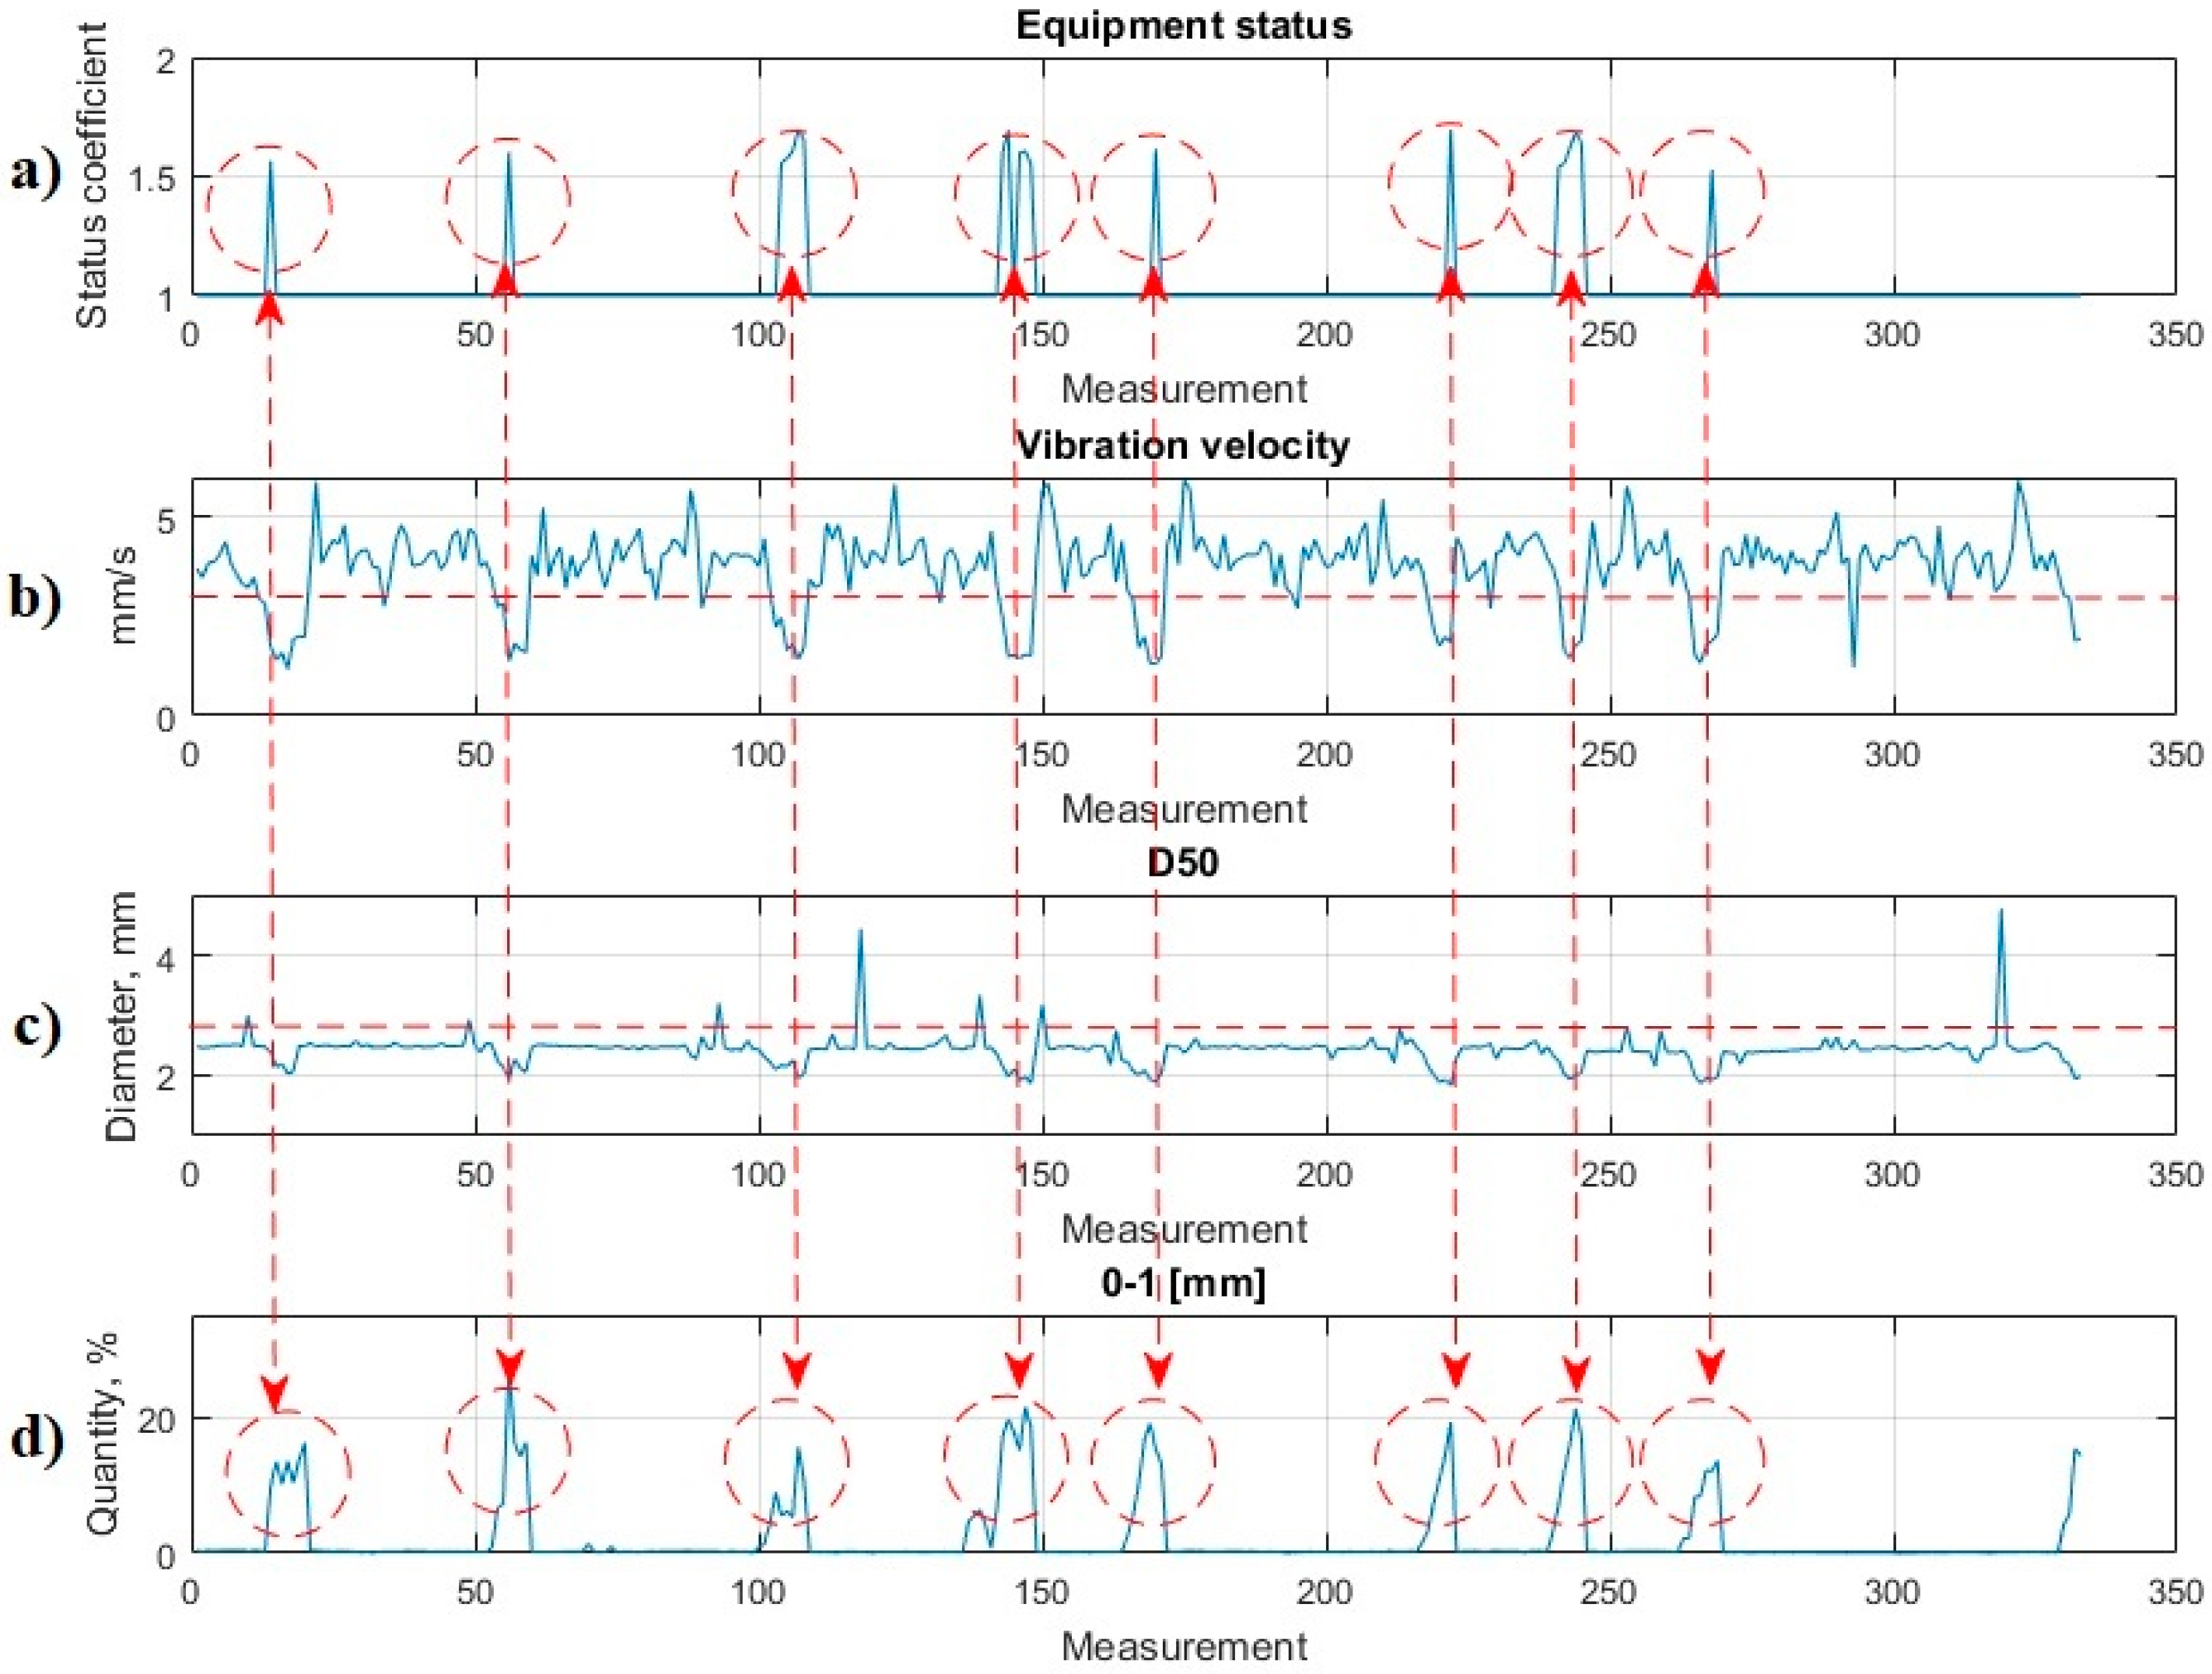
Upon applying the fuzzy logic model with the rules defined, the estimate—the coefficient, describing the system operation—is obtained. Its value remains ~1 when the equipment is operating in a stable manner. The coefficient value increases as the amount of chemical melt on the perforated plates increases. The graph of the system status estimate along with the measurement results are presented in
Figure 14.
The obtained equipment contamination estimate describes the operation of the system. The graph in
Figure 7 clearly shows the stops for washing the equipment (marked in yellow), which correspond to the washing times given in the fertilizer manufacturer’s logs. Based on the collected information (some measurement results are given in the article), the manufacturer completed 56 stops per month to wash its equipment. On average, the equipment was stopped for cleaning after 1 h and 48 min. During this period, most of the products did not meet the quality requirements and were directed to the warehouse of second-class products. The manufacturer spent 105 h a month for making products with lower-quality parameters. With production volumes of up to 80 tonnes/h, the manufacturer could have lost about 8400 tonnes/year of high-quality production. The customized system status assessment model with fuzzy logic reduces the reaction time and equipment can be stopped for cleaning as early as after 10–15 min, after several indirect granulometric measurements. On average, losses are reduced to 745–1120 tonnes per month. By increasing the amount of measurement data, the model can be refined, thus, further reducing the losses.

 ,
, 


