Article

Investigation on Surface Properties of Mn-Doped CdSe Quantum Dots Studied by X-ray Photoelectron Spectroscopy

by
Nor Aliya Hamizi
1,*,
Mohd Rafie Johan
1,
Yasmin Abdul Wahab
1,
Zaira Zaman Chowdhury
1,
Omid Akbarzadeh
1,
Suresh Sagadevan
1,
Irfan Anjum Badruddin
2,
Tatagar Mohammad Yunus Khan
2 and
Sarfaraz Kamangar
2
1
Nanotechnology & Catalysis Research Centre, Deputy Vice Chancellor (Research & Innovation) Office, University of Malaya, Kuala Lumpur 50603, Malaysia
2
Department of Mechanical Engineering, College of Engineering, King Khalid University, P.O. Box 394, Abha 61421, Saudi Arabia
*
Author to whom correspondence should be addressed.
Symmetry 2019, 11(10), 1250; https://doi.org/10.3390/sym11101250
Submission received: 21 August 2019 / Revised: 15 September 2019 / Accepted: 23 September 2019 / Published: 7 October 2019

Abstract

:
In this work, we report on the effects of incorporating manganese (Mn) dopant into different sizes of cadmium selenide (CdSe) quantum dots (QDs), which improves the electronic and optical properties of the QDs for multiple applications such as light-emitting diodes, lasers, and biological labels. Furthermore, the greener inverse Micelle method was implemented using organic ligand, which is oleic acid. This binding of the surface enhanced the QDs’ surface trap passivation of Mn-doped CdSe, which then increased the quantity of the output. In addition, the inverse Micelle technique was used successfully to dope Mn into CdSe QDs without the risk of Mn dopants being self-purified as experienced by wurtzite CdSe QDs. Also, we report the X-ray photoelectron spectroscopy (XPS) results and analysis of zinc blended manganese-doped cadmium selenide quantum dots (Mn-doped CdSe QDs), which were synthesized with physical sizes that varied from 3 to 14 nm using the inverse Micelle method. The XPS scans traced the existence of the Se 3d and Cd 3d band of CdSe crystals with a 54.1 and 404.5 eV binding energy. The traced 640.7 eV XPS peak is proof that Mn was integrated into the lattice of CdSe QDs. The binding energy of the QDs was related to the increase in the size of the QDs.

1. Introduction

In semiconductor nanocrystal systems such as CdSe QDs, the transition behavior of the charge carrier on a crystal surface has been found to be crucial in tailoring the electronic and optical properties of CdSe QDs. However, pure QDs such as CdSe, experience surface defects that act as a charge carrier trap, which results in an increase in the probability of non-radiative recombination that decreases the quantity of the fluorescence output [1]. Moreover, like many other QDs, CdSe QDs have a large surface area, resulting in larger surface energy. Therefore, it is volatile or metastable thermodynamically [2]. Researchers have made considerable effort to address this issue by incorporating dopants into the surface of CdSe QDs [3]. Doping the surface of QDs using a lower transition metal (i.e., Mn, Mg, and Zn) is one of the easiest ways to change the wavelength of light emission [4,5]. However, doping Mn2+ into CdSe QDs is limited due to the self-purification of QDs with a wurtzite structure [6]. Mn-doped CdSe QDs (zinc blend) have been very significant in semiconductor studies because the incorporation of Mn into CdSe QDs promises a high-density diluted semiconductor for spintronic application, and provides excellent traps for electrical excitation, which is important for electronic and optoelectronic devices [7]. Tuning the size of the QDs [8] to target a particular application requirement can obtain the bandgap tunability. Integrating size variability and introducing transition metal dopant into the CdSe QDs system has attracted a good deal of attention, especially with regard to the analysis of results and how it can be manipulated in the particular application. Surface-sensitive quantitative spectroscopic technique such as XPS have been found to be an essential part of this analysis as it provides information on the elemental composition of the parts per thousand range, the empirical formula, and the chemical and electronic state of the elements in a material [9,10]. Therefore, in this paper, we studied the X-ray photoelectron spectroscopy (XPS) analysis of zinc blended manganese-doped cadmium selenide quantum dots (Mn-doped CdSe QDs) synthesized using the inverse Micelle method.

2. Experimental Procedure

Mn-doped CdSe QDs were synthesized using Mn-Cd and Se precursors. Mn acetate (0.5 g) and 0.5 g of CdO, 25 mL of paraffin oil and 15 mL of oleic acid were placed in a three-neck round bottom flask. The mixture was placed into a glove box under vacuum conditions. The solution was heated to 160 °C and stirred until the CdO was totally dissolved, obtaining a light yellowish homogeneous solution. Then, 0.079 g of Se in 50 mL of paraffin oil was heated to 220 °C in a glove box under vacuum conditions with fast stirring in another three-neck round bottom flask. The solution turned light orange and then wine red. During the fast stirring, approximately 5 mL of Mn-Cd solution was quickly injected into the Se solution. Immediately after the injection, the temperature dropped to 210 °C and then rose to 220 °C. For the growth of CdSe QDs at different times, i.e., 0, 0.2, 0.5, 1, 5, 16, 46 and 90 min, the temperature was maintained at 220 °C. Finally, the precipitate was isolated from the solvents by centrifugation, and the unreacted reagent was washed several times with methanol and then dried in the 50 °C vacuum oven.

2.1. Physical Observations

Figure 1 shows the vials of Mn-doped CdSe QD solution. The color variations during the reaction time were affected by the change in the size of the Mn-doped CdSe QDs. The observed colors are due to the strong photon absorption by the Mn-doped CdSe QDs at a particular frequency. The sample with an instant reaction time (0 min) has a light orange color, as shown in Figure 1a, while the solution with a reaction times of 0.2 min has a more intense orange color, as shown in Figure 1b. At a reaction time of 0.5 and 1 min (Figure 1c,d), the sample appears red. As the reaction times increased (16–90 min), the color turned to dark brown, as shown in Figure 1f,g, and the solution became light brown as the dark brown precipitates settled on the bottom of the containers. Due to the quantum confinement effect, the color differences are ascribed to the variation in the size of the QDs. Larger QDs emit longer wavelengths and smaller QDs emit shorter wavelengths, resulting in a different color emission [11].

2.2. Characterization Techniques

Determination of the particle size of Mn-doped CdSe QDs was conducted using a LIBRA 120 PLUS (Carl Zeiss, Oberkochen, Germany) instrument with an energy filtered transmission electron microscope (EFTEM). Structural tests of Mn-doped CdSe QD samples were conducted using an Empyrean X-ray diffractometer (XRD) (Malvern Panalytical Ltd., Malvern, United Kingdom) fitted with graphite monochromatized Cu Kα radiation (λ = 1.54060 Ǻ) irradiated with a scanning speed of 0.02°s−1 and usable range of 2°–80°. The elemental compositions and chemical bonding states of solid Mn-doped CdSe QDs samples were observed using Axis Ultra DLD/Kratos/2009 (Kratos Analytical, Manchester, United Kingdom) X-ray Photoelectron Spectrometer (XPS) with 0.1 to 1 atomic % detection limit and 0.5 nm depth profiles (under an argon gas environment).

3. Results and Discussions

Figure 2 shows typical TEM images for Mn-doped CdSe QDs. The TEM images show that for all reaction times, Mn-doped CdSe QDs have a quasi-sphere shape. Due to the high density of particles, dark areas formed in the image. The mean size and distributions of the QDs are evaluated by one hundred particles as plotted in the histogram (insert) in the respective figure. The average physical size of the Mn-doped CdSe QDs ranged from 3 to 14 nm for 0 to 90 min reaction time, respectively. This finding demonstrates that there is a slight increase in the physical size of QDs in Mn-doped CdSe QDs compared to pure CdSe QDs [10]. The significantly larger size of Mn-doped CdSe QDs compared to pure CdSe QDs may be as a result of Mn which contributes to shelling the core of the CdSe QDs [3].
The relationship between QD growth and reaction time is shown in Figure 3. The growth of QDs at the early reaction time (0 to 0.5 min) is very important. The fastest growth was during the transition time from 0.2 to 0.5 min, as the high-energy surface was largely used to initiate the initial stage nucleation of Mn-doped CdSe QDs (0–0.2 min). As the reaction time increases, the growth becomes less prominent, particularly from 0.5 to 90 min. This is due to the decrease in the ionic concentration of the chemical precursors in the solution as the time gets longer [4,12]. Furthermore, a narrow particle-size distribution was noted in each sample. Despite the narrow size distribution, there appears to be a slight increase in the overall size distribution over the reaction time. This produces larger QDs, owing to the agglomeration of particles. At the same time, the development of intrinsic QDs continues owing to the chemical precursor residue. This will generate a wide QDs size distribution. The tendency to agglomerate can be compared to the core or bulk of QDs throughout the heating process due to the excessively high surface energy on the surface of the QDs, which is favorable for the build-up of the surface or the shell of QDs. This means that QDs have a tendency to grow as long as there is heating. Despite this, as the reaction time increases, the concentration of chemical precursors such as Cd, Se, and Mn decreases. This retards the development of the QDs surface. Therefore, instead of producing QDs, excessive surface energy enhances the propensity of QDs to agglomerate [4].
As shown in Figure 4, the XRD diffraction pattern of Mn-doped CdSe QDs determined the crystal structure. Three well-defined peaks were noted corresponding to (111), (220) and (311) planes, which is in good agreement with earlier reports [3]. This XRD pattern also demonstrate that as-synthesized Mn-doped CdSe QDs created the zinc blende structure owing to the low temperature of synthesis (220 °C). Due to high synthesis temperatures that go up to 300 °C [13], other chemical synthesis processes, such as the TOP-based route, produce wurtzite structure.
The surface composition of Mn-doped CdSe QDs was analyzed using X-ray photoelectron spectroscopy (XPS) as shown in Figure 5. The XPS scans traced the presence of the CdSe crystal Se 3d and Cd 3d band with a binding energy of 54.1 and 404.5 eV, respectively [14]. The Mn 2p band from Mn element was found to have a binding energy of roughly 640.7 eV [15], thus confirming the existence of Mn interstitial sites on the surface of CdSe QD’s core, acting like a doping element. This background correction to tailor the shift of the peak due to the retarding field at the surface of the specimen is called static charging. The static charging phenomena reduce the kinetic energy of the excited electron [15].
The intensity of the C 1s and O 1s peaks were observed to be significant in each scan, with the peaks of both traced elements showing notable intensity in each scan compared to the bands of the other traced elements, including Cd 3d, Se 3d and Mn 2p, which may indicate the influence of oleic acid capping on the surface of the Mn-doped CdSe QDs, which contributed to the formation of Cd-oleate (C36H70CdO4) and Mn-oleate (C36H66MnO4) on the surface of QDs, specifically on {001} planes. The presence of Cd-oleate and Mn-oleate reduced the dangling orbitals on the surface of QDs, which is the essential point of doping Mn into the CdSe QDs. These dangling orbitals are the orbitals that point away from the surface of the QDs and they result from incomplete bonding because of the lower coordination number on the surface, which is contrary to the interior structure of the QDs. In the case of CdSe QDs, both Cd and Se dangling orbitals each act as an electron trap and hole trap, thus, they are able to trap charge carriers on the surface of CdSe QDs, which leads to decreases in the quantum yield [16,17,18]. Hence, it is assumed that Mn-doped CdSe QDs will have higher fluorescence quantum yield than pure CdSe QDs.
Furthermore, the significant C1s peak may also be associated with the existence of organic residue from the solvent used, which is paraffin that has a general chemical formula of CxH(2x+2). The adsorption of adventitious carbon during the drying and handling process may add a point to the observed C1s peak [16]. Figure 2 provides information about the surface elements, and it also supplies crucial information about the kinetics and interactions between electrons at certain orbitals that contain an unpaired electron. In the initial or original state, the unpaired electron is located at the 3d orbital for Cd and Se, and the 2p orbital for Mn for CdSe Mn-doped QDs. The spin-orbital splitting may occur in the final state when the unpaired electron from ionization during the photoemission process couple with the unpaired electron from the initial or original state at specific spin-orbitals [16].
Figure 6 shows the Cd 3d individual peaks of Mn-doped CdSe QDs for different reaction times. The maximum peak intensity (original spectra) shifts towards higher binding energy as the reaction time increases. This suggests that the chemical shift is a function of the size of the Mn-doped CdSe QDs [19]. Figure 6 also shows Cd 3d Lorentzian-Gaussian fit peaks. The Cd 3d peak was deconvoluted using a Lorentzian-Gaussian function. The Lorentzian-Gaussian fit shows the existence of Cd 3d (Lorentz fit 1) and Cd 3d5/2 (Lorentz fit 2) bands which suggest that Cd is bound directly to Se at this two spin-orbital to form the CdSe QDs core. The Cd 3d band with a binding energy of 404.8 eV [11] appears consistently in the 0–90 min XPS scan. The Cd 3d5/2 band peak fitted to have a binding energy ranging from 405.3 to 406.1 eV, which is quite near to the value that was reported as 405.8 eV (±2) [19]. The position of Lorentz fit 1 shows that the Cd 3d band appeared to have a consistent binding energy of 404.8 eV for each scan, whereas Cd 3d5/2 (Lorentz fit 2) appeared to have a slight chemical shift ranging between 405.3 to 406.1 eV. In addition, the Cd 3d5/2 band was observed to appear in the Lorentz fit for the 0.5, 1, 5, 16, 46, and 90 min sample scans and not in the 0 min and 1 min scans. This suggested that 0.5, 1, 5, 16, 46, and 90 min Mn-doped CdSe QDs have an unpaired electron at the Cd 3d band with a total electronic angular momentum (j) of 5/2 for the multiple spin-orbital splitting to occur. The values of j are described in Equation (1).
j = l + s
where,
  • l = total orbital angular/angular quantum number (>1 for p, d and f orbitals)
  • s = spin momenta/spin quantum number (±½)
Because l is larger than zero for d orbital, the orbital line has the tendency to split into a doublet. For 3d orbital, the doublet will be 3d3/2 ( s = −½) which indicates that the orbital is spinning down and 3d5/2 ( s = + ½) indicates that the orbital is spinning up. Therefore, the spinning up orbital is dominant in the CdSe Mn-doped QDs orbital splitting system [11]. In contrast, there was no spin-orbital interaction in the 0 and 0.2 min samples, therefore the energy contained in the Cd 3d spin-orbital are equal before and after the photoemission process. This is likely due to the increase in quantum yield on the surface of the atom as the size of the QDs decreases down to 5 nm.
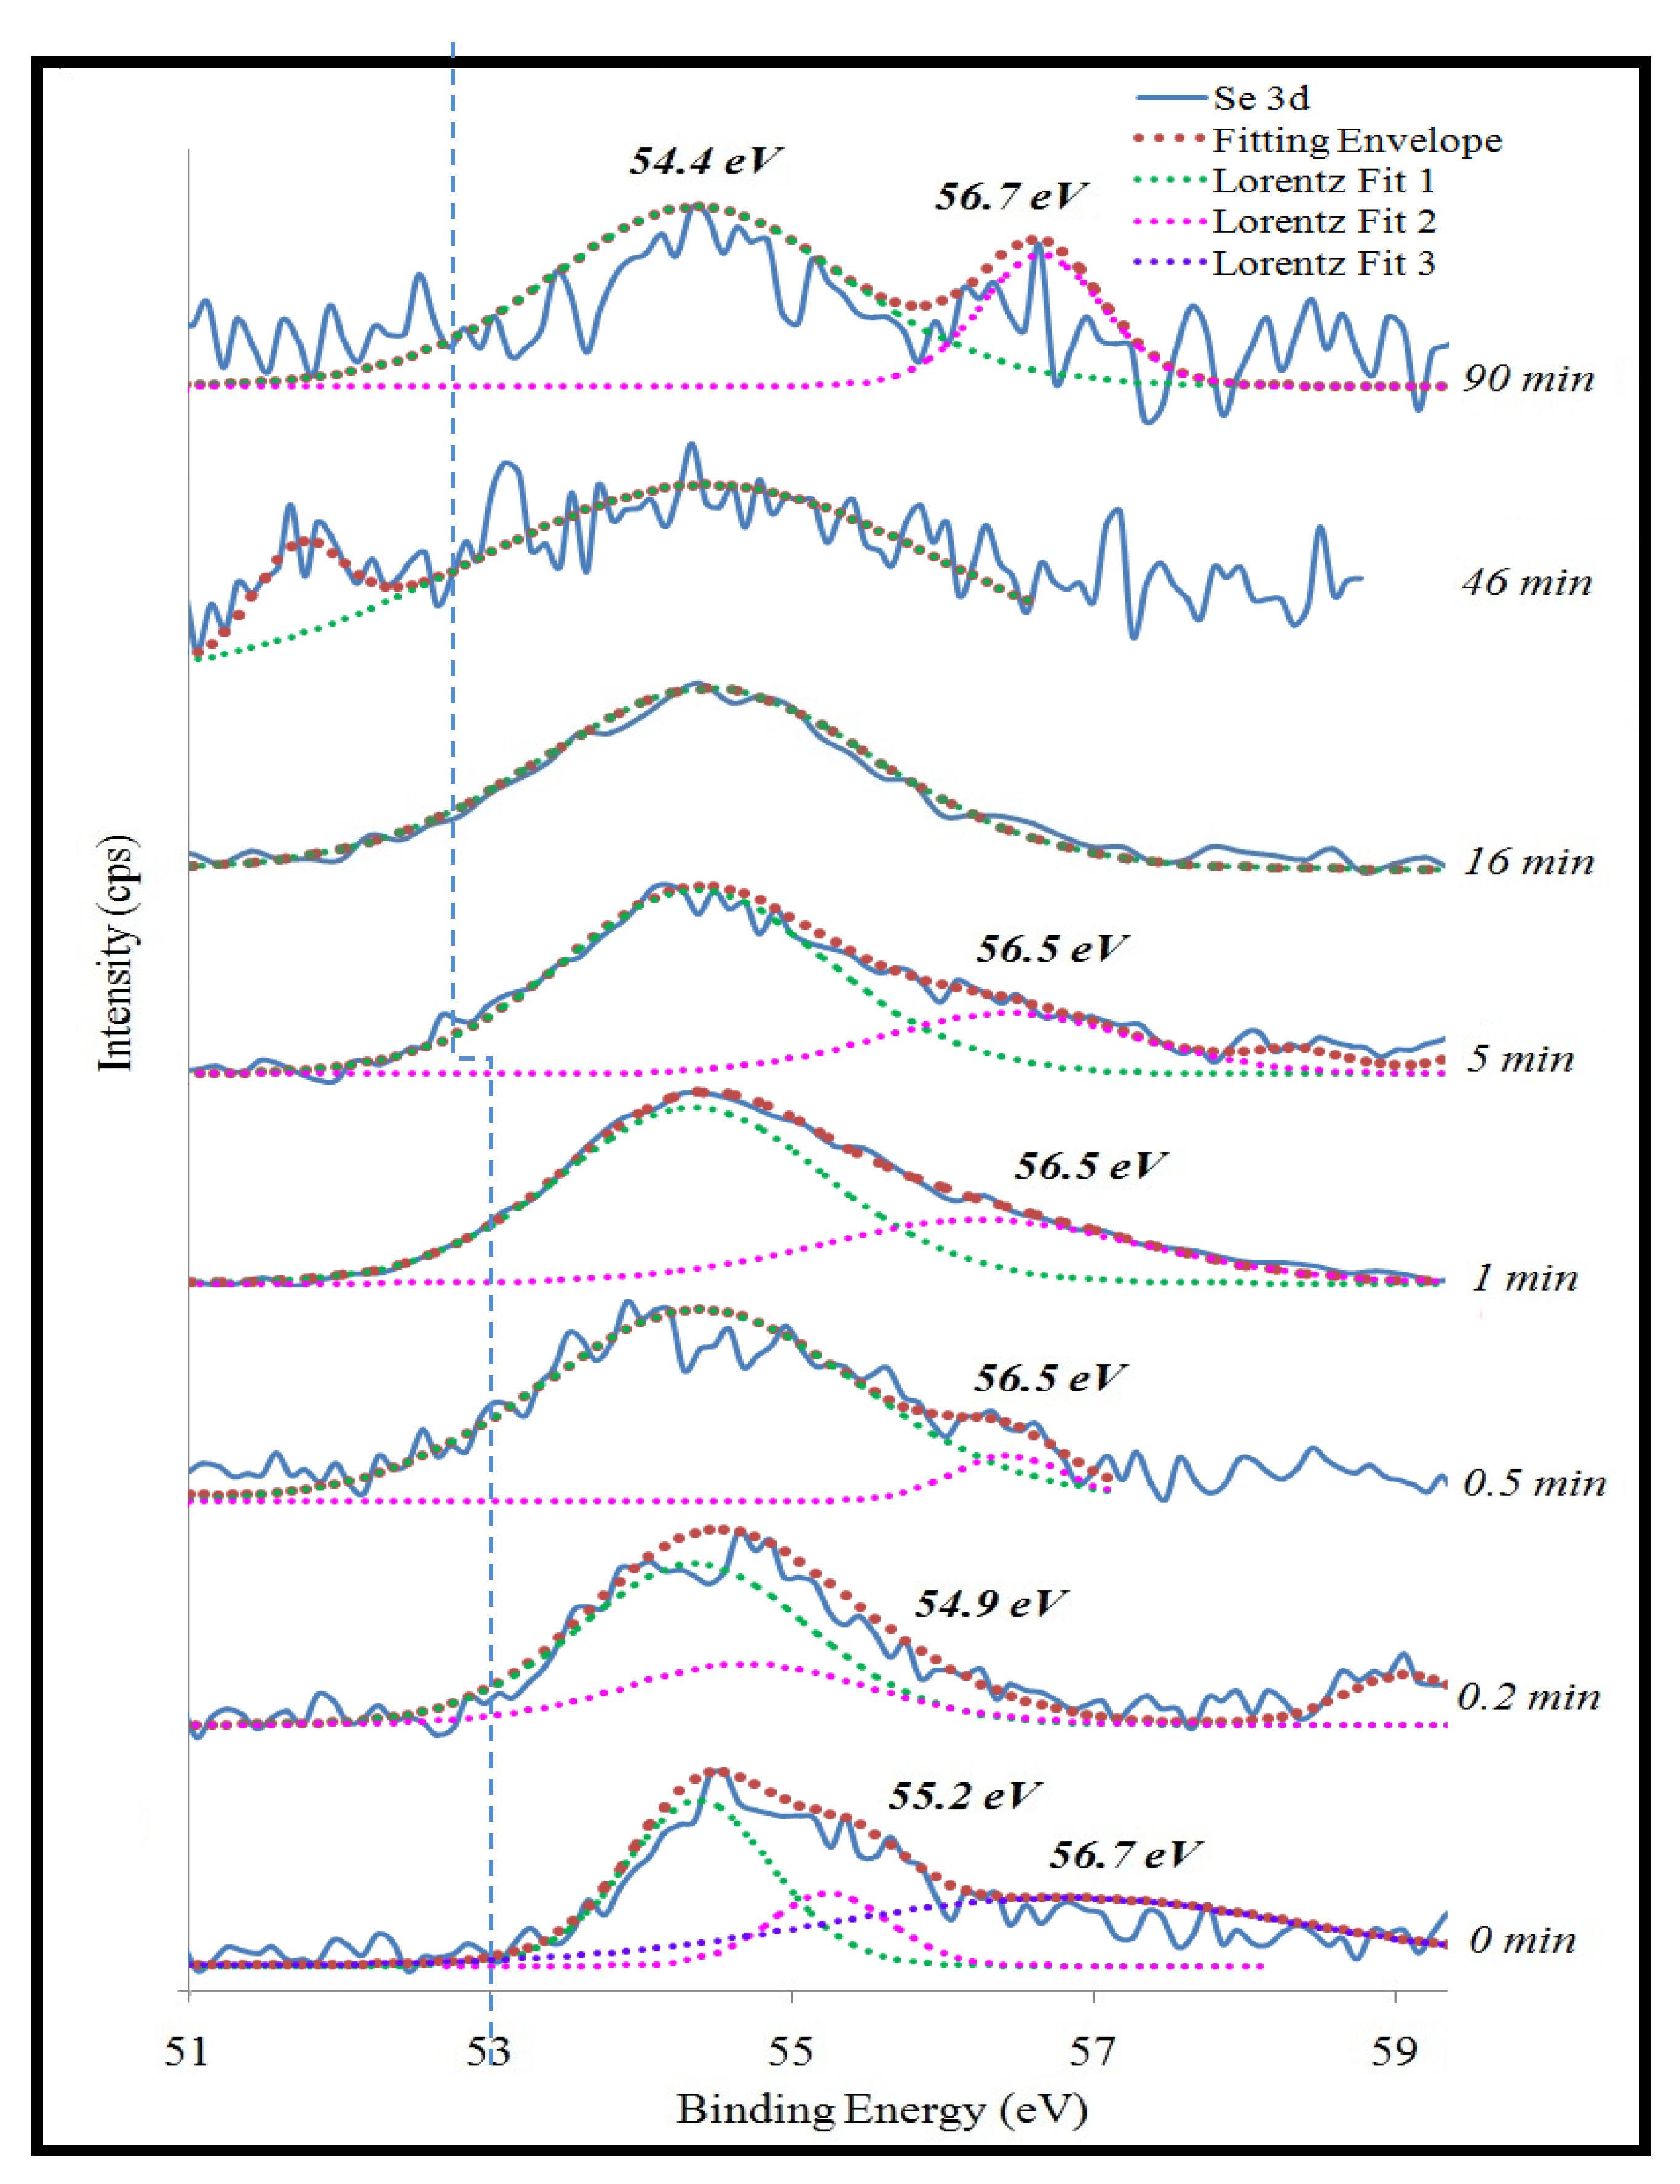
Figure 7 shows the individual XPS peaks of Se 3d and its Lorentz fits. Contrary to the Cd 3d results, no obvious shift of original peak was observed. On the other hand, the Lorentz fit 1 shifted to a smaller binding energy (404.2 eV) for the 0 min and 0.2 min samples, which also may be due to the function of QDs size in the chemical shift. Lorentz fit 2 shows readings ranging from 54.9 to 56.7 eV, excluding the 46 min and 16 min samples. XPS spectra for 0 min samples fitted to have extra Lorentz fit at 56.7 eV. Lorentz fit 2 and 3 indicated the influence of the Se 3d5/2 band in the binding of CdSe QDs. As in Figure 5, the spinning up orbital dominates the Se system, excluding 46 min and 16 min, which may be due to the absence of spinning orbital interaction [14]. Interestingly, in the 0 min samples, the Se 3d peak exhibits three Lorentz fitting features, 54.4 eV corresponds to the Se 3d band, and 55.2 and 56.7 eV correspond to 3d5/2, which is assumed to be due to the band structure complexation due to the higher density of lattice strain of core CdSe QDs where the Se atom is mainly located.
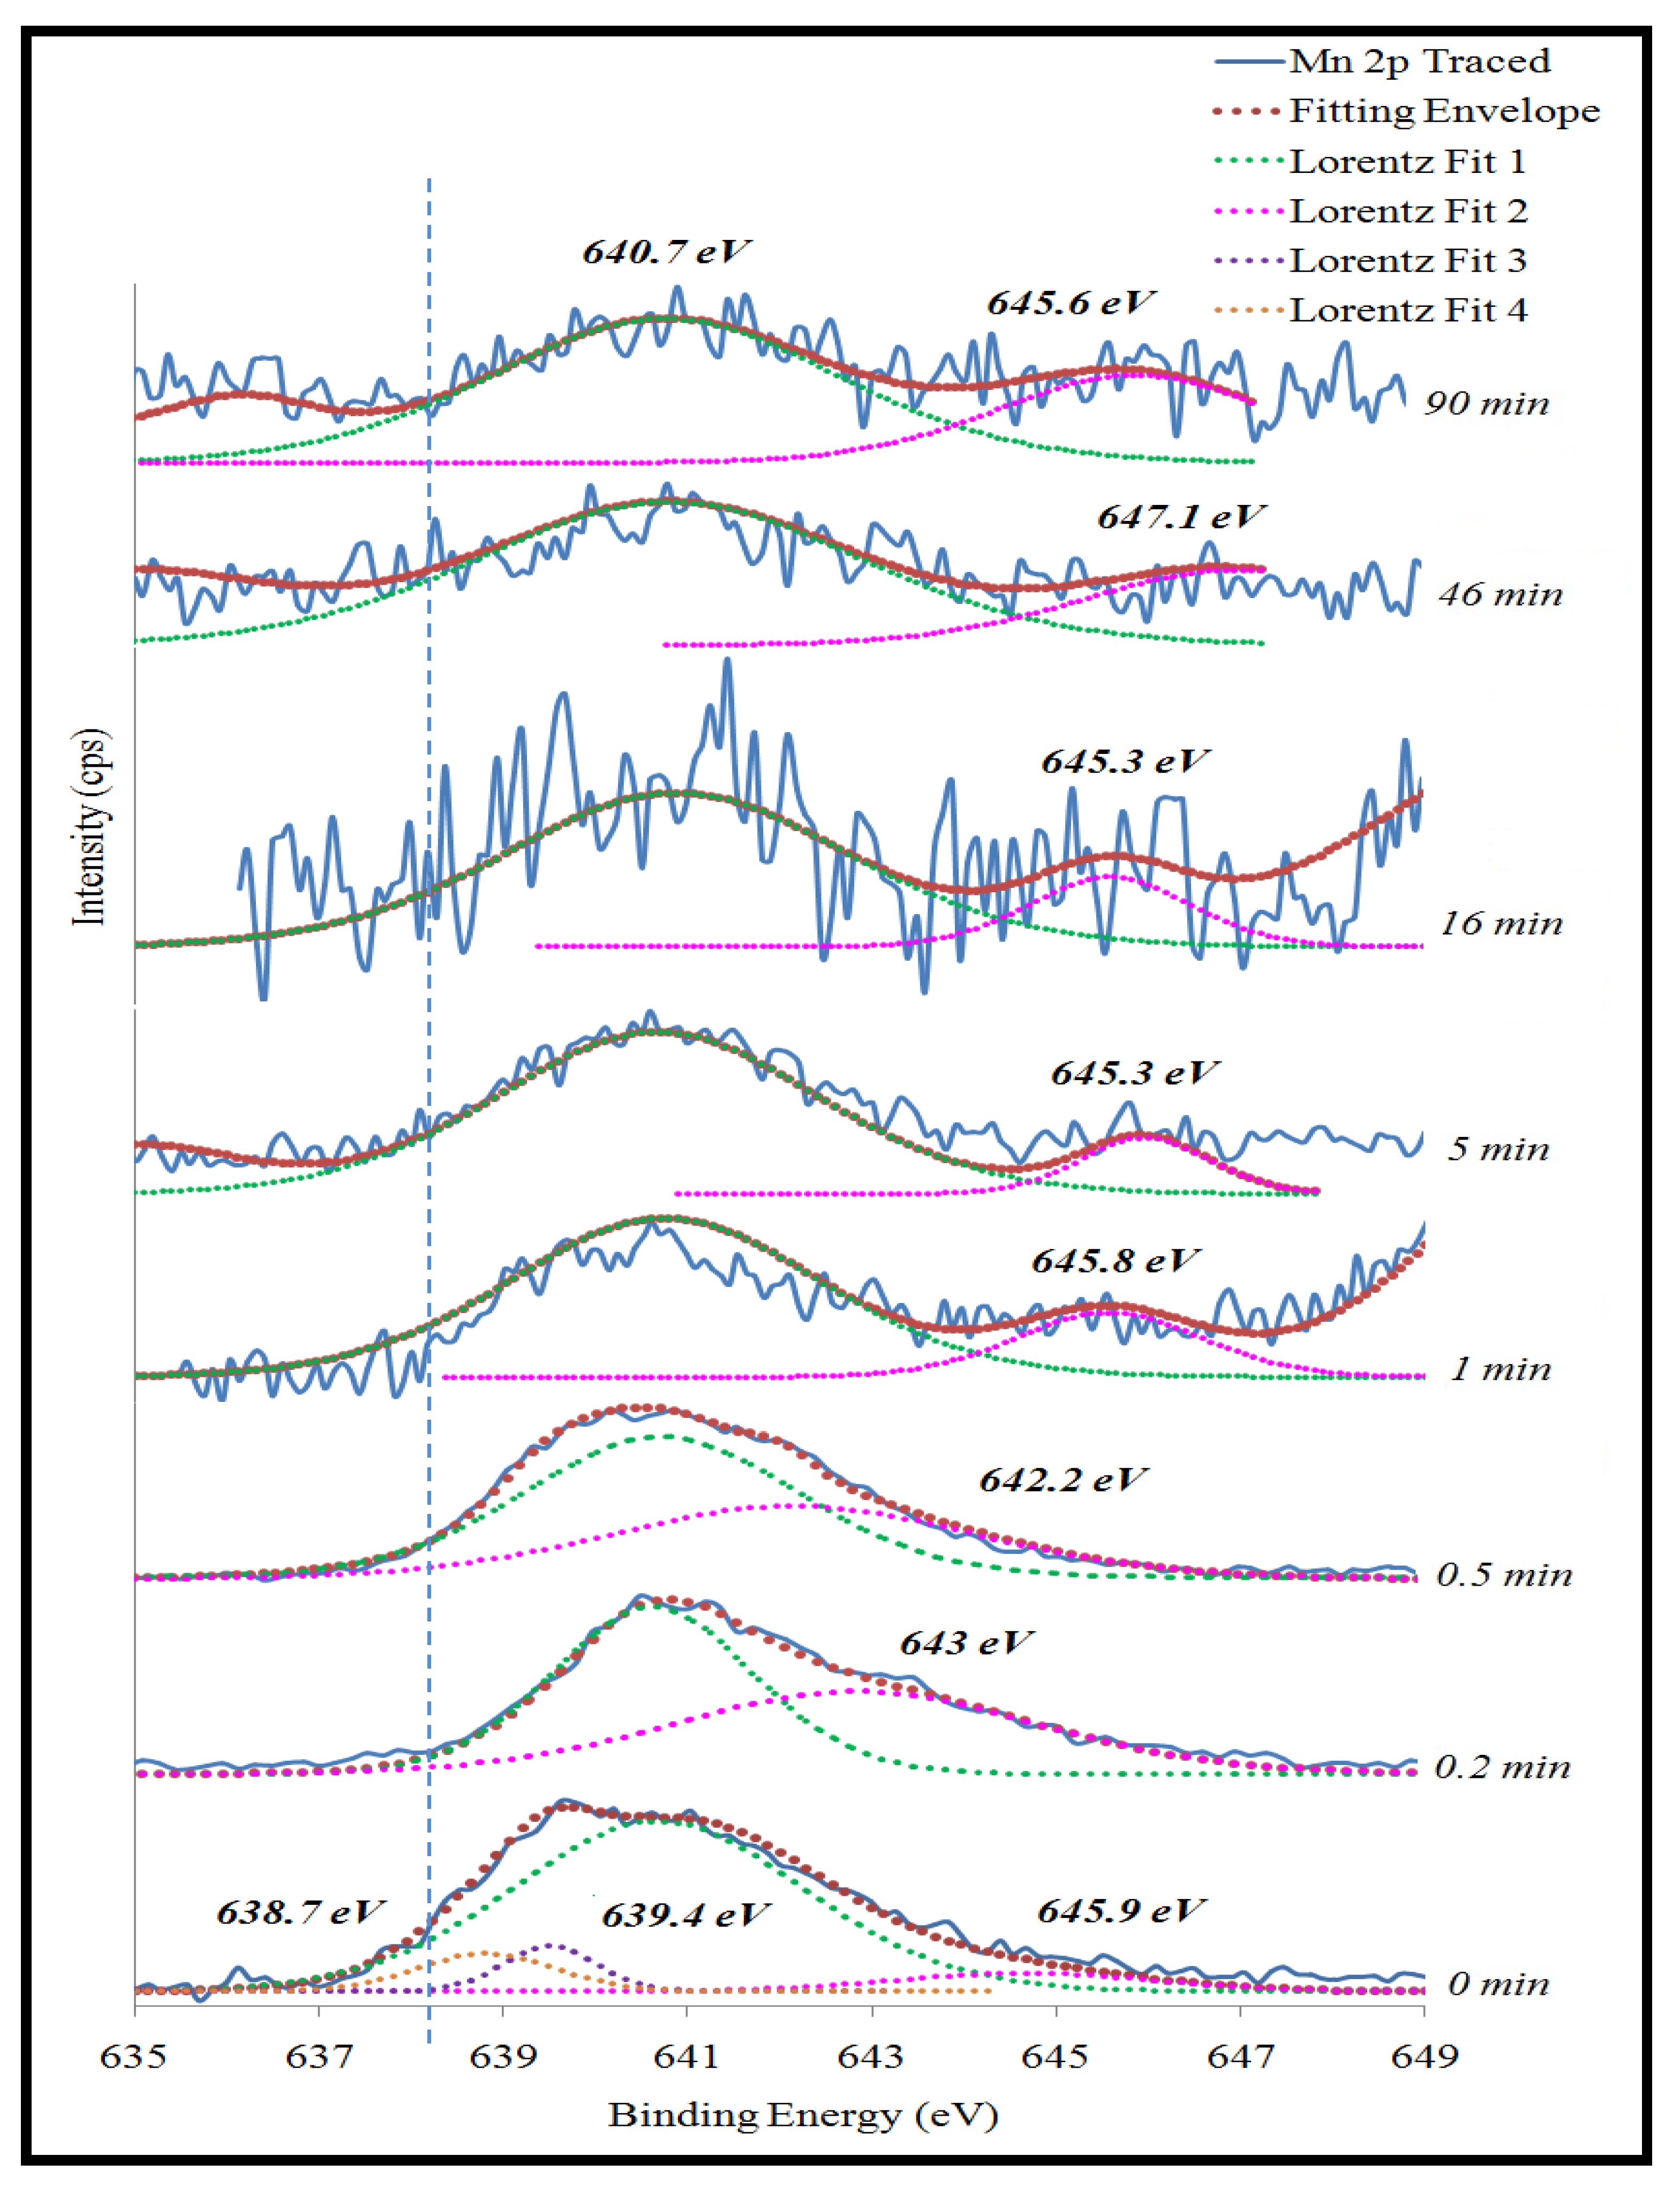
Figure 8 shows the Mn 2p traced for Mn-doped CdSe QDs, which is crucial to prove the presence of Mn acts as a shell in core-shell Mn-doped CdSe QDs samples. The Lorentz fit 1, which corresponds to the Mn 2p band with a binding energy of 640.7 eV is well fit in each sample. Lorentz Fit 2 with binding energy ranging from 642.2 to 645.9 eV in each XPS scan initially created a shouldering peak and eventually shifted to create another defined peak as the QDs size increased. The role of the Mn shell as a lattice strain inducer may change with the growth in the size of the QDs. Moreover, the presence of Lorentz fit 3 and 4 for the 0 min sample suggests there are extreme changes in the lattice parameter at critically small QDs, which may be induced by the Mn shell. Overall, the intensity of the Mn 2p peaks declined as the size of the QDs increased. This could be due to the decrease in the thickness of the Mn shell as the size of the QDs increases, which is related to the function of Mn ion concentration with reaction time [16].
The oxidation states of an exciting element are generally reported to be 2 for Cd, ±2, 4 and 6 for Se [16] and 7, 6, 4, 2 and 3 for Mn [16]. Figure 9 shows the relation between the Mn-doped CdSe QDs size with Cd 3d, Se 3d, and Mn 2p XPS peak intensity. Traced Cd 3d element shows the high values of peak intensity compared to Se 3d and Mn 2p. This is due to the high concentration of Cd atoms on the surface of QDs, which are presented as a Cd-oleate that acts as a ligand, and Cd atoms that are near the core-shell intermediate. These also suggest that Cd has an important role as the major electron donor in the Mn-doped CdSe QDs system. The relationship between the XPS peak intensity and the ion or atom concentration is strongly supported by Equation (2) where the electron intensity ( I ) presented by XPS peak are directly proportional to the concentration of the atom or ion on the samples ( ρ ), especially on the surface of the samples [19,20].
I = J   ρ   σ   K   λ
where,
  • I = Electron intensity
  • J = Photon flux
  • ρ = Concentration of the atom or ion in the solid
  • σ = Cross-section for photoelectron production
  • K = Instrumental factors
  • λ = Electron attenuation length
In addition, the intensity of Cd 3d peaks was observed to decrease from 3364 to 2000 cps as the QDs size increases. This may be due to the increases in electron concentration that leave the CdSe Mn-doped QDs solid samples after been irradiated by X-ray as the size of QDs became smaller. The smaller QDs have a larger surface area thus, larger sample area is exposed to the x-ray, resulting in a higher concentration of electron emitted from the QDs surface [16]. A great drop in peak intensity was observed for the 0 to 46 min samples and became stable in the final stages (46 min and 90 min). The influence of QDs size on the peak intensity was less pronounced as the size became larger than 12 nm.
Another interesting feature of XPS spectra is the peak broadening. Table 1 tabulated the full width at half maximum (FWHM) of Cd 3d, Se 3d, and Mn 2p peaks. The FWHM of Cd 3d ranged between 1.3 and 1.5 eV for 0 to 5 min reaction time samples, but then the FWHM values show a clear increase in the 16 min to 90 min samples. Se 3d and Mn 2p show narrowly distributed FWHM values for 0 min to 16 min samples. The FWHM values increased for the 46 min and 90 min samples. This increment may be relative to the QDs size increment, especially for Cd 3d since Cd is predicted to be the larger carrier donor at the surface of QDs. Besides, increases in the energy band gap were inversely proportional to the QDs. To elaborate further, Equation (2) shows that the relationship between the energy band gap ( E ) and the carrier effective mass ( m * ) are also inversely proportional, where ℏ and k are constants factors.
E = 2 k 2 2 m *
The charge carrier lifetime is highly dependent on the charge carrier concentration since it is also proportional to the effective mass of the carrier. Peak broadening with a decrement in the energy band gap may be due to the increase in carrier lifetime. According to the Heisenberg’s uncertainty principle [16], the core-hole, which is created by the incident photon has a finite lifetime, will create a broadening effect in the XPS peak. This broadening is well known as natural or lifetime broadening which is also the minimum attainable peak width. The collision of Cd, Se and Mn atoms with each other, whether between the same or different elements, will create distorted energy levels and results in a shorter lifetime of the excited state. This collision effect leads to the broadening of the XPS peak (collision broadening). Both of these broadening effects match a Lorentzian profile [16].
A broad QD size distribution may also lead to the XPS peak broadening. The variation in the defect density due to the QD size distribution leads to the variations in band bending. This band bending will produce broadened peaks. This discussion is supported by the QDs size distribution histogram, which shows the broad size distribution QDs in the 46 min and 90 min samples compared to the others [16].
Rani et al. reported that increases in dopant concentration results in peaks shifting towards higher energy values, which suggests that the dopant concentration contributes to the lattice modification in the CdSe QDs compound [10]. However, the effect of incorporated dopant on QDs is limited at a certain dopant concentration. The II-VI QDs electronic properties were reported to deteriorate after a specific dopant concentration was reached [10]. It is important that the dopant concentration and solubility limit in each compound of QDs be studied further.

4. Conclusions

Mn-doped CdSe QDs were synthesized with a narrow QDs size distribution using the inverse Micelle method and with quasi-sphere shaped QDs. Mn-doped CdSe QDs have a high-quality zinc blende crystal structure with the tetrahedral plane (001) doped with Mn ion. Mn-doping is predicted to optimize the surface passivation of anionic and cationic surface trap states that organic ligands cannot overcome. Furthermore, Mn2+ incorporation adds strain to the CdSe QDs lattice, which allows the tuning of inter-band energy structure. This ensures the tunability of its optical and electronic properties. The surface composition of the Mn-doped CdSe QDs is shown by the incorporation of Mn into CdSe lattice. The addition of strain to the lattice of the core CdSe QDs is prominent at the interface of QDs, which is highly incorporated by Mn dopants.

Author Contributions

N.A.H.—Date curstion, format analisis, investugation, project administration, writing—original draft; M.R.J.—Format analisis, resources, supervision; Y.A.W.—Date curation; Z.Z.C.—Date curation; O.A.—Date curation; S.S.—Writing—review & editing; I.A.B.—Funding acquisition; T.M.Y.K.—Funding acquisition; S.K.—Funding acquisition.

Funding

This research was funded by King Khalid University grant number R.G.P. 2/11/39 and University of Malaya grant number RU001-2018, RU001-2019 and ST018-2018. The APC was funded by University of Malaya.

Acknowledgments

The authors extend their appreciation to the Deanship of Scientific Research at King Khalid University for funding this work through research groups program under grant number (R.G.P. 2/11/39). This work was also financially supported by University of Malaya Research Grant (RU001-2018, RU001-2019 and ST018-2018).

Conflicts of Interest

The authors declare no conflict of interest.

References

  1. Talapin, D.V.; Rogach, A.L.; Kornowski, A.; Haase, M.; Weller, H. Highly Luminescent Monodisperse CdSe and CdSe/ZnS Nanocrystals Synthesized in a Hexadecylamine−Trioctylphosphine Oxide−Trioctylphospine Mixture. Nano Lett. 2001, 1, 207–211. [Google Scholar] [CrossRef]
  2. Devi, L.S.; Devi, K.N.; Sharma, B.I.; Sarma, H.N. Influence of Mn doping on structural and optical properties of CdS nanoparticles. Indian J. Phys. 2014, 88, 477–482. [Google Scholar] [CrossRef]
  3. Kwak, W.-C.; Kim, T.G.; Chae, W.-S.; Sung, Y.-M. Tuning the energy bandgap of CdSe nanocrystals via Mg doping. Nanotechnology 2007, 18, 205702. [Google Scholar] [CrossRef]
  4. Sung, Y.-M.; Kwak, W.-C.; Kim, T.G. Coarsening Kinetics of Mn-Doped CdSe Nanocrystals. Cryst. Growth Des. 2008, 8, 1186–1190. [Google Scholar] [CrossRef]
  5. Kwak, W.-C.; Sung, Y.-M.; Kim, T.G.; Chae, W.-S. Synthesis of Mn-doped zinc blende CdSe nanocrystals. Appl. Phys. Lett. 2007, 90, 173111. [Google Scholar] [CrossRef]
  6. Perdew, J.P.; Burke, K.; Ernzerhof, M. Generalized gradient approximation made simple. Phys. Rev. Lett. 1996, 77, 3865–3868. [Google Scholar] [CrossRef] [PubMed]
  7. Erwin, S.C.; Zu, L.; Haftel, M.I.; Efros, A.L.; Kennedy, T.A.; Norris, D.J. Doping semiconductor nanocrystals. Nature 2005, 436, 91–94. [Google Scholar] [CrossRef] [PubMed]
  8. Alivisatos, A.P. Semiconductor clusters, nanocrystals, and quantum dots. Science 1996, 271, 933–937. [Google Scholar] [CrossRef]
  9. Mikulec, F.V. Organometallic synthesis and spectroscopic characterization of manganese-doped CdSe nanocrystals. J. Am. Chem. Soc. 2000, 122, 2532–2540. [Google Scholar] [CrossRef]
  10. Hamizi, N.A.; Johan, M.R. Synthesis and size dependent optical studies in CdSe quantum dots via inverse micelle technique. Mater. Chem. Phys. 2010, 124, 395–398. [Google Scholar] [CrossRef]
  11. Valais, I.; Michail, C.; Fountzoula, C.; Tseles, D.; Yannakopoulos, P.; Nikolopoulos, D.; Bakas, A.; Fountos, G.; Saatsakis, G.; Sianoudis, I.; et al. On the response of alloyed ZnCdSeS quantum dot films. Results Phys. 2017, 7, 1734–1736. [Google Scholar] [CrossRef]
  12. Jiang, F.; Muscat, A.J. Ligand-controlled growth of ZnSe quantum dots in water during Ostwald ripening. Langmuir 2012, 28, 12931–12940. [Google Scholar] [CrossRef] [PubMed]
  13. Dongzhi, Y.; Qifan, C.; Shukun, X. Synthesis of CdSe/CdS with a simple non-TOP-based route. J. Lumin. 2007, 126, 853–858. [Google Scholar]
  14. Agostinelli, E.; Battistoni, C.; Fiorani, D.; Mattogno, G.; Nogues, M. An XPS study of the electronic structure of the ZnxCd1−x Cr2 (X = S, Se) spinel system. J. Phys. Chem. Solids 1989, 50, 269–272. [Google Scholar] [CrossRef]
  15. Ivanov-Ehmin, B.; Nevskaya, N.; Zajtsev, B.; Ivanova, T. Synthesis and properties of calcium and strontium hydroxomanganates (3). Zhurnal Neorg. Khimii 1982, 27, 3101–3104. [Google Scholar]
  16. Dai, Q.; Sabio, E.M.; Wang, W.; Tang, J. Pulsed laser deposition of Mn doped CdSe quantum dots for improved solar cell performance. Appl. Phys. Lett. 2014, 104, 183901. [Google Scholar] [CrossRef] [Green Version]
  17. Smith, A.M.; Nie, S. Semiconductor Nanocrystals: Structure, Properties, and Band Gap Engineering. Acc. Chem. Res. 2010, 43, 190–200. [Google Scholar] [CrossRef] [PubMed]
  18. Pokrant, S.; Whaley, K.B. Tight-Binding studies of surface effects on electronic structure of CdSe nanocrystals: the role of organic ligands, surface reconstruction, and inorganic capping shells. Eur. Phys. J. D 1999, 6, 255–267. [Google Scholar] [CrossRef]
  19. Katari, J.B.; Colvin, V.L.; Alivisatos, A.P. X-ray photoelectron spectroscopy of CdSe nanocrystals with applications to studies of the nanocrystal surface. J. Phys. Chem. 1994, 98, 4109–4117. [Google Scholar] [CrossRef]
  20. Gaarenstroom, S.; Winograd, N. Initial and final state effects in the ESCA spectra of cadmium and silver oxides. J. Chem. Phys. 1977, 67, 3500–3506. [Google Scholar] [CrossRef]
Figure 1. Manganese-doped cadmium selenide quantum dots (Mn-doped CdSe QDs) samples with various colors at different reaction times: (a) 0, (b) 0.2, (c) 0.5, (d) 1, (e) 5, (f) 16, (g) 46 and (h) 90 min.
Symmetry 11 01250 g001
Figure 2. (a) TEM image of Mn-doped CdSe QDs of 0.2 min sample with QDs size distribution (insert) and (b) the lattice structure image of 0.2 min sample.
Symmetry 11 01250 g002
Figure 3. The growth of QDs with reaction times.
Symmetry 11 01250 g003
Figure 4. XRD patterns of Mn-doped CdSe QDs sample.
Symmetry 11 01250 g004
Figure 5. XPS wide scan of Mn-doped CdSe QDs at different reaction times.
Symmetry 11 01250 g005
Figure 6. XPS scan of Cd 3d traced for Mn-doped CdSe QDs samples.
Symmetry 11 01250 g006
Figure 7. The XPS scan of Se traced for Mn-doped CdSe QDs at various reaction times.
Symmetry 11 01250 g007
Figure 8. XPS scan for Mn traced for Mn-doped CdSe QDs at various reaction times.
Symmetry 11 01250 g008
Figure 9. Relation between peak intensity and the variation in size of Mn-doped CdSe QDs.
Symmetry 11 01250 g009
Table 1. Full width at half maximum of the XPS peak of Mn-doped CdSe QDs for different reaction times.
Reaction TimeFWHM (eV)
(min)Cd 3dSe 3dMn 2p
01.52.22.3
0.21.42.22.2
0.51.32.62.3
11.32.72.3
51.32.62.4
162.22.72.5
462.53.63.0
902.34.15.1

