1. Introduction
Due to the fast-paced urbanization in China, rapid developments in the transportation industry, and improvements in vehicle capacity and road grade requirements, the design width of highway tunnels has greatly increased. Conventional two- and three-lane highway tunnels severely restrict the rapid flow of highway traffic. Some extra-large-section tunnels, represented by four-lane highway tunnels, have emerged in the engineering arena and will become the best design scheme for China’s expressway construction across mountainous and urban areas for a long time to come.
A basic problem in the study of tunnel calculation methods is how to calculate the loosening load caused by the surrounding rock of the tunnel. A good calculation method can enable researchers and engineers to accurately determine the loads and pressures of tunnels. The calculation also serves as an important prerequisite for the success of tunnel design and construction. Due to the peculiarity of the structural design of extra-large-section highway tunnels, the large span of the sections, and the complex stress conditions and construction procedures, the limitations of commonly used methods to calculate the loosening loads of tunnels are becoming increasingly prominent. If an unsuitable correlation is used to calculate the load and surrounding rock pressure, it will increase the difficulty of tunnel design and eventually lead to hidden dangers in tunnel safety or significant economic problems. Therefore, more and more researchers are looking for new methods which are suitable for calculating the loosening load of extra-large sections.
At present, dozens of load calculation methods are used worldwide. Most of these methods are based on experience and statistics and have a specific application scope.
In 1907, a Russian scholar named Protodyakonov proposed the classification of surrounding rock and the correlation for the loosening pressure of loose strata and broken rock mass [
1]. Protodyakonov’s theory considered the span, the internal friction angle, and the height of the cave, and it is widely applied in tunnel design in Europe and the United States.
In 1922, based on the earth pressure theory, Hewett and Johannesson estimated the magnitude and distribution of pressure acting on the lining structure [
2]. The results are often based on the ideas and experience of engineers and technicians with no consideration of the stress redistribution after excavation. Due to this reason, the method has significant uncertainty.
In 1946, K. Terzaghi proposed a correlation for calculating the surrounding rock pressure of loose rock mass using the stress transfer method [
3]. The proposed correlation takes into account the internal cohesion of loose materials; however, the lateral friction coefficients are taken as the tangential values of the internal friction angle of loose materials. The correlation is suitable for calculating the pressure of the surrounding rock of shallow tunnels due to the conservative results.
In 1964, Deere, an American scholar, put forward a correlation for calculating the surrounding rock pressure according to the rock quality designation (RQD) classification [
4]. Since the 1970s, the classification of engineering surrounding rock developed from qualitative to quantitative and from single factor to comprehensive evaluation based on multiple factors. As a result, correlations for estimating the surrounding rock pressure that can reflect the influence of multiple factors were proposed, including the correlation present in the tunneling quality index (Q) system [
5] that was proposed by the Norwegian scholar Barton and the correlation present in the rock mass rating (RMR) [
6] system proposed by the South-African–Polish scholar Bieniawski.
In 1991, Goel and Jethwa [
7] proposed a correlation based on the RMR system and used it to estimate the surrounding rock pressure.
In 1992, based on the Q classification system, Singh et al. [
8] proposed a correlation, which correlated the factors of burial depth, ground condition, and time and used it to estimate the surrounding rock pressure of tunnels with a depth of more than 320 m.
In 1994, Goel [
9] proposed a correlation that indicates the connection between the surrounding rock pressure and the rock condition rating (RCR).
In 1995, Goel et al. [
10] proposed a relationship between the surrounding rock pressure and the rock mass coefficient under extrusion and nonextrusion conditions by modifying the application scope of Terzaghi’s correlation.
In 1996, Bhasin and Grimstad studied fractured rock masses [
11] and found that the pressure of the surrounding rock is proportional to the span of the tunnel. The same authors proposed a correlation that was based on the Q system.
The Code for the Design of Railway Tunnels [
12] (TB10003-2005), published in China, proposed a correlation for calculating the surrounding rock pressure under the probabilistic limit state method with the assumption that the surrounding rock is the loosening bulk. The correlation was developed on the basis of statistics of 1025 collapse data points.
The load calculation correlations of shallow-buried tunnels in Grades IV–VI surrounding rocks (Xiejiajie correlation [
13]) and deep-buried tunnels with loose surrounding rock are proposed in the Code for the Design of Highway Tunnels (in Chinese) [
14] (JTG D70-2004).
Correlations for calculating the surrounding rock pressure of thin-bedded and fragmented structures are found in the Code for the Design of Hydraulic Tunnels (in Chinese) [
15] (SL279-2002).
In 2018, Kong et al. [
16] analyzed the influence of the geological strength index (GSI from 20 to 80), the overburden depth (
H from 40 to 420 m), the in situ stress ratio (
k0 from 0.8 to 3), and the excavation roof rise-to-span ratio on the surrounding rock pressure.
In 2019, Gao et al. [
17] analyzed numerical simulation results, introduced the span term into the method of calculating surrounding rock pressure based on the Q system, and proposed a method that can quickly estimate the surrounding rock pressure of tunnels.
Based on the summary of the calculation methods of tunnel load and surrounding rock pressure, and considering the calculation process, we analyzed the influencing factors, the different surrounding rock conditions, and the applicable conditions of various correlations, and the results are presented in
Table 1.
There is a common characteristic in the correlations presented in
Table 1. It is worth noting that almost all the correlations for load and surrounding rock pressure are derived or calculated for small-span tunnels, and they have some limitations in their application to large-span and extra-large-section tunnels. Therefore, it is essential to put forward a reasonable and correct calculation method for the load and surrounding rock pressure of extra-large-section tunnels.
Based on the Liantang Tunnel’s large-span section of the Shenzhen Eastern Transit Expressway, which has an excavation section area exceeding 400 m2, in this study, we calculated the loosening pressure of the large-span Liantang Tunnel through traditional state calculation methods and analyzed and compared the calculated results. This paper discusses the problems existing in the application of load and surrounding rock pressure calculation methods to extra-large-section tunnels. On this basis, we proposed a concept of process design load and focused on the difference and relationship between the process load calculation method and the traditional state load calculation method. By introducing the concepts of influence coefficient and weight coefficient in combination with various excavation methods, a calculation method, considering the influence of the construction process, for the process load of extra-large-section tunnels was developed. By comparing the on-site monitored pressure data and the calculated load results, this paper demonstrates the rationality and feasibility of the process load calculation method from a practical perspective and provides a theoretical reference and a calculation basis for the design and construction of similar projects in the future.
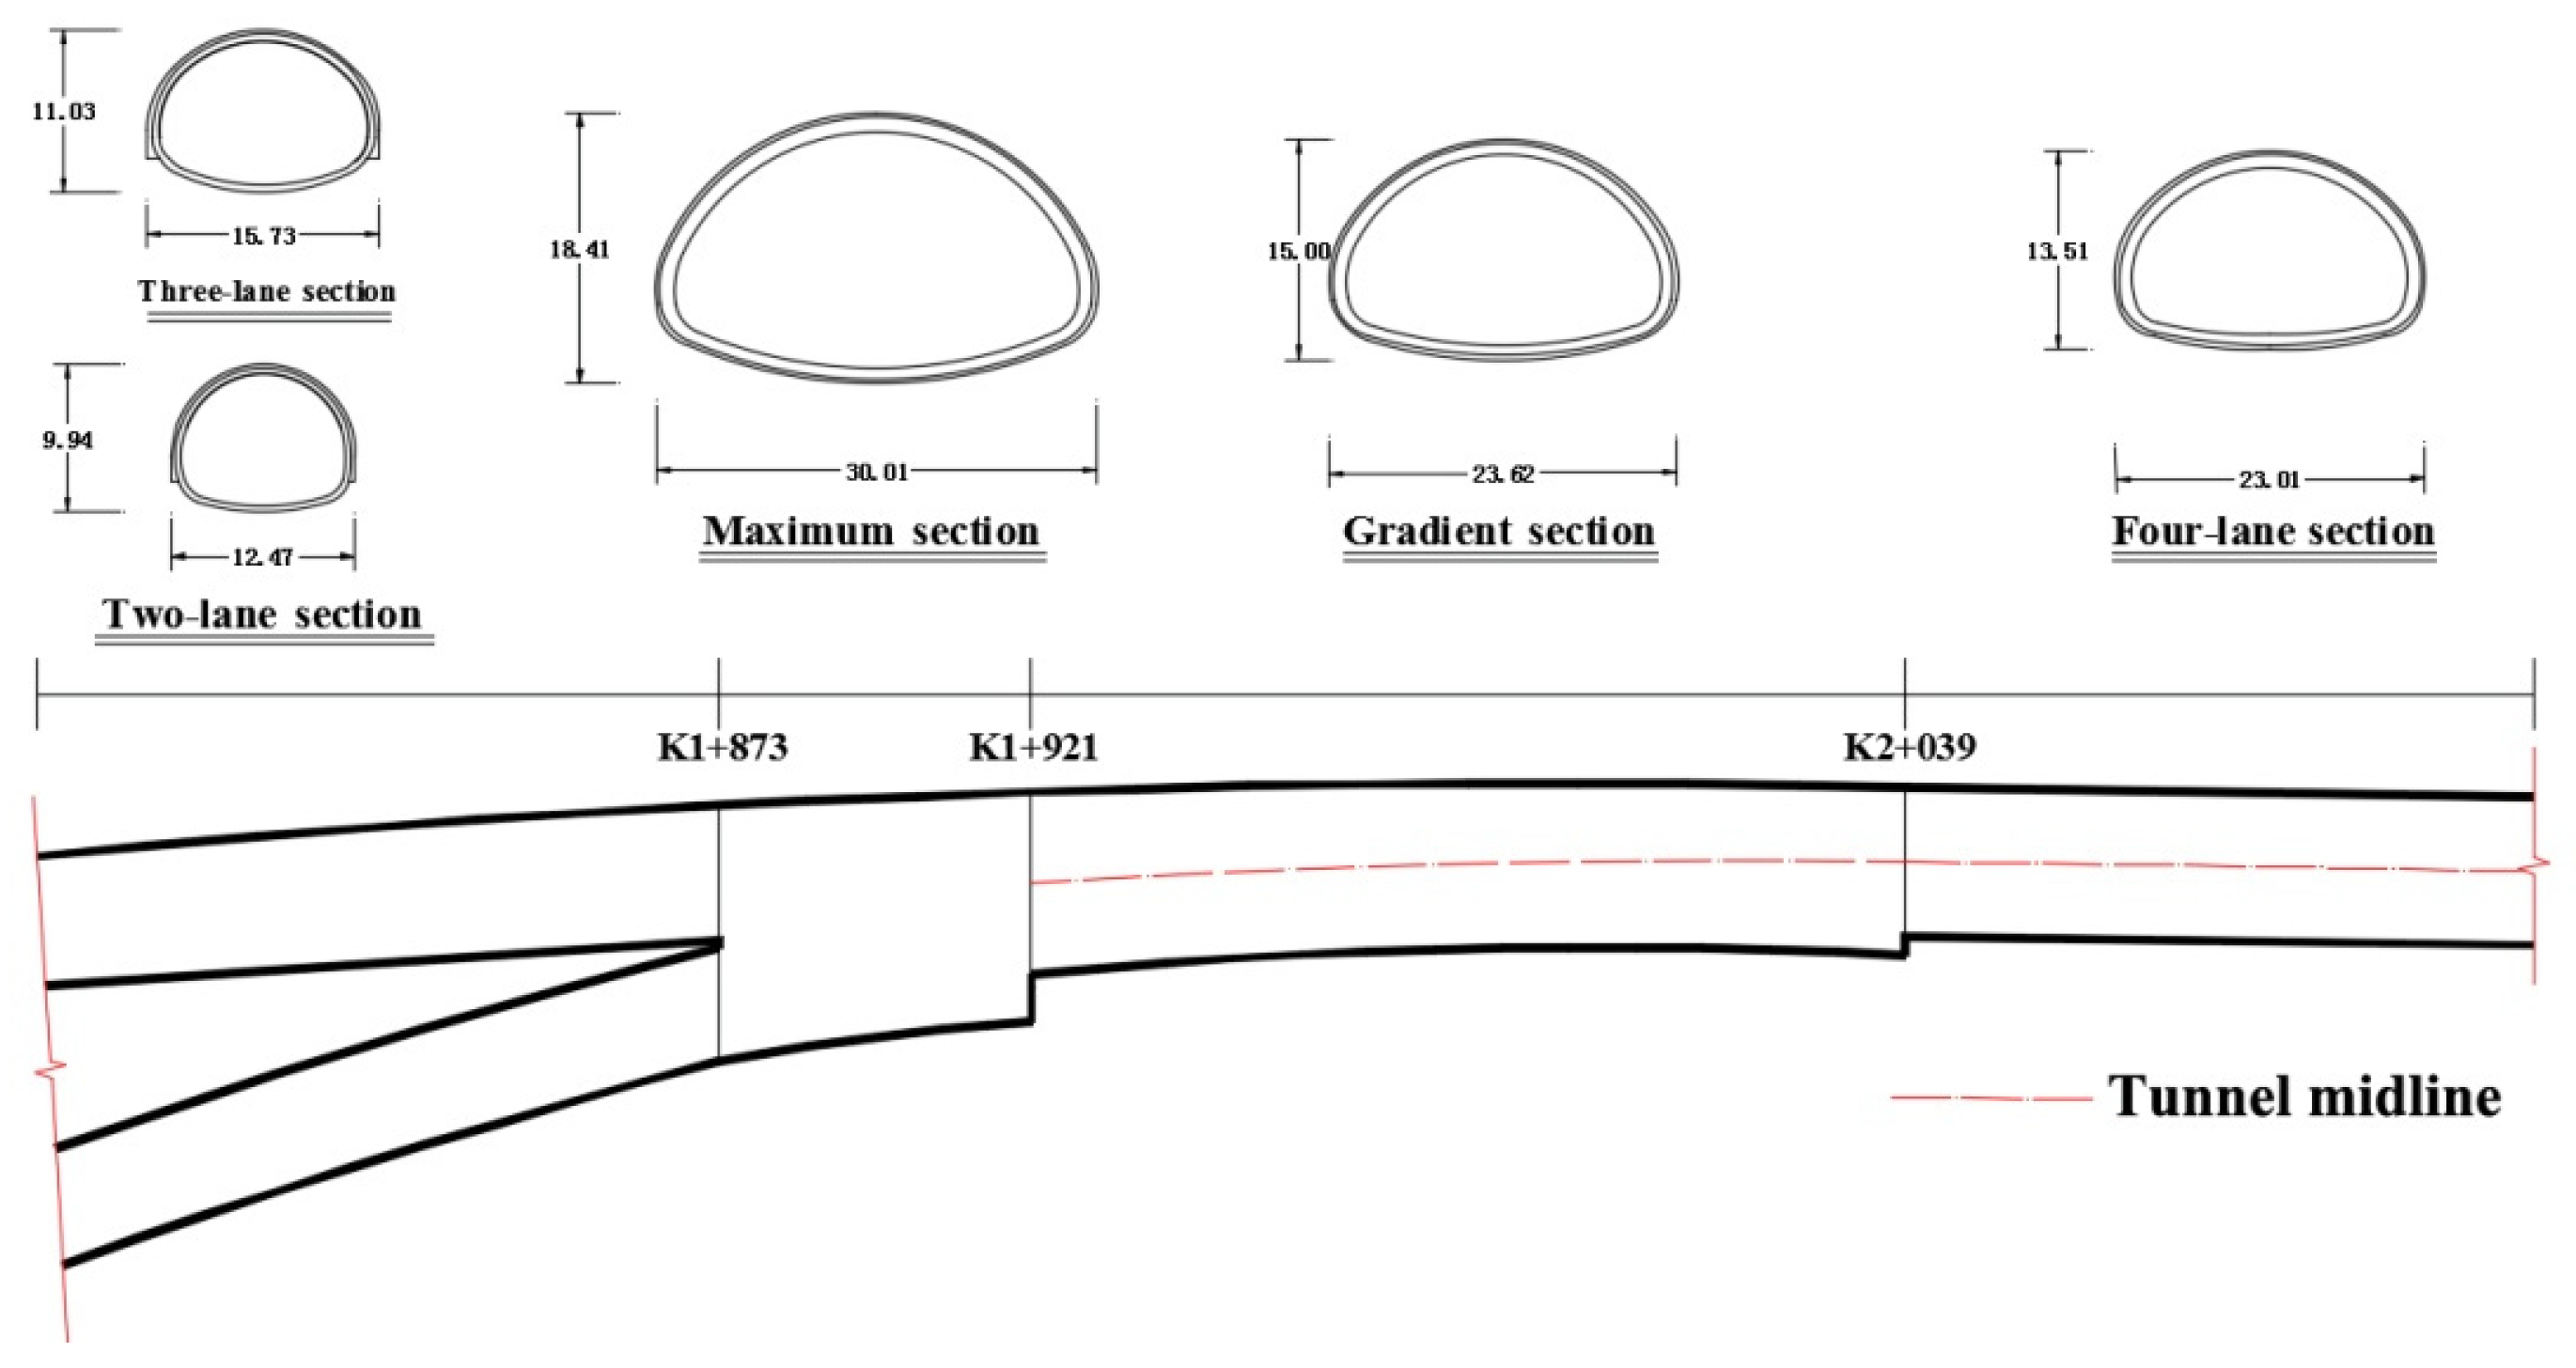
3. Application of Traditional State Calculation Methods in the Extra-Large Section of the Liantang Tunnel
The traditional load calculation methods assume that the tunnel is excavated in a single excavation and only considers the final state; these are defined as the state calculation methods in this paper. Extra-large-section highway tunnels are essentially different from traditional one-tube and two-lane tunnels. It is necessary to study the adaptability of current traditional state calculation methods for applications to extra-large-section tunnels.
In this study, we adopted the recommended correlation of the Code for the Design of Road Tunnels and Protodyakonov’s theory, introducing the recommended correlation of the surrounding rock classification system commonly used in the United States and European countries, and calculated the loosening pressure of the Liantang Tunnel’s extra-large section. We analyzed and compared the calculated results and discuss the problems existing in the application of traditional state calculation methods to extra-large-section tunnels.
3.1. Analysis of the Load and Surrounding Rock Pressure of the Liantang Tunnel
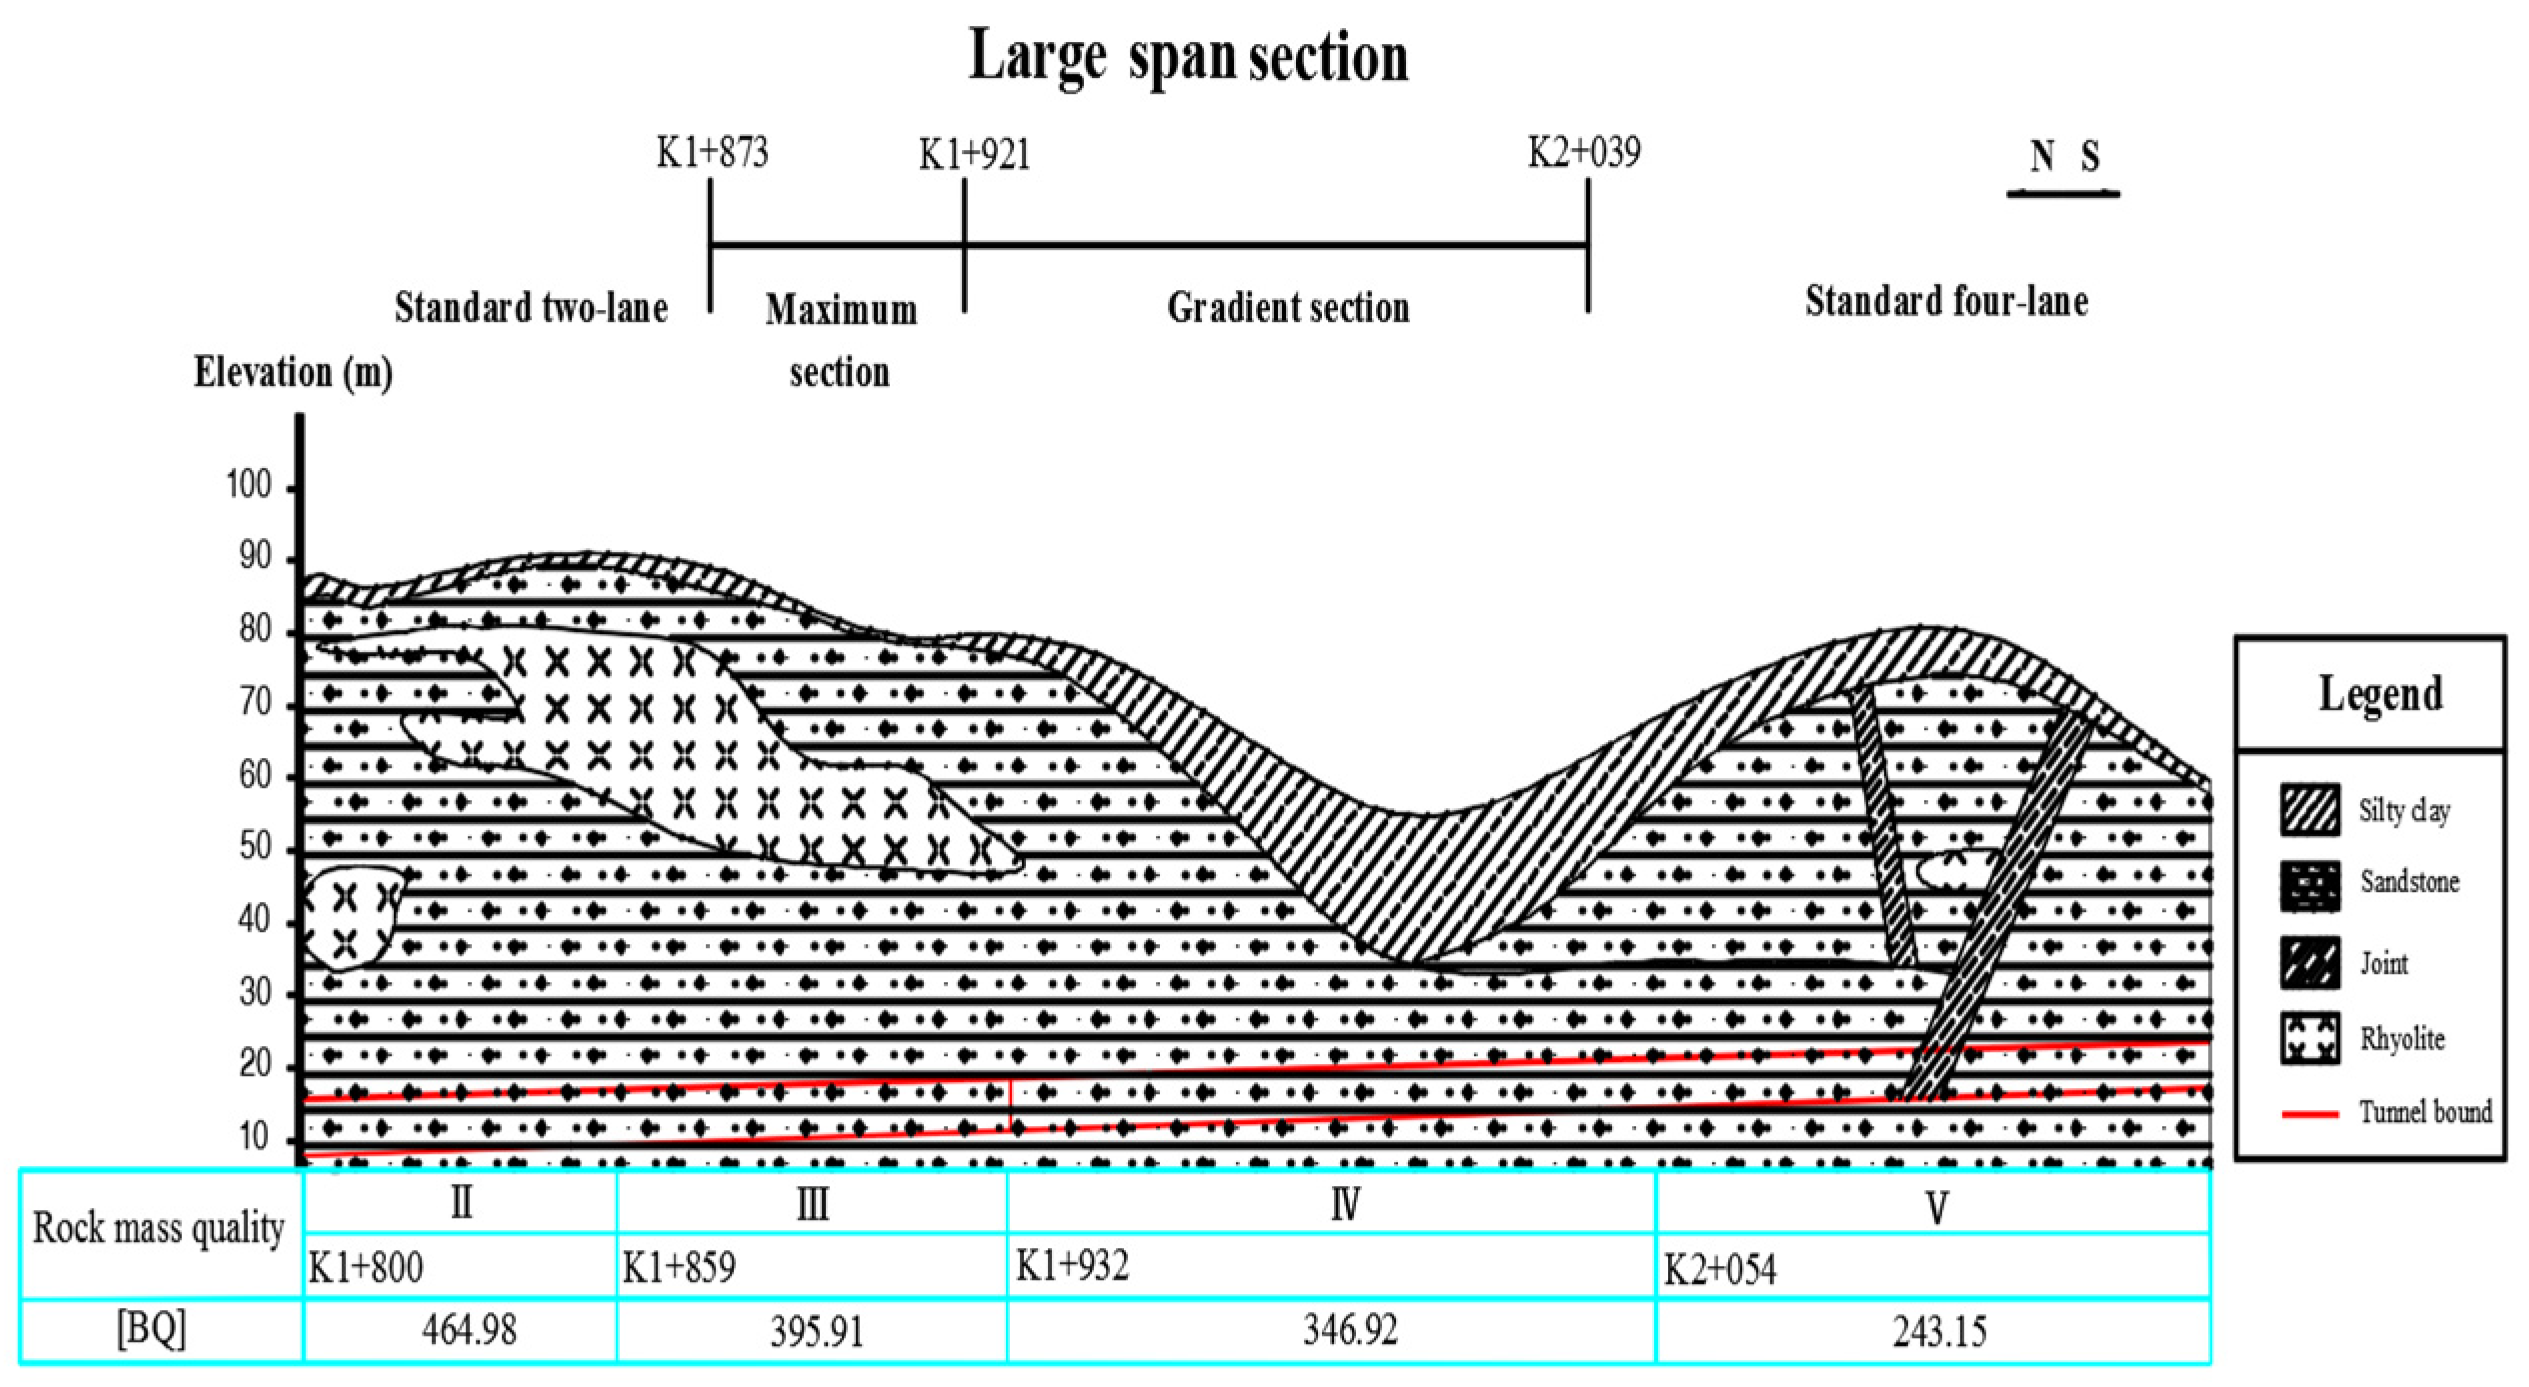
Table 2 shows the surrounding rock’s mechanical parameters for each section of the Liantang Tunnel’s large-span bifurcation section, which were estimated from the geological investigation and laboratory test results.
3.1.1. Calculation Based on the Code for the Design of Road Tunnels
The Code for the Design of Road Tunnels stipulates that the vertical surrounding rock pressure at the arch of a deep-buried single tunnel can be calculated using Equations (1)–(4):
where
is the vertical uniform pressure (kN/m
2);
is the load equivalent height (m);
is the surrounding rock unit weight (kN/m
3);
is the surrounding rock grade;
is the width influence coefficient;
is the maximum excavation span of the tunnel (m); and
denotes the rate of increase or decrease of surrounding rock pressure for every 1 m increase or decrease in
, which is based on the vertical uniform pressure of the surrounding rock of the tunnel, with
,
= 0.2 when
, and
= 0.1. Furthermore,
is the average horizontal uniform surrounding rock pressure (kN/m
2), and
is the lateral pressure coefficient, which was adopted according to the specifications given in
Table 3.
The calculation results for the surrounding rock’s loosening pressure for each section of the Liantang Tunnel under the condition of deep burial are presented in
Table 4.
3.1.2. Calculation Based on the Protodyakonov’s Theory
In 1907, the Russian scholar Protodyakonov put forward the classification of surrounding rocks and the correlation of loosening pressure for loose strata and fractured rock mass:
where hard rock
, soft rock
,
is the vertical uniform pressure (kN/m
2),
is the pressure arch height (m),
is the pressure arch span (m),
is the projection width of the rupture surface on both sides of the tunnel on the horizontal plane (m),
is the tunnel excavation span (m),
is the tunnel excavation height (m),
is the calculated friction angle (°),
is the surrounding rock Protodyakonov coefficient, and
is the uniaxial compression strength of rock (MPa).
The results presented in
Table 5 show the loosening pressure of each section based on Protodyakonov’s theory. According to the results presented in
Table 4 and
Table 5, the maximum heights of the collapse arch under two traditional state load calculation methods were found to be 18.74 and 17.38 m, respectively, which are much smaller than the depth of tunnel. Therefore, it can be inferred that the large-span bifurcation section of the Liantang Tunnel is under the condition of deep burial depth.
Protodyakonov’s theory, with its consideration of the span, internal friction angle, and height of the unlined tunnel, is widely used in tunnel design in Europe, the United States, and other countries. However, the key premise of the theory is to reasonably and accurately determine the surrounding rock Protodyakonov coefficient.
The Protodyakonov’s theory is generally applicable in sections with loosening and broken surrounding rocks, especially in some deep-buried sections with poor surrounding rock stability.
3.1.3. Calculation Based on the RMR System
The RMR system uses an RMR value to represent the quality or stability of a rock mass. Six main factors affecting the stability of the surrounding rock mass are scored and the total value is taken as the value of the rock mass.
Six factors of the large-span section of the Liantang Tunnel were determined based upon geological investigation and laboratory test results. These factors included
uniaxial compressive strength, ;
RQD;
spacing of joint group;
groundwater influence coefficient;
joint roughness coefficient;
joint occurrence and combination relationship.
The surrounding rock pressure under different surrounding rock grades of each section was calculated using the correlation given in
Table 6 (Equation (9)):
where
is the vertical uniform pressure (kN/m
2),
is the surrounding rock unit weight (kN/m
3), and
is the tunnel maximum excavation span (m).
In the RMR system, technicians need to estimate some of the factors affecting the stability of surrounding rock. The results of this estimation are highly subjective. If the estimation is inaccurate, the results will produce a large error.
It is suggested that the calculation parameters can be obtained by means of instrumental detection and other technical means, thus avoiding the shortcomings of estimation of parameters. Meanwhile, it is necessary to take correlations of various parameters into account and to derive, verify, and double-check the result repeatedly for accurate calculation of the parameters.
3.2. Analysis of the Load Calculation Results of the Liantang Tunnel’s Large-Span Section
The geometric size of the tunnel has a certain effect on the load. In order to illustrate the extent of the impact of the geometrical factors on the large-span section, the loosening load of an ordinary two-lane tunnel under the same conditions was calculated and compared with the Liantang Tunnel. The corresponding results are presented in
Table 7.
Based upon the results, following main features were observed in the data.
(1) Due to the influence of excavation span and height, the loosening load of the Liantang Tunnel’s large-span section calculated by state calculation methods significantly increased compared with the two-lane tunnel. The average vertical load (173.98 kPa) at the maximum section of the Liantang Tunnel is 2.22 times that of the two-lane section (78.40 kPa) under the deep-buried condition of Class III surrounding rock. Furthermore, the average vertical load (248.63 kPa) at the gradient section of the Liantang Tunnel is 1.75 times that of the two-lane section (141.67 kPa) under the deep-buried condition of Class IV surrounding rock. Additionally, the average vertical load (351.33 kPa) at the four-lane section is 1.56 times that of the two-lane section (224.68 kPa) under the deep-buried condition of Class V surrounding rock.
(2) Traditional state calculation methods are mainly aimed at small-span tunnels with the consideration that one-time excavation of tunnels does not take into account the impact of the construction process, which is essentially different from the actual construction process of the Liantang Tunnel.
In order to reduce the scope of the loosening zone, multistep excavation methods (such as the one sidewall heading method, the double sidewall heading method, and the three-bench seven-step method) have been adopted in the construction of the Liantang Tunnel’s large-span section. Partial excavation methods are equivalent to dividing the tunnel into different parts, while the excavation of each part represents the construction of a small-sized tunnel. Therefore, the loosening scope is the result of multiple excavations instead of a single excavation.
(3) The traditional load calculation methods cannot determine the degree of increase in load and the rationality of load calculation results. Based on these methods, the conclusion is that the load of an extra-large-section tunnel increases greatly. However, it is impossible to analyze whether the increase is reasonable or not and if the actual load is obtained.
4. State Design Method and Process Design Method
The discussion presented in
Section 3 shows that the traditional load calculation methods are not suitable for calculating extra-large-section tunnels. The methods are called the concept of state design, which means that it only considers the final state and the tunnel to be excavated at one time. In contrast to the concept of state design, this paper puts forward the concept of process design, which considers the impact of the construction process and combines the construction procedures to carry out the load calculation and structural design. The concept and method of process design originate from the following two reasons.
(1) In recent years, extra-large-section highway tunnels have shown considerable growth, and complex construction methods have widely been used. The impact of the construction process on the design cannot be ignored. Therefore, it is in accordance with the trend of tunnel engineering to propose the concept and method of process design.
(2) The determination of current load merely takes the final state into consideration. This means that the tunnel is completed by excavation at one time, which is inconsistent with the actual situation. Since the construction process of an extra-large-section tunnel has a great influence on the stability of the tunnel, a load analysis that considers the actual construction process is of scientific significance and practical value.
4.1. Concept of Process Design Method
The process design method divides the tunnel section into several separate caverns according to the construction steps, and based on the design of each cavern, produces an integrated design. The method focuses on the influence of the construction process on the load of the tunnel and analyzes and calculates the loosening load step-by-step according to the excavation steps. The loosening scope of the process design method is not a static single area but a dynamic area with the construction process. It results from the interaction of the loosening area of each cavern.
4.2. Connections and Differences Between the State Design Method and Process Design Method
There are some connections between these two methods: (1) Load calculation correlations of state design method are the basis and premise of the process design method. Protodyakonov’s theory and the Code for the Design of Road Tunnels belong to the category of state design method. In the process design method, when calculating the loosening load of each step (cavern), it is necessary to adopt the method of Protodyakonov’s theory or the Code for the Design of Road Tunnels to calculate the loosening loads. (2) The state design method is part of the process design method to a certain extent. The process design method pays attention to the analysis and calculation of each excavation step. Furthermore, the calculation of each step ultimately represents the state design process.
The essential difference between the methods is the difference in the generation process of the loosening load. The state design method embodies the concept of static design, while the process design method analyzes the load conditions of each excavation step. It considers the influence of loads between different steps and finally determines the load on the overall structure of the tunnel based on the combination of the results of each step according to certain rules.
5. Calculation Method of Process Load for Extra-Large-Section Tunnel
5.1. Proposal for Calculating Loosening Load of Extra-Large-Section Tunnel
The method is based on the process design concept; the main points are as follows:
Firstly, according to the construction method, a large-section tunnel is divided into several small-span caverns or separated into several small-scale tunnels.
Secondly, each small-span cavern is simplified based on certain rules and its geometric parameters are obtained.
Thirdly, the scope of the loosening zone or the loosening pressure of each tunnel is determined.
Fourthly, according to the envelope of the loosening zone of each tunnel, the scope of the loosening zone of the extra-large-section tunnel is determined, and the loosening pressure is calculated.
5.2. Establishment of Simplified Model for Process Load Calculation Method
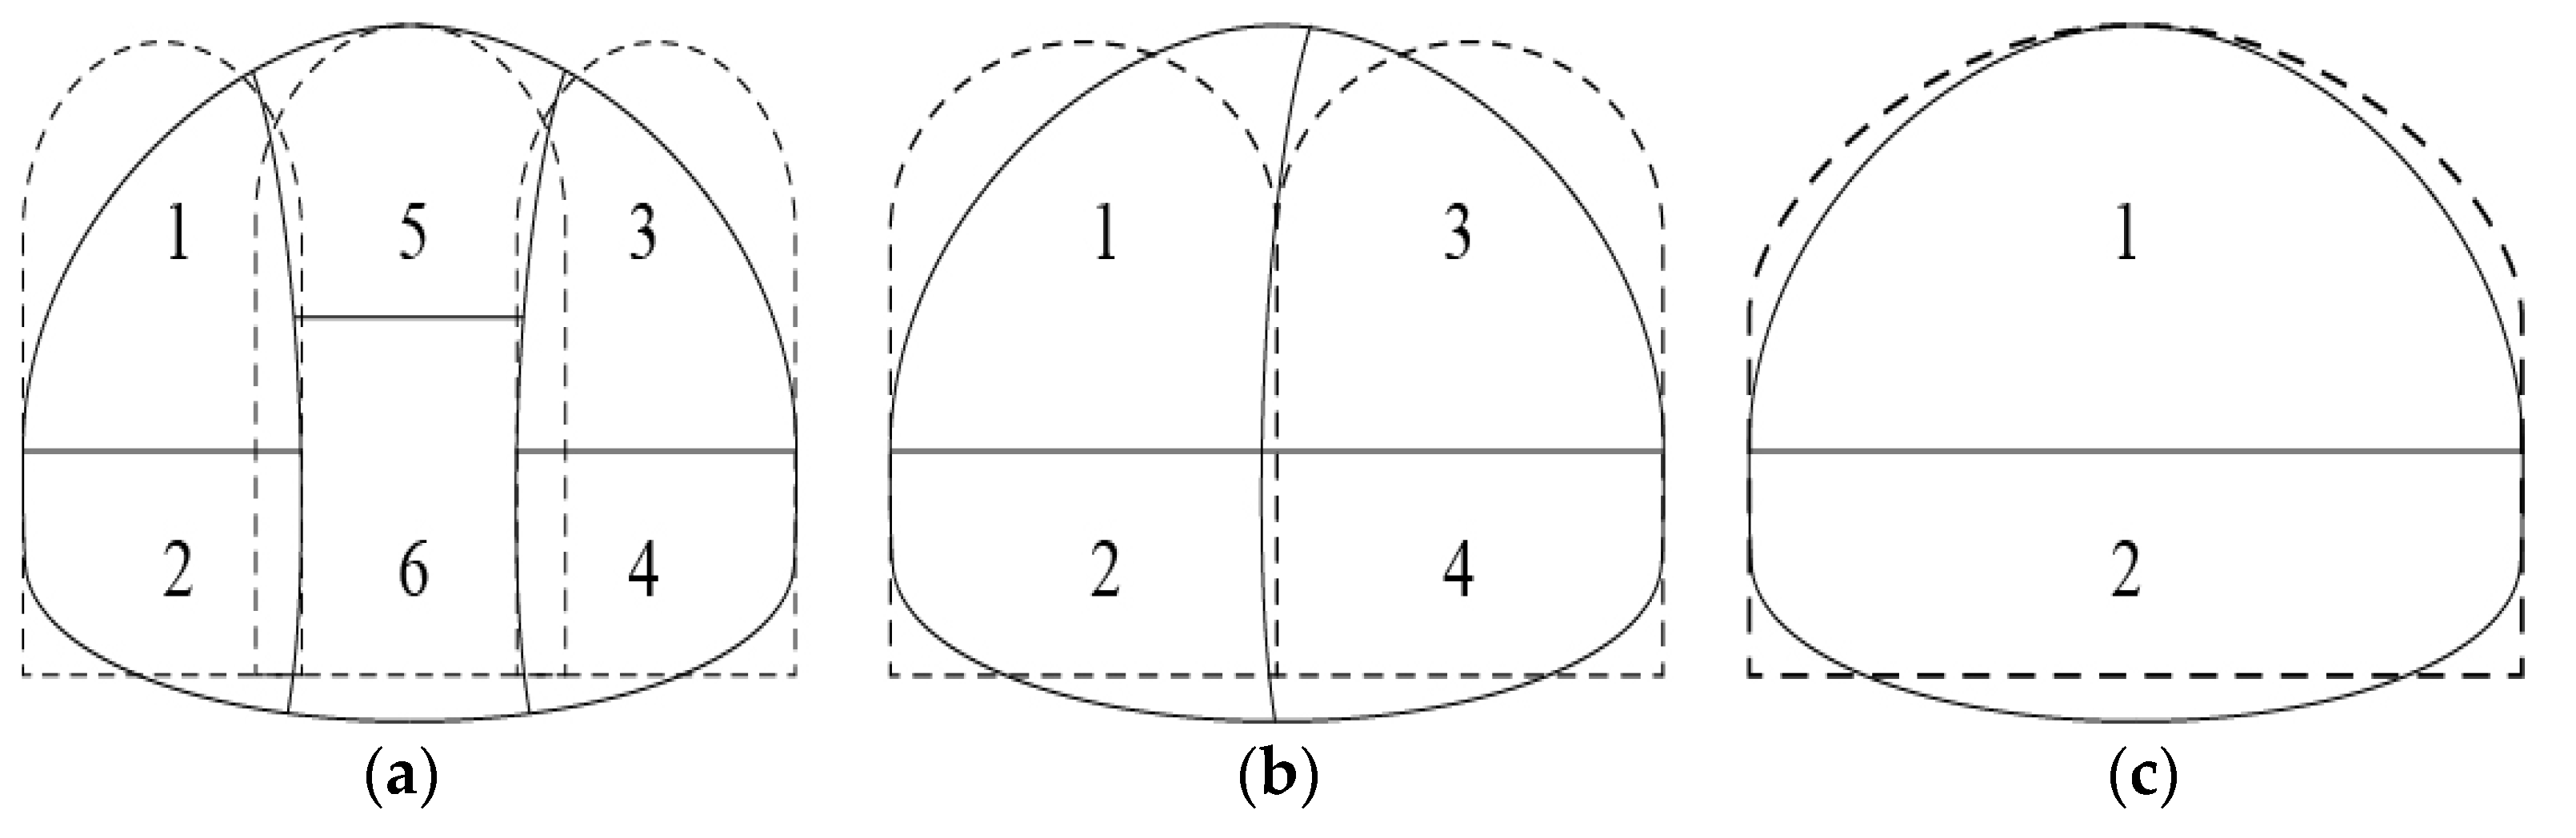
The simplification of the calculation model should obey the following principles.
(1) Simplify the complex multistep and multiprocess excavation into several simple pilot tunnels. According to a previous work [
12], when the span of a cavern is less than 12 m, the difference between the stress redistribution caused by bench method excavation and that caused by a single excavation is less than 10%. Therefore, bench method excavation can be combined into a single excavation for small-span caverns.
(2) The geometric size of the pilot tunnels should be in accordance with the actual excavation situation. The simplified width should be taken as the position with the largest width in the actual pilot tunnel. Considering the safety reserve and site conditions, the simplified height should be 95% of the actual maximum excavation height.
According to these assumptions, the simplified models of different construction methods are shown in
Figure 4.
5.3. Derivation of the Calculation Correlation for Process Load Method
On the basis of the simplified models mentioned above, the calculation correlations of the process load are deduced. In this study, by introducing the concepts of the influence coefficient and the weight coefficient in combination with various excavation methods, the calculation correlations of the process load under various calculation methods were derived based on the Code for the Design of Road Tunnels and Protodyakonov’s theory.
5.3.1. Influence Coefficient and Weight Coefficient
(1) The influence coefficient
indicates the degree of influence of the back-hole excavation on the loosening load or the loosening scope of the first hole. As shown in
Figure 5, the vertical loosening load
of the right hole can be calculated according to the state load correlations. After the left hole is excavated, it may further increase the loosening load formed by the right hole, whereas the total loosening pressure is given by the product
. The parameter
is represented as follows:
(2) The weight coefficient
indicates the proportion of vertical uniform load caused by each pilot tunnel in the total load of the tunnel, which represents the contribution of pilot tunnel load to total load. The coefficient is less than 1, and the correlation for the weight coefficient
is given by Equations (10)–(12):
where
is the total load at the top of a single pilot tunnel,
is the uniform load of the pilot tunnel,
is the width of the pilot tunnel,
is the total load on the top of all pilot tunnels, and
is the number of pilot tunnels.
5.3.2. Deduction of the Calculation Correlation
The method to determine the load is as follows.
Step 1: The loosening loads caused by the excavation of the pilot tunnels are combined to obtain the overall vertical loosening load (introducing the influence coefficient ).
Step 2: The nonuniform vertical loads are normalized, which means that they are converted into uniform vertical pressure (introducing the weight coefficient ).
(1) Calculation of the Loosening Load by Protodyakonov’s Theory
According to Protodyakonov’s theory, the excavation of each pilot tunnel should produce vertical uniform load
. The influence coefficient
is then introduced, and the vertical uniform load of each pilot tunnel is calculated using Equation (13):
where
is the vertical uniform load of the corresponding pilot tunnel,
is the geometrical width of the corresponding pilot tunnel,
is the geometrical height of the corresponding pilot tunnel,
is the surrounding rock unit weight,
is the calculating friction angle, and
is the Protodyakonov coefficient. Furthermore,
can be set to be 1,2,3…,
, where
is the simplified number of pilot tunnels.
Weight coefficient
is given by Equation (14):
Vertical uniform load
is given by Equation (15):
When
(three-drift excavation method),
Equation (13) is substituted and the total vertical uniform load is given by Equation (17):
(2) Calculation of the Loosening Load by the Code for the Design of Road Tunnels
The correlation for calculating the vertical surrounding rock pressure at the arch of a deep-buried single tunnel is represented by Equation (20):
where
is the vertical uniform pressure;
is the surrounding rock unit weight;
is the surrounding rock grade;
is the maximum excavation span of the corresponding pilot tunnel; and
is the rate of increase or decrease of surrounding rock pressure for every 1 m increase or decrease of
, which is based on the vertical uniform pressure of the surrounding rock of the tunnel, with
,
= 0.2 when
, and
= 0.1.
can be set as 1,2,3…,
, where
is the simplified number of pilot tunnels.
A. Vertical uniform load
is given by Equation (21):
B. Horizontal load
. According to the Code for the Design of Road Tunnels, the horizontal uniform load of surrounding rock is presented in
Table 8.
C. When
(three-drift excavation method),
(3) Calculation of the Loosening Load Using the Terzaghi Theory
According to the Terzaghi theory, the influence coefficient
is introduced, and the vertical uniform load of each pilot tunnel (
) is calculated using Equations (23) and (24):
where
is the vertical uniform pressure,
is the lateral pressure coefficient,
is the depth of the corresponding pilot tunnel,
is the cohesion,
is the surrounding rock’s unit weight,
is the half of the collapsing width for the corresponding pilot tunnel,
is the span of the corresponding pilot tunnel,
is the height of the corresponding pilot tunnel,
is the ground additional load, and
can be set as 1,2,3…,
, where
is the simplified number of pilot tunnels.
A. Vertical uniform load
is given by Equation (25):
B. Horizontal loads
and
are given by Equations (26) and (27), respectively:
C. When
(three-drift excavation method),
5.4. Comparison and Analysis of Construction Methods Based on Process Load
Because different construction methods correspond to different loosening loads, the degree of influence of these excavation methods on the surrounding rock’s stability is determined according to the load value. Therefore, the construction methods can be compared and optimized according to the loosening loads.
At present, the commonly used construction methods of large-section tunnels are the double sidewall heading method, the median septum excavation method (center diaphragm (CD) and cross diaphragm (CRD) methods), and the bench method. In this study, the vertical loads calculated using these construction methods were compared. The mechanical parameters of the surrounding rock in the four-lane section of the Liantang Tunnel were used as the calculation parameters and are presented in
Table 9.
For the sake of uniform comparison, the influence coefficient N was assumed to be 1.2. The calculation results are presented in
Table 10.
The results of the analysis and comparison showed the following:
(1) For the same load calculation method, the greater the number of excavation steps, the smaller the vertical load. The maximum load was produced by a single excavation, while the minimum was produced by the four guide holes. The ratios of the two loads were 1.63 (Protodyakonov’s theory) and 2.325 (Code for the Design of Road Tunnels).
(2) Although the calculating methods were different (Protodyakonov’s theory and Code for the Design of Road Tunnels), the calculating results were basically in good agreement with each other. Additionally, the results of the two methods were close to each other for the same excavation method.
(3) There were some differences between the load calculation results based on the process design method. The selection of excavation sequence of the double sidewall heading method affected the load size. First, the side and, then, the middle was the smallest, followed by sequential excavation. First, the middle and, then, the side became the largest, while the ratio of the three was 0.94:1:1.10.
5.5. Process Load Calculation of Large-Span Section of the Liantang Tunnel
The process load calculation of the maximum section, the gradient section, and the four-lane section of the Liantang Tunnel was carried out. The calculation steps were as follows:
(1) The excavation process was simplified and abstracted. The median septum excavation was simplified to partial excavation of two pilot tunnels and the double sidewall heading method was simplified to three pilot tunnels. The actual excavation width and height of the pilot tunnels were considered separately according to the geometrical dimensions of the pilot tunnels, as shown in
Figure 5. The pilot tunnels were numbered according to the excavation sequence, and the specific geometric parameters are presented in
Table 11.
(2) Loosening Load Calculation
The vertical uniform load of the Liantang Tunnel was calculated using Protodyakonov’s theory and the Code for the Design of Road Tunnels.
A. Protodyakonov’s Theory
The number of pilot tunnels in the maximum and gradient sections was 2. The corresponding correlations are given by Equations (31) and (32):
The number of pilot tunnels in the four-lane section was 3. The corresponding correlations are represented by Equations (33) and (34):
B. Code for the Design of Road Tunnels
The number of pilot tunnels in the maximum and gradient sections was 2. The corresponding correlation is given by Equation (35):
The number of pilot tunnels in the four-lane section was 3, and the corresponding correlation is given by Equation (36):
By substituting the parameter values (given in
Table 11) into these equations, the loosening load was obtained, and the corresponding results are presented in
Table 12.
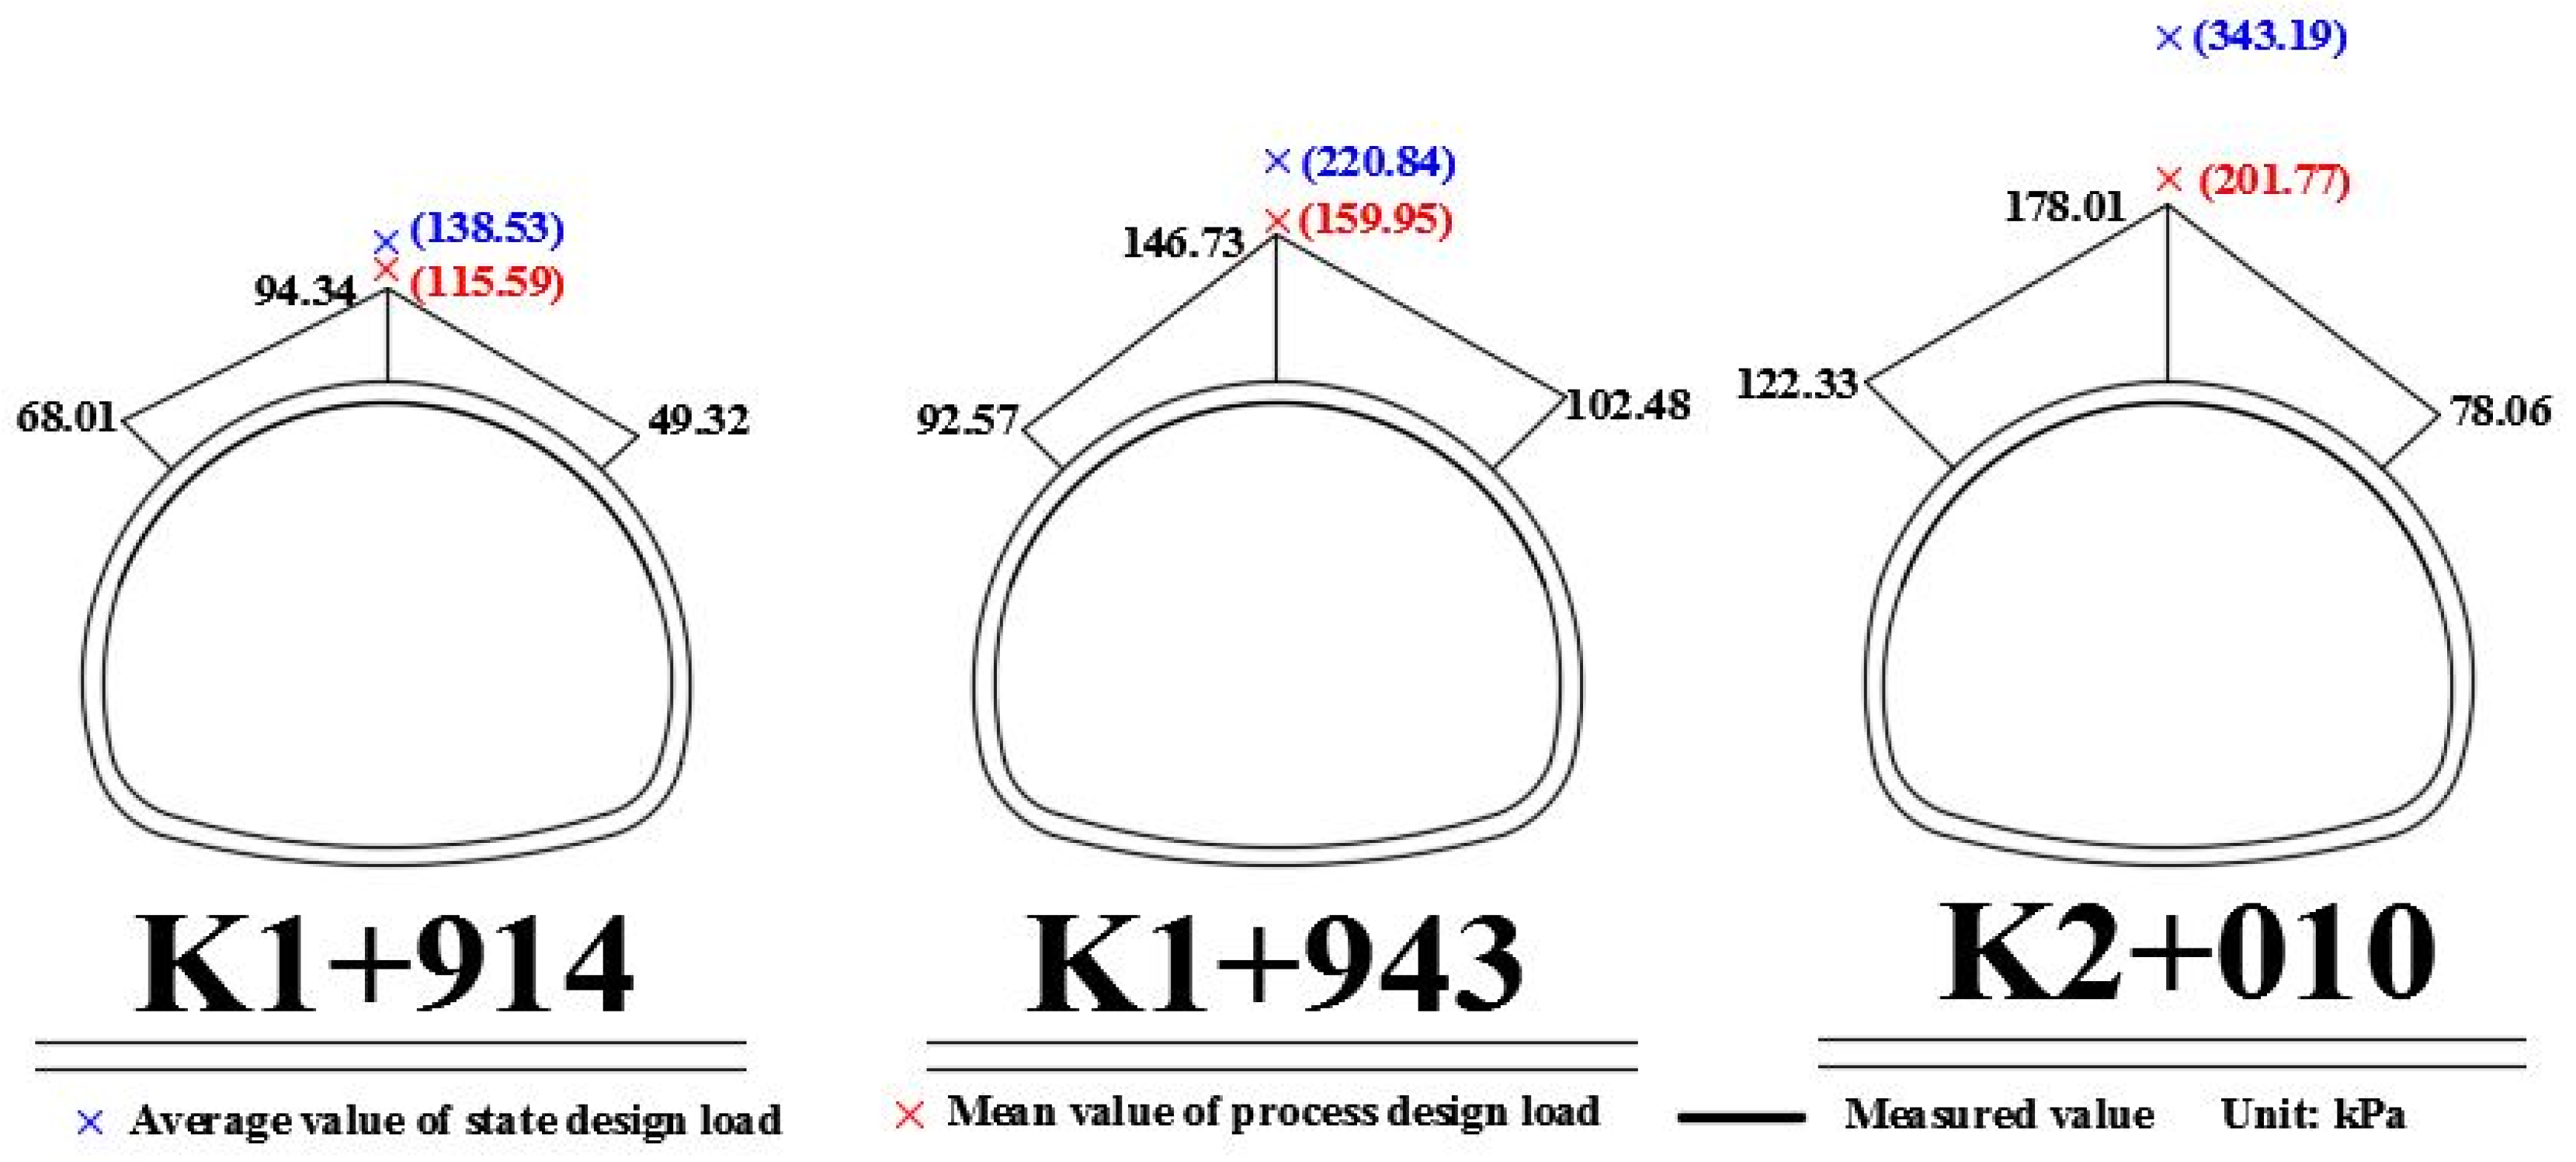
5.6. On-Site Monitoring of Surrounding Rock Pressure of the Liantang Tunnel
The construction of the Liantang Tunnel entered the large-span mileage in March 2018, and the second lining construction was completed in December 2018. During this period, the surrounding rock pressure of the Liantang Tunnel was continuously and effectively monitored.
The monitoring sections were K1 + 914 of the maximum section, K1 + 943 of the gradient section, and K2 + 010 of the four-lane section. The pressure distribution of the surrounding rock pressure of each section was collected to plot the circumferential distribution of the surrounding rock pressure, and the corresponding results are shown in
Figure 6.
The measured surrounding rock pressure of the Liantang Tunnel was compared with the calculated values of the state design load and the process design load, as presented in
Table 13. According to the comparison results, the calculated value of the surrounding rock pressure based on the process design method was closer to the measured value and had a certain safety factor, which proves the rationality and feasibility of the process load calculation method.
5.7. Discussions
(1) In this study, we considered the Liantang Tunnel as a deep-buried tunnel by Protodyakonov’s theory and the Code for the Design of Road Tunnels. These two methods take into account factors such as tunnel span, surrounding rock grade, and the basic mechanical parameters of surrounding rock and have a wide range of applications. However, due to the large span of the Liantang Tunnel, there are some differences between the ratio of tunnel depth to the equivalent circular section radius and Protodyakonov’s theory and the Code for the Design of Road Tunnels in demarcating the depth of the Liantang Tunnel. The ratio of the Liantang Tunnel is less than 10, which indicates that the Liantang Tunnel is a shallow tunnel and the construction process will be affected by the surface ground environment. Different demarcating methods will produce different results, which is indeed worthy of our attention.
(2) According to the results presented in
Figure 6 and
Table 13, compared with the state design method, the calculated value of the surrounding rock pressure obtained based on the process design method is closer to the measured value. This shows that the method of process load calculation has certain reliability and practical significance and can be used as the fundamental basis for the process design method. In the process load calculation method, the influence coefficient
has been recommended and assigned by a think tank consisting of experts and engineering technicians, and it possesses definite subjectivity. Therefore, further improvement is required for the method through a large number of on-site tests and theoretical analyses.
(3) In this paper, in order to simplify the calculation correlation of the process load, it was assumed that the tunnel sections are completely symmetrical and the surface ground is horizontal, which is slightly different from the actual situation. A calculation method of the process load that more accords with the engineering reality will be the focus of follow-up research.


