Article

Rainfall Runoff Analysis and Sustainable Soil Bed Optimization Engineering Process: Application of an Advanced Decision-Making Technique

1
Department of Civil Engineering, Pakistan Institute of Engineering & Technology, Multan 60000, Pakistan
2
Pakistan Engineering Council, Ataturk Avenue (East), G-5/2, Islamabad 44000, Pakistan
3
Department of Environmental Chemistry, Bayreuth Centre for Ecology and Environmental Research, University of Bayreuth, 95440 Bayreuth, Germany
*
Author to whom correspondence should be addressed.
Symmetry 2019, 11(10), 1224; https://doi.org/10.3390/sym11101224
Submission received: 17 August 2019 / Revised: 9 September 2019 / Accepted: 10 September 2019 / Published: 1 October 2019
(This article belongs to the Special Issue Symmetry in Engineering Sciences II)

Abstract

:
Sustainable engineering practices always provide an opportunity for engineers to produce long-term solutions. In the fields of construction and irrigation, soil bed formation symmetry is very important, especially in the case of its behavior with reference to water runoff, whether natural or artificial. In this study, different soil bed formations were tested with the help of advanced hydrology apparatus under severe rainfall conditions. A major focus was to observe the water retention and volume discharge with reference to soil combinations and slope level change. Furthermore, an advanced decision-making technique incorporating artificial neural networks (ANNs) was used to predict and explore the interrelationship behavior of different parameters. It was observed that ST-1 (100% clay) performed well as it tried to retain a large quantity of water (7.28 L/min), making it suitable for irrigation, while ST-2 (100% sand) performed better for structures, as sand tries to quickly drain water, thus retaining less water (0.16 L/min). Change of slope was also another factor; at a 3% slope level along with 100% clay, water resistance was higher as compared to sand. Soil type-3 (ST-3) helped in the retention of water even at a 3% soil bed slope. This study will help engineers and designers in the optimization of soil bed formation for construction and irrigation purposes.

Graphical Abstract

1. Introduction

A rainfall hydrological system is a significant apparatus used for the study of soil erosion, surface runoff, sediment transport, and infiltration, and it also permits generating the rainfall runoff process with replication under precise circumstances [1]. This hydrological apparatus simulates the rainfall generation at recognized intensity and soil depth in a precise way. During the development of structures, soil bed symmetry is very important, as behaviour changes with the abrupt change in formation of soil layers. Similarly, in the field of irrigation, soil bed performs with the transport of water, that effects the supply of proper water quantity to certain crops. Symmetry in soil combination helps in proper supply of water without wastage or absorption. In developing countries, where agriculture dominates the economy, an additional burden is exerted on land and water resources with the increase in population, leading to water utilization problems. Thus, under such multifaceted water resource conditions, these kinds of field experiments are very beneficial. Using a rainfall simulator to determine rainfall runoff backup, the main goal is to match the runoff produced using the rainfall apparatus with natural storms [2]. Around the world, researchers focused on points regarding comparative results of surface fraction and subsurface runoff. There are two difficulties when linking runoff facilities from natural and virtual rainstorms; the first is scaling the results up from a minor simulator to a watershed/basin, and the second is regenerating the kinetic energy of a specific storm with the hydrologic apparatus. Duplicating the natural intensity of rainfall and rainfall duration with a simulator represents the finest method to regenerate the kinetic energy of natural storms. Thus, for this purpose, there is a need for previous hydrological data to select the necessary parameters of rainfall duration and intensity. Our main focus here is to discuss rainfall runoff with reference to soil bed variation, which plays an essential role in daily life and engineering design parameters. Different kinds of models, i.e., black box, physical-based, and ANNs (artificial neural networks), were used to model difficult hydrological operations, including rainfall runoff [3,4] and the precipitation–runoff relationship [5]. However, due to difficulties and spatiotemporal variation, some of the models can accurately determine these operations. In the last few years, a very popular model used to solve these complex nonlinear operations was the artificial neural networks (ANN). ANN models have the ability to explore different relationships such as the rainfall runoff process [2], precipitation totals, average runoff and temperature relationships [5], river flow and rainfall [6], humidity, wind, vorticity, air temperature, and precipitable water [7], streamflow forecasting [8], discharge and rainfall [9], catchment area and precipitation [10], peak discharge and rainfall pattern [11], runoff and rainfall [12], precipitation, air temperature, snowmelt equivalent, stream discharge, soil characteristics, and groundwater characteristics [13], and flow, dry and wet season rainfall, and change of basin [14]. ANNs have the ability to develop the relationship between inputs and outputs without knowing a priori knowledge under study. In hydrology, the major research challenge is to produce models which have the ability to simulate catchments; thus, these models are used for future forecasting of river discharge, which is compulsory for secure hydraulic and hydrological engineering design and water management.
The utilization of ANNs provided the addition of new applications to model these systems. They were implemented as a prosperous method to solve different problems related to water resource engineering. Climate change, the evapotranspiration process, river flow forecasting, reservoir inflow modeling, groundwater quality prediction, and simulation of rainfall runoff events are some applications involving water resources where ANNs were utilized [14], including pattern-learning, daily, weekly, and monthly sediment yield [15], forecasting daily stream flows [16], and the rainfall and water level of rivers [17]. Complex watershed rainfall processes which are non-linear and dynamic in nature [6,8] and unit hydrograph derivations can also be solved using ANN models. Flood forecasting for two floods disposed to catchments was studied using hourly hydrometric statistics in England [18]. For daily flow modeling during monsoons in Pakistan and different countries, daily rainfall data were used as input in ANNs [9]. Although there are other techniques similar to ANNs, such as statistics, artificial intelligence, machine learning, data mining, etc. [10], ANN models were applied for rainfall forecasting [7] and provided better results as compared to multiple linear regression modeling (MLR) [12]. Furthermore, neuro-fuzzy and regression models were also used, and their comparison for the forecast of outflow of an on-farm reservoir was studied [19]. Artificial neural network (ANN) and fuzzy logic (FL) models were applied for predicting event-based rainfall runoff [20]. The finite element method (FEM) and an artificial neural network (ANN) model were developed to simulate water flow through dams [21]. The ANN technique was applied to model watershed runoff in three basins with different climatic and physiographic characteristics [22]. During comparative analysis, ANNs were found to be superior for water-related research. For river watersheds, monthly streamflow was also forecasted using ANNs [22]. In Maryland, an ANN model was developed to estimate daily runoff for daily snowmelt, temperature, and precipitation for a watershed [13]. One of the main research aims is to develop a model showing the accuracy of the results. Such models can measure the river discharge variation with time, which is needed for hydrologic and hydraulic engineering design and water resource management. The main focus of this study was to perform laboratory trials for the development of rainfall runoff data with the advanced hydrologic system. Then, for the confirmation of predicted data, modeling was done for the evaluation of observed runoff data using an ANN.
In this study, the change in soil bed symmetry with respect to changes in slope is to be tested under severe runoff conditions, to analyze the behaviour of different soil combinations and their symmetry under heavy rainfall. Furthermore, an ANN model was used following training and testing of the networks using data collected with different characteristics of soil, slope, and rainfall intensity. The predictive capability of the network performance and the calibration of data were examined using various training and validation datasets. The focus of the study was the selection and performance of soil beds under heavy rainfall for construction and irrigation purposes.

2. Materials and Methods

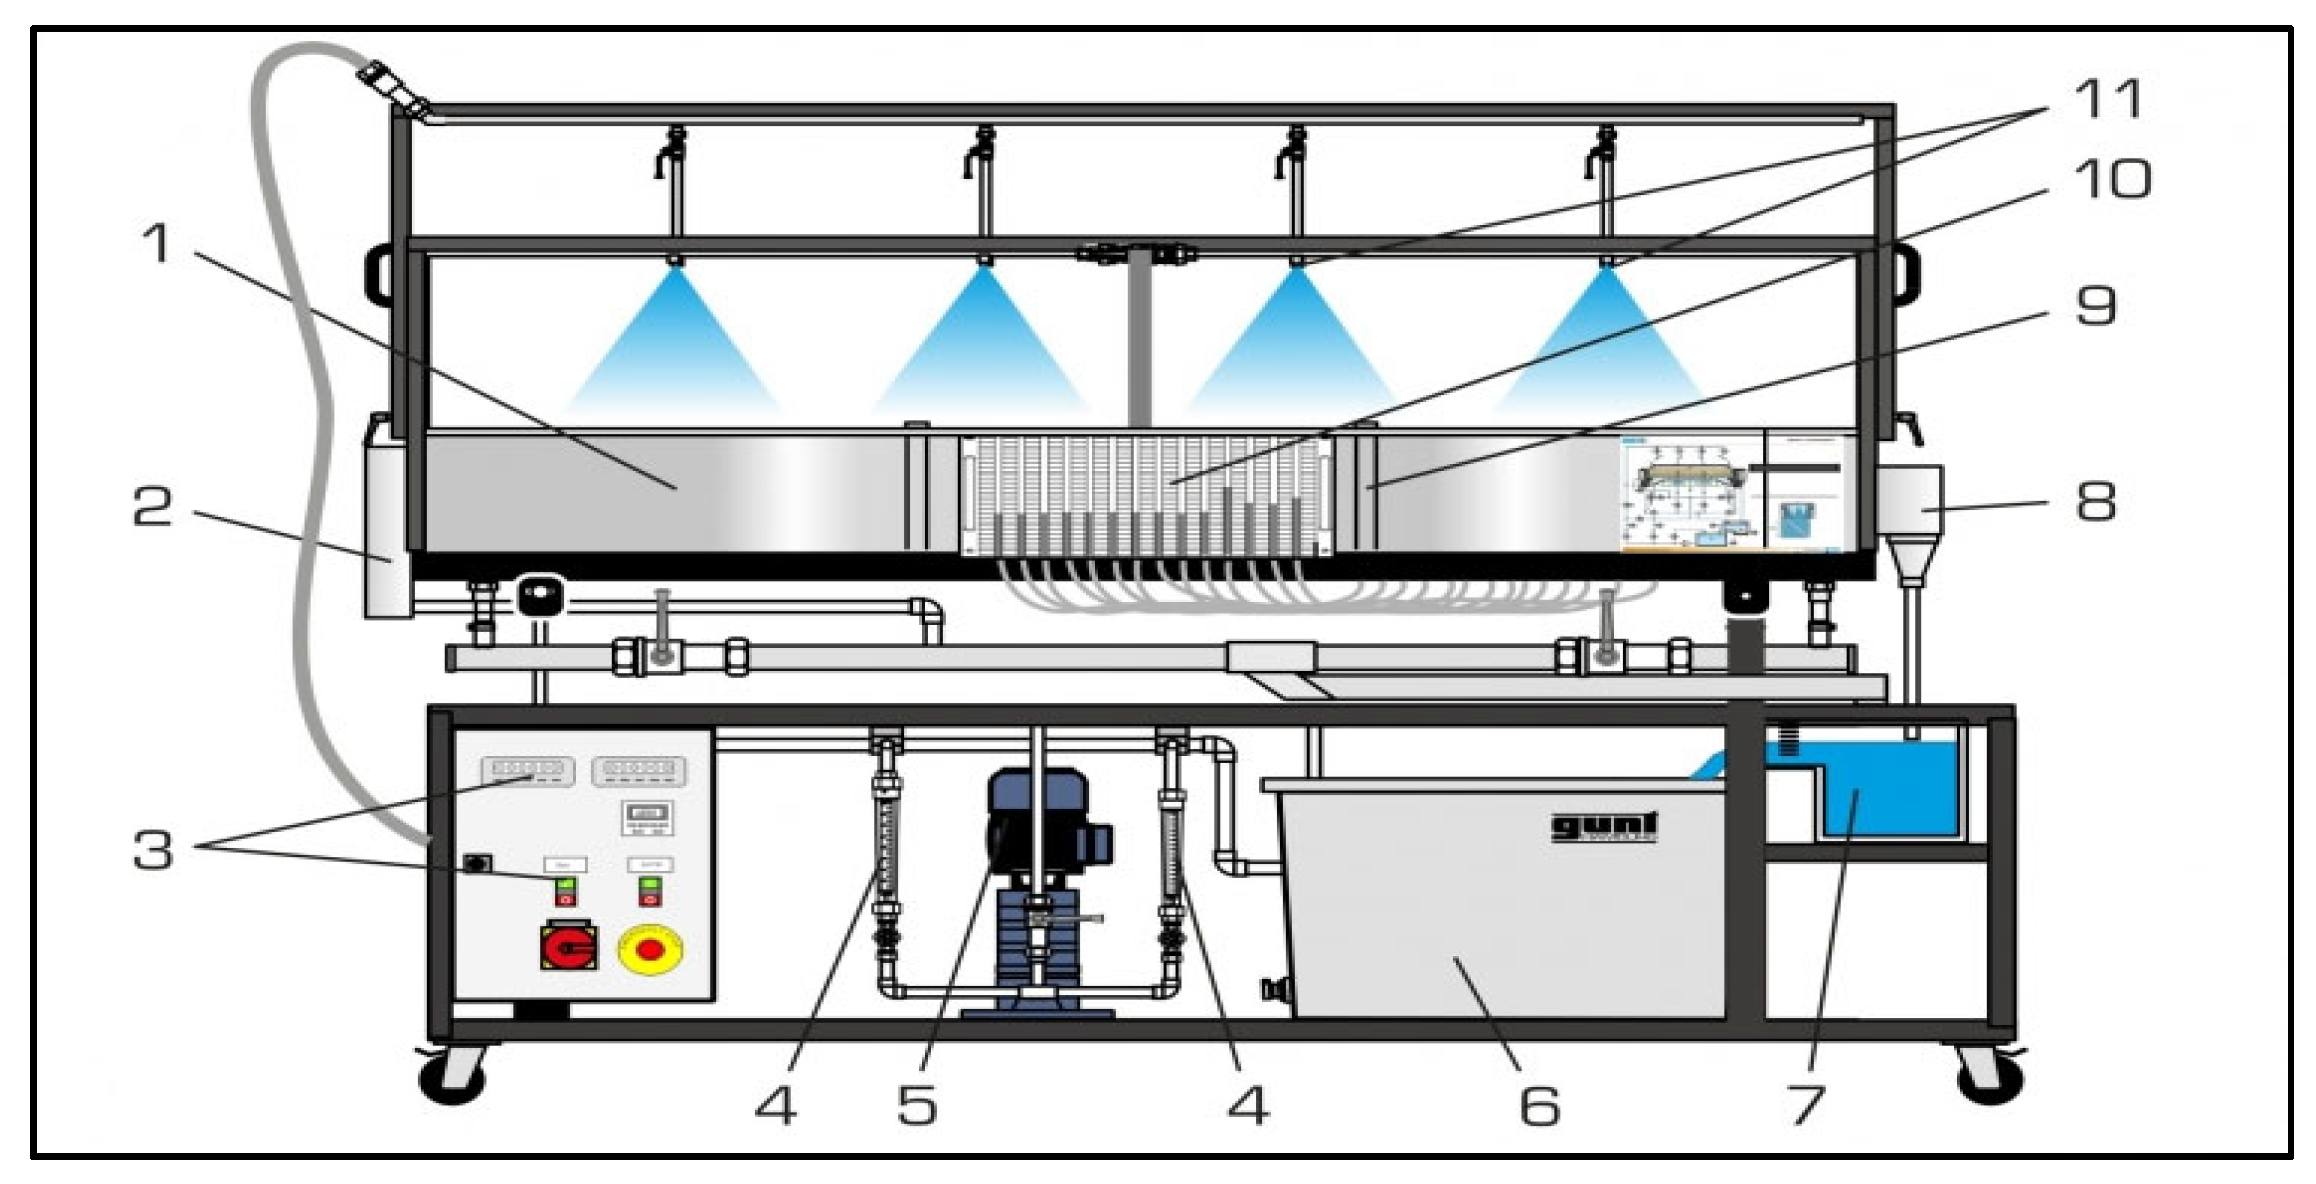
2.1. Advanced Hydrology Apparatus

Runoff analysis was performed on the advanced hydrology apparatus shown in Figure 1. This apparatus is very useful for hydraulic studies, such as the abstraction of wells, rainfall runoff, and the development of river characteristics. This apparatus gives realistic approachable results in the laboratory with no special requirements. This system is well designed for studying the hydrological cycle in terms of rainfall with respect to geography, as well as the runoff process for wells.

2.2. Flume

A flat veneer of a steady rectangular sampler was used with a width of 1 m and a length of 2 m. It also contained an adjustable slope ranging from 0% to 5%. The flume was filled with different soils (sand, clay, etc.) with different ratios as shown in Figure 2. The runoff calculation device was attached along with a timer device to perform time-variant analysis.

2.3. Rainfall Intensity Pattern

Rainfall was tested with different intensities on different slopes. Heavy rainfall profiles were used to test the soil behavior under the worst/severe conditions of rainfall, selecting soil combinations for the construction of structures like buildings and barrages. The patterns are given below in Table 1.

2.4. Slope Variation

The tests were performed on different slopes of 0%, 1%, 2%, and 3% for observing the varied behavior of rainfall on the soils. Slopes were used as shown in Table 1, as it is rare to encounter level ground in real situations. Sometimes, the ground has to be leveled before construction, and it is not possible to change the slope.

2.5. Soil Properties and Bed Formation Variation

In this process, different soils were used with various contents as shown in Table 2. Two mediums are usually used or found naturally in the ground, i.e., clay and sand, whereby sand acts as a stabilizer for natural weak clay/soils [24,25]. Sometimes a mix of these can be used for the construction of structures. Combinations of soil types along with the properties selected for analysis are shown in Table 2. Soil properties included maximum dry density (MDD), optimum moisture content (OMC), soil pattern based on the American Association of State Highway and Transportation Officials (AASHTO), soil category based on the Unified Soil Classification System (USCS), and Atterberg’s limits, including plastic limit (PL), liquid limit (LL), and plasticity Index (PI).

2.6. Flood Timing Pattern

Flooding happens in floodplains where rainfall over occurs over a few days or more, or where severe rainfall occurs for a short time period of time, in addition to other factors such as river overflow. Here, flood prediction and modeling referred to the progression of rainfall using a flood hydrograph and the translation of that hydrograph into a hydrologic system. The relationship between rainfall and runoff is a suitable approach for flood forecasting. For the flood forecasting, we obtained the hydrographic results shown in Figure 3 for our data with different soil variations and slope changes (0%, 1%, 2%, and 3%).

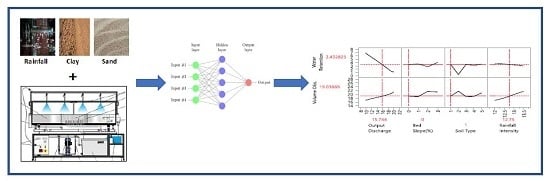
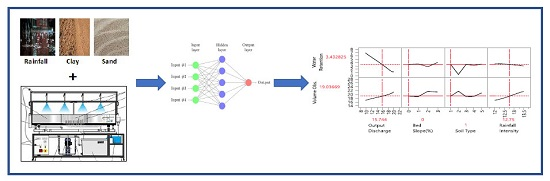
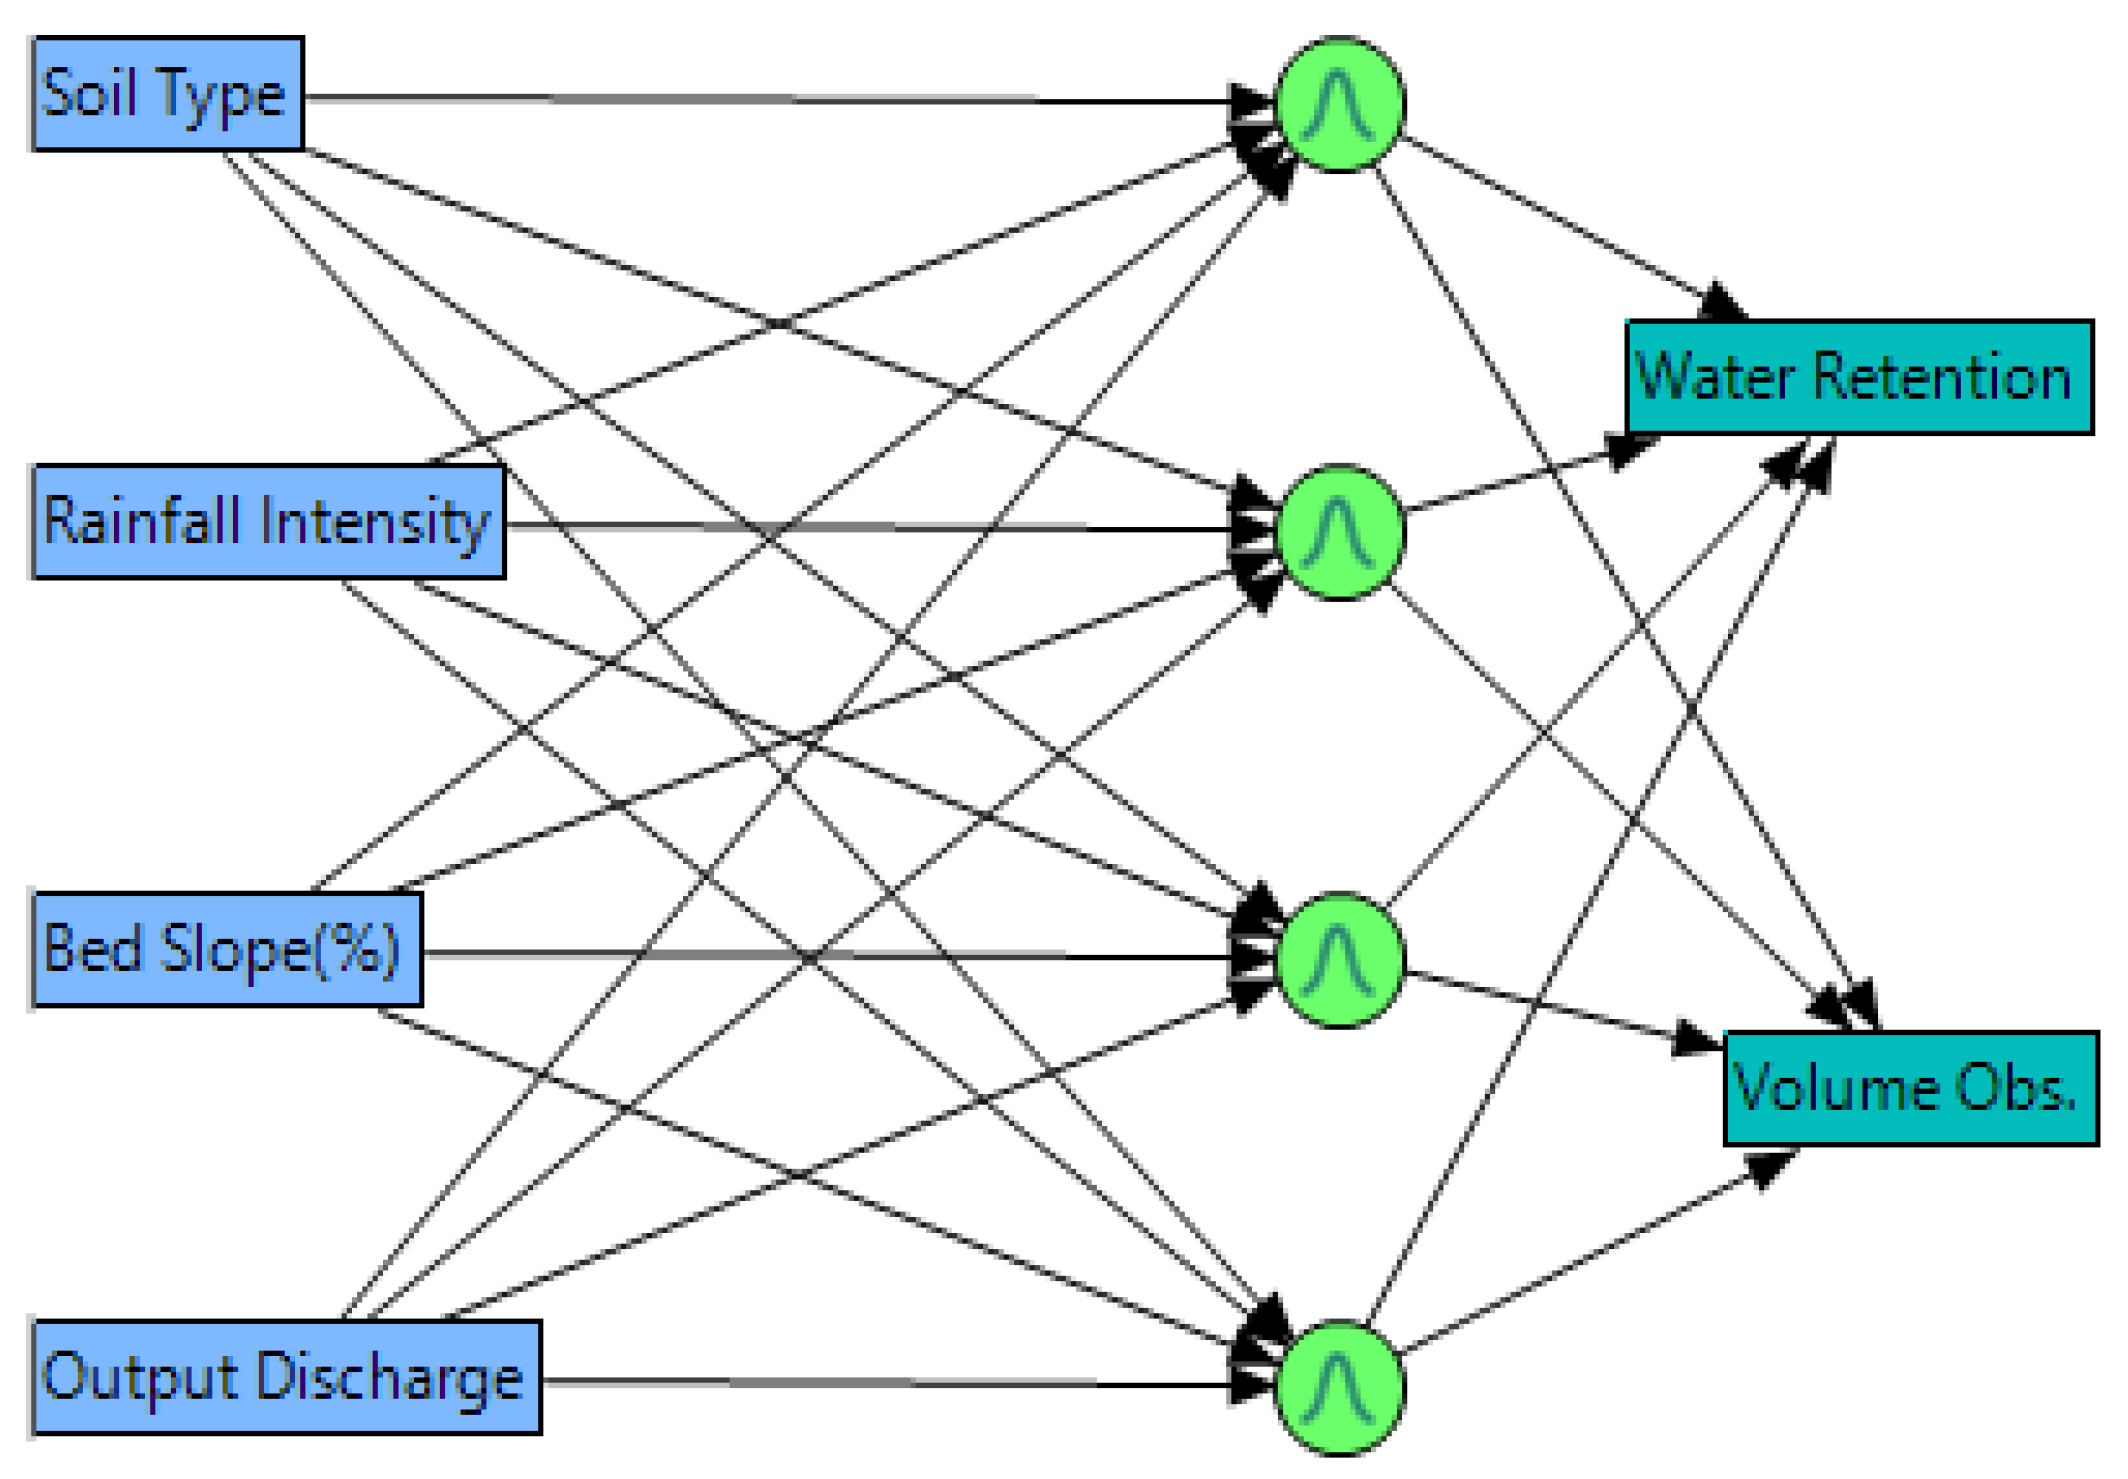
2.7. Artificial Neural Network (ANN)

In the research field, ANN is a statistical artificial intelligence technique used to correlate numerous inputs and precise outputs for forecasting; this technique is appropriate for the analysis of runoff. An ANN comprises the input layer, the hidden layer, and the output layer, as displayed in Figure 4. For complex pattern problems, the number of hidden layers can be increased or decreased. Basically, ANNs are developed based on a minimum set of actual input and output statistics, resulting in a set of coefficients (signified as weights w k and w k j ) [2]. This process initially examines the inputs and outputs for the best nonlinear connection. ANNs contain input ( x j ) linear functions worked upon by a transfer function (a linear regression), represented in Equation (1), whereby each input contributes to the hidden unit. Using Equations (1) and (2), we can mathematically describe the system [5,7,11,20].
u k = [ j = 1 m w k j x j + b k j ] ,
y i = [ k = 1 i w k u k + b k ] ,
where x1, x2, …, xm denote the input values, is a hyperbolic tangent type transfer function, wk1, wk2, …, wkm and w1, w2, …, wk are the coefficients of the network, hidden nodes are denoted by u1, u2, …, uk, bkj and bk are constants, similar to linear regression constants, and yi is the network output signal. The final output of the system is determined based on the linear function within the hidden nodes as a function of the constant shown in Equation (2) [2,14]. The data utilized for the development of the ANN model are described in Table 3. The formation of the ANN is shown in Figure 4, developed using various input variables (soil type, slope, rainfall intensity, and output discharge) and outputs (water retention and volume observed).
During the calculation of outputs (water retention and volume observed), the weights of each node were calculated using the complex mechanism of the ANN, the parametric estimates of which are given in Table 4.

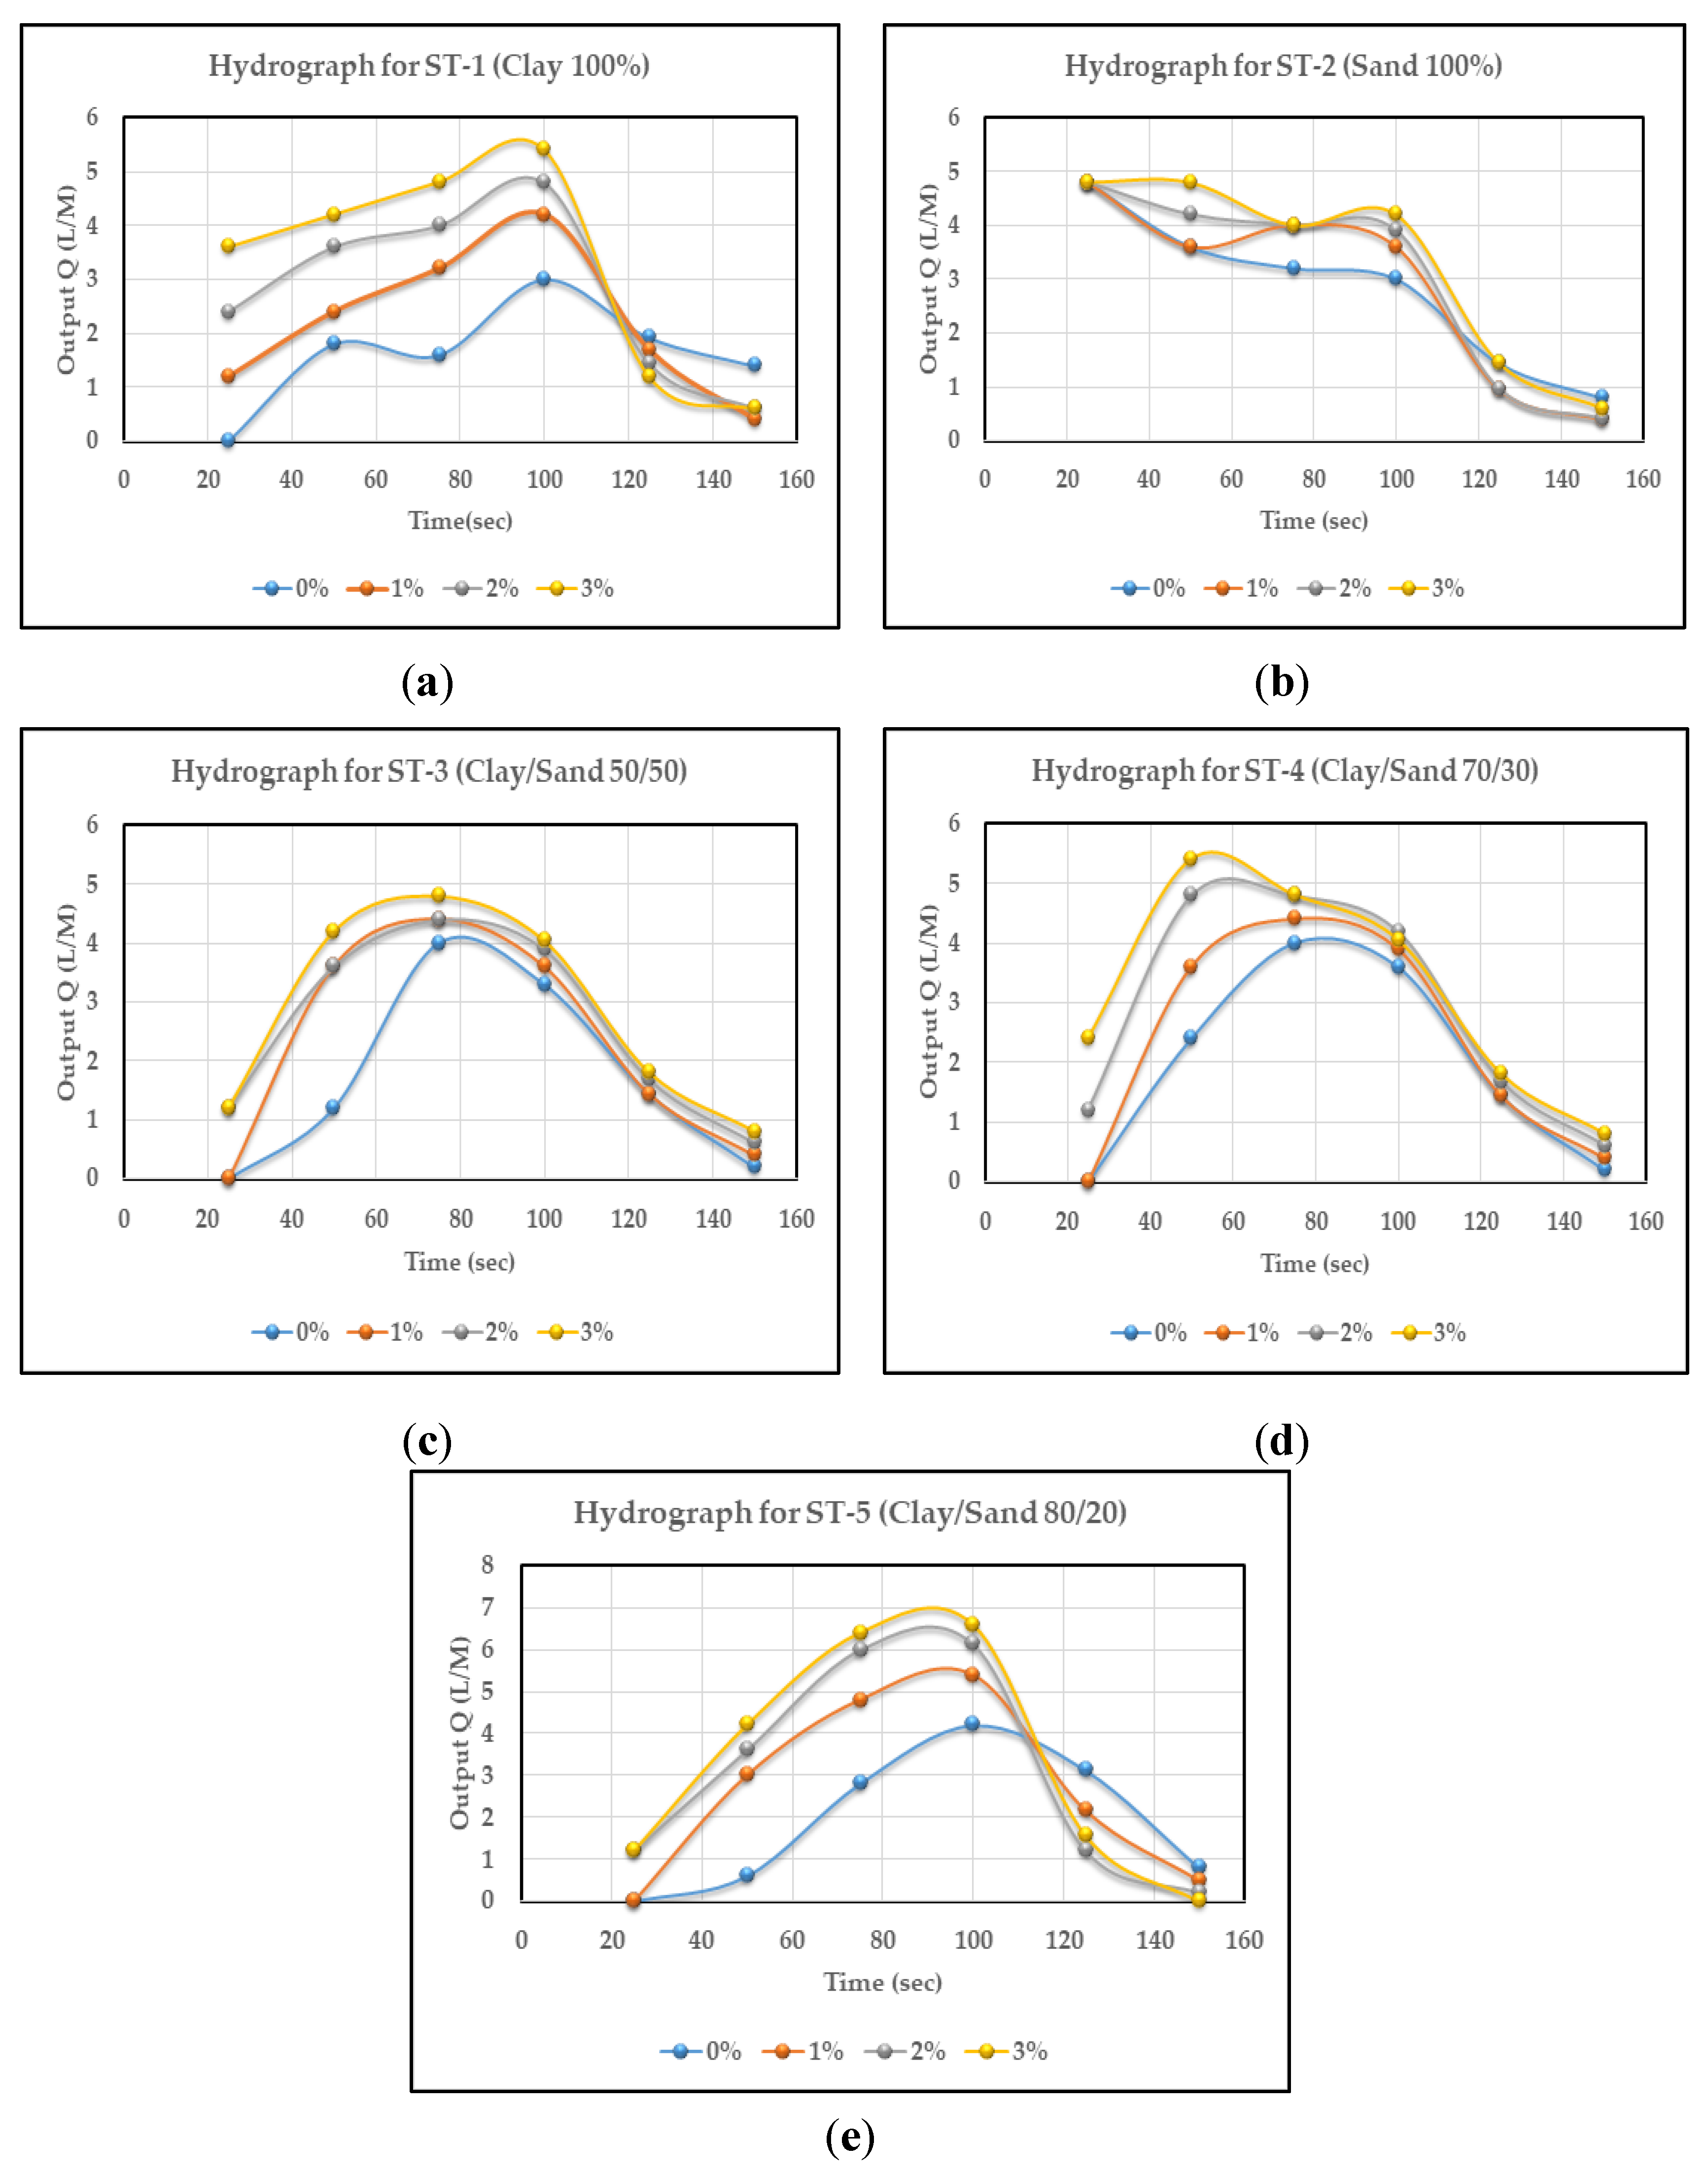
3. Results and Discussion

3.1. Application of Artificial Neural Network (ANN)

The ANN model for the water retention of the soils and the runoff discharge with reference to changes in soil and bed slope evaluation was developed using JMP Pro. environment, version 13. We collected 20 data points for runoff discharge using the advanced hydrology apparatus for heavy rainfall intensity at various slopes and soil types. These data were considered for model development using various input variables (soil type, slope, rainfall intensity, and output discharge), and the outputs were water retention and volume observed. The database used for ANN model development is specified in Table 4. For the progress of the ANN model, the observed data were used as follows: 80% for training and 20% for validation. The behavior of the model during training, testing, and validating is represented in Figure 3, which shows its ability to predict the required output. With regard to the correlation coefficient value (R), a value close to 1 was achieved, showing that the model should perform well. The training process of the ANN required minimum overall error for the two outputs of the testing dataset. The validation sets were also used to confirm that the model performed suitably in terms of predicting runoff.

3.2. Model Parameters

The ANN model was developed, and the results were analyzed according to the available variables so as to test its prediction power and accuracy. The JMP Pro tool was used to analyze the developed model. The two parameters under focus were the root-mean-squared error (RMSE), which is the difference between the actual and the predicted value, and the difference in the coefficient of determination (R2) [26,27], as given below in Equations (3) and (4), respectively.
R M S E = ( 1 N n = 1 N ( a c t u a l p r e d i c t e d ) 2 ) ,
R 2 = 1 S S E S S y ,
where SSE is the sum of squared errors of prediction, and S S y is the total variation. Usually, the performance of a model is compared using the coefficient of determination (R2), where a better fit is represented by a value closer to 1, and a poor fit has a value which approaches 0 [26,27]. ANNs use a back-propagation neural system which involves a complete learning rate and momentum, including a set of nodes, hidden layers, and an order of hidden layers [26], as well as a practical estimation of parameters such as the learning rate [26]. K-fold cross-validation (considering 80% for training and 20% for validation) was utilized to predict and validate the prediction model. The performance coefficient, root-mean-square error (RMSE), and the coefficient of determination (R2) were utilized to identify the predictive power of the developed model [26]. Table 5 shows the estimated parameters and the prediction of the water retention and volume observed. Data were divided according to five segments using the K-fold mechanism; thus, 16 samples were used for training and four samples were used for validation. An R2 value closer to 1 denotes the highest level of prediction accuracy of the developed model, as seen for water retention (0.99 for training and 0.98 for validation) and volume observed (0.97 for training and 0.99 for validation). The RMSE should be as low a value as possible, as seen for water retention (0.08 for training and 0.26 for validation) and volume observed (0.53 for training and 0.10 for validation).

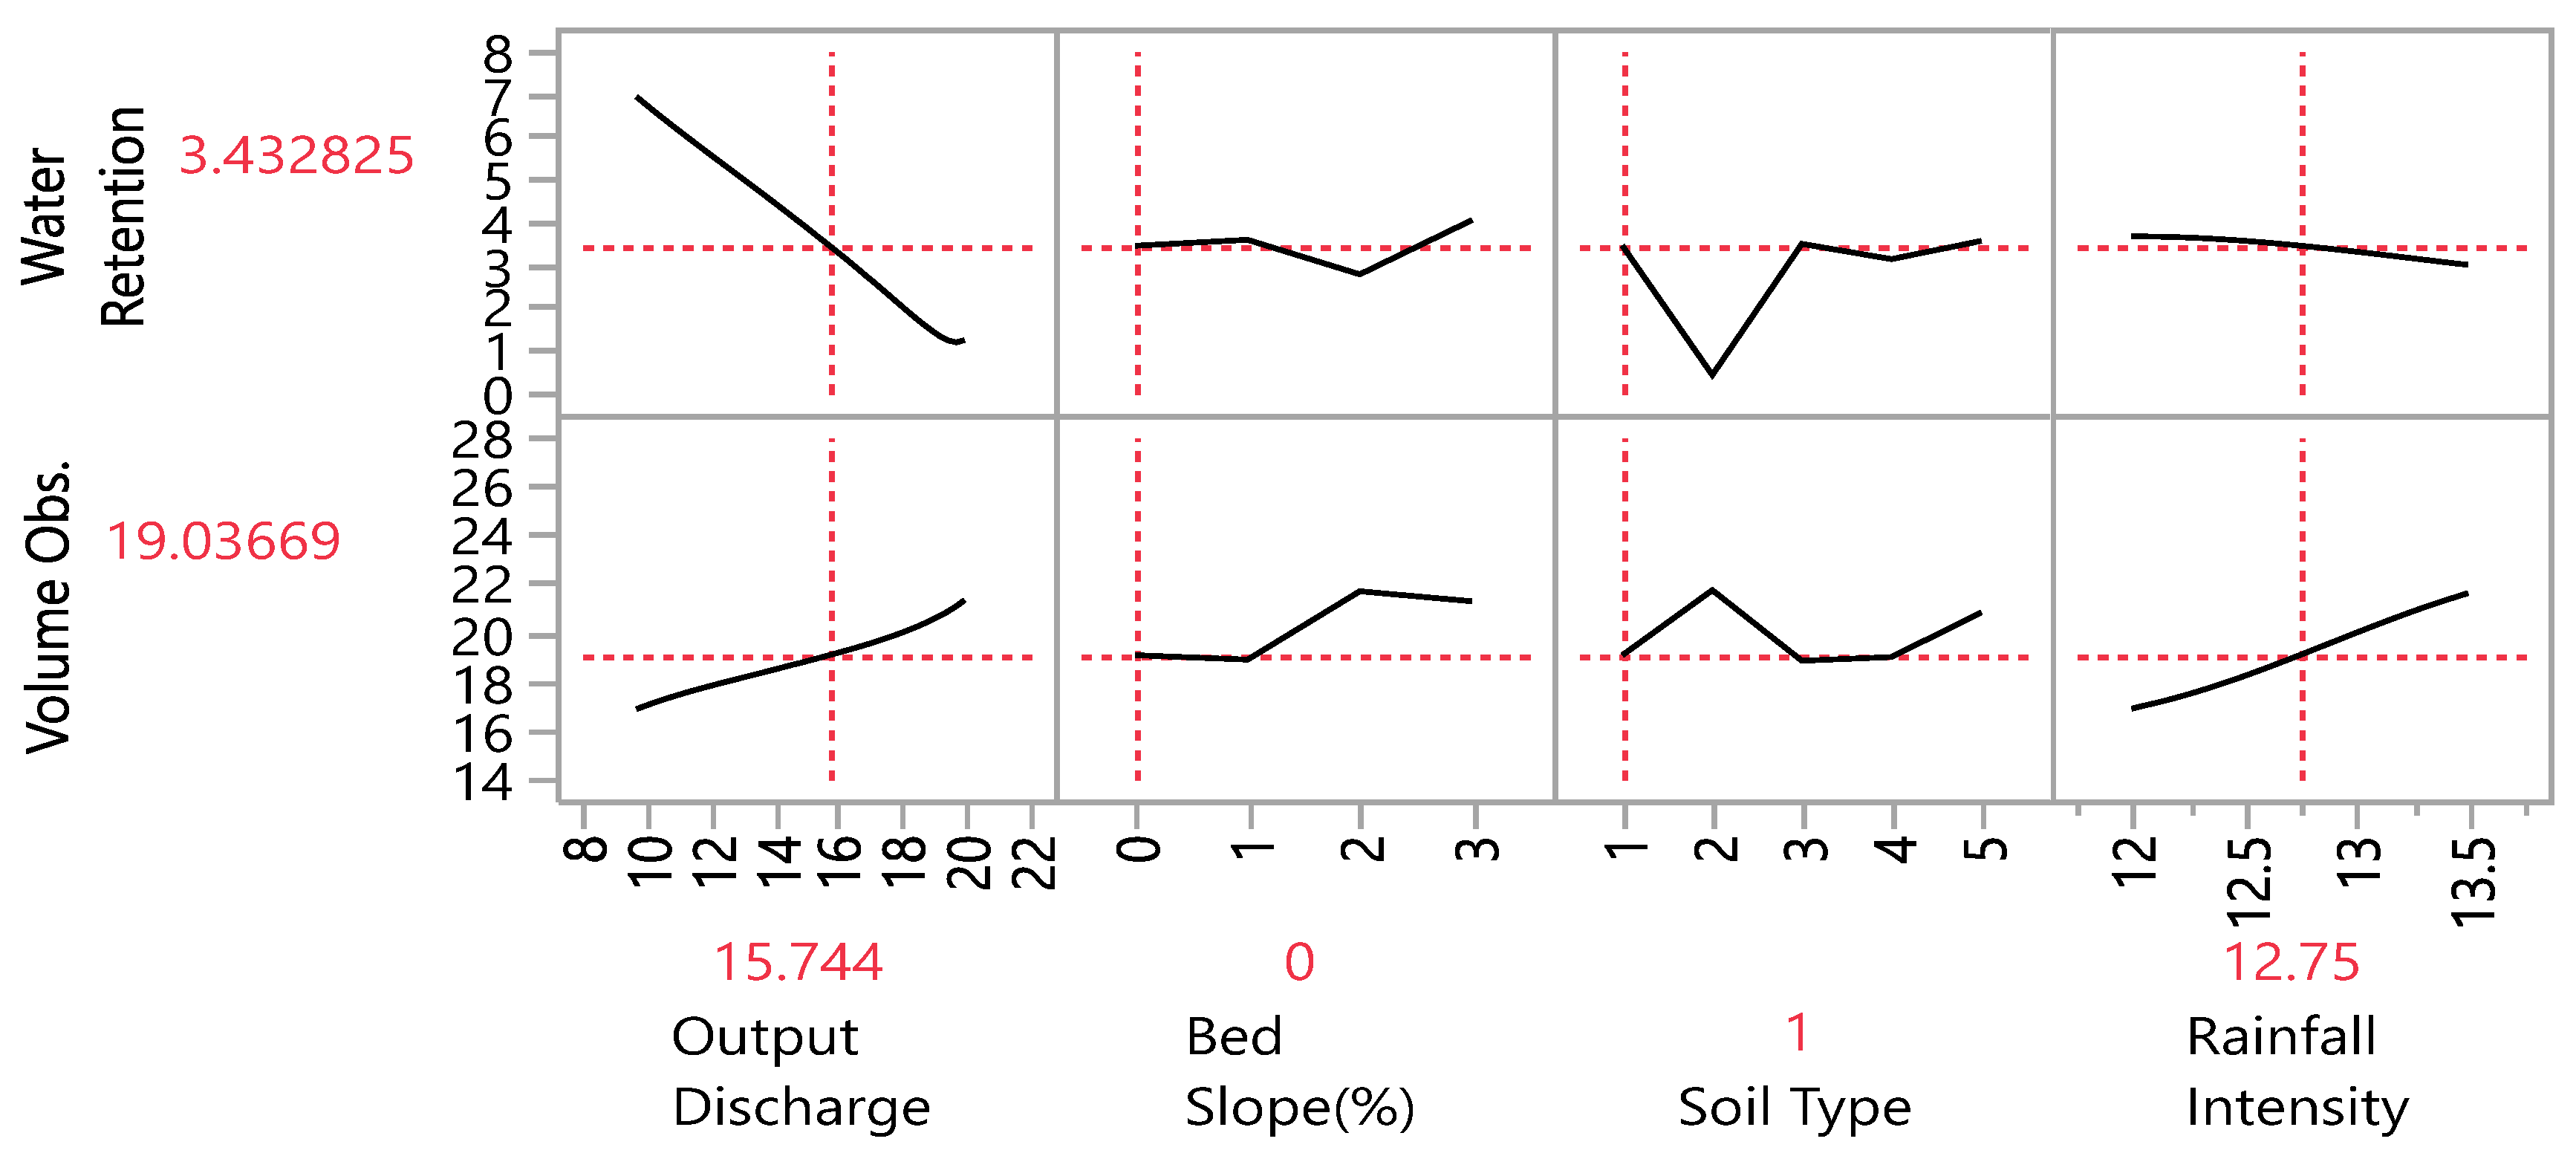
3.3. Prediction Profiler

After producing the prediction pattern for the ANN model, the prediction profile produced during the analysis was used to study the impact of output discharge, slope, soil type, and rainfall intensity. Figure 5 shows the impact of these variables on the water retention and volume observed.
The variables describing volume observed and water retention are denoted as Y1 and Y2, whereas variables X1, X2, X3, and X4 represent output discharge, bed slope, soil type, and rainfall intensity. Through the comparison of X and Y variables, we determined that output discharge increases with increasing observed volume and decreasing water retention. When the bed slope increases, observed volume also increases due to less water retained, and water starts flowing faster as compared to a parallel surface. Observed volume also increases with an increase in rainfall intensity when bed changes parallel to the slope, while water retention decreases.

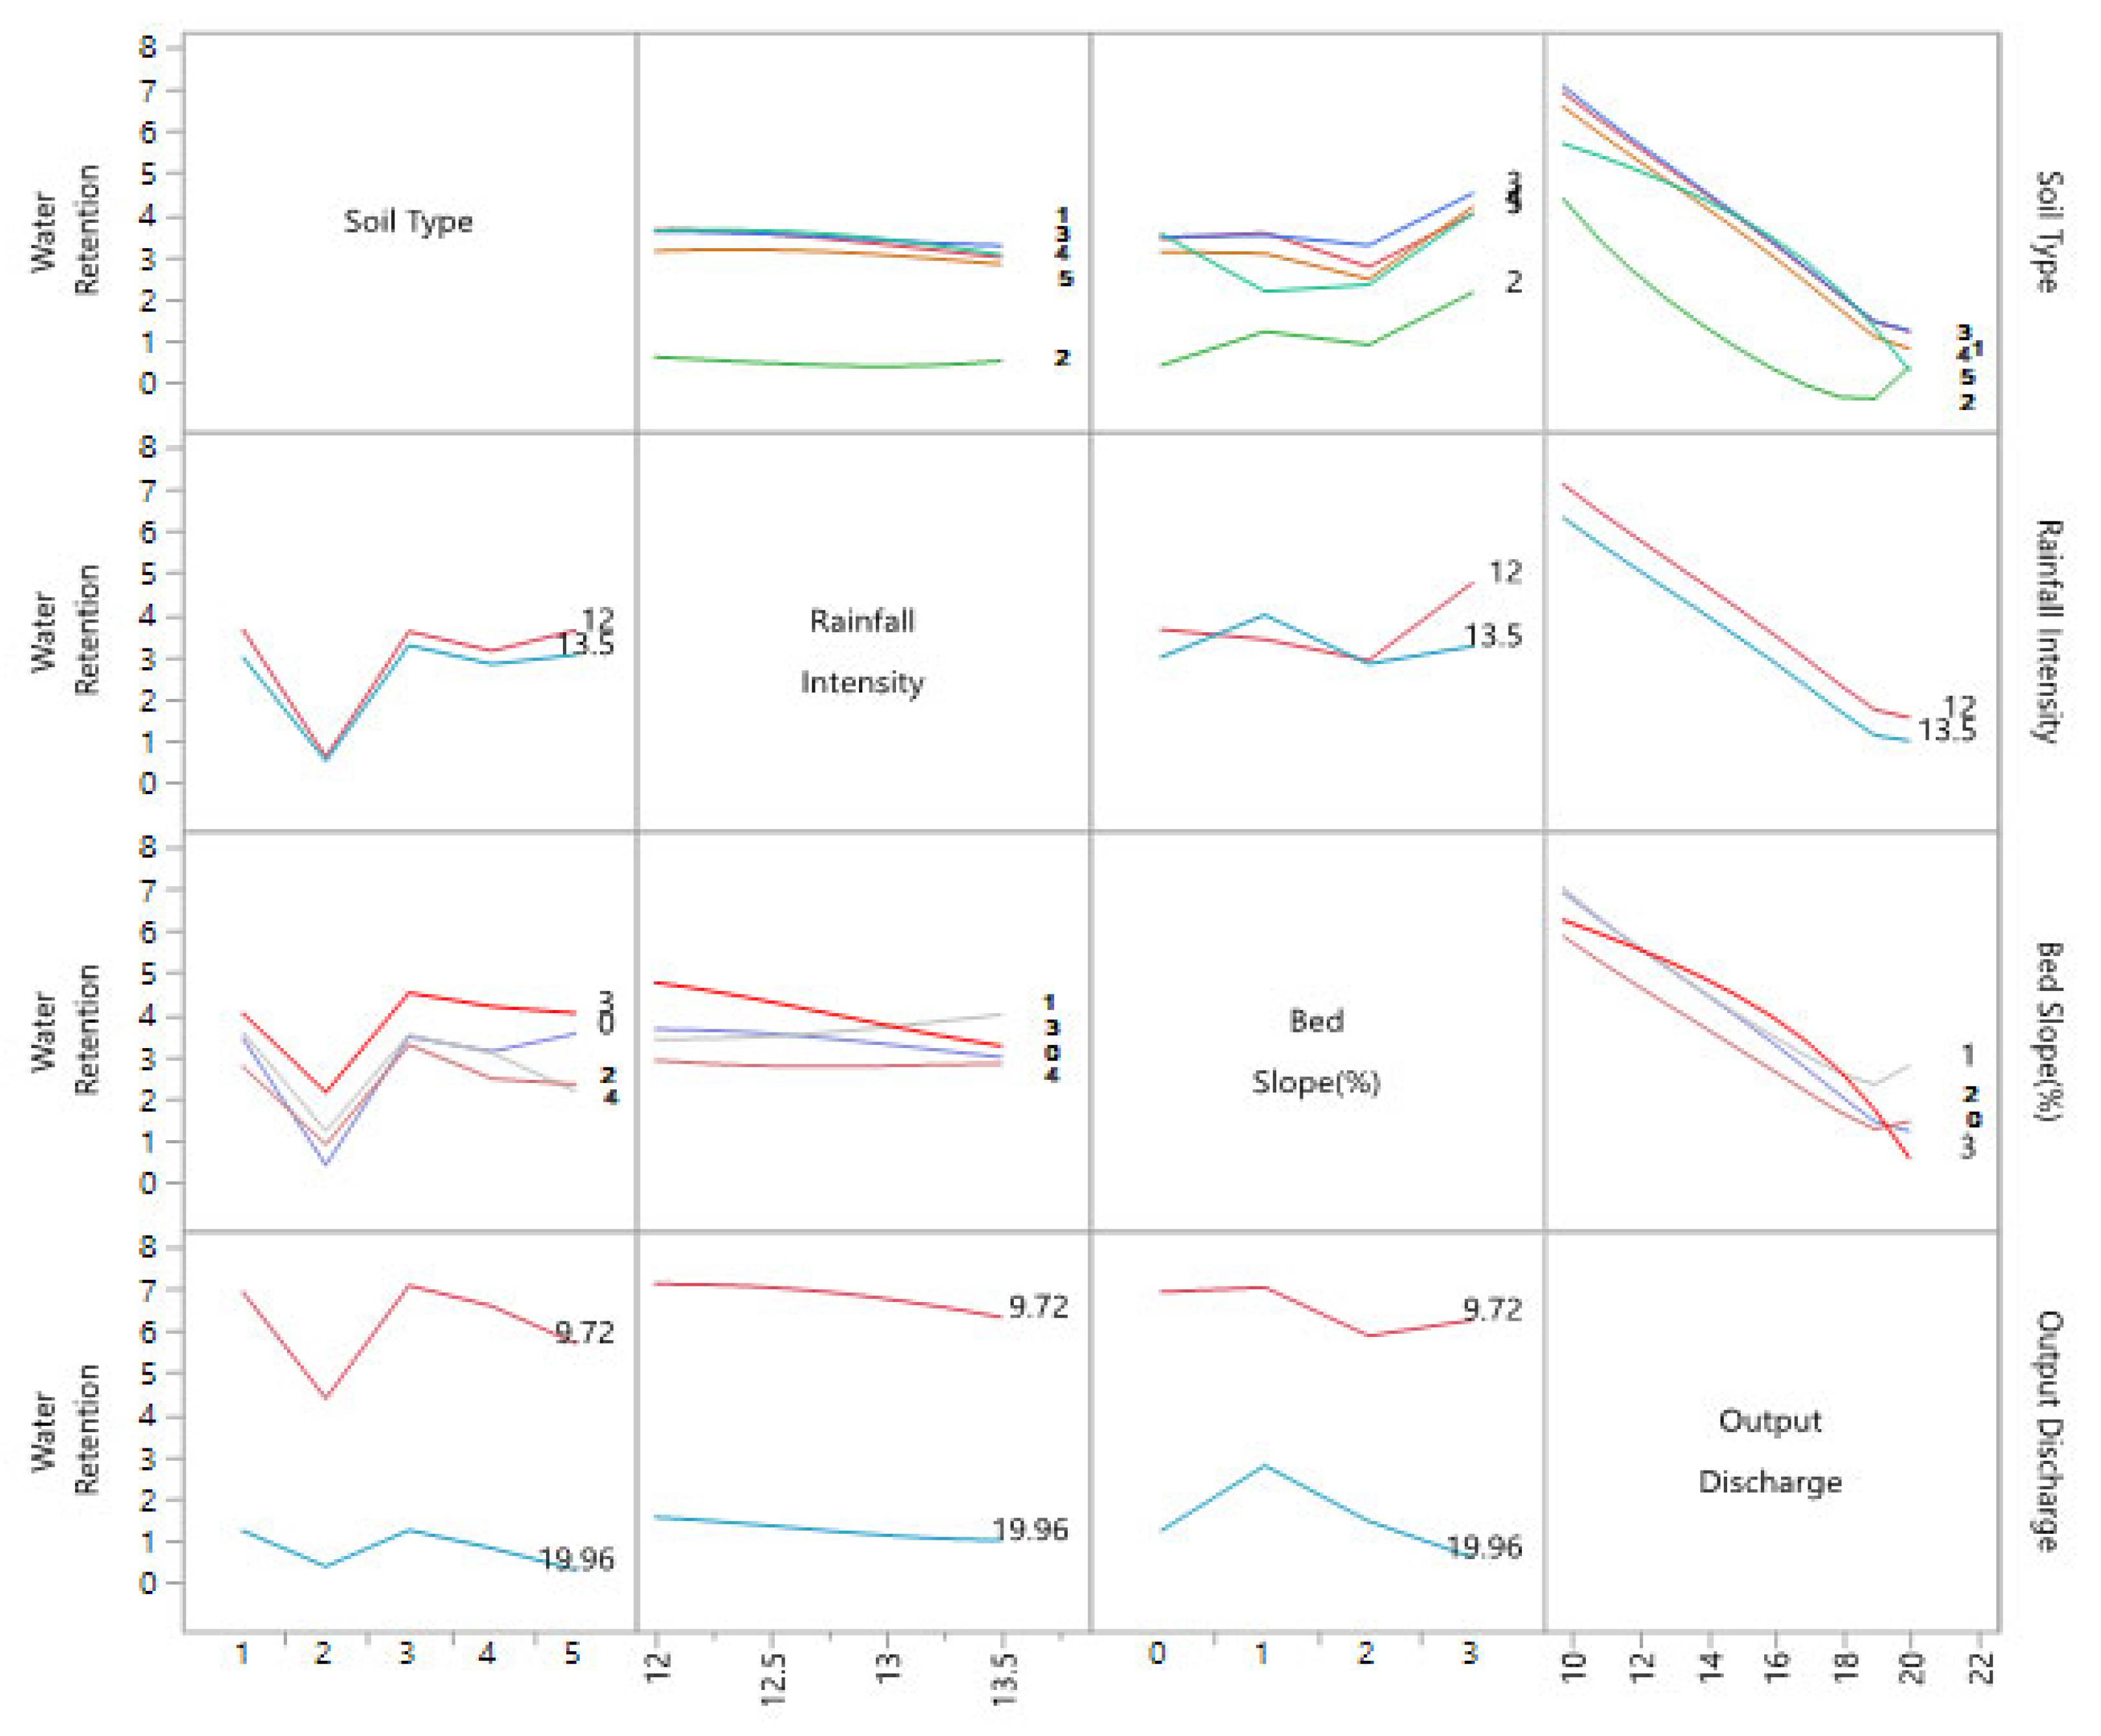
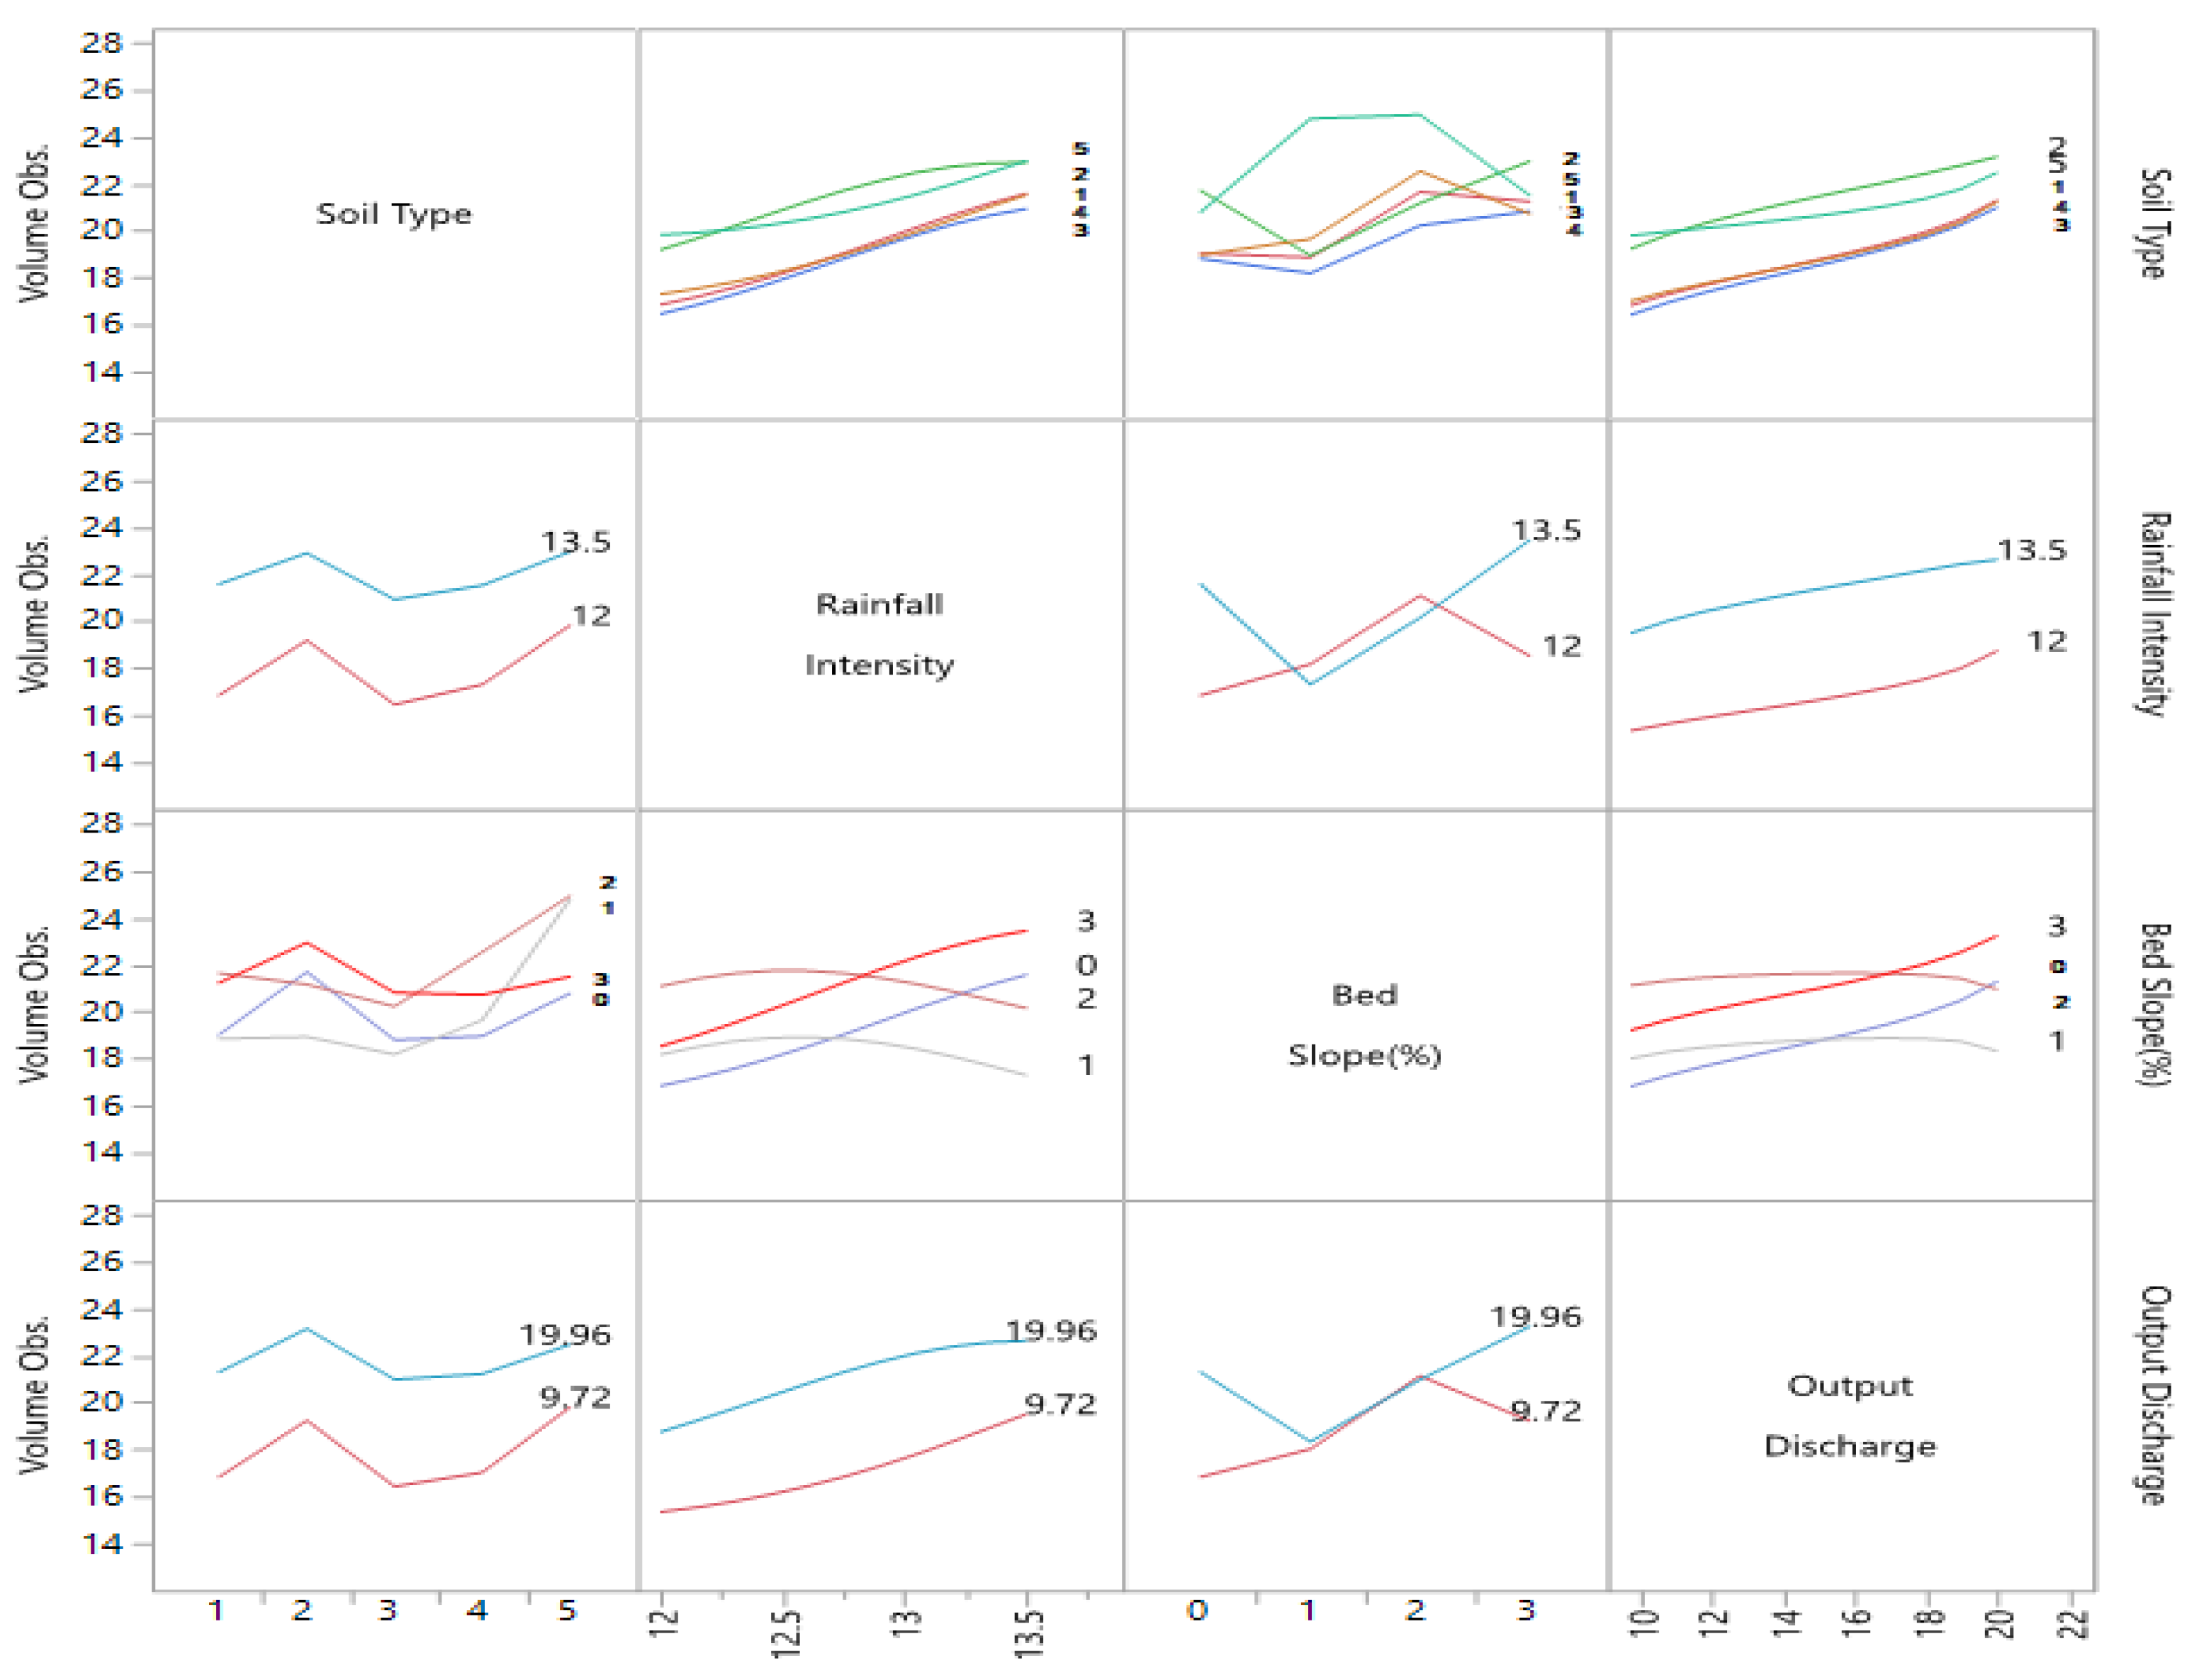
3.4. Interaction Profiles

While the prediction profile allows determining the individual performance of variables, the interaction profile provides an overview to analyze the performance of certain variable with reference to other factors. In Figure 6 and Figure 7, the performances of the minimum and maximum ranges of variables with reference to target variables were studied. Soil type contributes to a change in water retention pattern, especially after the addition of clay, reaching a certain optimum level. Clay fully retains water while sand tries to drain it as fast as possible.
For soil 1, minimum and maximum discharge with respect to water retention firstly decreased, then increased, then slightly decreased again. For soil 2, there was a continuous decrease. For soil 3, there was an initial increase, followed by a decrease; however, the minimum output discharge increased slightly once more. Upon increasing the bed slope, water retention continuously decreased, except for soil 1, where water retention firstly decreased, then increased, and then slightly decreased again. Water retention was maximum on parallel surfaces for every soil with an increase in rainfall intensity; however, when the slope increased, the water retention decreased with increased rainfall intensity. For soil 1, water retention continuously decreased slightly. For soil 2, it fluctuated slightly, and, for soil 3, water retention decreased continuously. For soil 1, the minimum and maximum discharge with respect to volume observed firstly increased, then decreased, and then slightly increased again. For soil 2, it continuously increased slightly. For soil 3, the maximum discharge firstly decreased and then increased, but the minimum output discharge started increasing followed by a slight decrease. Upon increasing the bed slope, the volume observed continuously increased. Volume observed was minimum on parallel surfaces due to water retention for every soil with an increase in rainfall intensity; however, when the slope increased, then the water retention decreased, and the volume observed increased with an increase in rainfall intensity. For soils 1 and 3, the volume observed continuously increased slightly, while, for soil 2, it fluctuated slightly.

3.5. Variable Importance

Here, we identified the important variables affecting the volume observed and water retention with respect to output discharge, bed slope, soil type, and rainfall intensity, as shown in Table 6. Through the comparison of X and Y variables, we found that soil type and bed slope were very important factors in terms of output discharge.

4. Conclusions

This study focused on the optimization of soil bed formation symmetry with reference to stormy runoff analysis. It involved changes in soil combination and slope level under heavy runoff conditions. During the performance of laboratory experiments, testing was performed to analyze rainfall runoff behavior for different soils, due to their different properties. Experimental conditions considered various rainfall intensities to examine the soil behavior. Changes in soil combinations (ST 1 (100% clay), ST 2 (100% sand), ST 3 (50% clay and 50% sand), ST 4 (70% clay and 30% sand), and ST 5 (80% clay and 20% sand) were analyzed according to changes in slope (0%, 1%, 2%, and 3%) in terms of water retention and volume observed. We conclude that a leveled soil bed absorbs more water compared to a sloped soil bed. During construction, soil serves the purpose of a foundation, behaving differently with respect to varying water conditions. Soil with less water retention is preferred and, in that case, 100% sand or an 80%/20% combination of sand and clay are suitable for this purpose. In irrigation systems, soil and water have a very strong relationship; thus, based on our experimental results, we determined the optimal soil bed properties needed to resist atmospheric conditions. We observed that clay is better for water retention. It was observed that ST-2 (100% sand) performed well in terms of water retention (0.16 L/min) making it suitable for structures, while ST-1 (100% clay) performed well for irrigation purposes, as clay retains a large quantity of water (7.28 L/min). Sand contributes to stabilizing the soil before construction; thus, combinations of sand and clay were also tested with changing percentages. At a slope level of 3% along with 100% clay and sand, water behavior was almost similar. However, the combination of soil type 3 (ST-3) helped with the retention of water. For the prediction of outputs and relationship analysis, the ANN technique is superior to other techniques. The results using ANN explained the clear relationship between various input variables (soil type, slope, rainfall intensity, and output discharge) with outputs of water retention and volume observed. Therefore, we conclude that soil combination type and slope level should be monitored when undertaking construction.

Author Contributions

Conceptualization, S.A.R.S., and M.A.; methodology, M.H.H., S.A.R.S., and M.A.; software, M.H.H. and S.A.R.S.; validation, N.M.K. and M.N.; formal analysis, M.H.H., J.J., and M.W.A.; investigation, M.H.H., J.J., M.W.A., and A.F.; resources, M.H.H., J.J., M.W.A., and A.F.; data curation, M.H.H., S.A.R.S., and M.A.; writing—original draft preparation, M.H.H., S.A.R.S., and M.A.; writing—review and editing, N.M.K., M.W. and M.N.; visualization, S.A.R.S.; supervision, M.A., M.N., and N.M.K.; project administration, S.A.R.S.

Funding

This research received no external funding.

Conflicts of Interest

The authors declare no conflict of interest.

References

  1. Chouksey, A.; Lambey, V.; Nikam, B.; Aggarwal, S.; Dutta, S. Hydrological modelling using a rainfall simulator over an experimental hillslope plot. Hydrology 2017, 4, 17. [Google Scholar] [CrossRef]
  2. Chakravarti, A.; Joshi, N.; Panjiar, H. Rainfall Runoff Analysis Using the Artificial Neural Network. Indian J. Sci. Technol. 2015, 8, 1–7. [Google Scholar] [CrossRef]
  3. ASCE Task Committee on Application of Artificial Neural Networks in Hydrology. Artificial neural networks in hydrology. I: Preliminary concepts. J. Hydrol. Eng. 2000, 5, 115–123. [Google Scholar] [CrossRef]
  4. ASCE Task Committee on Application of Artificial Neural Networks in Hydrology. Artificial neural networks in hydrology. II: Preliminary concepts. J. Hydrol. Eng. 2000, 5, 124–137. [Google Scholar] [CrossRef]
  5. Kalteh, A.M. Rainfall-runoff modelling using artificial neural networks (ANNs): Modelling and understanding. Casp. J. Environ. Sci. 2008, 6, 53–58. [Google Scholar]
  6. Dawson, C.W.; Wilby, R. An artificial neural network approach to rainfall-runoff modelling. Hydrol. Sci. J. 1998, 43, 47–66. [Google Scholar] [CrossRef]
  7. Ramirez, M.C.V.; de Campos Velho, H.F.; Ferreira, N.J. Artificial neural network technique for rainfall forecasting applied to the Sao Paulo region. J. Hydrol. 2005, 301, 146–162. [Google Scholar] [CrossRef]
  8. Chiang, Y.-M.; Chang, L.-C.; Chang, F.-J. Comparison of static-feedforward and dynamic-feedback neural networks for rainfall–runoff modeling. J. Hydrol. 2004, 290, 297–311. [Google Scholar] [CrossRef]
  9. De Vos, N.; Rientjes, T. Constraints of artificial neural networks for rainfall-runoff modelling: Trade-offs in hydrological state representation and model evaluation. Hydrol. Earth Syst. Sci. Discuss. 2005, 2, 365–415. [Google Scholar] [CrossRef]
  10. Rajurkar, M.; Kothyari, U.; Chaube, U. Modeling of the daily rainfall-runoff relationship with artificial neural network. J. Hydrol. 2004, 285, 96–113. [Google Scholar] [CrossRef]
  11. Smith, J.; Eli, R.N. Neural-network models of rainfall-runoff process. J. Water Resour. Plan. Manag. 1995, 121, 499–508. [Google Scholar] [CrossRef]
  12. Riad, S.; Mania, J.; Bouchaou, L.; Najjar, Y. Rainfall-runoff model usingan artificial neural network approach. Math. Comput. Model. 2004, 40, 839–846. [Google Scholar] [CrossRef]
  13. Tokar, A.S.; Johnson, P.A. Rainfall-runoff modeling using artificial neural networks. J. Hydrol. Eng. 1999, 4, 232–239. [Google Scholar] [CrossRef]
  14. Chen, S.; Wang, Y.; Tsou, I. Using artificial neural network approach for modelling rainfall–runoff due to typhoon. J. Earth Syst. Sci. 2013, 122, 399–405. [Google Scholar] [CrossRef]
  15. Agarwal, A.; Singh, R.D.; Mishra, S.K.; Bhunya, P.K. ANN-based sediment yield models for Vamsadhara river basin (India). Water Sa 2005, 31, 85–100. [Google Scholar] [CrossRef]
  16. Birikundavyi, S.; Labib, R.; Trung, H.T.; Rousselle, J. Performance of neural networks in daily streamflow forecasting. J. Hydrol. Eng. 2002, 7, 392–398. [Google Scholar] [CrossRef]
  17. Campolo, M.; Andreussi, P.; Soldati, A. River flood forecasting with a neural network model. Water Resour. Res. 1999, 35, 1191–1197. [Google Scholar] [CrossRef]
  18. Dawson, C.; Wilby, R. Hydrological modelling using artificial neural networks. Prog. Phys. Geogr. 2001, 25, 80–108. [Google Scholar] [CrossRef]
  19. Sonawane, A.; Hasan, M.; Rajwade, Y.; Desai, S.; Rajurkar, G.; Shinde, V.; Singh, M. Comparison of Neuro-Fuzzy and Regression Models for Prediction of Outflow of on-farm Reservoir. Int. J. Agric. Environ. Biotechnol. 2013, 6, 311. [Google Scholar]
  20. Tayfur, G.; Singh, V.P. ANN and fuzzy logic models for simulating event-based rainfall-runoff. J. Hydraul. Eng. 2006, 132, 1321–1330. [Google Scholar] [CrossRef]
  21. Tayfur, G.; Swiatek, D.; Wita, A.; Singh, V.P. Case study: Finite element method and artificial neural network models for flow through Jeziorsko earthfill dam in Poland. J. Hydraul. Eng. 2005, 131, 431–440. [Google Scholar] [CrossRef]
  22. Tokar, A.S.; Markus, M. Precipitation-runoff modeling using artificial neural networks and conceptual models. J. Hydrol. Eng. 2000, 5, 156–161. [Google Scholar] [CrossRef]
  23. AHA. Advance Hydrology Apparatus. Advanced Hydrological Investigations. 2019. Available online: https://www.gunt.de (accessed on 13 January 2019).
  24. Kollaros, G.; Athanasopoulou, A. Sand as a Soil Stabilizer. Bull. Geol. Soc. Greece 2016, 50, 770–777. [Google Scholar] [CrossRef]
  25. Matter, S. What Type of Soil is Good for a Foundation for Buildings or Houses? 2015. Available online: https://soilsmatter.wordpress.com/2015/05/01/what-type-of-soil-is-good-for-a-foundation-for-buildings-or-houses/ (accessed on 18 July 2019).
  26. Siddique, R.; Aggarwal, P.; Aggarwal, Y. Prediction of compressive strength of self-compacting concrete containing bottom ash using artificial neural networks. Adv. Eng. Softw. 2011, 42, 780–786. [Google Scholar] [CrossRef]
  27. Mansoor, J.; Shah, S.; Khan, M.; Sadiq, A.; Anwar, M.; Siddiq, M.; Ahmad, H. Analysis of Mechanical Properties of Self Compacted Concrete by Partial Replacement of Cement with Industrial Wastes under Elevated Temperature. Appl. Sci. 2018, 8, 364. [Google Scholar] [CrossRef]
Figure 1. Rainfall simulator—advanced hydrology apparatus.
Symmetry 11 01224 g001
Figure 2. Schematic of advanced hydrology apparatus [23]: 1—experiment tank; 2—chamber; 3—display and control elements; 4—flow meter (supply); 5—pump; 6—storage tank; 7—measuring tank (drain); 8—chamber; 9—well; 10—tube manometers; 11—nozzles of the precipitation device.
Symmetry 11 01224 g002
Figure 3. Hydrographs of flooding behavior for (a) ST-1, (b) ST-2, (c) ST-3, (d) ST-4, and (e) ST-5 with various slopes.
Symmetry 11 01224 g003
Figure 4. Artificial neural network: schematic illustration with a single hidden layer.
Symmetry 11 01224 g004
Figure 5. Prediction profile graph for water retention and volume observed.
Symmetry 11 01224 g005
Figure 6. Interaction profile of variables with respect to water retention.
Symmetry 11 01224 g006
Figure 7. Interaction profile of variables with respect to water volume observed.
Symmetry 11 01224 g007
Table 1. Rainfall intensity patterns.
SlopesRainfall Intensities (mm/min)
0%12
1%12.5
2%13
3%13.5
Table 2. Soil properties and bed profile pattern.
Soil TypesSoil CombinationMDDOMCSoilCategoryLLPLPI
(pcf)(%)AASHTOUSCS
ST1Clay (100%)122.212.10A-7-6CL3018.2411.76
ST2Sand (100%)108.314.35A-3SP1700
ST3Clay/sand (50%/50%)133.979.20A-4ML2200
ST4Clay/sand (70%/30%)134.417.44A-4CL23.8515.388.47
ST5Clay/sand (80%/20%)134.3912.01A-4CL2416.237.77
Note: (errors and omissions excepted), Abbreviations: maximum dry density (MDD), optimum moisture content (OMC), (American Association of State Highway and Transportation Officials (AASHTO) These all are categories: A-7-6, A-3, A-4, (Unified Soil Classification System (USCS) category: CL-Clay of Low plasticity, SP-Poorly graded Sand, ML-Micaceous/Silt of Low plasticity), plastic limit (PL), liquid limit (LL), and plasticity index (PI).
Table 3. Data description of parameters.
ParametersDescriptionMeanSDMinimumMedianMaximum
Water retentionWater retained by soil2.7562.410.042.157.28
Volume ObservedVolume of water recovered in tank (L)20.63.0671520.2526.25
Soil typesSoil combination
1—(100% clay),
2—(100% sand),
3—(50% clay and 50% sand), 4—(70% clay and 30% sand), 5—(80% clay and 20% sand)
--1-5
Rainfall intensityRainfall intensity (mm/min)12.750.5741212.7513.5
Bed slope (%)Level of soil bed change1.51.14701.53
Output dischargeVolume of water output (L/min)15.7443.2959.7216.8419.96
Table 4. Parametric estimates for runoff analysis with respect to soil formation.
Input ParametersCodeH1_1H1_2H1_3H1_4
Soil types10.000407−0.80860.0273090.22151
Soil types2−0.42179−0.830720.512097−0.76482
Soil types3−0.00634−0.567210.219779−0.06265
Soil types40.014552−0.96278−0.245160.00394
Rainfall intensity-0.030138−0.14820.9733980.3635
Bed slope (%)0−0.06142−0.05476−0.77032−0.24006
Bed slope (%)1−0.247510.6297560.572158−0.34591
Bed slope (%)2−0.10904−0.141460.7019740.149358
Output discharge-−0.47532−0.043160.207968−0.05518
Intercept-0.7678191.601076−12.8997−4.8644
Output ParametersInterceptH1_1H1_2H1_3H1_4
Water retention3.289303−5.534193.365286−1.034292.874236
Volume observed20.985310.724728−7.213535.411468−1.7103
Table 5. Model parameter estimates for training and validation data. RMSE—root-mean-square error.
MeasuresTraining Validation
Water Retention
R20.99881750.9857542
RMSE0.08172720.2636254
Number of samples164
Volume Observed
R20.97102590.9961819
RMSE0.53211650.1010018
Number of samples164
Table 6. Variable importance profile of water retention and volume observed.
ParameterMain EffectTotal EffectProfile
Water Retention
Output discharge0.2510.566 Symmetry 11 01224 i001
Soil type0.3020.302 Symmetry 11 01224 i002
Bed slope (%)0.3020.302 Symmetry 11 01224 i003
Rainfall intensity0.1450.145 Symmetry 11 01224 i004
Volume Observed
Bed slope (%)0.3050.522 Symmetry 11 01224 i005
Output discharge0.1920.339 Symmetry 11 01224 i006
Soil type0.3050.305 Symmetry 11 01224 i007
Rainfall intensity0.1970.197 Symmetry 11 01224 i008
Overall
Output discharge0.2210.452 Symmetry 11 01224 i009
Bed slope (%)0.3040.412 Symmetry 11 01224 i010
Soil type0.3040.304 Symmetry 11 01224 i011
Rainfall intensity0.1710.171 Symmetry 11 01224 i012

