1. Introduction
With the development of mobile Internet, Android has become the world’s largest operating system since 2017, according to Statcounter. Moreover, in February 2018, the number of 4G users has reached 1.03 billion based on data from China’s Ministry of Industry and Information Technology. Through analyzing these data we can see that the number of personal mobile devices is increasing rapidly.
A large amount of data can be generated from mobile devices, such as data (endogenous data), if the users spent a lof of time using different mobile apps. By analyzing this data, we can optimize recommendation systems, monitor suspicious entities in the network, and collect opinions from the masses early on in the timeline of large-scale events. The feedback data from mobile app users can help to reveal trends in public opinion. The valuable data collected in this paper can help us to analyze comments from Toutiao, a famous mobile news app in China, about the THAAD event. The THAAD event, which caused by the THAAD defense system in Korea, triggered a spontaneous large-scale boycott of Korean goods by the Chinese people, which caused widespread discussion in China and thus provides us with the chance to analyze people’s comments, as well as to ascertain tendencies in public sentiment.
In order to analyze the information and public trends from the mobile application using big data, we opted to utilize sentiment analysis. Traditional sentiment analysis performs well for long texts; however, the comments of mobile app users are difficult to understand and always written using few words. In this paper, we explore a new kind of big data derived from the mobile Internet: namely feedback data. This form of data mainly comes from mobile applications such as news applications and consists of comments, replies to comments and the numbers of likes given to the comments. We also explore the feedback model of users using mobile applications. After encountering some suspicious and possibly malicious information, we opted to use the method proposed by Cai et al. [
1] to prevent the spread of malicious information in the network. The contributions of this paper are as follows:
We propose a new method of analyzing sentiment trends from comments made via mobile applications;
We propose some specific models of mobil app comments to reflect characteristics of the public’s behavior;
We propose a conjecture that the average word length of a sentiment dictionary should be less than 2.3 to classify the sentiment tendency of a short text.
We confirm that the standard deviation of sentiment value is indeed conducive to reflecting public sentiment tendency.
The rest of the paper is organized as follows: Previous works are reviewed in
Section 2. We present a basic overview of sentiment analysis methods in
Section 3. We propose a method to compute sentiment scores of special texts, such as short comment, in
Section 4. The evaluation of our proposed system is conducted in
Section 5. The paper is concluded in
Section 6.
2. Related Work
In general, the research work on text sentiment analysis includes the machine-learning-based method and the semantic dictionary-based method. In terms of the former, Yang et al. [
2] used the SVM (support vector machine)-based classification method to conduct analysis of four kinds of granularity sentiment; according to the results, this method performs well on COAE2009’s evaluation task. In addition, Fan et al. [
3] suggested the use of the K-neighborhood scheme. In their research, they first determined the local sentiment tendencies of texts, then used the KNN algorithm to calculate the sentiment tendencies of the full texts. However this algorithm still needs to mark some text sentiment values artificially. Although has some advantages in terms of judgment accuracy compared with the traditional machine-learning-based methods, their result is probably subjective. In the study of Liu et al. [
4], they used three different machine learning programs, the SVM scheme, Naive Bayes scheme, and N-meta-language model. Their scheme selected three different features, namely IG [
5], CHI statistics, and TF (document frequency), as well as three different calculation schemes pertaining to feature weight: Boolean feature weight, word frequency characteristic weight, and TF-IDF [
6]. These were used classify the data from micro-blog through sentiment analysis. Their results show that SVM, IG, and TF-IDF make the best team for obtaining good results in classification. However, their program can only solve specific area data. For different analysis, a different model needs to be established. Moreover, Popescu et al. [
7] firstly calculated the PMI value and then used a Bayesian classifier to process the data.
For semantic dictionary-based research programs, most of their work is based on existing sentiment dictionaries. For example, Zhou et al. [
8] used HowNet and SentiWordNet to decompose a number of words into sensitive words, then calculate the sentiment value of words, and finally use the SVM method to calculate a text’s sentiment values. Xiong et al. [
9] used the a word similarity degree algorithm, a semantic similarity degree algorithm, and a grammatical similarity degree algorithm to calculate the sentence complacency degree. The results showed that their scheme is similar to manual judgment. Dong et al. [
10] introduced the related knowledge about HowNet and the description words in HowNet by providing details. Wang et al. [
11] used HowNet and PMI to calculate the sentiment polarity of a word. Their schemes improve accuracy by 5% compared with the benchmark schemes in that paper.
As the number of texts in the network becomes huge, Yang et al. [
12] adapted the concept of the comment cluster to replace a class of comments, then used the comment cluster’s sentiment tendencies as a proxy for the sentiment tendency of all comments in the cluster. Their method can improve the efficiency of a sentiment mining algorithm by 58% when analyzing network public opinion.
To analyze comments from mobile applications users, we used a method based on sentiment dictionary, which is different from the review methods. We also propose some new dictionaries to strengthen the effect of our work, such as negative words, and a similarity sentiment dictionary. Thus in this paper, we propose a new method of obtaining the sentiment score of a comment, and use these new methods/tools to accomplish stated goal.
3. Sentiment Analysis Method
Sentiment analysis is a subjective text mining and analysis technology used to obtain useful knowledge and information [
13,
14,
15] from texts, as well as to classify the sentiment trends of texts. In this paper, we use a method based on the mixed sentiment dictionary, degree adverb dictionary, negative word dictionary and stop word dictionary. Moreover, in this paper, which is based on previous work [
16], we have extended the HowNet-based sentiment dictionary. In brief e mix together some sentiment dictionaries from the Internet, and dynamically update the sentiment dictionary when the system detects some words with new meaning.
Our sentiment analysis method consists of three steps: (1) text preprocessing, (2) sentiment information extraction, and (3) sentiment classification. A detailed description of each step is provided below.
- (1)
Text Preprocessing
In order to analyze the sentiment tendency of a text, pretreatment is necessary. Here, the text is unstructured. First of all, a text is composed of different paragraphs; thus, we need to cut the text into its component paragraphs, and then store each paragraph in our database individually. Secondly, each paragraph is composed of different sentences; we obtain the different sentences by cutting the paragraphs based on some English symbols such as “.”, “!”, “?”, “;”, or the same symbols in Chinese. Next, we store these sentences in our database individually. Because each sentence also contains different short opinion sentences, or phrases, we cut the sentence at “,” or separate them by space to obtain several short opinion sentences. In this way, an unstructured text can be decomposed into multiple structured texts.
After finishing the above work, we need to eliminate some useless (chaos) words. The term “stop word” refers to a word (or some words) that is (are) automatically ignored in the process of information retrieval. In order to save storage space and improve retrieval efficiency, we need to eliminate those stop words before or after processing the natural language data (or text). Because these stop words have little influence on sentiment analysis, we need to remove these deceptive words from the results of text segmentation. Accordingly in this paper, we contribute a stop word dictionary to eliminate stop words in opinion sentences.
- (2)
Sentiment Information Extraction
Sentiment information extraction extracts the sentiment information that is valuable in texts. In this paper, we propose to use a mixed sentiment dictionary, a degree adverb dictionary from the Internet, and a negative word dictionary developed by us to obtain sentiment elements from opinion sentences.
In the mixed sentiment dictionary, there are many sentiment words along with their sentiment score. In the degree adverb dictionary from the Internet, there are many adverb words along with their degree score. In the negative word dictionary that we developed, there are many negative words. By using these three dictionaries, we can compare words in opinion sentences to confirm the type of each word and determine the word score. For example, if the word is a negative word, the word score is “−1”.
- (3)
Sentiment Classification
In this step, we classify the text’s sentiment tendency.
In this paper, we propose an algorithm to calculate the sentiment score of a text. Firstly we divide a text into paragraphs, then cut a paragraph into sentences, and lastly separate these sentences into opinion sentences. The reason why we need to obtain these opinion sentences is that these sentences or phrases are the smallest structures in the overall sentence, which make it easier for use to obtain the sentiment score of a sentence. After this, we firstly calculate the sentiment score of the opinion sentences, then compute the sentiment score of the complete sentences then sum the score of the paragraphs, after which we can finally obtain the sentiment score of the text. Based on this sentiment score, we can analyze the sentiment tendency of the text. The specific method used to calculate the text sentiment score will be discussed in
Section 4. In general, if the score is greater than 0, the sentiment tendency of the text will be positive; otherwise, the sentiment tendency of the text is negative.
By using the above methods, we can obtain a comment’s sentiment score. Generally speaking, the greater the comment’s absolute sentiment score, the stronger of the sentiment tendency of the comment will be.
4. Proposed Scheme
Based on the steps described in
Section 3, we hereby propose a specific method for calculating a text’s sentiment score. In particular, we concentrate on comments from mobile applications, which are remarkably rich sources for imputing public opinions. We propose several new algorithms that are tailored for use with comment data, which presents distinct difficulties due to its short and chaotic nature.
4.1. Computing Sentiment Values of Opinion Sentences
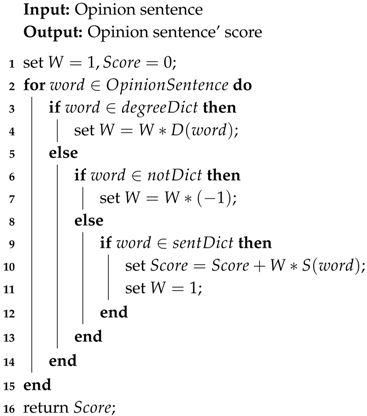
Each given sentiment word is assigned a sentiment value, denoted as S. In general, if a degree adverb appears in front of this sentiment word, that degree adverb is used to strengthen the sentiment value of this word. We assume that this degree is D. If there is a negative word before the sentiment word, then the sentiment polarity of the sentiment word will be reversed. We set the value of the negative word to −1. In Chinese an odd number of negative words has a negative meaning, but an even number of negative words results in a positive state. Thus, we present the following Algorithm 1 to calculate the sentiment value of an opinion sentence.
After the above operations are complete, the sentiment value of an opinion sentence is available. If the value is greater than 0, the sentiment tendency is positive. If it is less than 0, the sentiment tendency of the opinion sentence is negative. If it is around 0, this means that the opinion sentence is neutral. The higher the sentiment value of the opinion sentence, the stronger the tendency of the opinion sentence.
| Algorithm 1: Calculate Opinion Sentence Score |
![Symmetry 11 00115 i001]() |
4.2. Computing Sentiment Values of Sentences
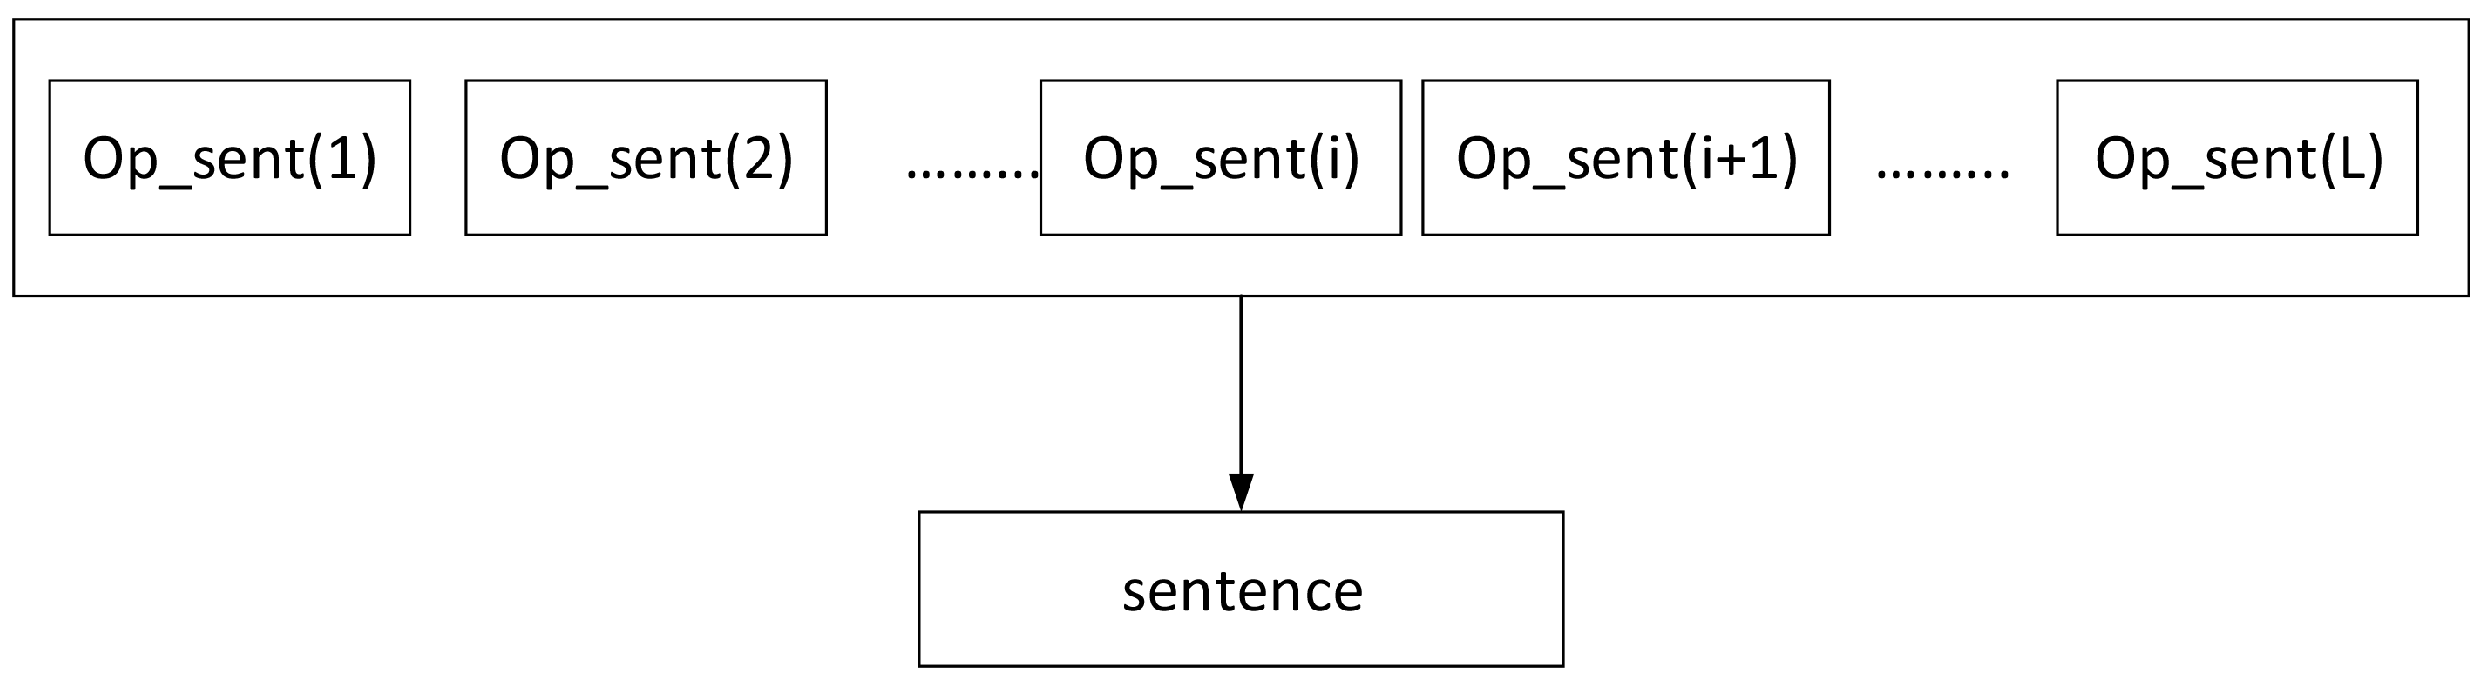
After getting the sentiment value of an opinion sentence, the sentiment value of a full sentence is obtained based on the following method:
where
i represents the position of the opinion sentence in the sentence;
L represents the number of opinion sentences contained in the sentence, and socre
represents the “
i”th opinion sentences in the sentence. It should be noted here that the value of
L is different for different sentences, because difference sentences have a different number of opinion sentences. We can see the relationship between sentence and opinion sentence in
Figure 1.
By using Method (
1), we can calculate the sentiment value of a sentence. The reason for this is that, in Chinese, it is common to state important information at the end of the sentence [
15]. Thus we wish to stress here that the importance of an opinion sentence is related to its location.
4.3. Computing Sentiment Values of Comments
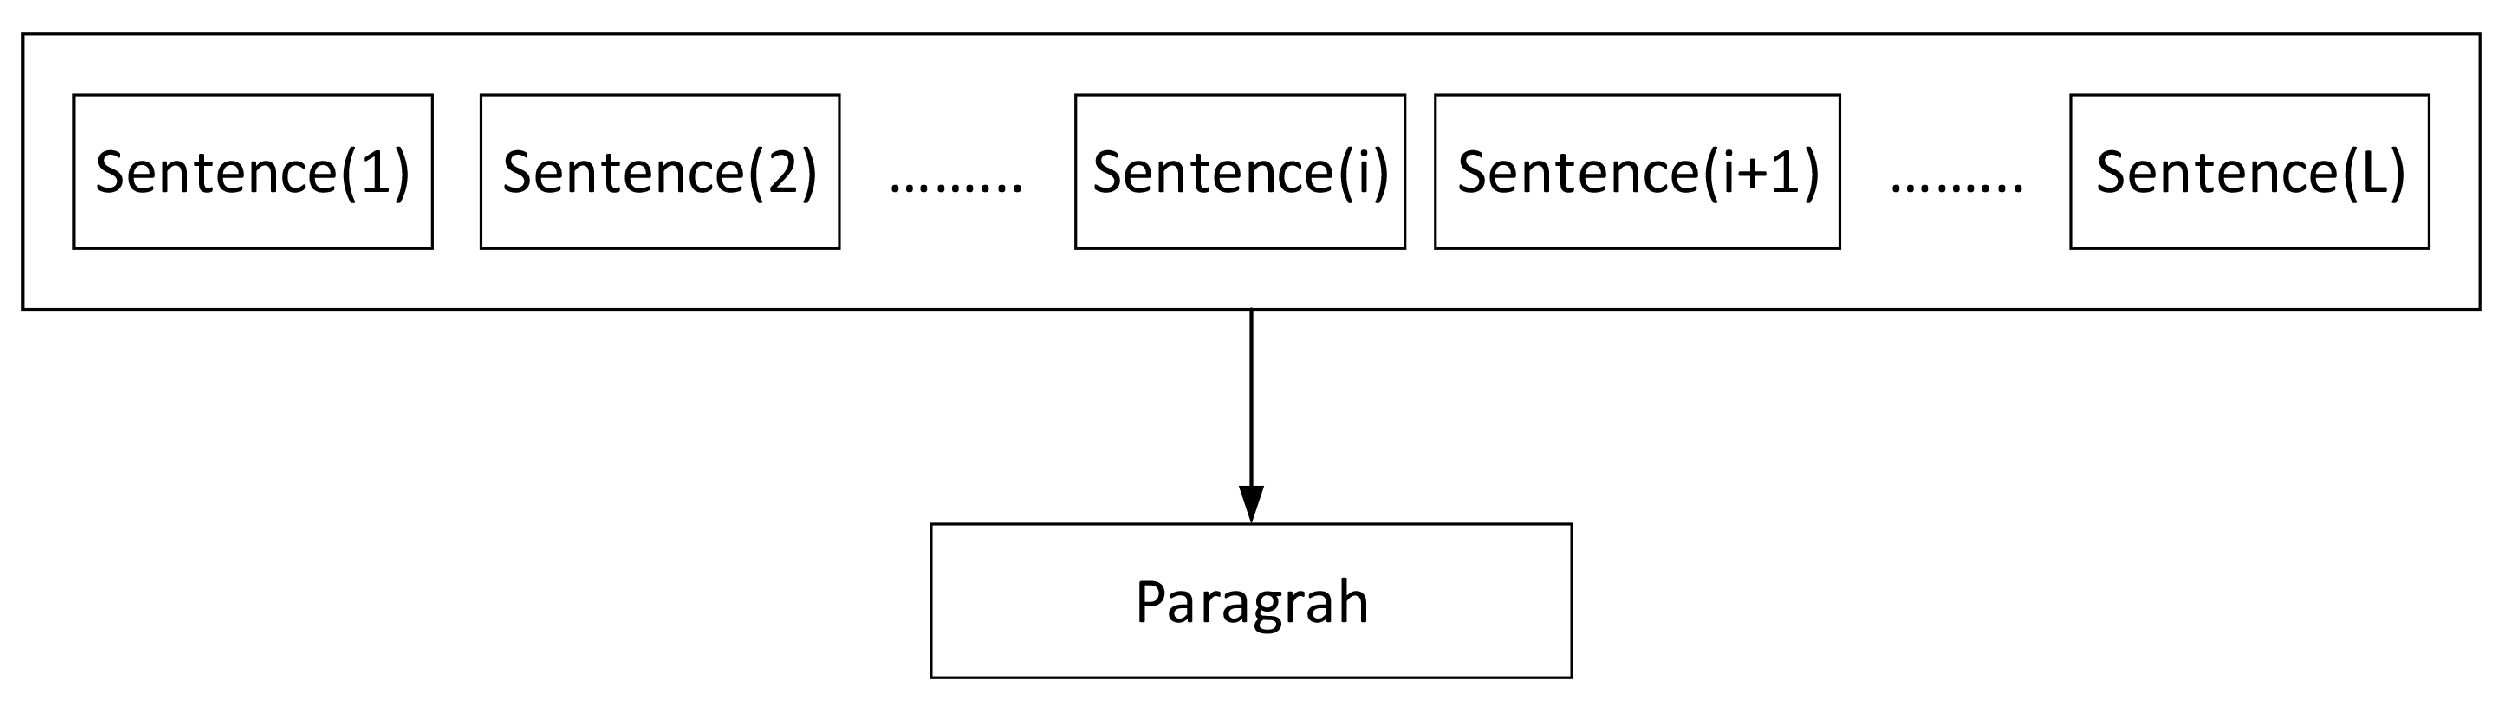
Following the calculation of the sentiment value of a sentence, we can now analyze the influence of different sentences in the paragraph on its sentiment value, and propose a method to calculate the value of a paragraph’s sentiment:
where
i represents the position of the sentence in a paragraph, starting at 1;
L represents the number of sentences in the paragraph and score
represents the “
i”th sentences in the paragraph. We should point out here that the value of
L is different for different paragraphs, as each paragraph may have a different number of sentences. We can see the relationship between sentence and paragraph in
Figure 2.
4.4. Judging Unlisted Words
The most critical step in calculating the sentiment value of an opinion sentence is to compare each word in the opinion sentence to the words in the sentiment dictionary, negative word dictionary, and degree word dictionary so as to classify the word’s type and obtain the word’s score.
The sentiment dictionary we use to analyze sentiment words is based on HowNet. However, this system has not been updated for a long time, and many words have acquired new implications in recent years, especially in the mobile application environment. Thus, we need to update our sentiment dictionary to enable it to detect as many sentiment words as possible, thus making our system more useful.
Word2Vec is a software tool developed by Google for training word vectors. It expresses a word as a vector form efficiently according to a given corpus. In our proposed system, we use Word2Vec to find the most similar word to an unlisted word in the corpus. An unlisted word is a word or words that is (are) not collected in the sentiment dictionary, negative word dictionary, and degree word dictionary, but is (are) essential to judging the sentiment tendency of a sentence.
It is very simple to implement the code in Python to use Word2Vec to train the word vector. Firstly, we need to obtain the corpus for training. The corpus contains the content of all articles we have collected, along with all comments on these articles and the contents of the negative word dictionary, degree adverb dictionary, and sentiment dictionary.
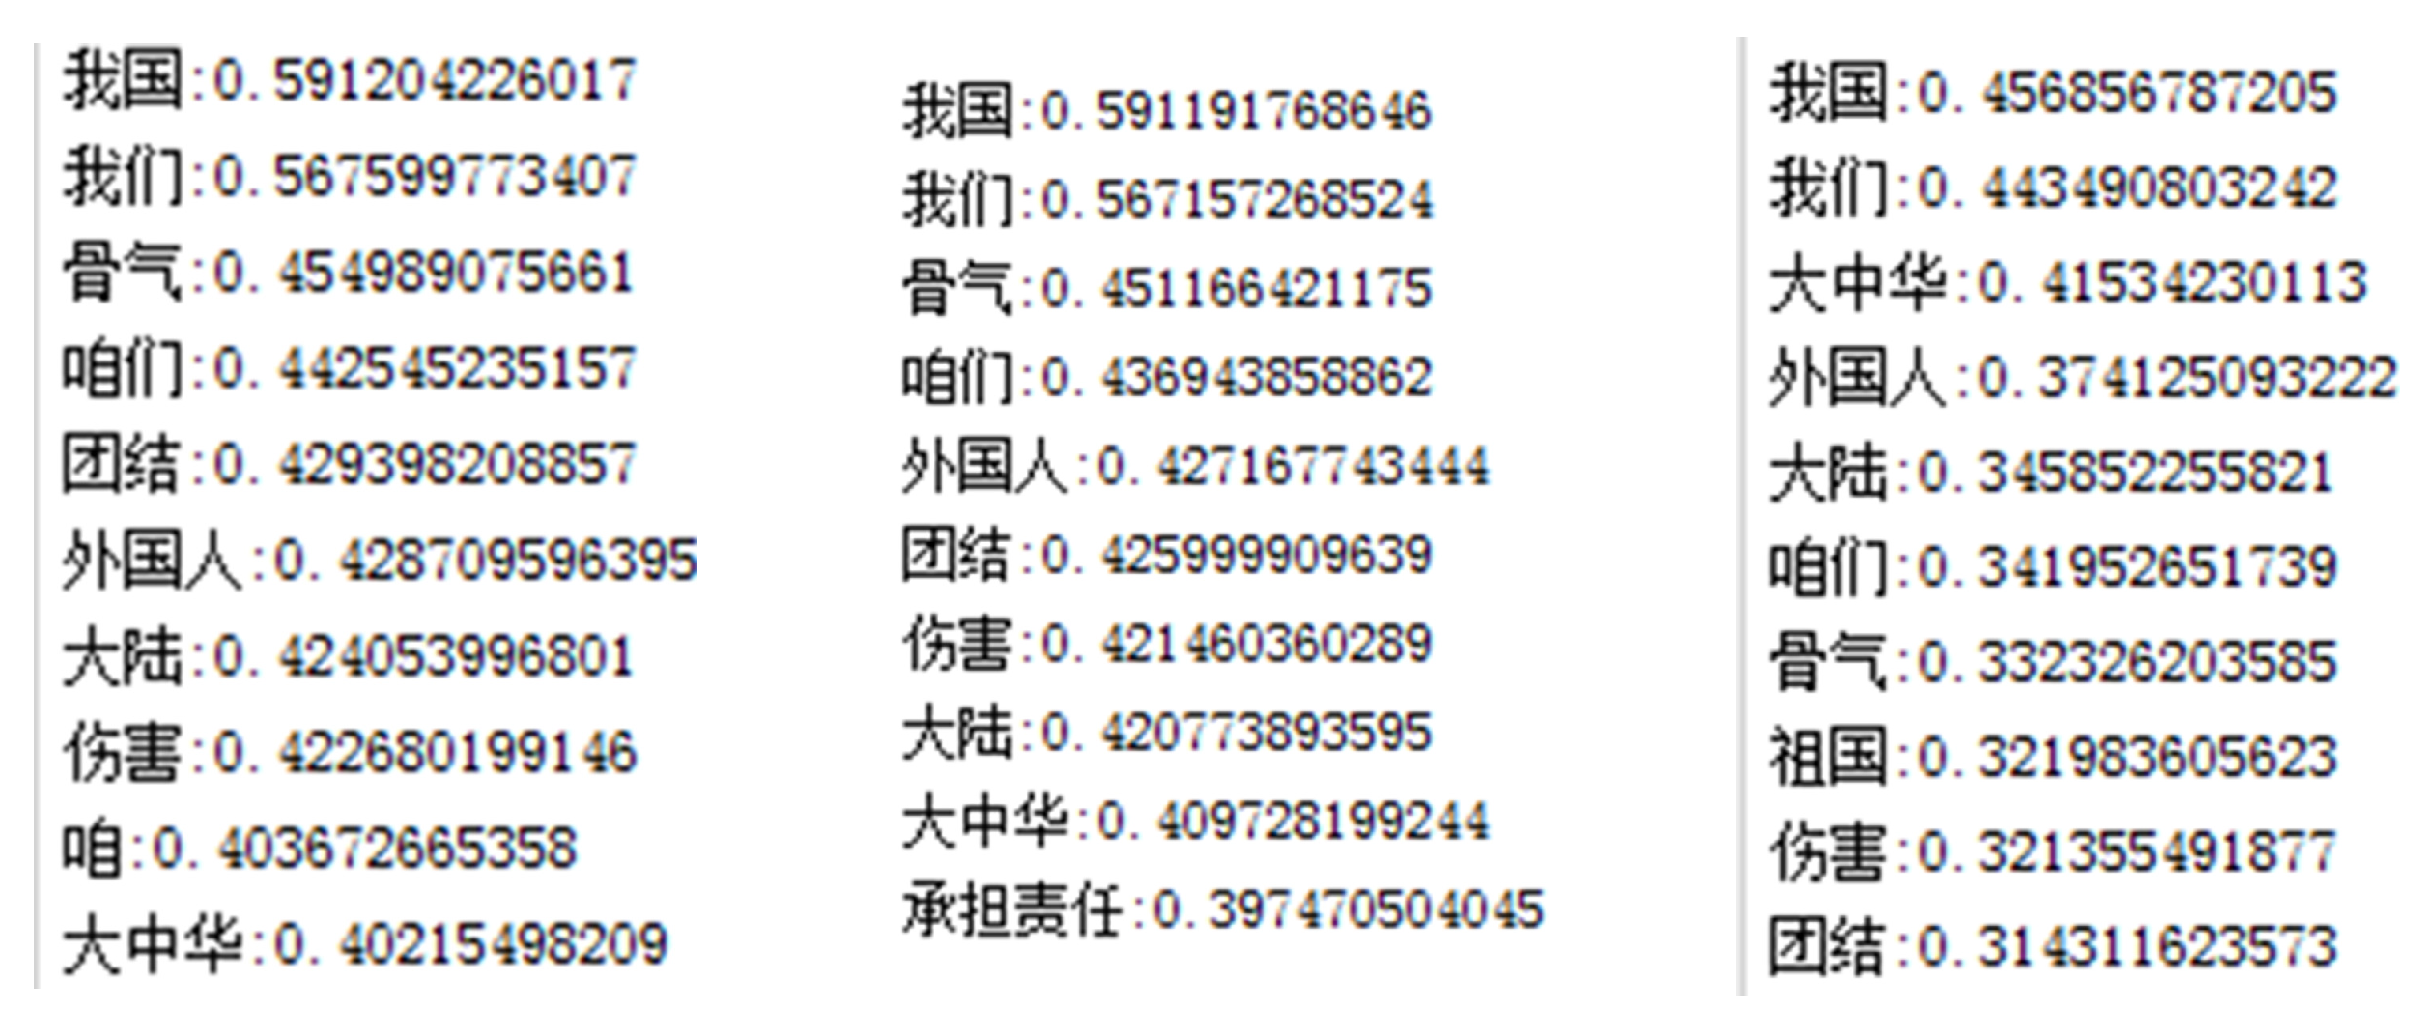
We use some methods in the Word2Vec model to increase the model’s accuracy. We can treat our existing dictionary as a training corpus for the original Word2Vec model and upgrade to a new model for further training. After the model is updated, we can test its efficiency. The result of entering “China” for testing purposes are shown in
Figure 3:
The function used to detect similarity in the model is
. The function returns the words in the model most similar to “China” along with the values of the corresponding similarity. The figures from left to right are the results obtained by using the models word2vec, word2vec2, and word2vec3 respectively. We can see the English explanation of the above Chinese words in
Table 1.
We use the word2vec3 model to search for words that are similar to unlisted words. By using the
function, we can find the first 10 words that are most similar to the unlisted words. In the training model, we have dumped all news articles and comments, along with the content of the sentiment dictionary, negative word dictionary, and degree word dictionary into the model file. In this way, we can readily find the most similar words to the unlisted words in the model file. If an unlisted word is contained in one of those three dictionaries, we add the word into the dictionary, and calculate the score of the word. The score of the word is calculated as
where
is the score of the most similar word in the dictionary, while
is the similarity degree of the word, which can be computed by using
.
5. Experimental Results and Analysis
5.1. Analysis of the Comment’s Sentiment Score
In our previous work [
16], we presented our comparison results by using the proposed method manually. In the present, we propose a stronger method. In these experiments, we have compared the results of classifying the comment’s sentiment tendency using our mixed sentiment dictionary, which is based on HowNet along with some other sentiment dictionaries and DUTIR’s (Dalian University of Technology Information Research) Chinese’s affective lexicon ontology dictionary [
17], NTU’s (National Taiwan University) sentiment dictionary and TSING’s (Tsinghua University) sentiment dictionary (created by Jun Li). The samples for classification are randomly selected from comments collected from news articles about the THAAD event. After selecting these comments, we firstly classified them manually and then tagged the comments’ sentiment tendency. If the comment is negative, it was tagged as “−1”. If the comment is neutral, it was tagged as “0”. If the comment is positive, it was tagged as “1”. After tagging all comments, we began to use our four different sentiment dictionaries to deal with the 204 randomly selected comments. The specific method used to classify the comment sentiment as described above. In this work, we have not changed the algorithm used to the comment sentiment score. The results are as shown in
Table 2,
Table 3 and
Table 4.
Here,
P is precise rate,
R is recall rate, and
F is the result by using
R and
R. More specifically, precise rate is:
, recall rate is:
and
F value is:
[
15]. In this method,
A represents the number of comments tagged as positive (negative and neutral) by using both the machine and artificial method.
B represents the number of comments tagged as positive (negative and neutral) using the machine method only, and
C represents the number of comments tagged as positive (negative and neutral) using the manual method only.
The above two tables only show the classification results using the mix sentiment dictionary and TSING’s sentiment dictionary. DUTIR’s sentiment dictionary and NTU’s sentiment dictionary were not able to be uses to classify the selected comments’ sentiment tendency. In order to explain why these two dictionaries could not be used to classify these comments, we present statistics describing these four sentiment dictionaries and the average word length in these dictionaries. Results are shown in
Table 5.
From
Table 5, we can guess that, to classify the short comment text, the sentiment dictionary we use needs to contain sentiment words that are as short as possible; that is, the dictionary’s average word’s length should be less than 2.3 characters.
From
Table 2,
Table 3 and
Table 4, we can see that using the mix dictionary yields higher accuracy compared with TSING’s sentiment dictionary. From
Table 5, we can see that those two dictionaries’ average word lengths are both less than 2.3 characters, meaning that they are both useful for classifying the comment’s sentiment tendency. However, the TSING sentiment dictionary was created in 2006, while the mix dictionary was created in 2017. Moreover, the mix dictionary contains more than 110 thousands sentiment words, while TSING’s sentiment dictionary only contains around 10 thousand. In addition, there are many more new meaningful words in the mix dictionary than in TSING’s sentiment dictionary. Accordingly, we can conclude that to classify short comments from mobile applications using a sentiment dictionary, we need to guarantee that the average word length is less than 2.3 and that the dictionary should contain as many new meaningful words as possible to arrive at more accurate classification results.
Finally, compared with the results shown in our previous work [
16], the result using the mix dictionary is worse than the previous result. After analysis of those two different results, we can guess that the new mix dictionary contains many new words that may reflect the detected results, while the manual judgement may also have contained some errors leading to the result being worse than before.
5.2. Analysis
Some experiments are presented blow. During the experiments, we developed some explanations for the experimental results. The reason why we conducted those experiments is to derive the rules of the data statistics obtained from the endogenous data from mobile applications, as well as to construct some models of user behavior on mobile applications.
5.2.1. Comment Number Distribution vs. Time
- (1)
The Distribution of Comment Numbers over Three Months
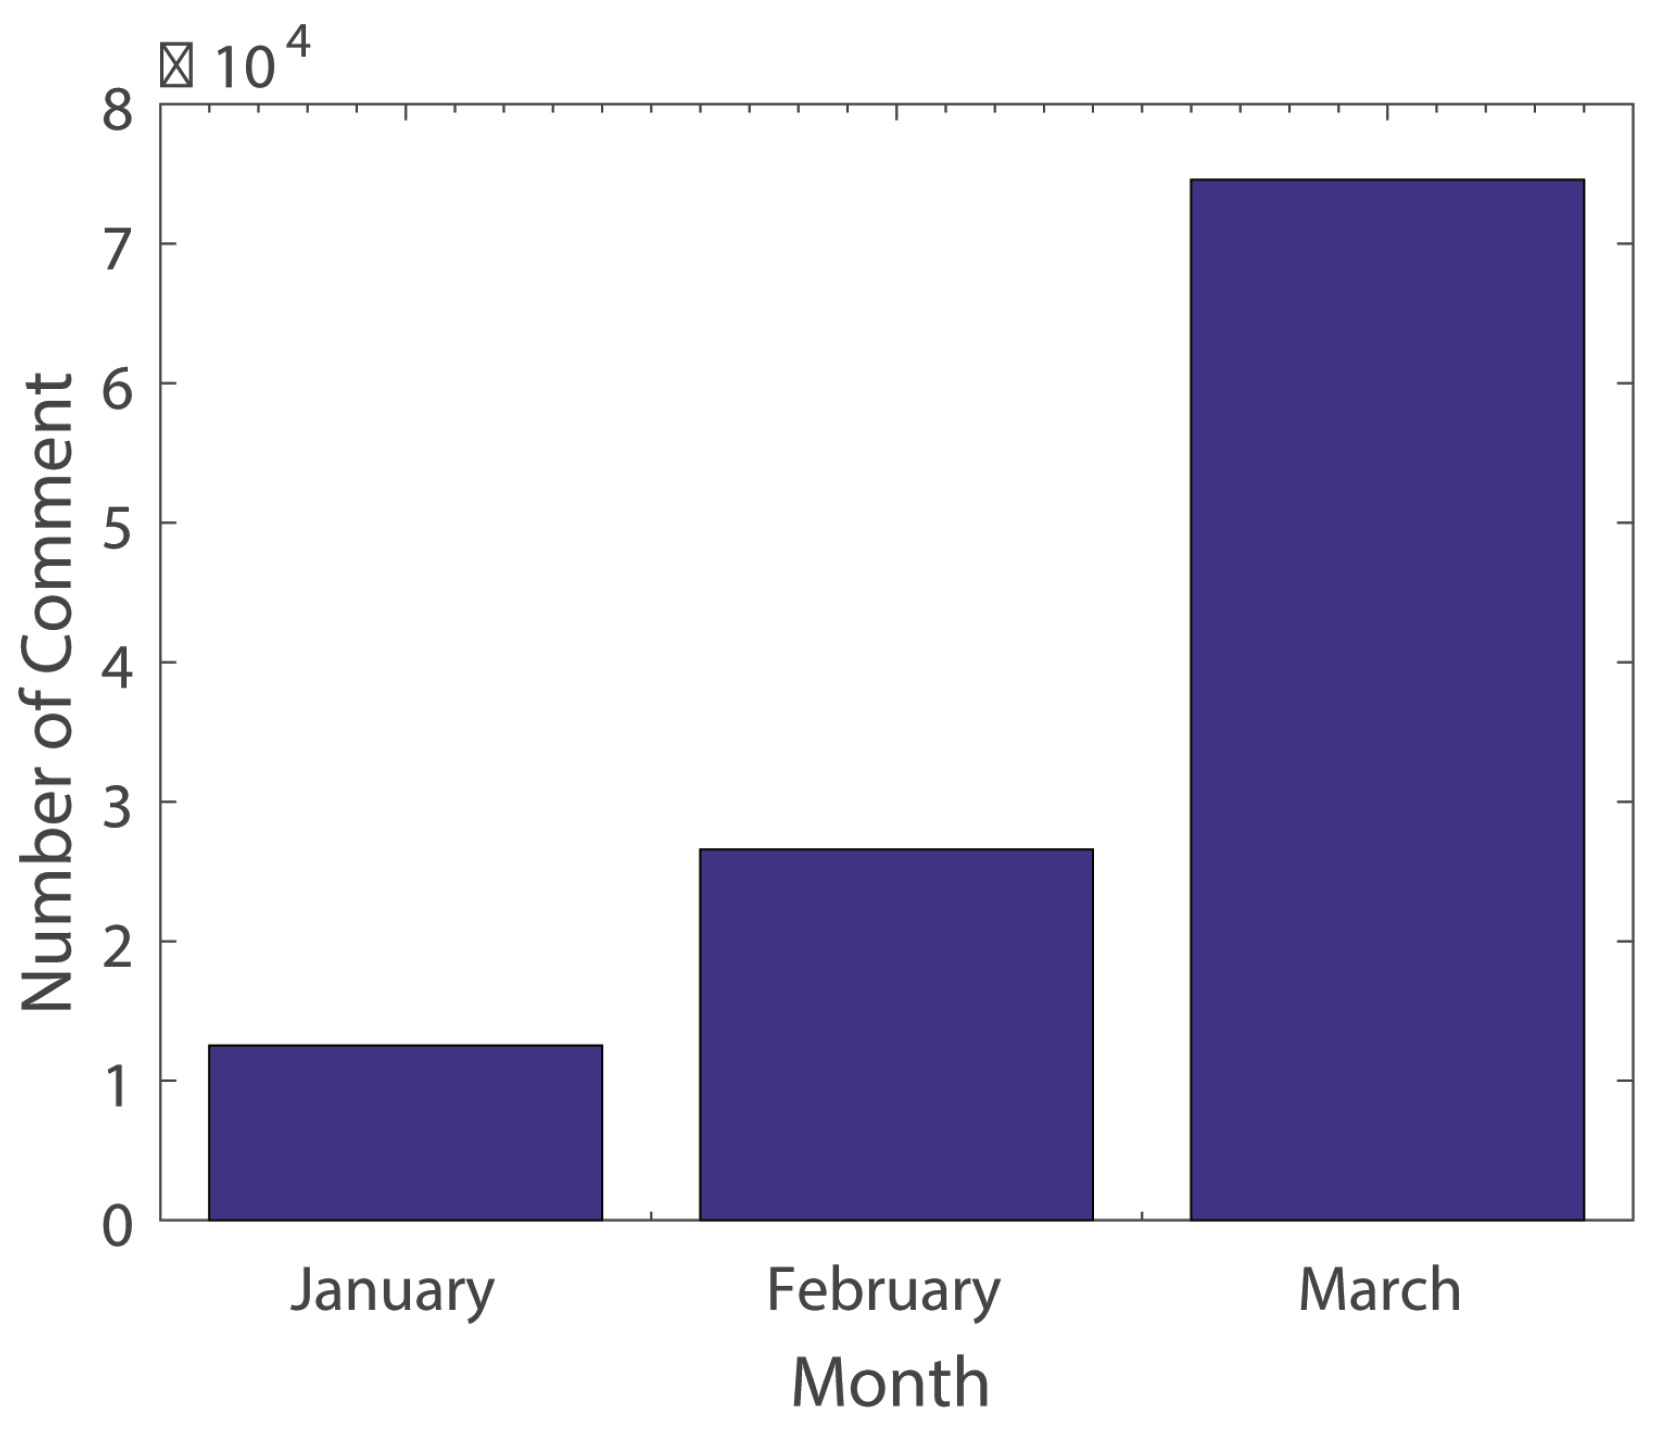
Figure 4 depicts the distribution of comment numbers over three months. According to statistics, the number of comments on a topic (e.g., “THAAD” event in Toutiao) exhibits a rapid growth pattern in the three months from January to March 2017. The number of comments in January was 12,520, with 26,569 in February and 74,568 in March, presenting a linear growth per month with a slope of 3. It can thus be concluded that, along with the development of hot news events, the attention paid to the relevant events grows explosively.
- (2)
The Distribution of Comment Numbers in One Month
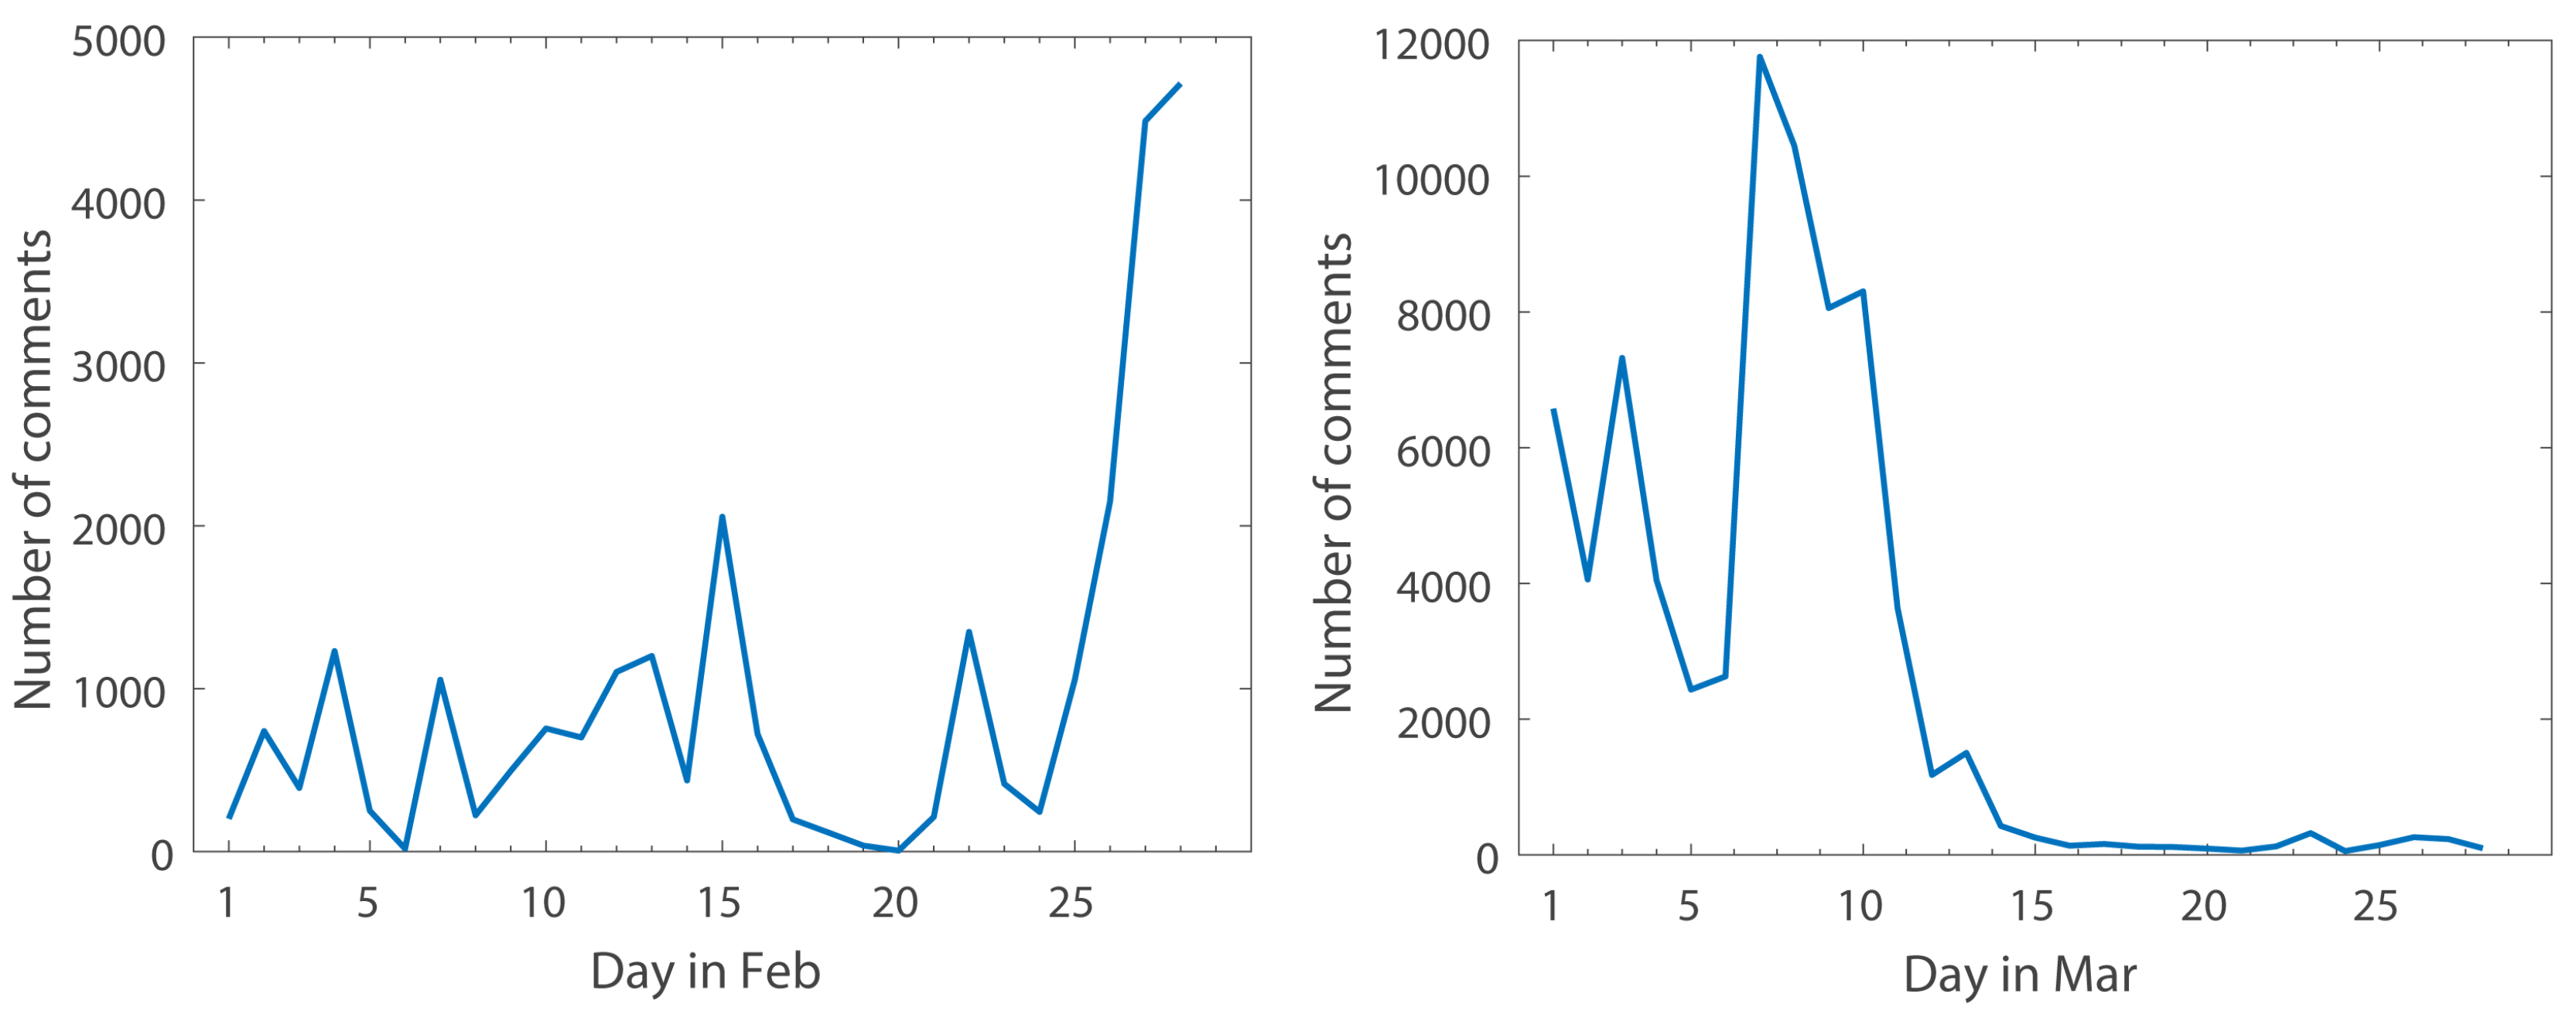
Figure 5 presents the changes in the number of comments from February to March of 2017. Both of these pictures show very strong fluctuations, especially in February. By analyzing the news associated with the peak comment numbers over these two months, it can be seen that the peak comment numbers coincide with the occurrence of some hot news stories. From the above images, it can be seen that since March, the general public attention to relevant events has been gradually decreasing.
- (3)
The Distribution of Comment Numbers in One Day
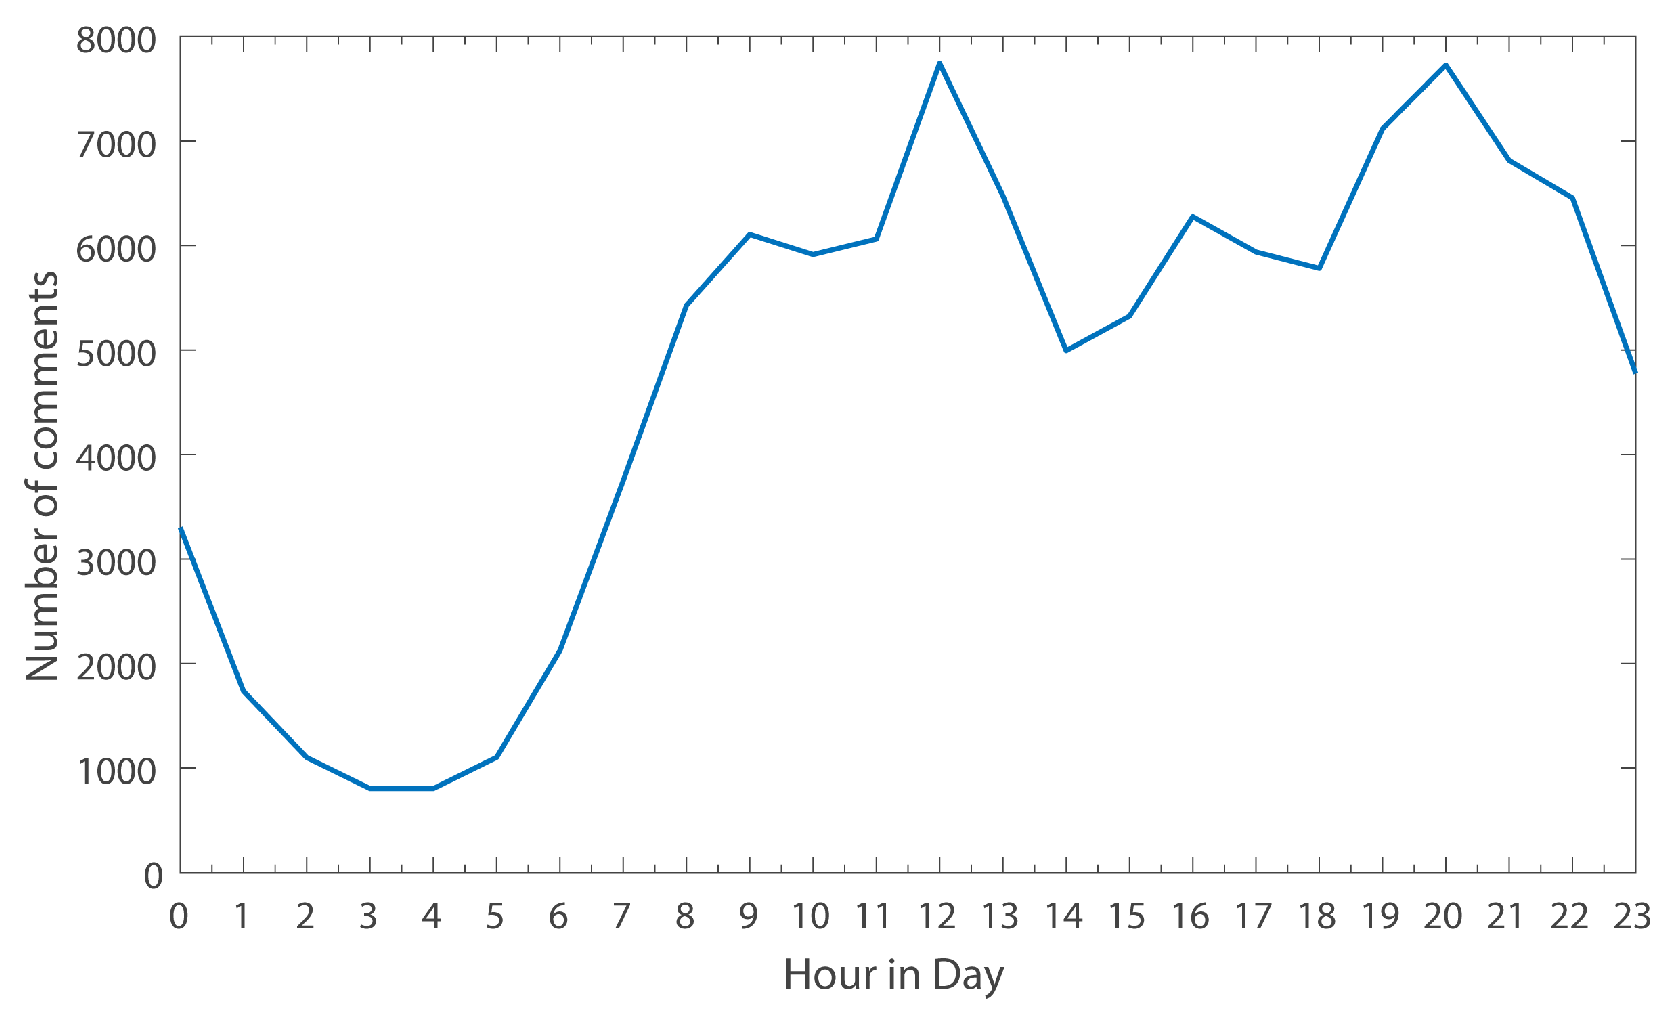
Figure 6 reflects the changes of comment numbers with the time of day. It can be clearly seen that the number of comments in one day perfectly coincides with normal personal spare time in daily life. For example, the number of comments rises gradually between 4 a.m. and 9 a.m. But between 9 and 11, the number of comments goes down or drops slightly. Between 11 and 12, there is another uptick, because this is a time when people are typically taking a break (reading news). Between 12 and 14, there is a drop due to lunch- time or noon sleep.
5.2.2. Comment Sentiment Score vs. the Number of Replies or Clicking Agreements
- (1)
The Relationship between Comment Scores and Number of Clicking Agreements
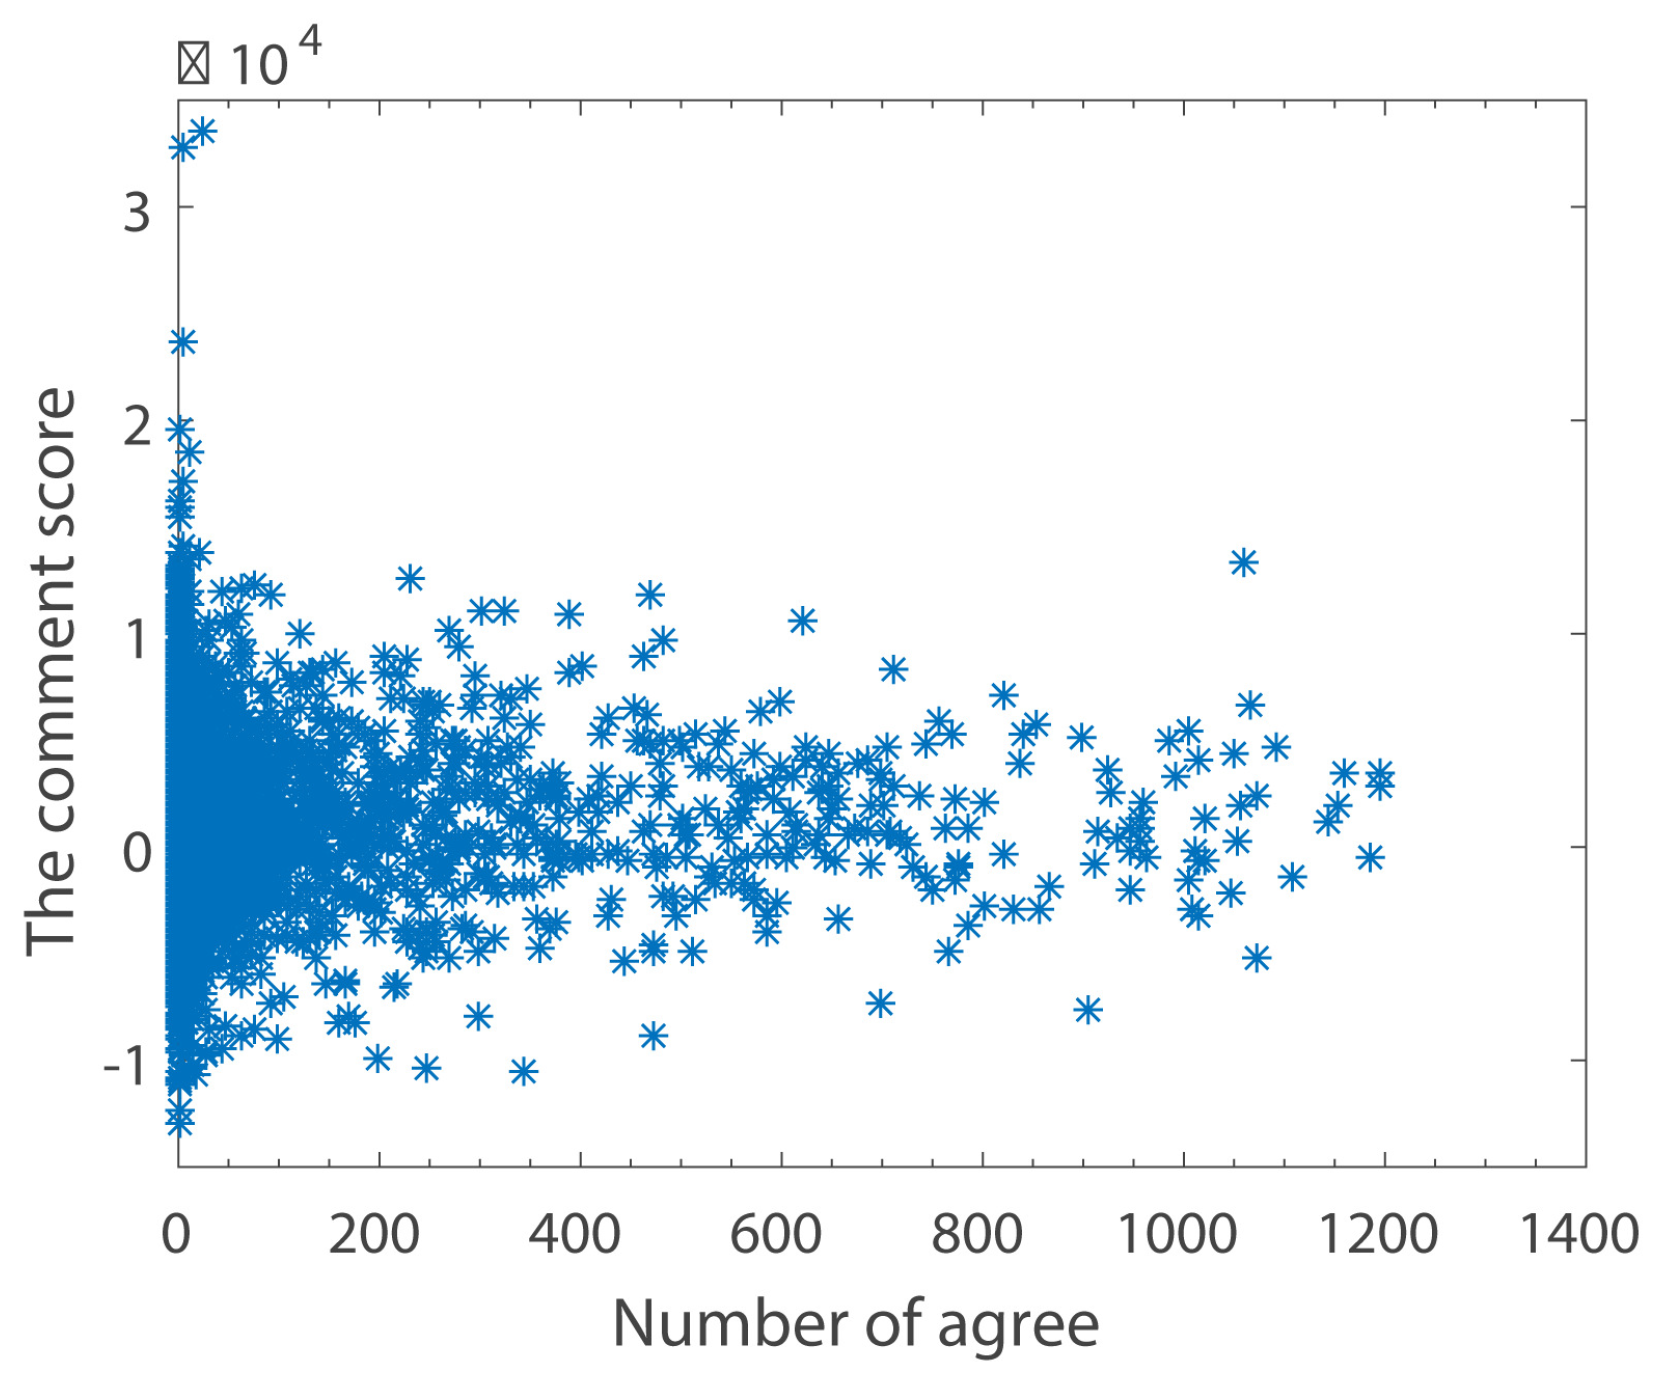
Figure 7 reflects the relationship between the score of comments and the number of clicking agreement for the comment. Because the comment score is too small to show in the figure, we expand the score of all comments by a factor of 1000. This shows that the higher the number of clicking agreements for a comment, the more likely the tendency of the comment sentiment is to be netural, i.e., a score of around 0. If a comment score is larger, then the number of clicking agreements is smaller. In general, however, the number of clicking agreements for positive comments is higher than that for negative comments.
- (2)
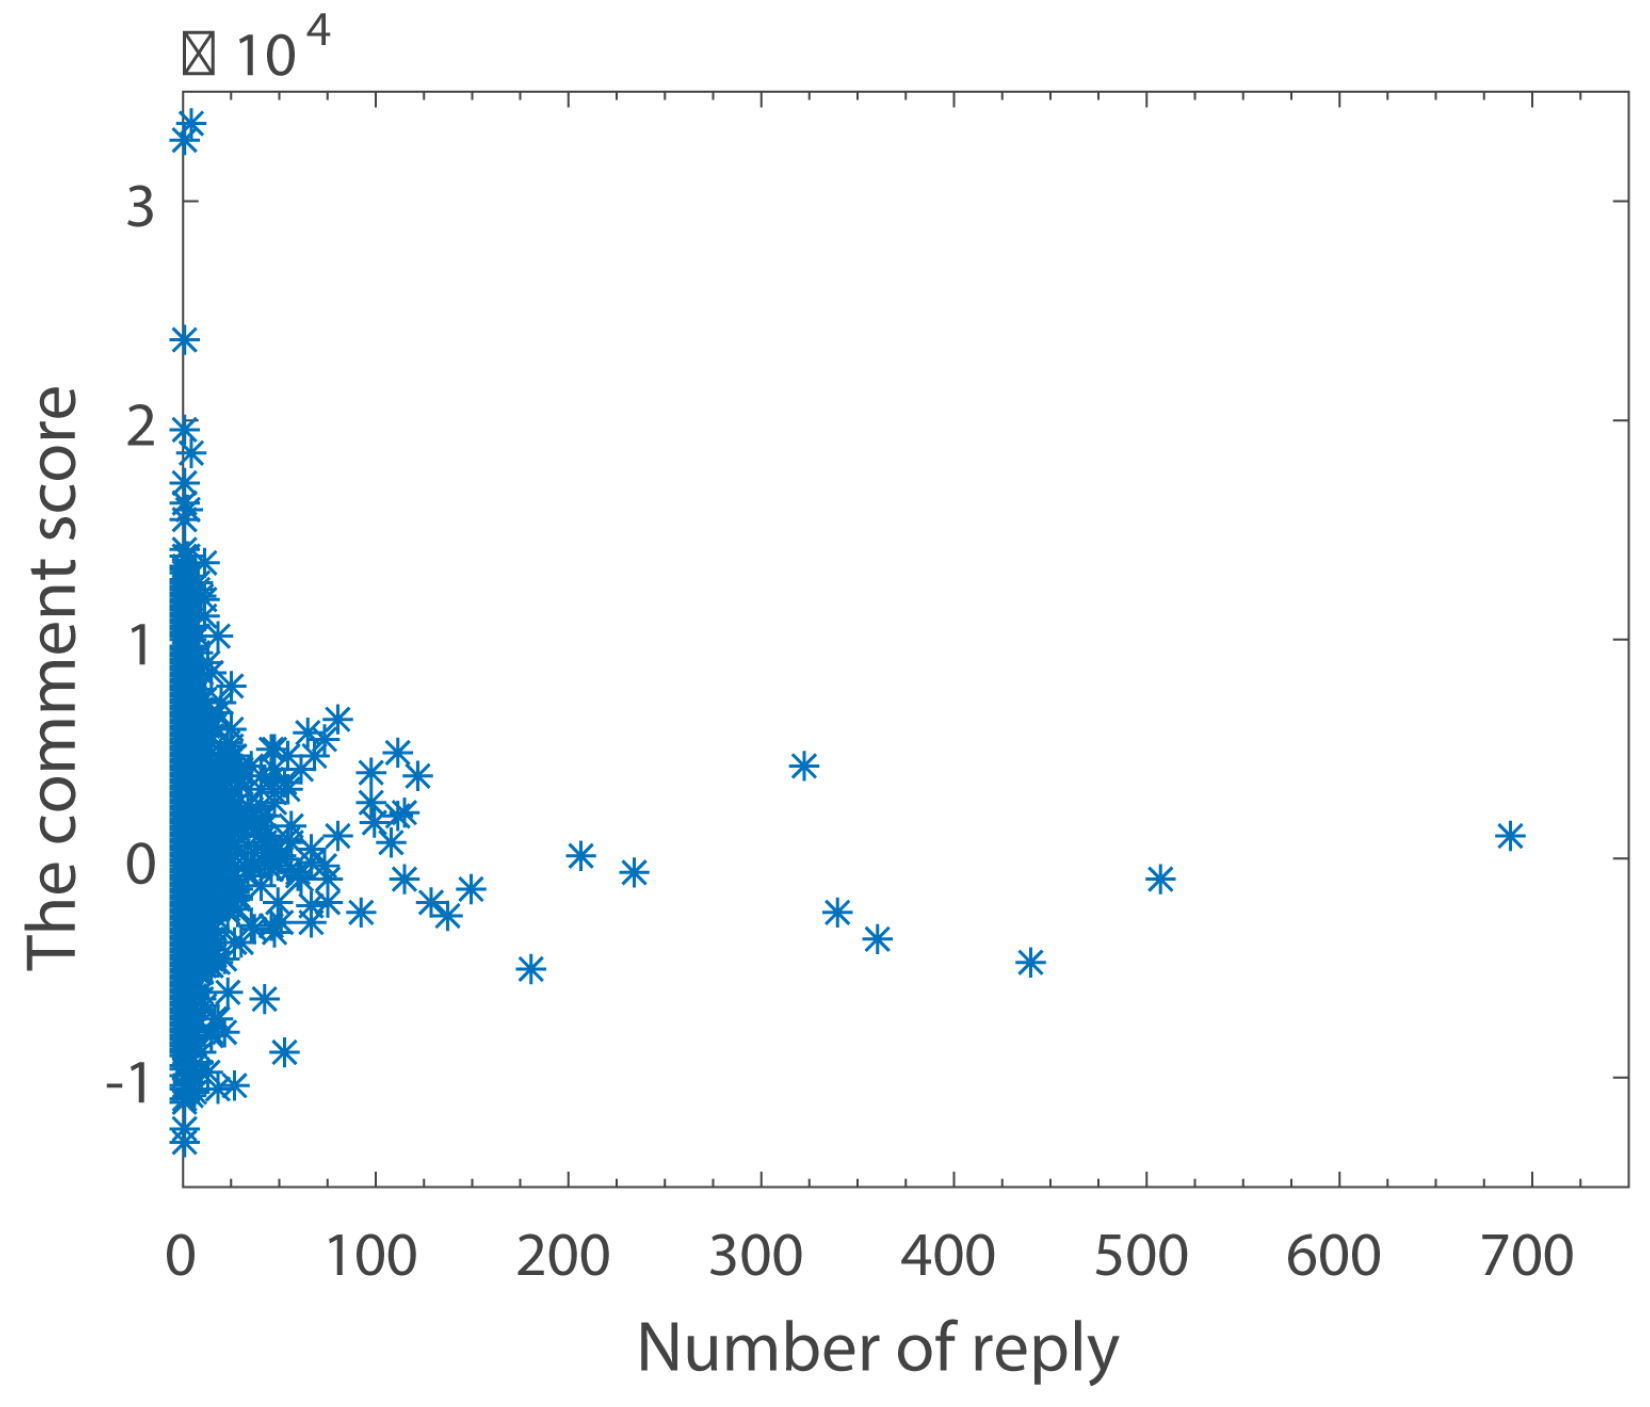
The Relationship between Comment Scores and Number of Replies
Figure 8 is similar to
Figure 7. However, it is obvious that the number of replies is much smaller than the number of clicking agreements.
5.2.3. The Relationship between the Comment Sentiment Score’s Standard Deviation and Time
- (1)
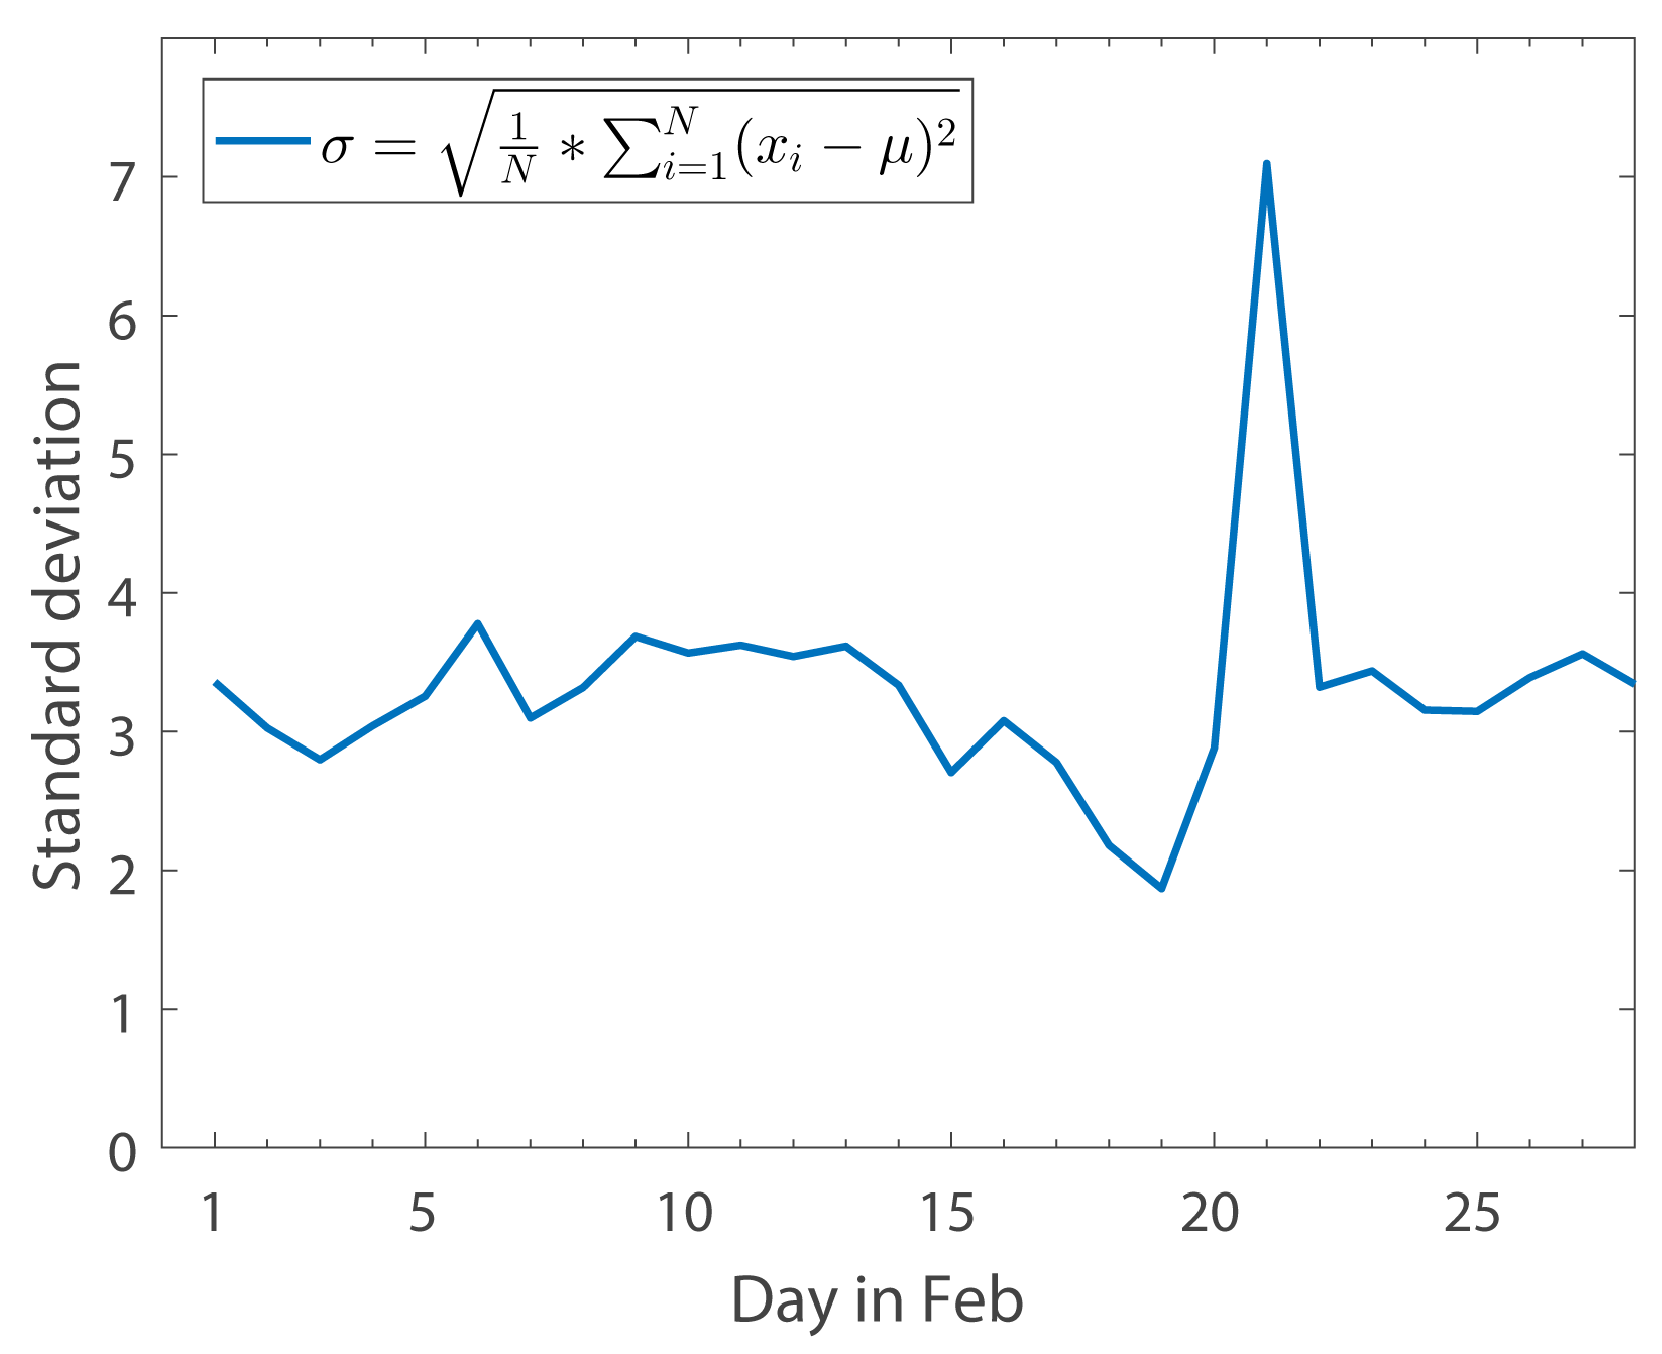
The Relationship between the Standard Deviation of Comment Scores and Time over a Month
Figure 9 shows the relationship between the standard deviation of comment’ sentiment scores and time throughout February 2017. Analysis of the data reveals that the standard deviation of sentiment value tends to be flat or even smaller (as public opinions tend to be similar on the same event; for example, from 16 February to 19 February, the sentiment value of the comments on the “THAAD” event gradually returned to a neutral position). However, the standard deviation of comment sentiment scores will rise above normal when the same event is renewed after the news subsides. This is because new updates are published that may present different or even opposite sentimental tendencies to the original one (For example, the standard deviation of sentiment scores is very large in 22 February. After checking the news on 22 February, we find the headline “ROK and US military exercises are in the process, whether THAAD will be able to deploy” and some other relevant news). The reason why we use standard deviation in this part is that standard deviation can reflect the average dispersion of data, which is good at reflecting the divergence in people’s sentiment tendency.
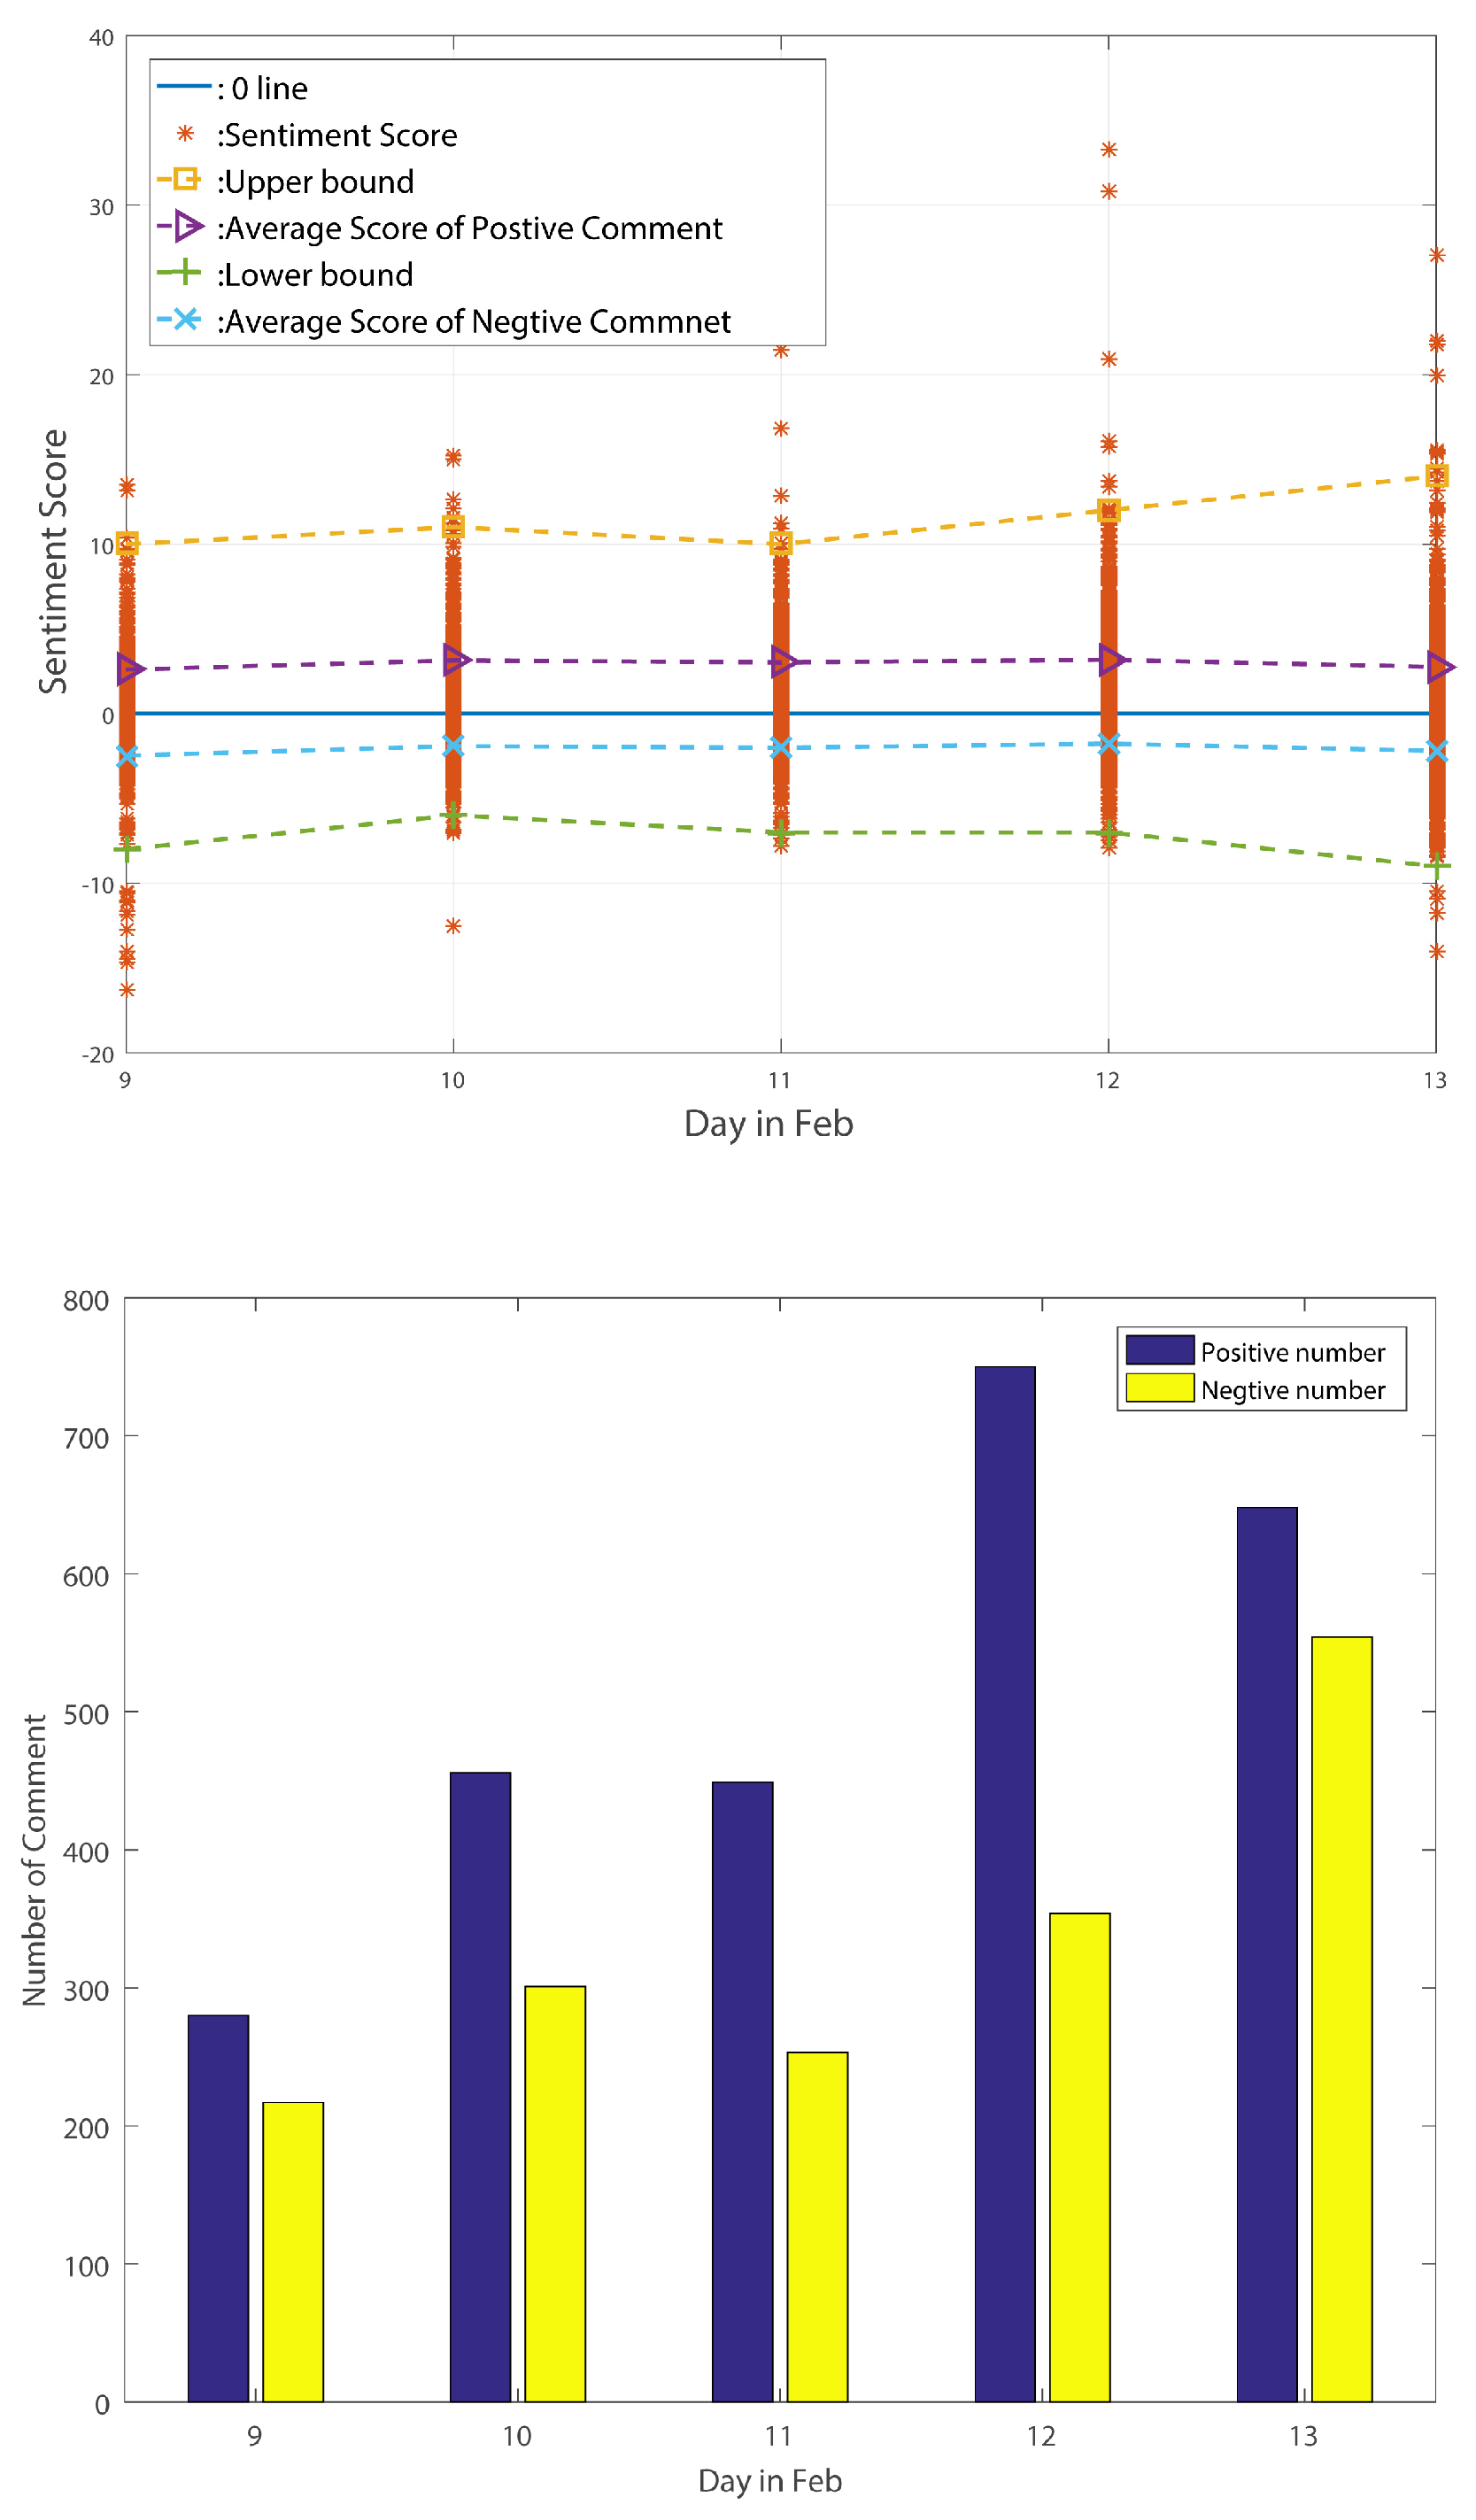
To prove that standard deviation is truly a useful measure of reflecting divergence in public sentiment tendency, we need to analyze the sentiment change tendency in some periods. In this paper, based on
Figure 9, we specifically choose 3 periods: from 9 February to 13 February, from 16 February to 19 February and from 20 February to 24 February. These three periods, reflect sentiment change tendencies of stability, decline and big wave respectively.
The sentiment change tendency and comment numbers for the stable period are shown in
Figure 10.
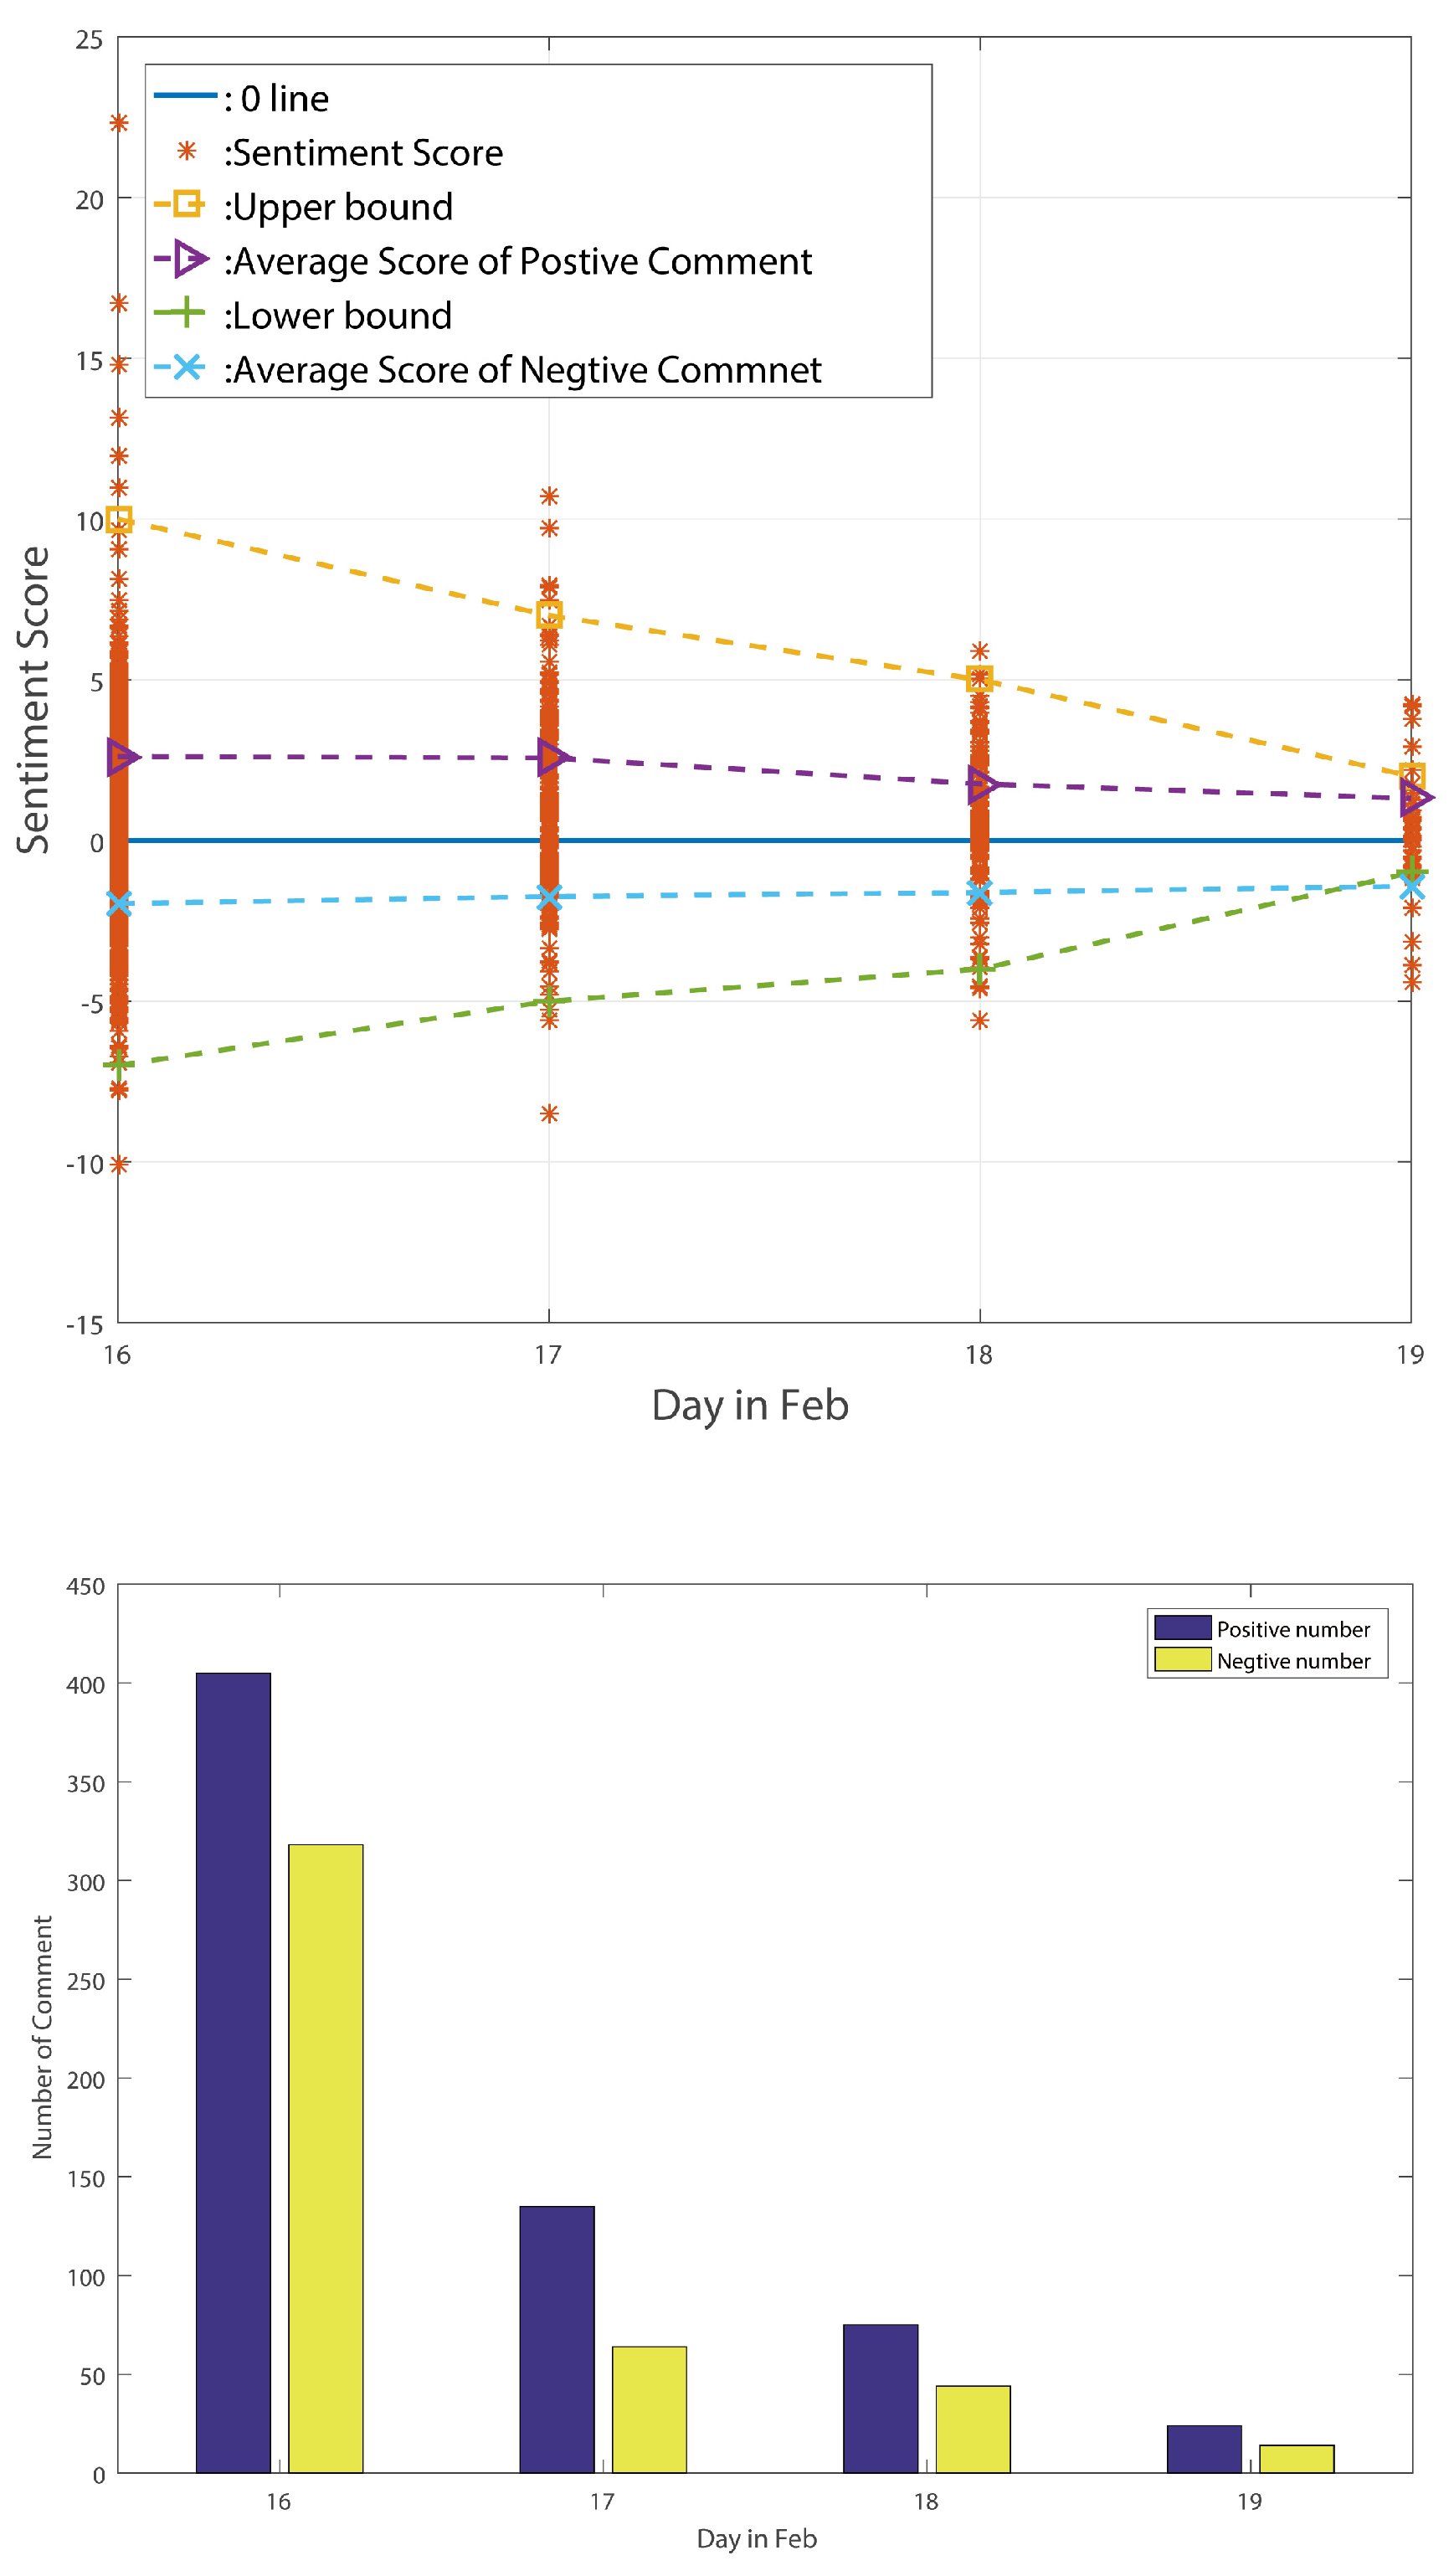
The sentiment change tendency and comment numbers for the decline period are shown in
Figure 11.
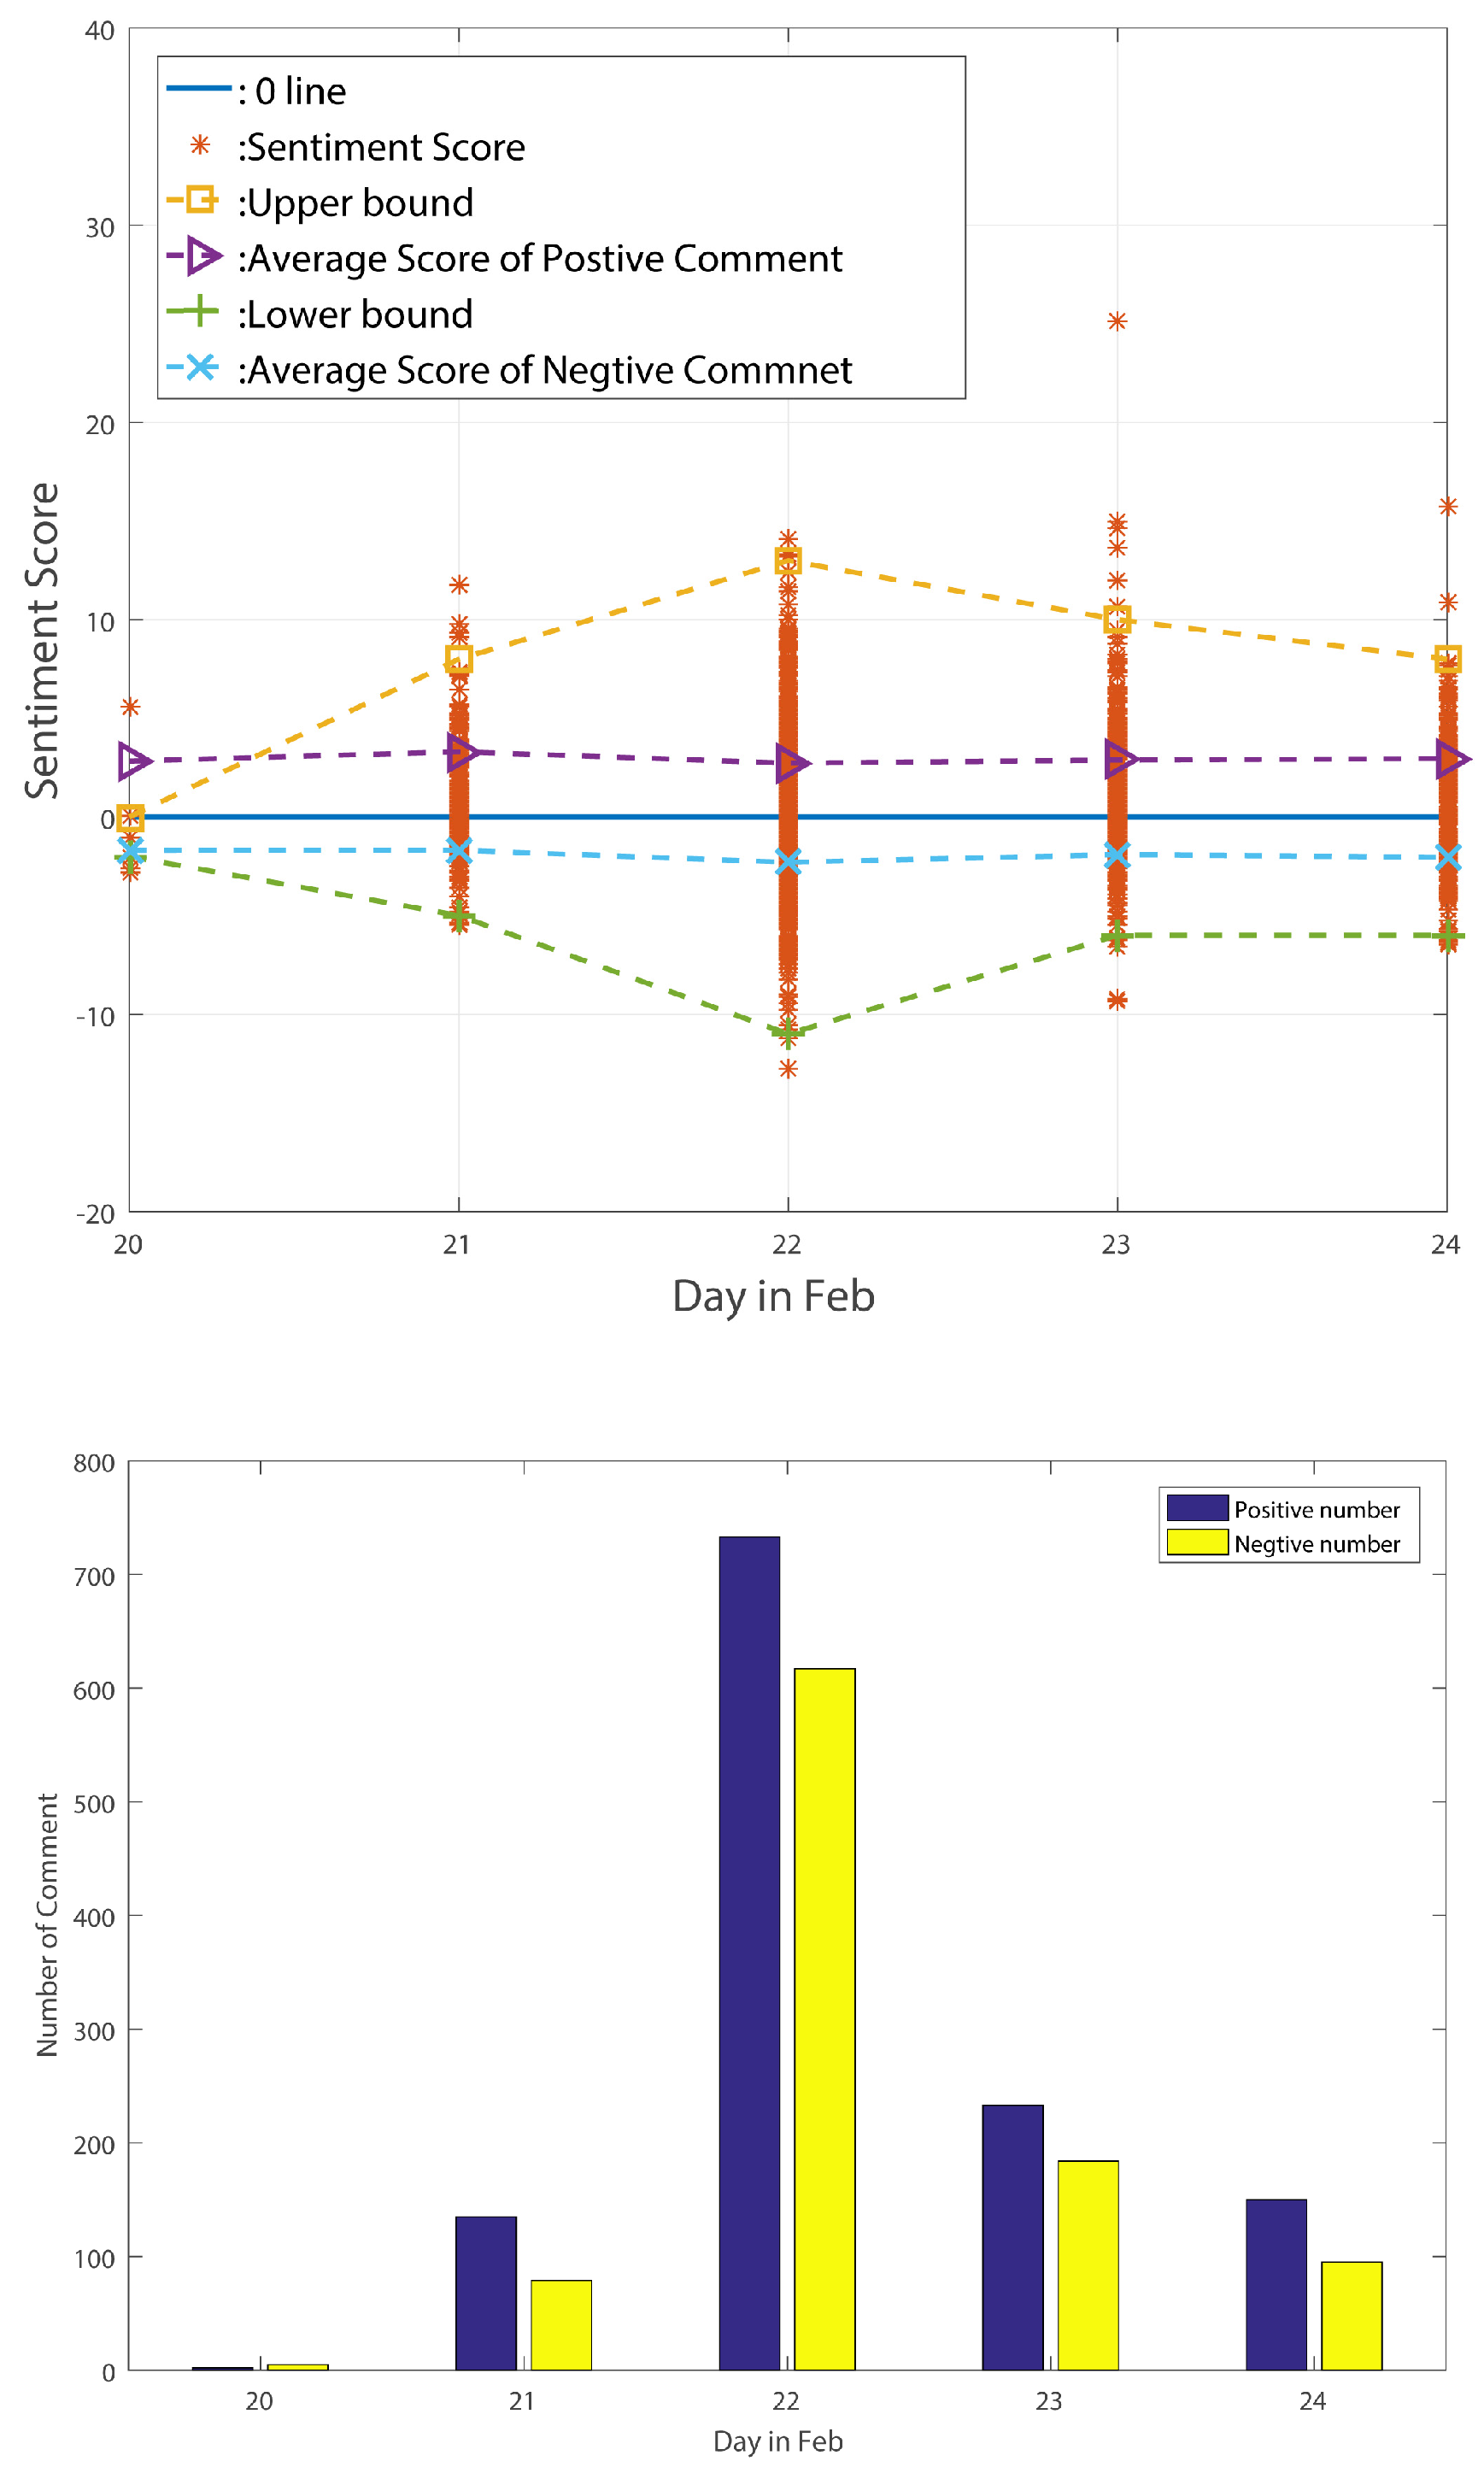
The sentiment change tendency and comment numbers for the big wave period are shown in
Figure 12.
From the above-listed figures, we can find that, for these three different periods, the figures exactly reflect the standard deviation change tendency. After counting the number of comments in these three periods, we find that the number of positive comments is always larger than the number of negative comments. Moreover, the positive comments’ average sentiment scores are larger than the negative comments’ average sentiment scores in the stable period and decline period. In the big wave period, however, the negative average sentiment scores are larger than the positive ones. We can thus point out that average sentiment score is not a useful method of reflecting public sentiment tendency. However, the standard deviation of sentiment values can truly reflect the public’s sentiment tendency according to the above analysis. Meng et al. [
18], used Euclidean distance to judge a node’s reputation; accordingly, we think it may be useful to calculate every point’s Euclidean distance in the standard deviation figure to find hidden social event as quickly as possible.
- (2)
The Relationship between the Standard Deviation of Comment Scores and Time in Another Month
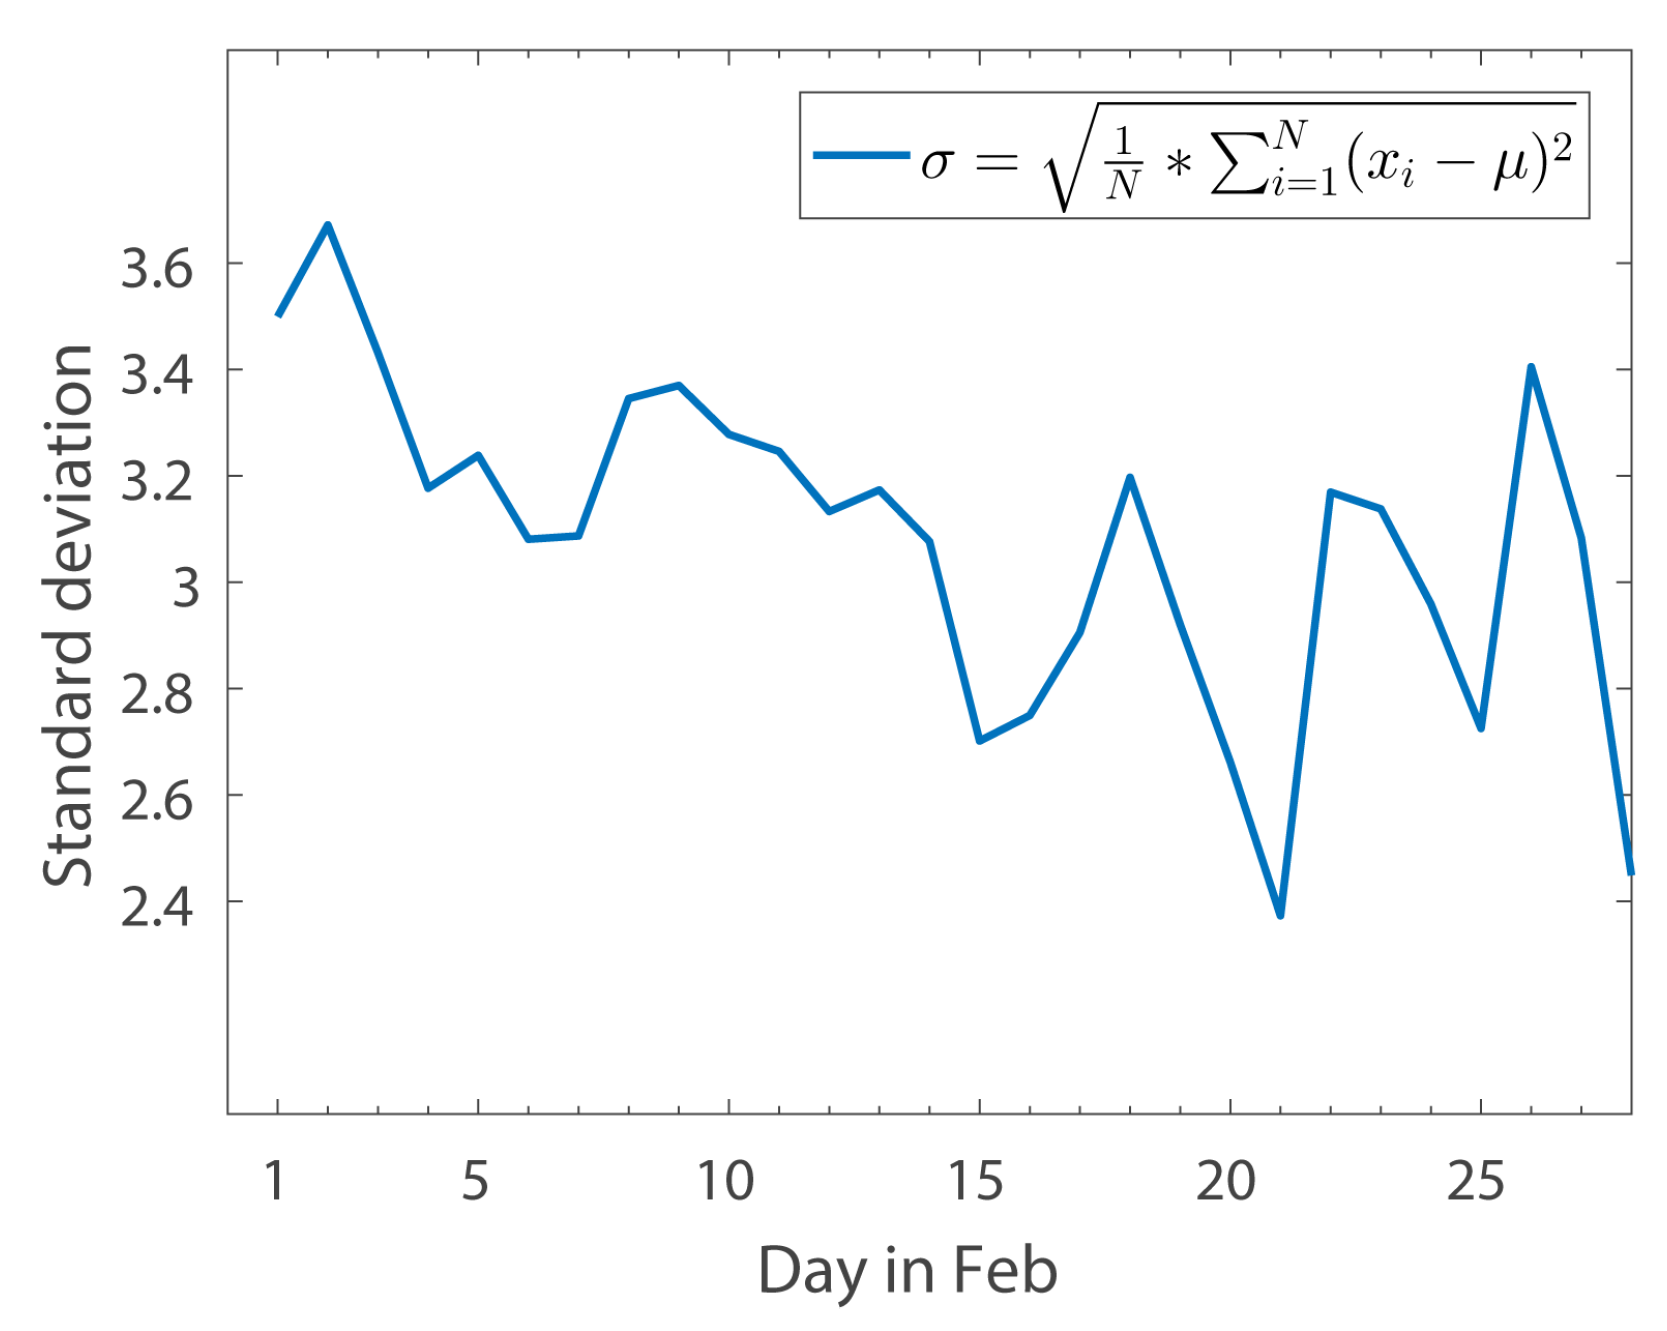
Figure 13 shows the standard deviation distribution of comment scores vs time in March 2017, and has similar characteristics to
Figure 9.
6. Conclusions
In this paper, we propose a novel system for sensing and analyzing forms of application big data such as news comments. We propose a sentiment analysis method based on a mixed sentiment dictionary and new algorithms to calculate the comment sentiment score and classify the comment sentiment tendency. Experimental results show that the mixed sentiment dictionary is more effective at classification of short texts. To analyze short texts using a sentiment dictionary, the average words length should be less than 2.3. We also propose some specific models based on statistics to reflect the public’s behaviors. In so doing, we found that standard deviation is more useful than some other statistics to reflect public sentiment tendency.
From our experiments and analysis, it is concluded that people can use the MoSa system to predict public opinion trends by using comment data. These observations and capabilities can help us to strengthen news recommendation systems, since public opinion can be more accurately assessed by analyzing mobile applications.
Note: This paper is an extended version of our paper published in Proceedings of the 18th International Conference on Algorithms and Architectures for Parallel Processing (ICA3PP), pp. 582–595, 2018 (Zhang et al., 2018) [
16].
Author Contributions
Conceptualization, Y.Z. and W.R.; methodology, Y.Z.; software, Y.Z.; validation, W.R., T.Z. and E.F.; formal analysis, Y.Z.; investigation, Y.Z.; resources, Y.Z.; data curation, Y.Z.; writing-original draft preparation, Y.Z., W.R., T.Z. and E.F.; writing-review and editing, Y.Z., W.R., T.Z. and E.F.; visualization, Y.Z.; supervision, W.R.; project administration, W.R.; funding acquisition, W.R.
Funding
The research was financially supported by Major Scientific and Technological Special Project of Guizhou Province under Grant No. 20183001, Open Funding of Guizhou Provincial Key Laboratory of Public Big Data under Grant No. 2018BDKFJJ009, 2017BDKFJJ006, and Open Funding of Hubei Provincial Key Laboratory of Intelligent Geo-Information Processing with under Grant No. KLIGIP2016A05.
Acknowledgments
We also thanks for the comments from Wenting Jiang, Shaorui Lin, Yingqian Liao, Min Lei and Wei Bi.
Conflicts of Interest
The authors declare no conflict of interest.
References
- Cai, J.; Wang, Y.; Liu, Y.; Luo, J.Z.; Wei, W.; Xu, X. Enhancing network capacity by weakening community structure in scale-free network. Future Gener. Comput. Syst. 2018, 87, 765–771. [Google Scholar] [CrossRef]
- Jing, Y.; Shiping, L. Emotion Analysis on Text Words and Sentences based on SVM. Comput. Appl. Softw. 2011, 28, 225–228. [Google Scholar]
- Na, F.; Yisheng, A.; Huixian, L. Research on analyzing sentiment of texts based on k-nearest neighbor algorithm. Comput. Eng. Des. 2012, 33, 1160–1164. [Google Scholar]
- Zhiming, L.; Lu, L. Empirical study of sentiment classification for Chinese microblog based on machine learning. Comput. Eng. Appl. 2012, 48, 1–4. [Google Scholar]
- Hui, S.; Daiping, J.; Pei, M. Improved information gain text feature selection algorithm based on word frequency information. Comput. Appl. 2014, 34, 3279–3282. [Google Scholar]
- Wu, H.C.; Luk, R.W.P.; Wong, K.F.; Kwok, K.L. Interpreting TF-IDF term weights as making relevance decisions. ACM Trans. Inf. Syst. 2008, 26, 55–59. [Google Scholar] [CrossRef]
- Popescu, A.M.; Etzioni, O. Extracting Product Features and Opinions from Reviews. In Proceedings of the Conference on Human Language Technology and Empirical Methods in Natural Language Processing (HLT ’05), Vancouver, BC, Canada, 6–8 October 2005; pp. 32–33. [Google Scholar]
- Yongmei, Z.; Jianeng, Y.; Aimin, Y. A method on building Chinese sentiment lexicon for text sentiment analysis. J. Shandong Univ. Eng. Sci. 2013, 43, 27–33. [Google Scholar]
- Delan, X.; Juming, C.; Shengli, T. orientation research based on HowNet. Comput. Eng. Appl. 2008, 44, 143–145. [Google Scholar]
- Dong, Z.; Dong, Q. Hownet and the Computation of Meaning; World Scientific Publishing Co., Inc.: Singapore, 2006; p. i. [Google Scholar]
- Zhengyu, W.; Zeheng, W.; Fangtao, H. Words Sentiment Polarity Calculation Based on HowNet and PMI. Comput. Eng. 2012, 38, 187–189. [Google Scholar]
- Xiaopin, Y.; Fengqi, M.; Li, Y.; Yuting, M.; Jianan, W.; Yue, Z. Gauging Public Opinion with Comment-Clusters. New Technol. Libr. Inf. Serv. 2016, 32, 51–59. [Google Scholar]
- Wei, W.; Yang, X.; Qian, C. Survey on Chinese text sentiment analysis. J. Comput. Appl. 2011, 31, 3321–3323. [Google Scholar]
- Zhao, Y.Y.; Qin, B.; Liu, T. Sentiment Analysis. J. Softw. 2010, 21, 1834–1848. [Google Scholar] [CrossRef]
- Yijin, C.; Shujin, C.; Guihong, C. Online Public Opinion Mining: User’s Sentiment Analysis. Doc. Inf. Knowl. 2013, 90–96. [Google Scholar] [CrossRef]
- Zhang, Y.; Ren, W.; Zhu, T.; Bi, W. MoSa: A Modeling and Sentiment Analysis System for Mobile Application Big Data. In Algorithms and Architectures for Parallel Processing; Vaidya, J., Li, J., Eds.; Springer: Cham, Switzerland, 2018; pp. 582–595. [Google Scholar]
- Linhong, X.; Hongfei, L.; Yu, P.; Hui, R.; Jianmei, C. Constructing the Affective Lexicon Ontology. J. China Soc. Sci. Tech. Inf. 2008, 27, 180–185. [Google Scholar]
- Meng, W.; Li, W.; Wang, Y.; Au, M.H. Detecting insider attacks in medical cyber–physical networks based on behavioral profiling. Future Gener. Comput. Syst. 2018. [Google Scholar] [CrossRef]
Figure 1.
Relationship between sentence and opinion sentence.
Figure 1.
Relationship between sentence and opinion sentence.
Figure 2.
Relationship between sentence and paragraph.
Figure 2.
Relationship between sentence and paragraph.
Figure 3.
Using the Word2Vec model to verify the effects of similarity.
Figure 3.
Using the Word2Vec model to verify the effects of similarity.
Figure 4.
Relationship between month and number of comments.
Figure 4.
Relationship between month and number of comments.
Figure 5.
Relationship between month and number of comments in February and March.
Figure 5.
Relationship between month and number of comments in February and March.
Figure 6.
Relationship between number of comments and time of day.
Figure 6.
Relationship between number of comments and time of day.
Figure 7.
The relationship between the number of clicking agreements and the comment score.
Figure 7.
The relationship between the number of clicking agreements and the comment score.
Figure 8.
Relationship between number of replies and comment score.
Figure 8.
Relationship between number of replies and comment score.
Figure 9.
The standard deviation of comment scores over time in February.
Figure 9.
The standard deviation of comment scores over time in February.
Figure 10.
Sentiment change tendency in stable period with comment number in this period. (Up): shows the sentiment change tendency of comment in stable period; (Down): shows the trend in the number of positive and negative comments in stable period.
Figure 10.
Sentiment change tendency in stable period with comment number in this period. (Up): shows the sentiment change tendency of comment in stable period; (Down): shows the trend in the number of positive and negative comments in stable period.
Figure 11.
Sentiment change tendency in decline period with comment number in this period. (Up): shows the sentiment change tendency of comment in decline period; (Down): shows the trend in the number of positive and negative comments in decline period.
Figure 11.
Sentiment change tendency in decline period with comment number in this period. (Up): shows the sentiment change tendency of comment in decline period; (Down): shows the trend in the number of positive and negative comments in decline period.
Figure 12.
Sentiment change tendency in big wave period with comment number in this period. (Up): shows the sentiment change tendency of comment in big wave period; (Down): shows the trend in the number of positive and negative comments in big wave period.
Figure 12.
Sentiment change tendency in big wave period with comment number in this period. (Up): shows the sentiment change tendency of comment in big wave period; (Down): shows the trend in the number of positive and negative comments in big wave period.
Figure 13.
The standard deviation of comment score with time in March.
Figure 13.
The standard deviation of comment score with time in March.
Table 1.
Using the Word2Vec model to verify the effects of similarity.
Table 1.
Using the Word2Vec model to verify the effects of similarity.
| Word2Vec Model 1 | Word2Vec Model 2 | Word2Vec Model 3 |
|---|
| similar word | similarity | similar word | similarity | similar word | similarity |
| our country | 0.591204226017 | our country | 0.591191768646 | our country | 0.456856787205 |
| ourselves | 0.567599773407 | ourselves | 0.567157268524 | ourselves | 0.443490803242 |
| moral integrity | 0.454989075661 | moral integrity | 0.451166421175 | greater China | 0.41534230113 |
| we | 0.442545235157 | we | 0.436943858862 | foreigner | 0.374125093222 |
| unity | 0.429398208857 | foreigner | 0.427167743444 | mainland | 0.345852255821 |
| foreigner | 0.428709596395 | unity | 0.425999909639 | we | 0.341952651739 |
| mainland | 0.424053996801 | harm | 0.421460360289 | moral integrity | 0.332326203585 |
| harm | 0.422680199146 | mainland | 0.420773893595 | motherland | 0.321983605623 |
| us | 0.403672665358 | greater China | 0.409728199244 | harm | 0.321355491877 |
| greater China | 0.40215498209 | shoulder the responsibility | 0.397470504045 | unity | 0.314311623573 |
Table 2.
Classification results using Mix dictionary.
Table 2.
Classification results using Mix dictionary.
| | P | R | F |
|---|
| Pos | 0.75 | 0.803 | 0.7755 |
| Neg | 0.823 | 0.77 | 0.795 |
| Neu | 0.65 | 0.67 | 0.659 |
Table 3.
Classification results using TSING dictionary.
Table 3.
Classification results using TSING dictionary.
| | P | R | F |
|---|
| Pos | 0.517 | 0.423 | 0.465 |
| Neg | 0.706 | 0.264 | 0.384 |
| Neu | 0.232 | 0.619 | 0.338 |
Table 4.
Classification accuracy between the two dictionaries.
Table 4.
Classification accuracy between the two dictionaries.
| | MIX Dict | TSING Dict |
|---|
| Accuracy | 0.76 | 0.39 |
Table 5.
Word’s average length in four different dictionaries.
Table 5.
Word’s average length in four different dictionaries.
| | MIX Dict | TSING Dict | NTU Dict | DUTIR Dict |
|---|
| Avarage Length | 2.27 | 2.235 | 2.905 | 3.325 |
© 2019 by the authors. Licensee MDPI, Basel, Switzerland. This article is an open access article distributed under the terms and conditions of the Creative Commons Attribution (CC BY) license (http://creativecommons.org/licenses/by/4.0/).


