1. Introduction
A major challenge in the scientific field in recent years is skin cancer. Among the types of skin cancers, melanoma is the most aggressive. It has a greater capacity to spread to other organs; thus, it is responsible for the highest death rate even with its low incidence [
1,
2]. The increased incidence of skin cancer comes from excessive exposure to the sun, especially in individuals with fair skin, which, in addition to causing premature aging, can cause pre-malignant and malignant lesions. Among the various types of skin cancers, melanoma (see
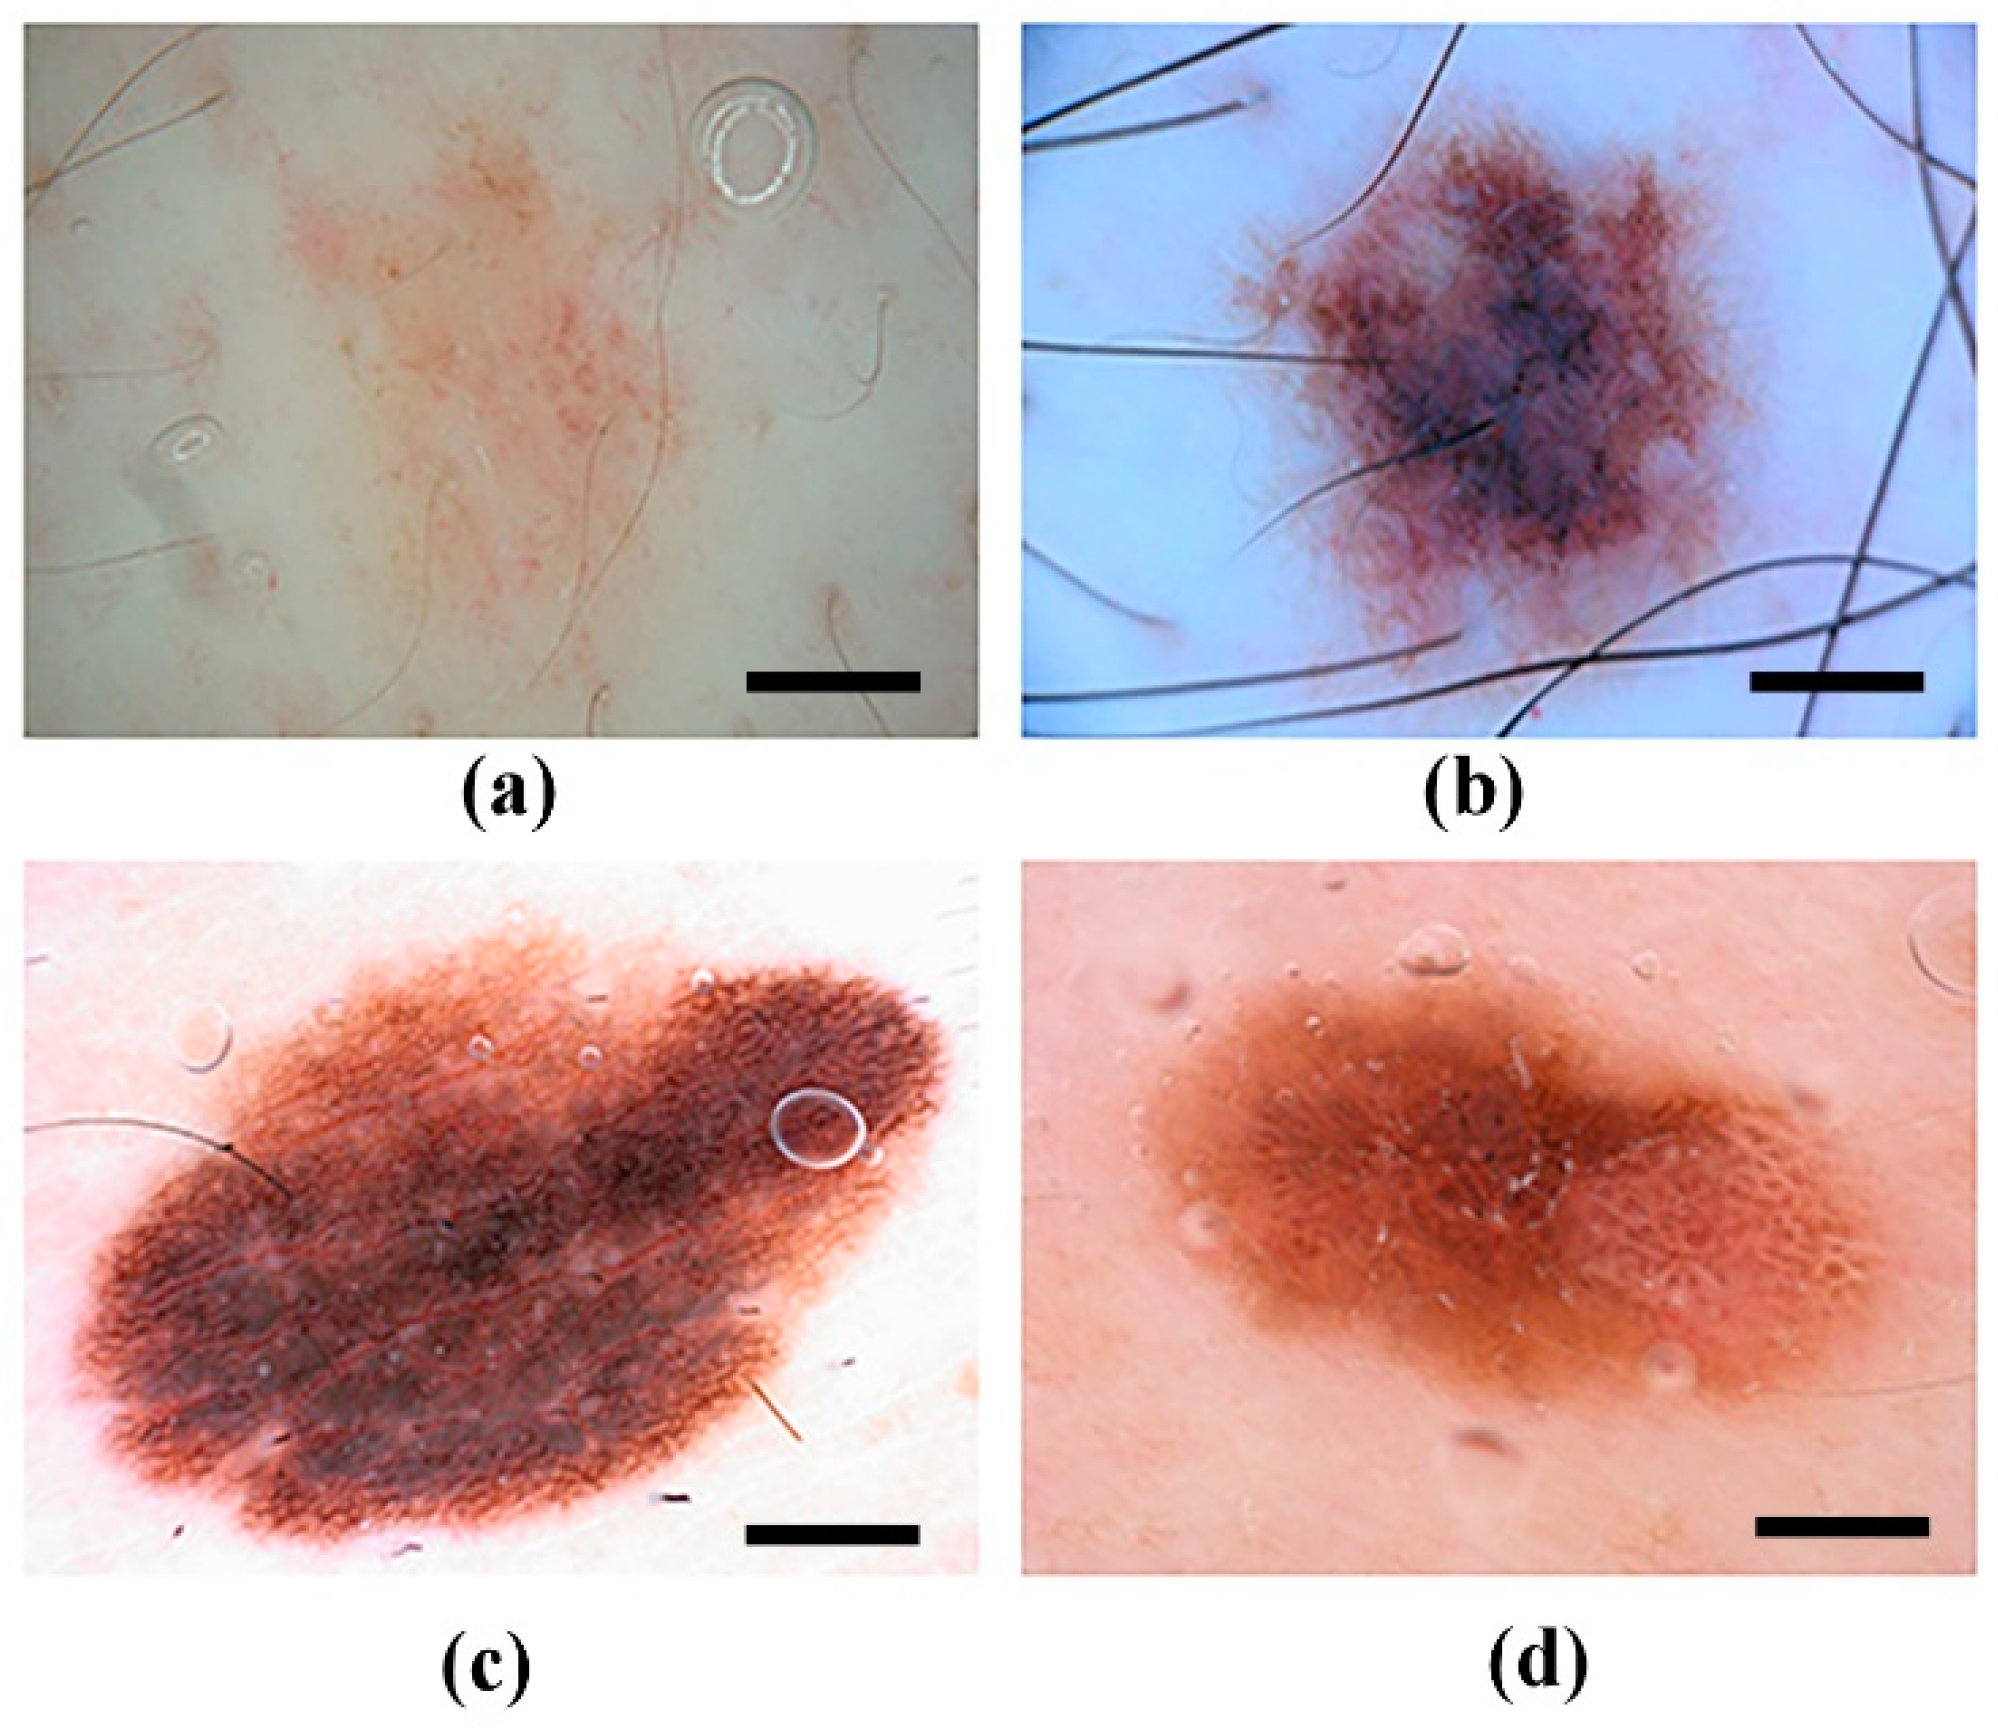
Figure 1) is the least common and at the same time the most worrying for its ability to spread to other parts of the body, even when the lesion is still small [
3].
In the initial stage, which is where there is greater possibility of cure, a prior diagnosis is necessary, but this is hampered by human visual factors, such as visual fatigue, often resulting in failure in the demarcation of the lesion. The automatic segmentation of the area of interest of the image is necessary in order to obtain a precision of the contour reducing the occurrence of errors, besides being essential for the other stages of extraction and classification of the skin lesion. It is very important how an image is processed because it is from it that a given case can be diagnosed in time for a possible cure [
3,
6,
7].
It is possible to define an approach for this type of skin cancer through digital image processing techniques. This approach will provide reliability and agility in the diagnosis for those skilled in the art. The areas of digital image processing applications increasingly require methods capable of highlighting the information contained in the images for human interpretation and analysis [
8].
A better prognosis of the disease is associated with its early diagnosis, that is, early detection (in situ melanoma). The lesion at a more advanced stage, that is, after its infiltration into the lower layers of the skin, results in a great possibility of metastasis with almost no cure. This causes skin cancer to have the highest mortality rate compared to other non-melanoma tumors [
6,
7,
8].
The vast majority of melanoma diagnosis methods are based on the so-called ABCD rule, in which physical factors observed in the lesions are analyzed, such as asymmetry, border, staining, and diameter. This methodology was first proposed by Wilhelm Stolz in 1994 [
9] due to the difficulty of early diagnosis of melanoma and its common confusion with benign nevi and pints (in the early stages).
A unique apparatus termed dermatoscopic is employed to estimate the chance of types of skin cancer [
6,
7,
8]. Dermatoscopy is a noninvasive technique for the recognition of superficial structures of the skin and serves for magnification (up to 400×) and evaluation of cutaneous tissue images. The parameters of the ABCD rule can be observed through the dermatoscope, requiring a certain degree of experience and knowledge from its operator, which is a differential, but subjective factor in the task of classifying skin tumors based on visual signals (images) [
9,
10]. Since each presentation of skin cancer has its own characteristics as to form and color, each exam has as a first step to differentiate melanocyte lesions from non-melanocytes, and later to classify them as benign, malignant, or suspect. Early research on automatic systems to estimate the chance of skin cancer used dermoscopy images [
11]. These images are required for the partition algorithm program for dermoscopy images of skin cancer. The most segmentation algorithms use dermoscopy images, which have a higher difference between the lesion and skin space. The segmentation algorithmic program operates to identify the state of the boundary lesion [
12,
13]. The skin cancer segmentation algorithm program must be correct because the segmentation is employed as an associate for distinguishing and extraction in the malignant classification algorithms. The automatic segmentation of the area of interest of the image is necessary in order to obtain a precision of the contour reducing the occurrence of errors, besides being essential for the other stages of extraction and classification of the skin lesion. Segmenting from the lesions’ region for the digital images may have a disadvantage because of color deviation. The existence of color deviation will have an unconstructive shock on the segmentation and classification. Segmentation algorithms are needed to implement color alteration [
7,
14]. For the skin cancer images, there are different kinds of segmentation rules that have been developed [
15].
One more method for the detection of the skin cancer is to work on the skin surface information because traditional skin and lesion regions have completely different skin surfaces. Hwang et al. [
14] used texture features based on the G-means clustering method to segment skin cancer region.
The work of Moss et al. [
16] focused on the characteristic skin tumor margins; the margin being the initial and most significant characteristic to spot. Melanoma margins and exterior contours are moderately simply identified by the human observer; however, automatic margin findings may be a complex problem. For example, lesion image segmentation is an extremely difficult problem because of the numerous details.
Figure 1 shows different dermoscopy images with various deviations and artifacts. On the other hand, segmentation is challenging because of the great variety of lesion forms, dimensions, the presence of dark hair and colors along with various skin types and textures [
4,
5].
Harald Ganster, et al. [
17] developed a computerized method for detecting malignant melanoma close to the first stage. In the preliminary stage, essential segmentation approaches are applied simultaneously to work out the binary mask of the melanoma. Then, to work out the melanoma of the skin, the local and global limitations are evaluated. Richard et al. [
18] advance a technique of image segmentation that explains a technique for the selection of margins. These techniques are theoretically straightforward and used to handle the loud noise and are appropriate for round images [
10,
19]. The artificial skin lesion merging (ASLM) method is implemented by Pennis and Bloisi [
13], which consists of four steps for the process of image segmentation by considering the different types of skin lesion and its dimensions and color. The analysis of melanoma detection for this method has the best sensitivity and higher accuracy when compared to other methods used for PH2 (Pedro Hispano Hospital Datasets) [
15]. One of the method’s detections of the melanoma skin cancer is segmentation by utilizing a mixture of STOLZ and OTSU technologies. This method is used to obtain optimum results of this processing including ABCDE parameters and classifying the types of skin cancer (lesion cancer). Silveira et al. [
11] introduced a comprehensive comparative analysis of different segmentation methods for detecting skin cancer lesions.
Barata et al. [
20] used color constancy to improve the dermoscopy image categorization for the skin lesions detection method. In Reference [
13], the intuitive mining feature from two different database images has been studied using the machine learning method. Yuan et al. [
14] presented a skin lesion segmentation technique by using deep Fully Convolutional Network (FCN) that can segment three samples of skin lesions (for example, healthy moles and unhealthy moles). Al-masni et al. [
21] used various dermoscopy datasets for a skin lesion full resolution convolutional network (FrCN) for a better performance when compared with existing methods of melanoma detection that leads to an enhancement in the segmentation analysis. The results in Reference [
6] established that social group optimization (SGO) is very active in extracting lesion sectors from hairy skin tumor images compared to the alternatives studied for detection accuracy. Guo et al. [
22] used region growing and neutrosophic clustering algorithms to detect melanoma from ISIC 2017 dataset images (International Symposium on Biomedical Imaging). W. Abbes et al. [
23] utilized the bag of words (BOW) model in semantic annotation based on Support Vector Machines (SVM) classifier to develop the automatic skin lesion categorization. In Reference [
24], new boundary features are presented based on the color variation of the pigmented lesion images to influence higher performance in skin tumor diagnosis with the multilayer perceptron neural network. Menegola et al. [
25] used knowledge transfer learning for skin tumors lesion screening with deep learning to reach high confidence, whereas for difficult lesions performance is still little better than chance. Xie et al. [
26] developed a new algorithm with a self-generating neural network (SGNN) and features descriptive of the tumor color to get high accuracy with the classifier model for melanomas and benign case. Oliveira et al. [
27] evaluated various categories of the classifier of the feature extraction phase and several feature selection algorithms were compared for the categorization of melanoma.
The contribution of this paper was to develop melanoma detection using the artificial bee colony (ABC) algorithm [
28]. In this work, three steps were used to detect the melanoma in the dermoscopy images. In the pre-processing step, the red channel of the colored dermoscopy image was selected. For smoothing, 2D median filter with size 20 × 20 and morphological filtering based on Gaussian kernel was used. In the next step, the ABC algorithm was used to find the optimum threshold value for the melanoma segmentation. Finally, the estimated optimum threshold value was used for the melanoma segmentation like the thresholding method as used in the Otsu method [
29]. To show the robustness of this work, the proposed approach was evaluated for four public dermoscopy image datasets: PH2 [
4], ISBI2016 challenge [
5], ISBI 2017 challenge [
30], and Dermis datasets [
31].
2. Materials and Methods
The artificial bee colony algorithm is a swarm-based approach for optimization method, which replicates the smart foraging actions of honey bees [
28]. A group of honey bees is called a swarm, which can effectively complete duties through a social teamwork. The artificial bee colony algorithm can be classified into three kinds of bees: The bees which food search near the food resources in their memory known as worker bees; these bees also communicate the knowledge of the food resources with the second kind of bees known as onlooker bees, which choose the high-quality food sources (fitness food resources). The scout bees are decoded from a small number of worker bees, which dispose of their food resources and look for fresh ones.
The total swarm in the artificial bee colony algorithm is partitioned into two branches. The worker bees occupy the first half of the group of the bees’ sections and the onlooker bees occupy the remaining section of the swarm. The whole solution of the swarm is equivalent to the number of bees (workers or onlookers) [
28].
The random initial populations of the number of worker bees SR solutions of food resources are generated by the artificial bee colony, where SR refers to the number of the group of bees.
Let
Yi = [
Yi,1,
Yi,2,...,
Yi,N] correspond to the
ith solution in the group of bees, and
N is the length size. Every worker bee
Yi, which creates a new contestant resolution
Zi in the locality of its nearby position is represented by the following equation,
where
yk is an arbitrarily elected contestant resolution (
i not equal to
k), j is an arbitrary length index selected from the group, and σ
i,j is an arbitrary number around (−1 to 1). A hungry selection is utilized when the new candidate resolution
Zi is generated. If the fitness value of
Zi is superior to that of its old
Yi, then there is a revision of
Yi with
Zi; otherwise the maintained
yi is fixed.
After the search task has been completed by the all worker bees, they communicate the edible material information resources among the onlooker bees during the vibration motion. An onlooker bee receives this knowledge and calculates the nectar and after that selects an edible material resource beside the possibility associated to its quantity [
29].
The probability selection (
) acts a roulette wheel selection (RWS) method, which is defined by the following equation,
where
Fi means that fitness amount for
ith resolution within the group like observed,
i is a superior resolution, and a greater possibility for
ith an edible material resource being preferred.
When the location is not enhanced more than a limited number of iterations, then the edible material resource is discarded. Suppose that the discarded source is
Yi, so the scout bee determines a fresh edible material resource to reinstate with
Yi by following equation,
While
r is an arbitrary number around (0 to 1) founded on a normal distribution then,
LB the minimum and
UB the maximum limits are the
jth length size, correspondingly [
30,
31].
The steps in the artificial bee colony Algorithm 1 can be explained as:
| Algorithm 1: Artificial Bee Colony Algorithm |
| 1: | Arbitrarily initialize the group of bees. |
| 2: | Update the solution for the initial swarm. |
| 3: | for every worker bee, a new candidate resolution Zi is produced based on Equation (1). Calculate the fitness of Zi and a hunger selection is utilized to select a superior one between Yi and Zi as the new Yi. |
| 4: | Every onlooker bee evaluates Pi based on Equation (2). |
| 5: | Produce a new candidate resolution Zi based on Equation (1) and the present solution (food resource). Calculate the fitness of Zi and a hunger selection is utilized to select a best one between Yi and Zi like the new Yi. |
| 6: | The scout bee finds the discarded Yi, if it stays and updates it with Equation (3). |
| 7: | Update the superlative resolution institute until now, so iteration = iteration + 1. |
| 8: | if the amount of iteration exceeds maximum number of iteration, then |
| 9: | after that stop the process and display the output results; |
| 10: | else |
| 11: | Repeat to the Step 2. |
| 12: | end |
Some algorithms can work to support the detection of skin lesions. One of these improvement approaches is the latest advanced ABC algorithm. Meanwhile, numerous studies have proven that the ABC algorithm obtained higher results in different files compared to other existing meta-heuristic algorithms [
32].
2.1. Methodology for Detection of Melanoma Skin Lesions
The detection of skin lesions is an important and difficult assignment in dermatoscopic images because of numerous truths. The change between the lesion and the avoiding skin is smooth. The pictures captured from digital cameras have shadows that appear associated in masking as the skin lesion. Artifacts such as types of bubbles, multiple colored lesions, specular reflections, presence of hair, uneven illumination, and noise figure are present as a part of dermoscopic pictures.
In this section, the methodology consists of melanoma detection based on the ABC method and is explained step by step.
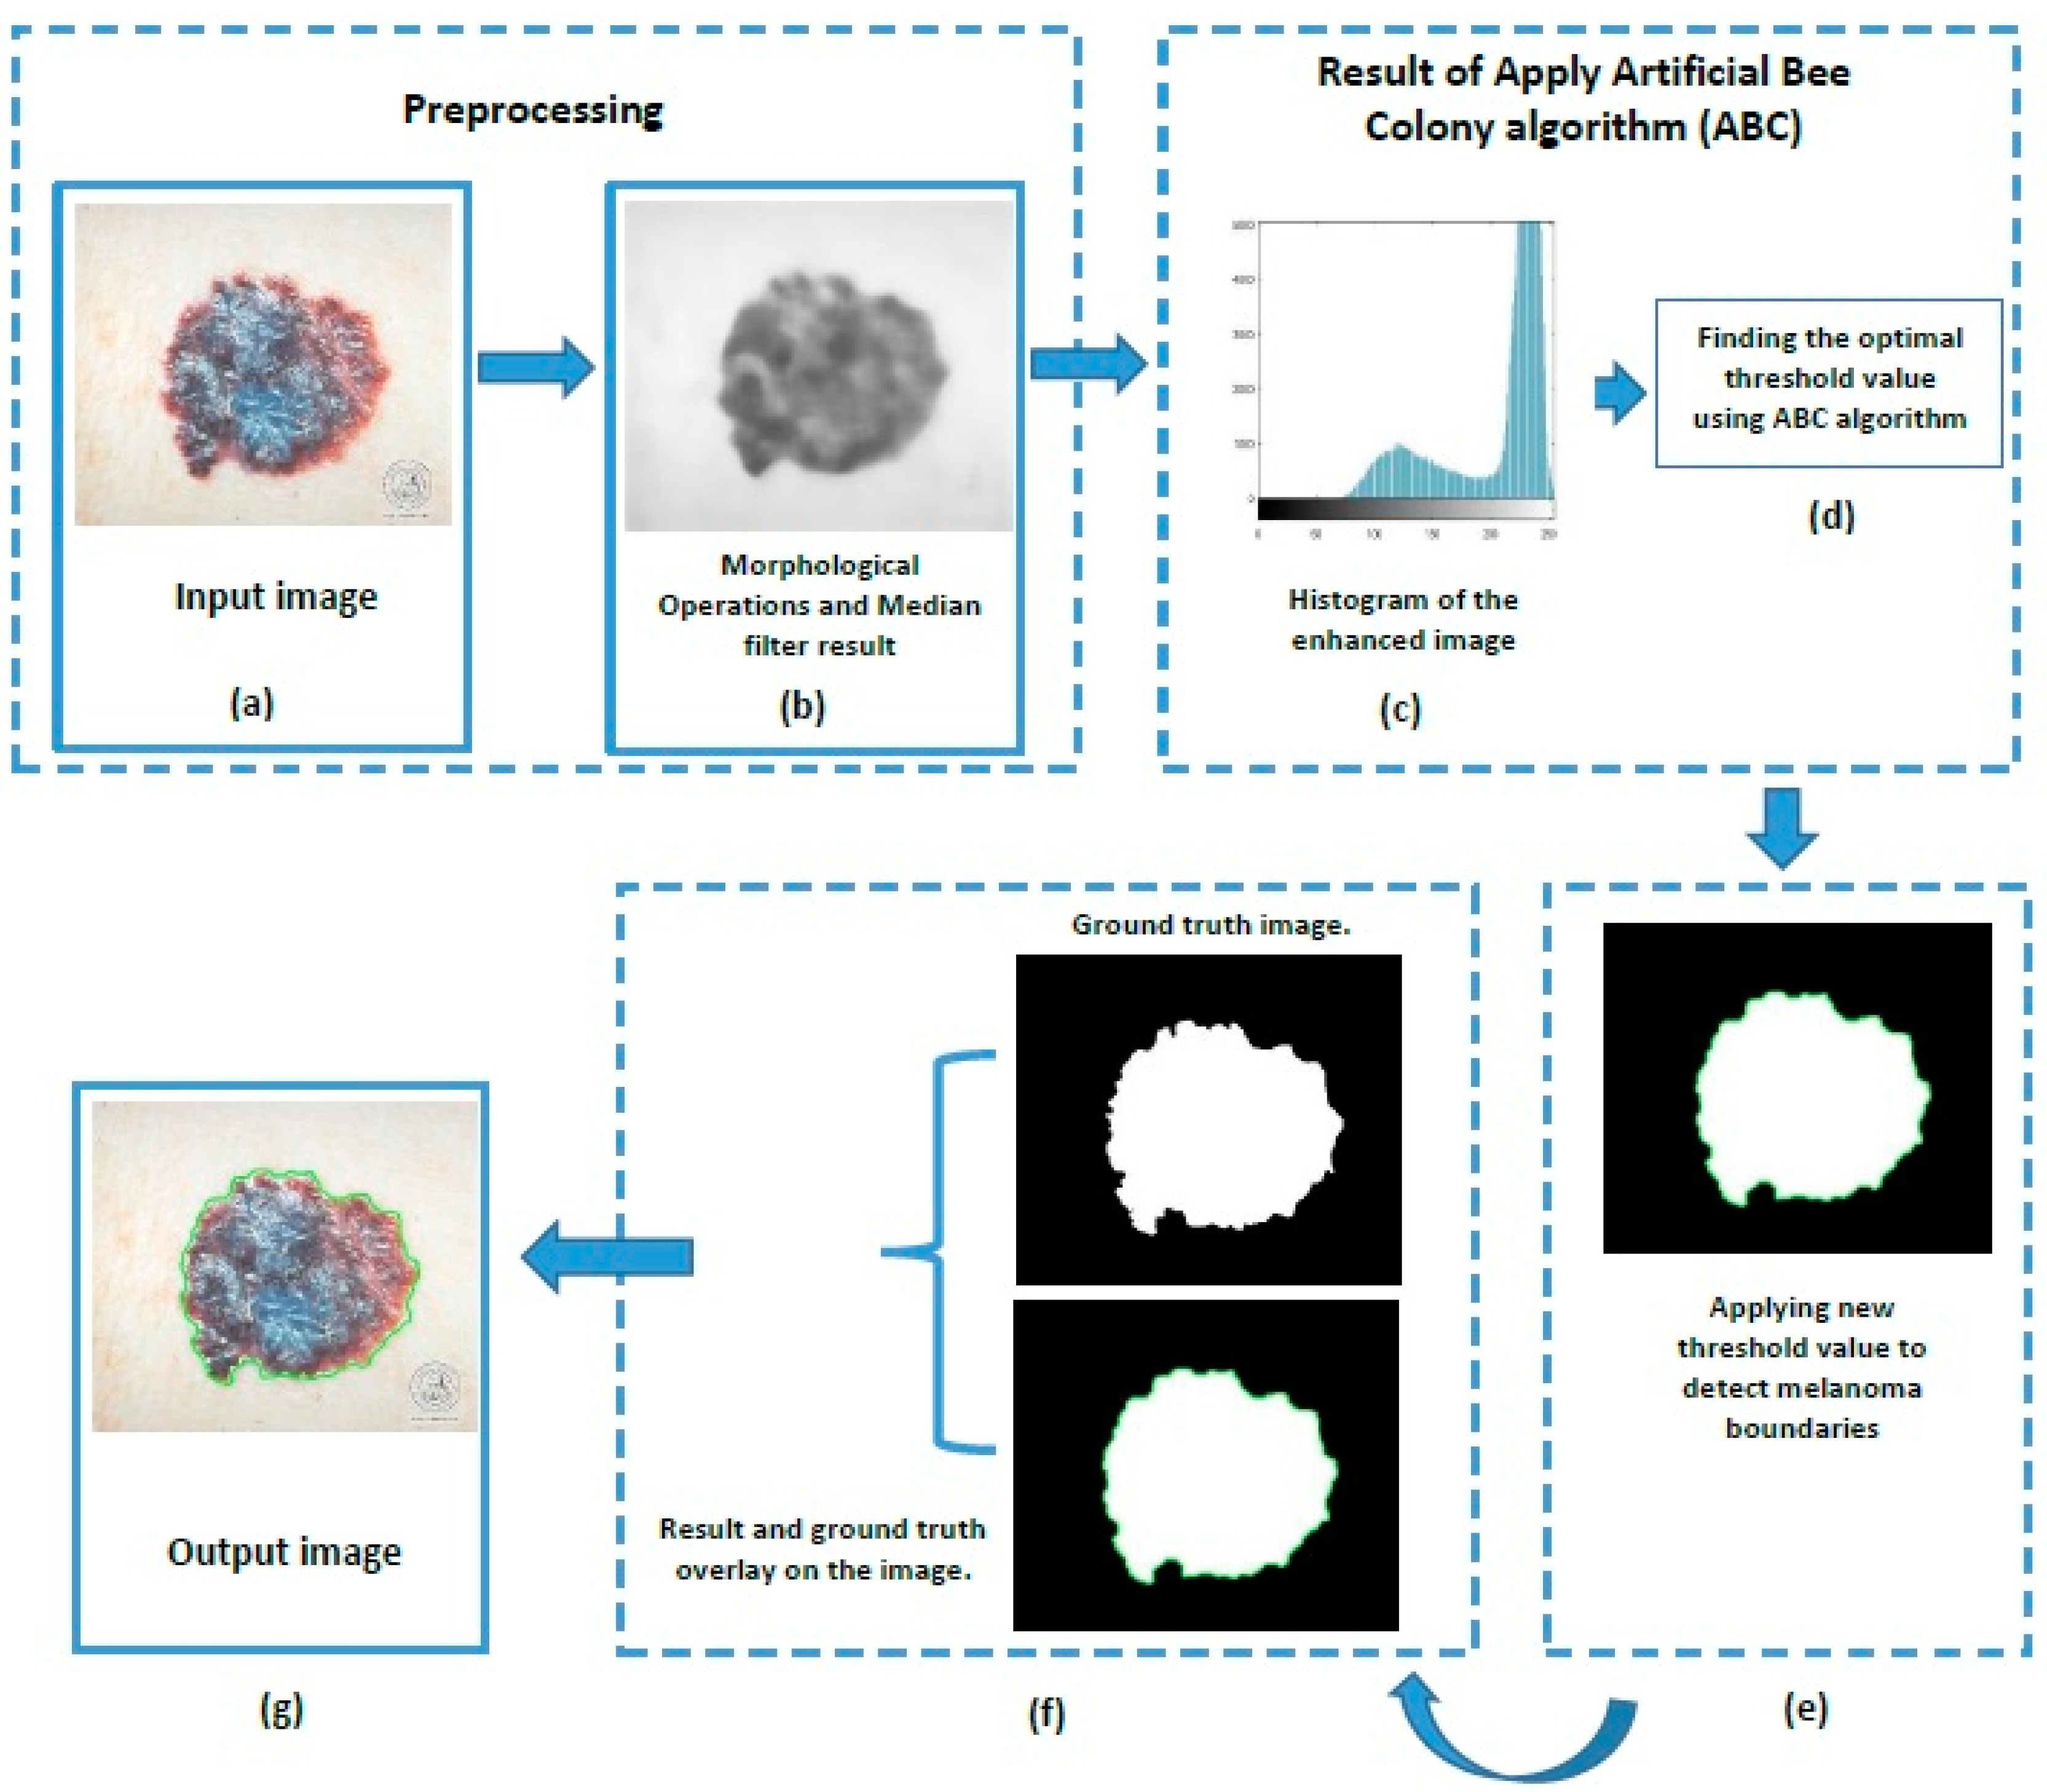
The proposed methodology focuses on extracting the lesion from its context, that is, separating it from the rest of the image without harming its color, geometry, and format. The methodology consists of the topics presented in
Figure 2.
The formation of the database consists of images collected from different sources, which are bases with different types of resolution, lighting, etc. so in pre-processing step, we remove the noise from the images by using morphological filtering. The proposed method needs to reject the unwanted spatial structures, reconstructing or attenuating their proportions in the dermatoscopic images. One of the main elements that can compromise any segmentation system is the ones contained in the lesions [
32].
In the preprocessing step, we use the median filter and morphological filtering based on the Gaussian kernel to eliminate hairs and smooths the image against noise. The morphological filtering aims to improve the colors of the lesion in order to highlight its geometry before the bottom and respecting its shape without deforming it. Median filtering is applied to the gray image and it applies nonlinear function in the image for remove the salt and pepper noise. This method is more efficient than convolution operation and it reduces the noise and safeguards edges in the image. 2D median filter with size 20 × 20 and morphological filtering based on Gaussian kernel was applied to eliminate hairs and smooths the image against noise. This process is implicitly embedded in this step.
Figure 2b illustrates the results of this step. In the next step, the ABC algorithm was used to find the optimal thresholding value based on the histogram of the enhanced image (
Figure 2c,d). By using the optimal thresholding value, we can segment and find the boundaries of the skin lesions. The result of this step was shown in
Figure 2e. For the evaluation of the performance, the achieved result (segmented image) was compared with the ground truth image. Finally, the result and ground truth were overlain on the original dermatoscopic image (
Figure 2g).
The flowchart for artificial bee colony-based melanoma segmentation is shown in
Figure 3.
2.2. Materials
The formation of the database consists of images collected from different sources (sites distinct from the melanoma images). During the formation of the base, there was no access to information on the means of capture. Therefore, they are bases with different types of resolution, lighting, etc., so some images with difficult identification were discarded.
The proposed technique was evaluated in four different public datasets images, PH2 [
4], ISBI 2016 challenge [
5], ISBI 2017 challenge [
30], and DermIS datasets [
31]. An outline of the publicly available dermatological datasets is summarized in
Table 1.
The PH2 database means the Pedro Hispano Hospital that deals with dermatology by dermoscopic images in a Tubingen mole analyzer system. In this system, the image is enlarged twenty times with a resolution of 768 × 560 pixels at eight-bit (red-green-blue) colors. The two hundred images for different cases of skin die such as the first eightieth is the common mole and the other eightieth is a non-standard mole and the remaining number is for the malignant of skin cancer. The database consists of a medical explanatory note for every image depending on the medical segmentation of the tested region and including the ground truth images. The manual partition of the lesions area and dermoscopic norm (ground truth) were implemented using a proficient dermatologist [
4].
From the ISBI 2016 and ISBI 2017 databases, the utmost complex images (i.e., the dermoscopy images with bubbles, hair, and several colors) were utilized in their original dimensions. These challenge databases comprise eight-bit RGB dermoscopy images with various image dimensions, from 540 × 722 to 4499 × 6748 pixels. Also, both the databases provided the original images paired with the lesion segmentation boundaries (ground truth), which were noted by professional dermatologists.
3. Results and Discussion
For the evaluation of the performance, the proposed technique was evaluated in four different public datasets images and compared with the results obtained through previous methods, which consisted of finding an automatic global threshold by using the ABC algorithm and then binarized the image to detect the skin lesion. For each image in the four base, the proposed method generated a binomial image (i.e., a segmentation), and this image was then compared with the corresponding ground truth (GT) and the following measurements were computed: accuracy (ACC), sensitivity (SEN), specificity (SPE), dice coefficient (DIC), and Jaccard index (JAC).
Accuracy is used to demonstrate the overall pixel with the segmentation analysis. Sensitivity shows the quantity of the skin cancer lesions pixels that are correctly segmented, despite the fact that the SP deals with the ratio of the skin cancer non-lesions pixels that are not correctly segmented. The DIC was applied to quantify the efficiency of the proposed ABC segmentation technique. This measures the ratio of the twice area of the segmented lesions’ region intersection with the annotated ground truths to the summation of the segmented lesions region and annotated ground truths. The JAC is an intersection over the union of the segmented skin lesions region with the segment ground truth region [
32]; where TP: true positive values, TN: true negative values, FP: false positive values, FN: false negative values, As: segment area, Ag: ground truth area.
Table 2 shows the performance parameters that were used in this study.
Table 3 shows a summary of the average ± standard deviation (SD) for the major results.
Based on the results presented by the suggestions of the approach using ABC algorithm, good results were observed in most of the datasets performed.
From the
Table 3, the results of the ISBI 2017 dataset images were slightly better than the results for the other dataset images, with insignificant differences. The average accuracy of the algorithm was 97.61% successful in detecting the region of the image corresponding to the ground truth region; however, in the ISBI 2016 dataset images, the rate fell to 95.24%. The average accuracy presented in PH2 and ISBI 2016 dataset images show that although the sensitivity was lower, the mean still remained above 95%. However, the Jaccard index still remained above 84%.
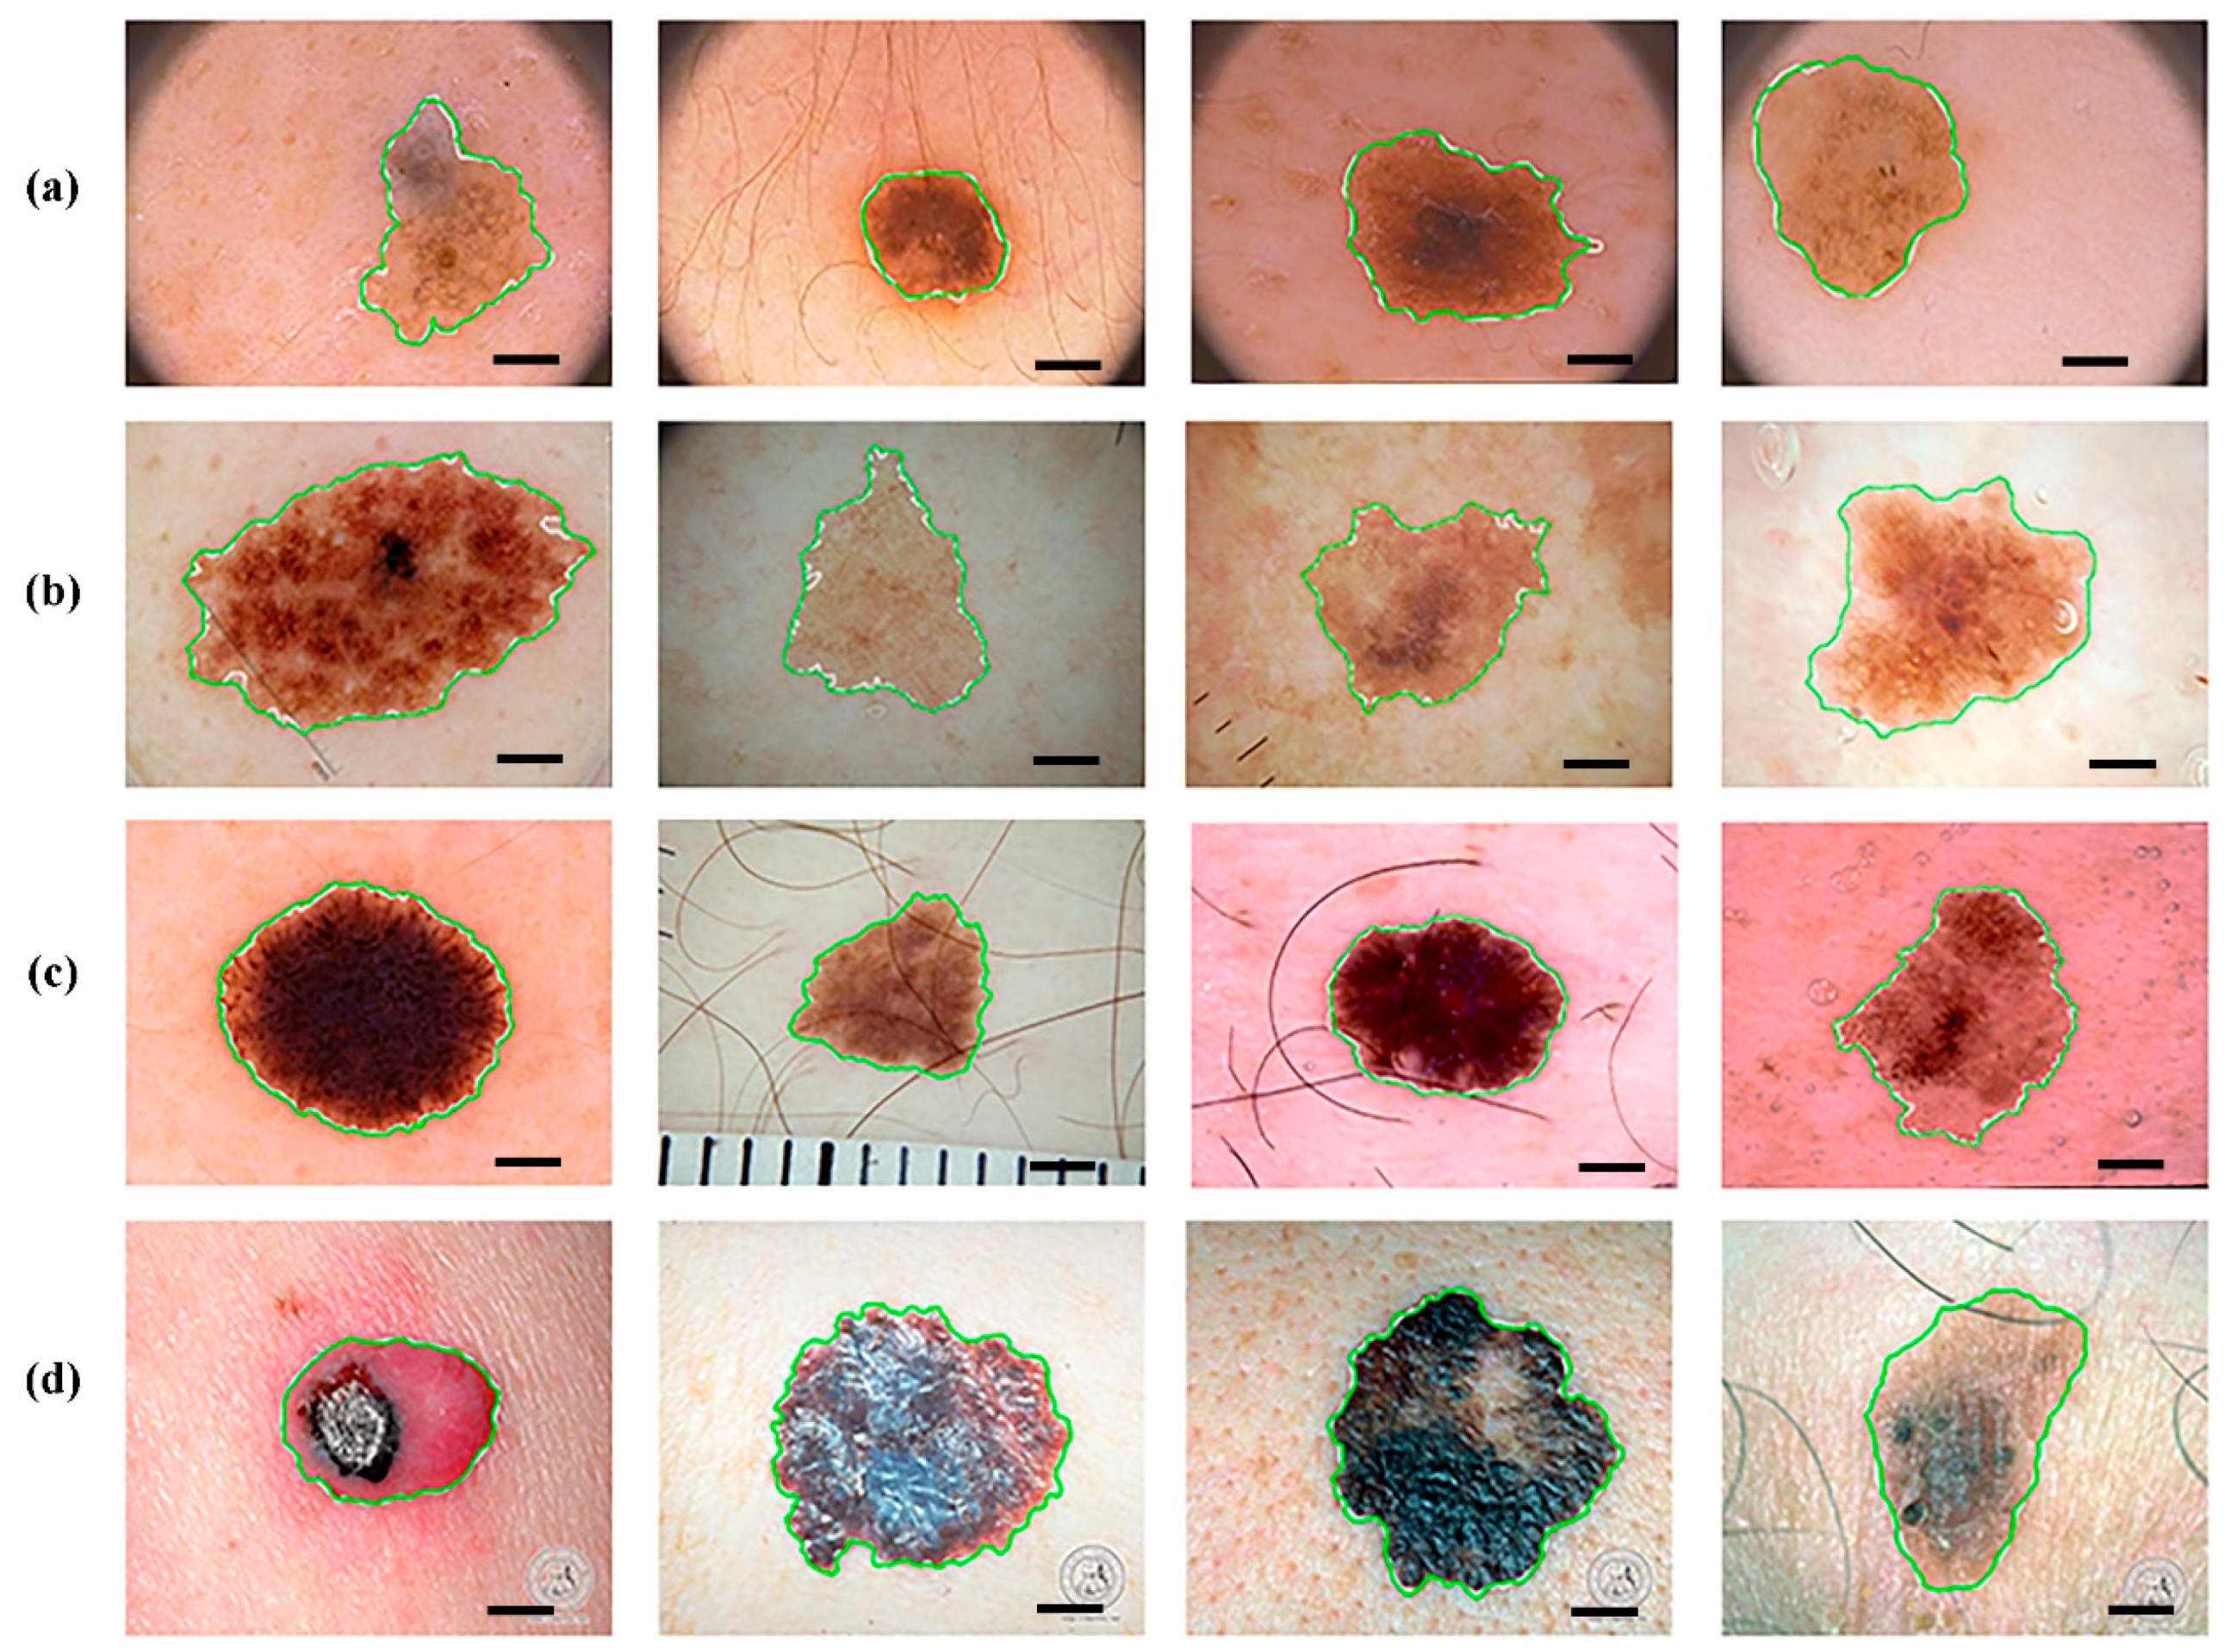
Figure 4 illustrates various examples of the skin cancer lesions best-segmentation results obtained from the four datasets. We can see the efficiency of the proposed approach when compared to the images obtained by the proposed approach (green) with the images of the ideal-ground-truth (white).
Figure 5 illustrates the results obtained from the four datasets with images showing large variations in color, edges, and shape. The efficiency of the proposed approach when compared to the images obtained by the proposed approach (green) with the images of the ideal-ground-truth (white) can be seen.
To show the robustness of this work, the results were compared to existing methods in the literature for melanoma detection.
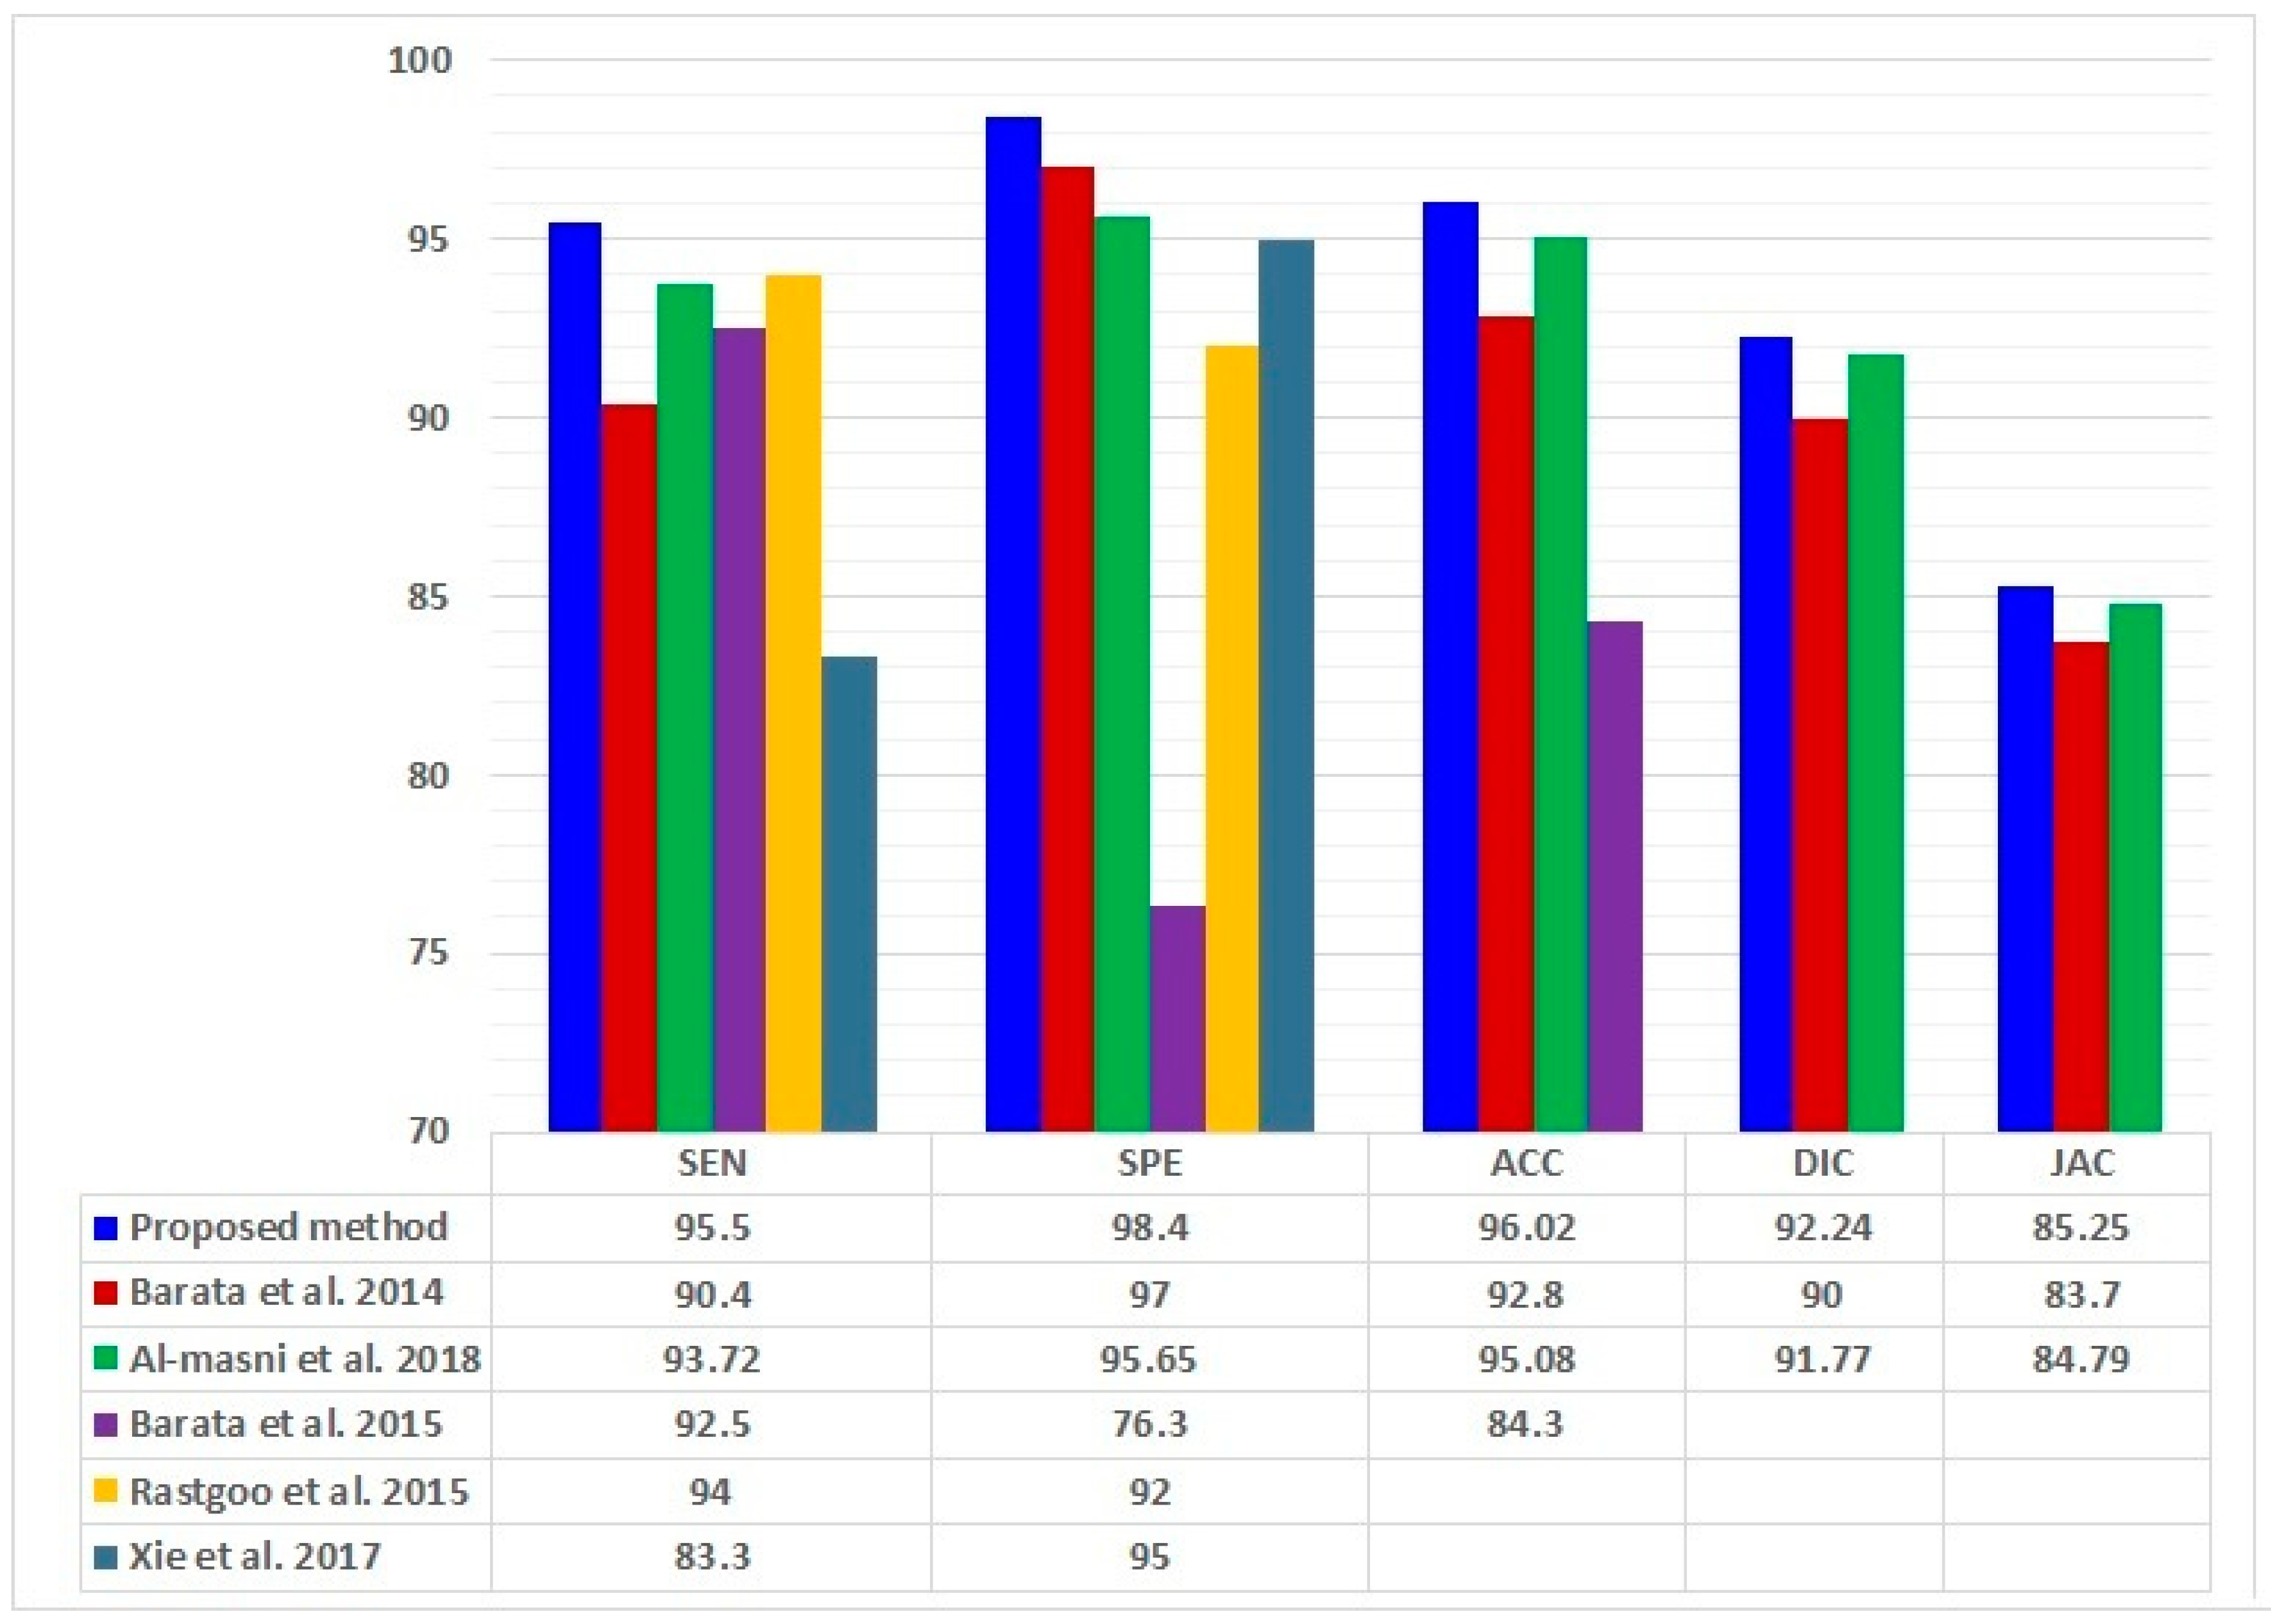
Table 4 and
Figure 6 show a comparison between the proposed method and other representative methods that used PH2 dataset in terms of ACC, SEN, SPE, DIC, and JAC.
According to
Figure 6 and
Table 4 above, it can be observed that the best-segmented result from the PH2 images was that of the proposed method by better delineating the border region of the lesion and better performance parameters. Also, it can be observed that the closer best-segmented result was that of the Al-masni et al. [
21] in terms of ACC, DIC, and JAC. For SPE and SEN, the results of Barata et al. [
32] and Rastgoo et al. [
33] were the closest. Although Rastgoo et al. did not calculate ACC, DIC, and JAC in their work.
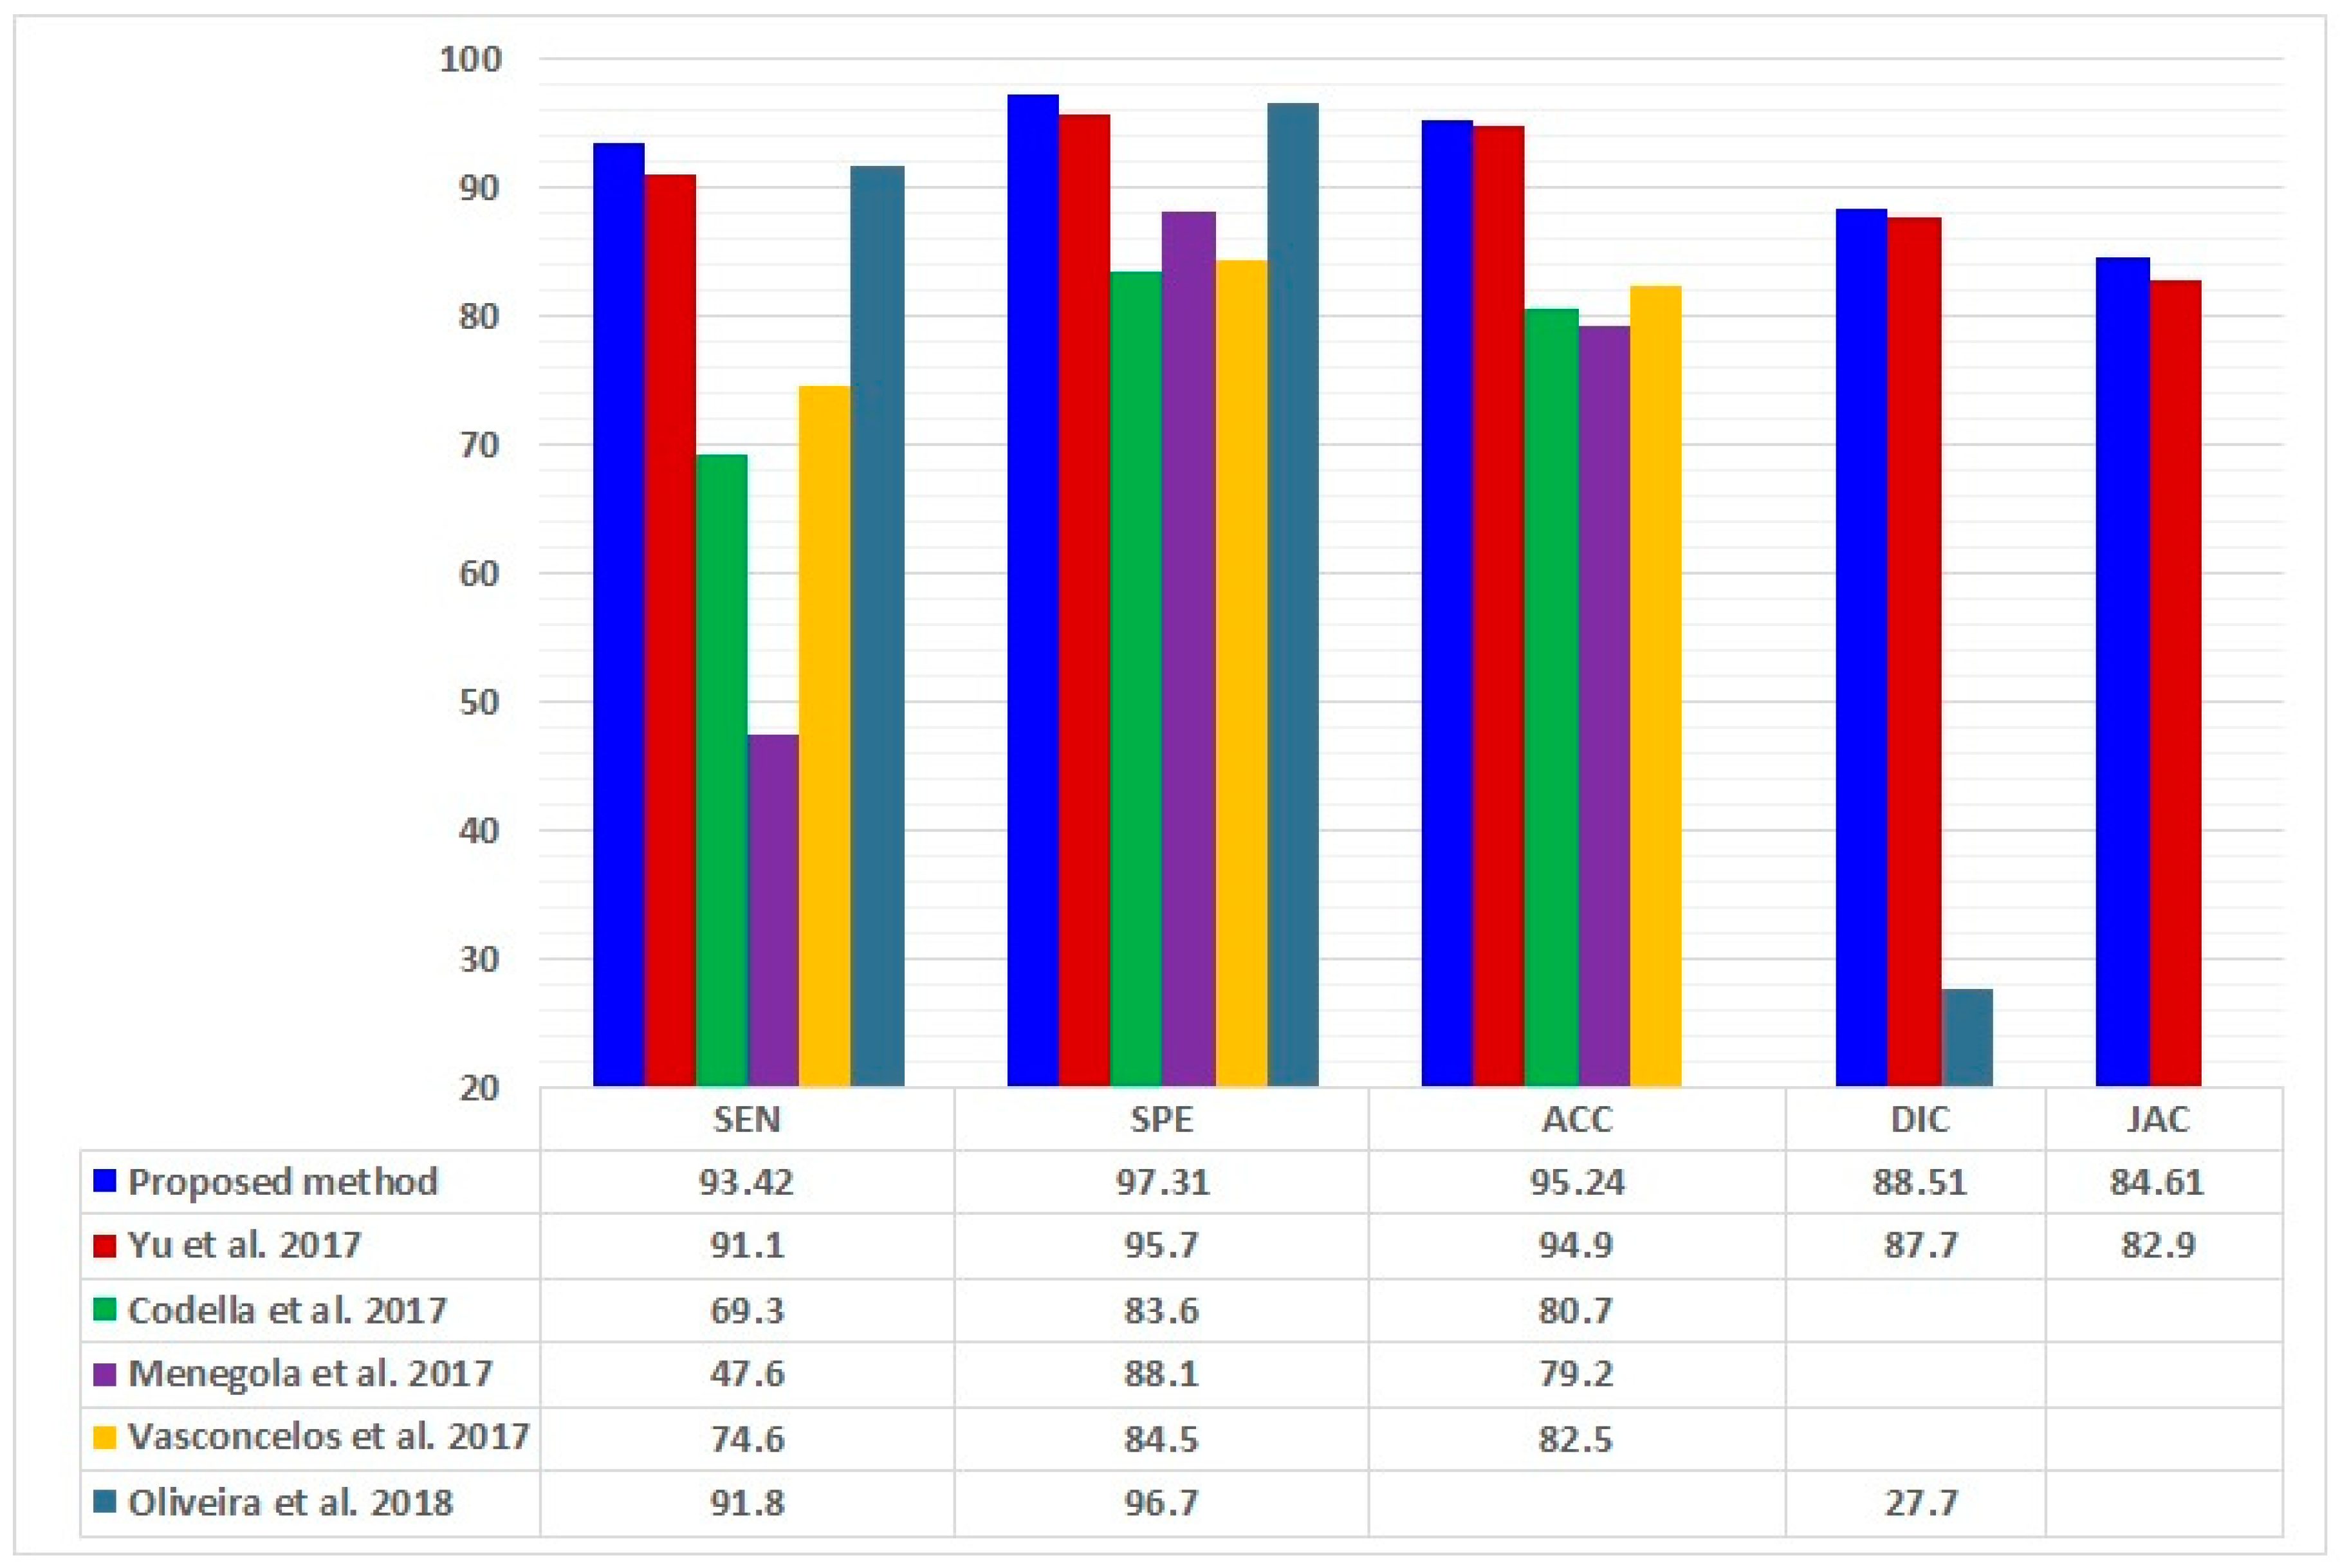
Table 5 and
Figure 7 show a comparison between the proposed method and other representative methods that used ISBI 2016 dataset in terms of the ACC, SEN, SPE, DIC, and JAC.
Figure 7 and
Table 5 above show that the best-segmented result from ISBI 2016 images was that of the proposed method by better delineating the border region of the lesion and better performance parameters. Also, it can be observed that the closer best-segmented result was that of Oliveira et al. [
27] in terms of SEN and SPE. For DIC, ACC, and JAC, the result of Yu et al. [
34] was the closer.
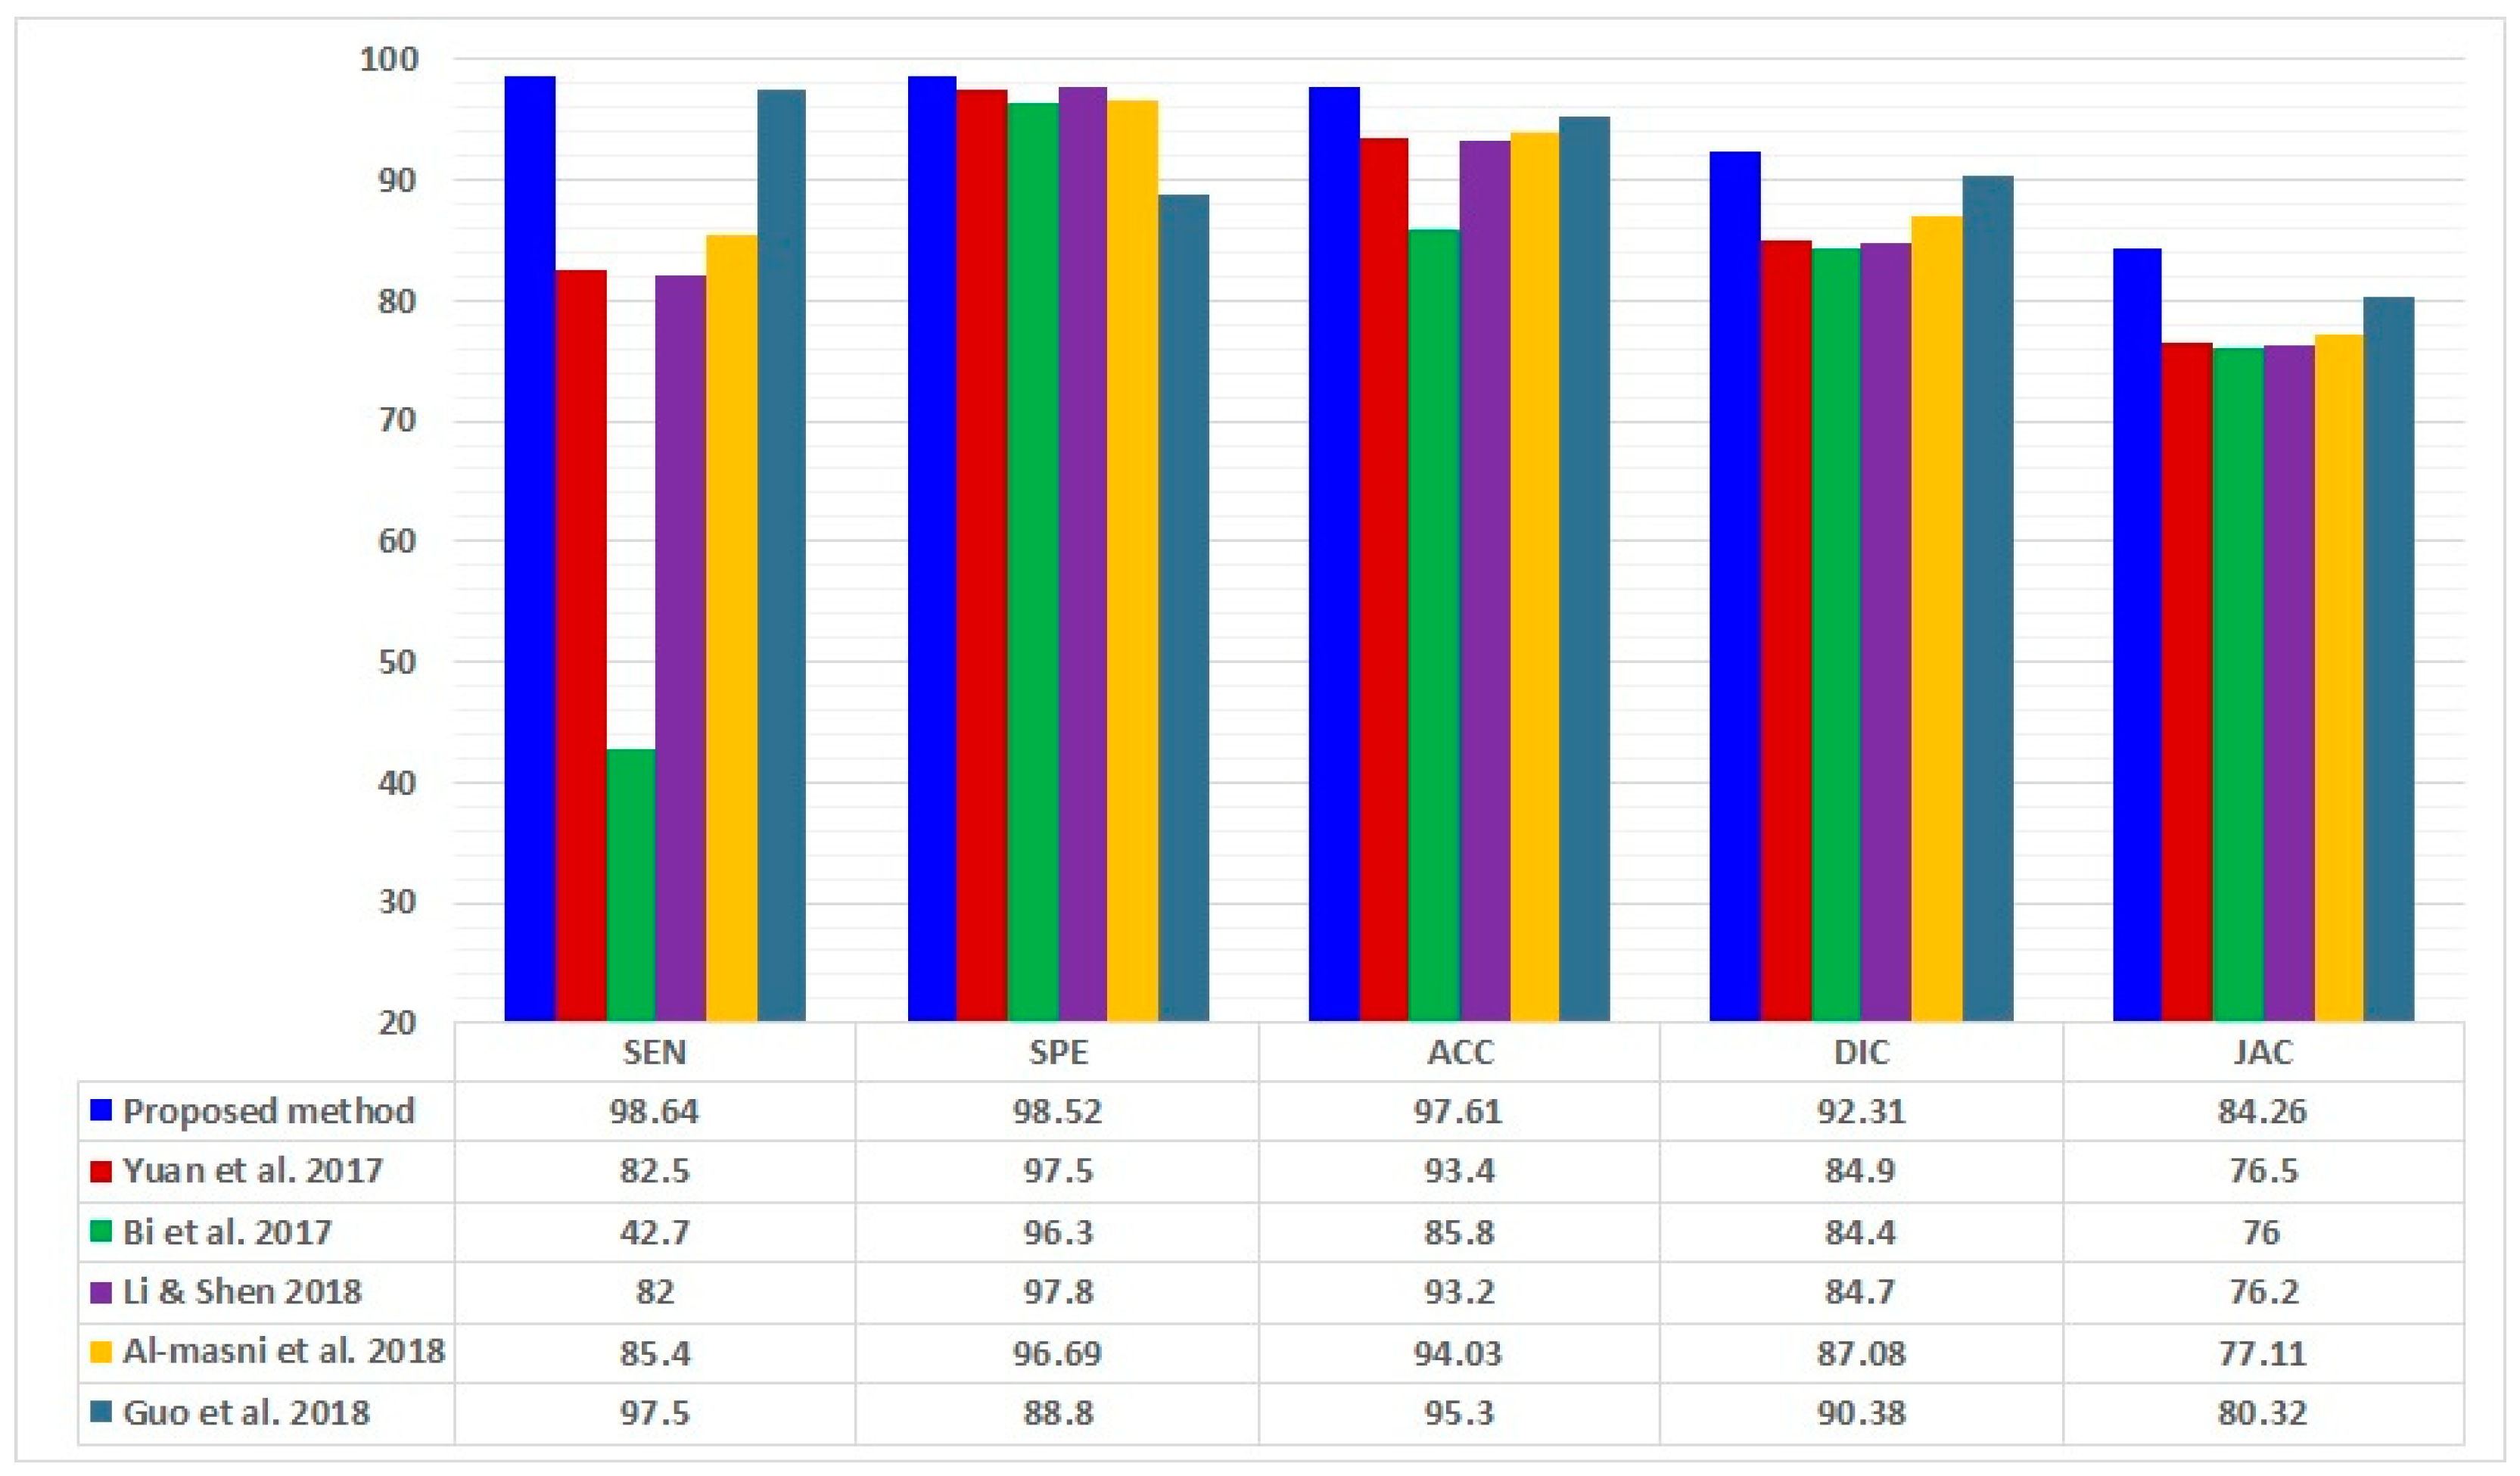
Table 6 and
Figure 8 show a comparison between the proposed method and other representative methods that used ISBI 2017 dataset in terms of the ACC, SEN, SPE, DIC, and JAC.
Also, in
Figure 8 and
Table 6 above, the proposed method achieved the best-segmented result from the ISBI 2017 images. It can be observed that the closer best-segmented result was that of the Guo et al. [
22] in terms of SEN, ACC, DIC, and JAC. For SPE, the results of Li & Shen [
38] were the closest.
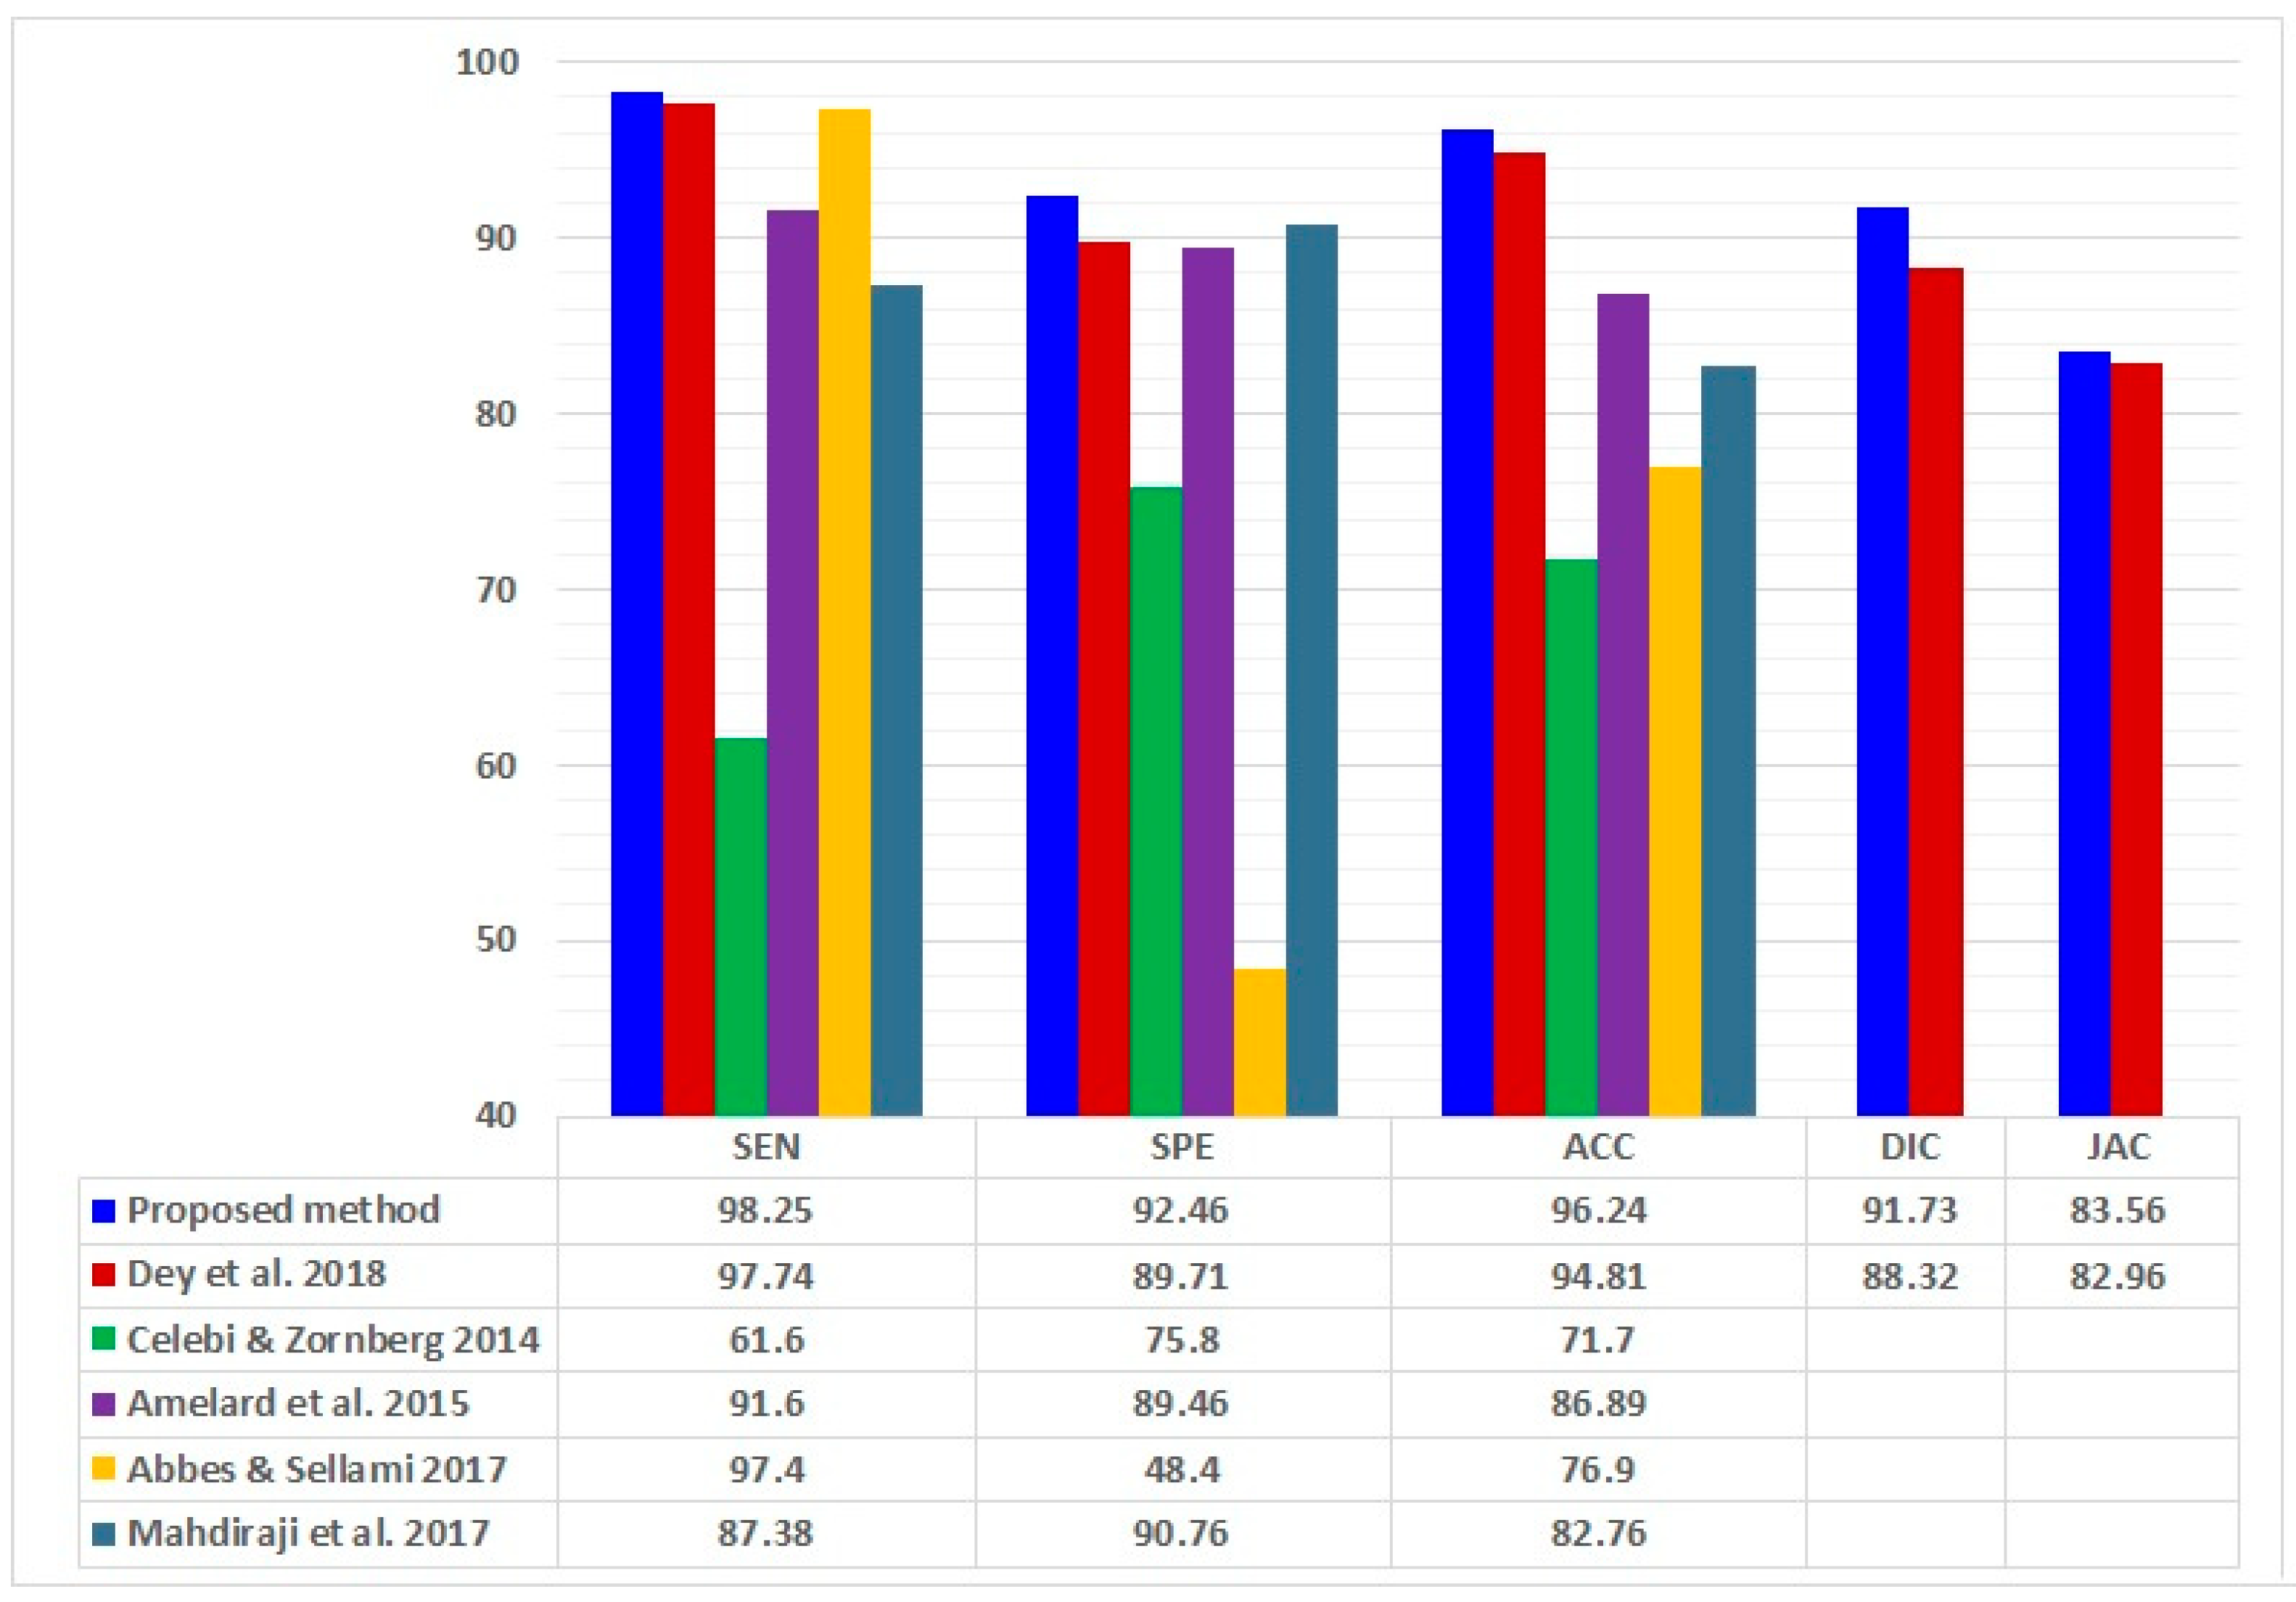
Table 7 and
Figure 9 show a comparison between the proposed method and other representative methods that used the ISBI 2017 dataset in terms of the ACC, SEN, SPE, DIC, and JAC.
Finally, the proposed method presented better results from the DermIS images in
Figure 9 and
Table 7 when compared with previous studies. Dey et al. [
6] calculated all the parameters, while the remaining researcher calculated SEN, SPE, and ACC only. Dey et al. results were the closest except for in the SPE.
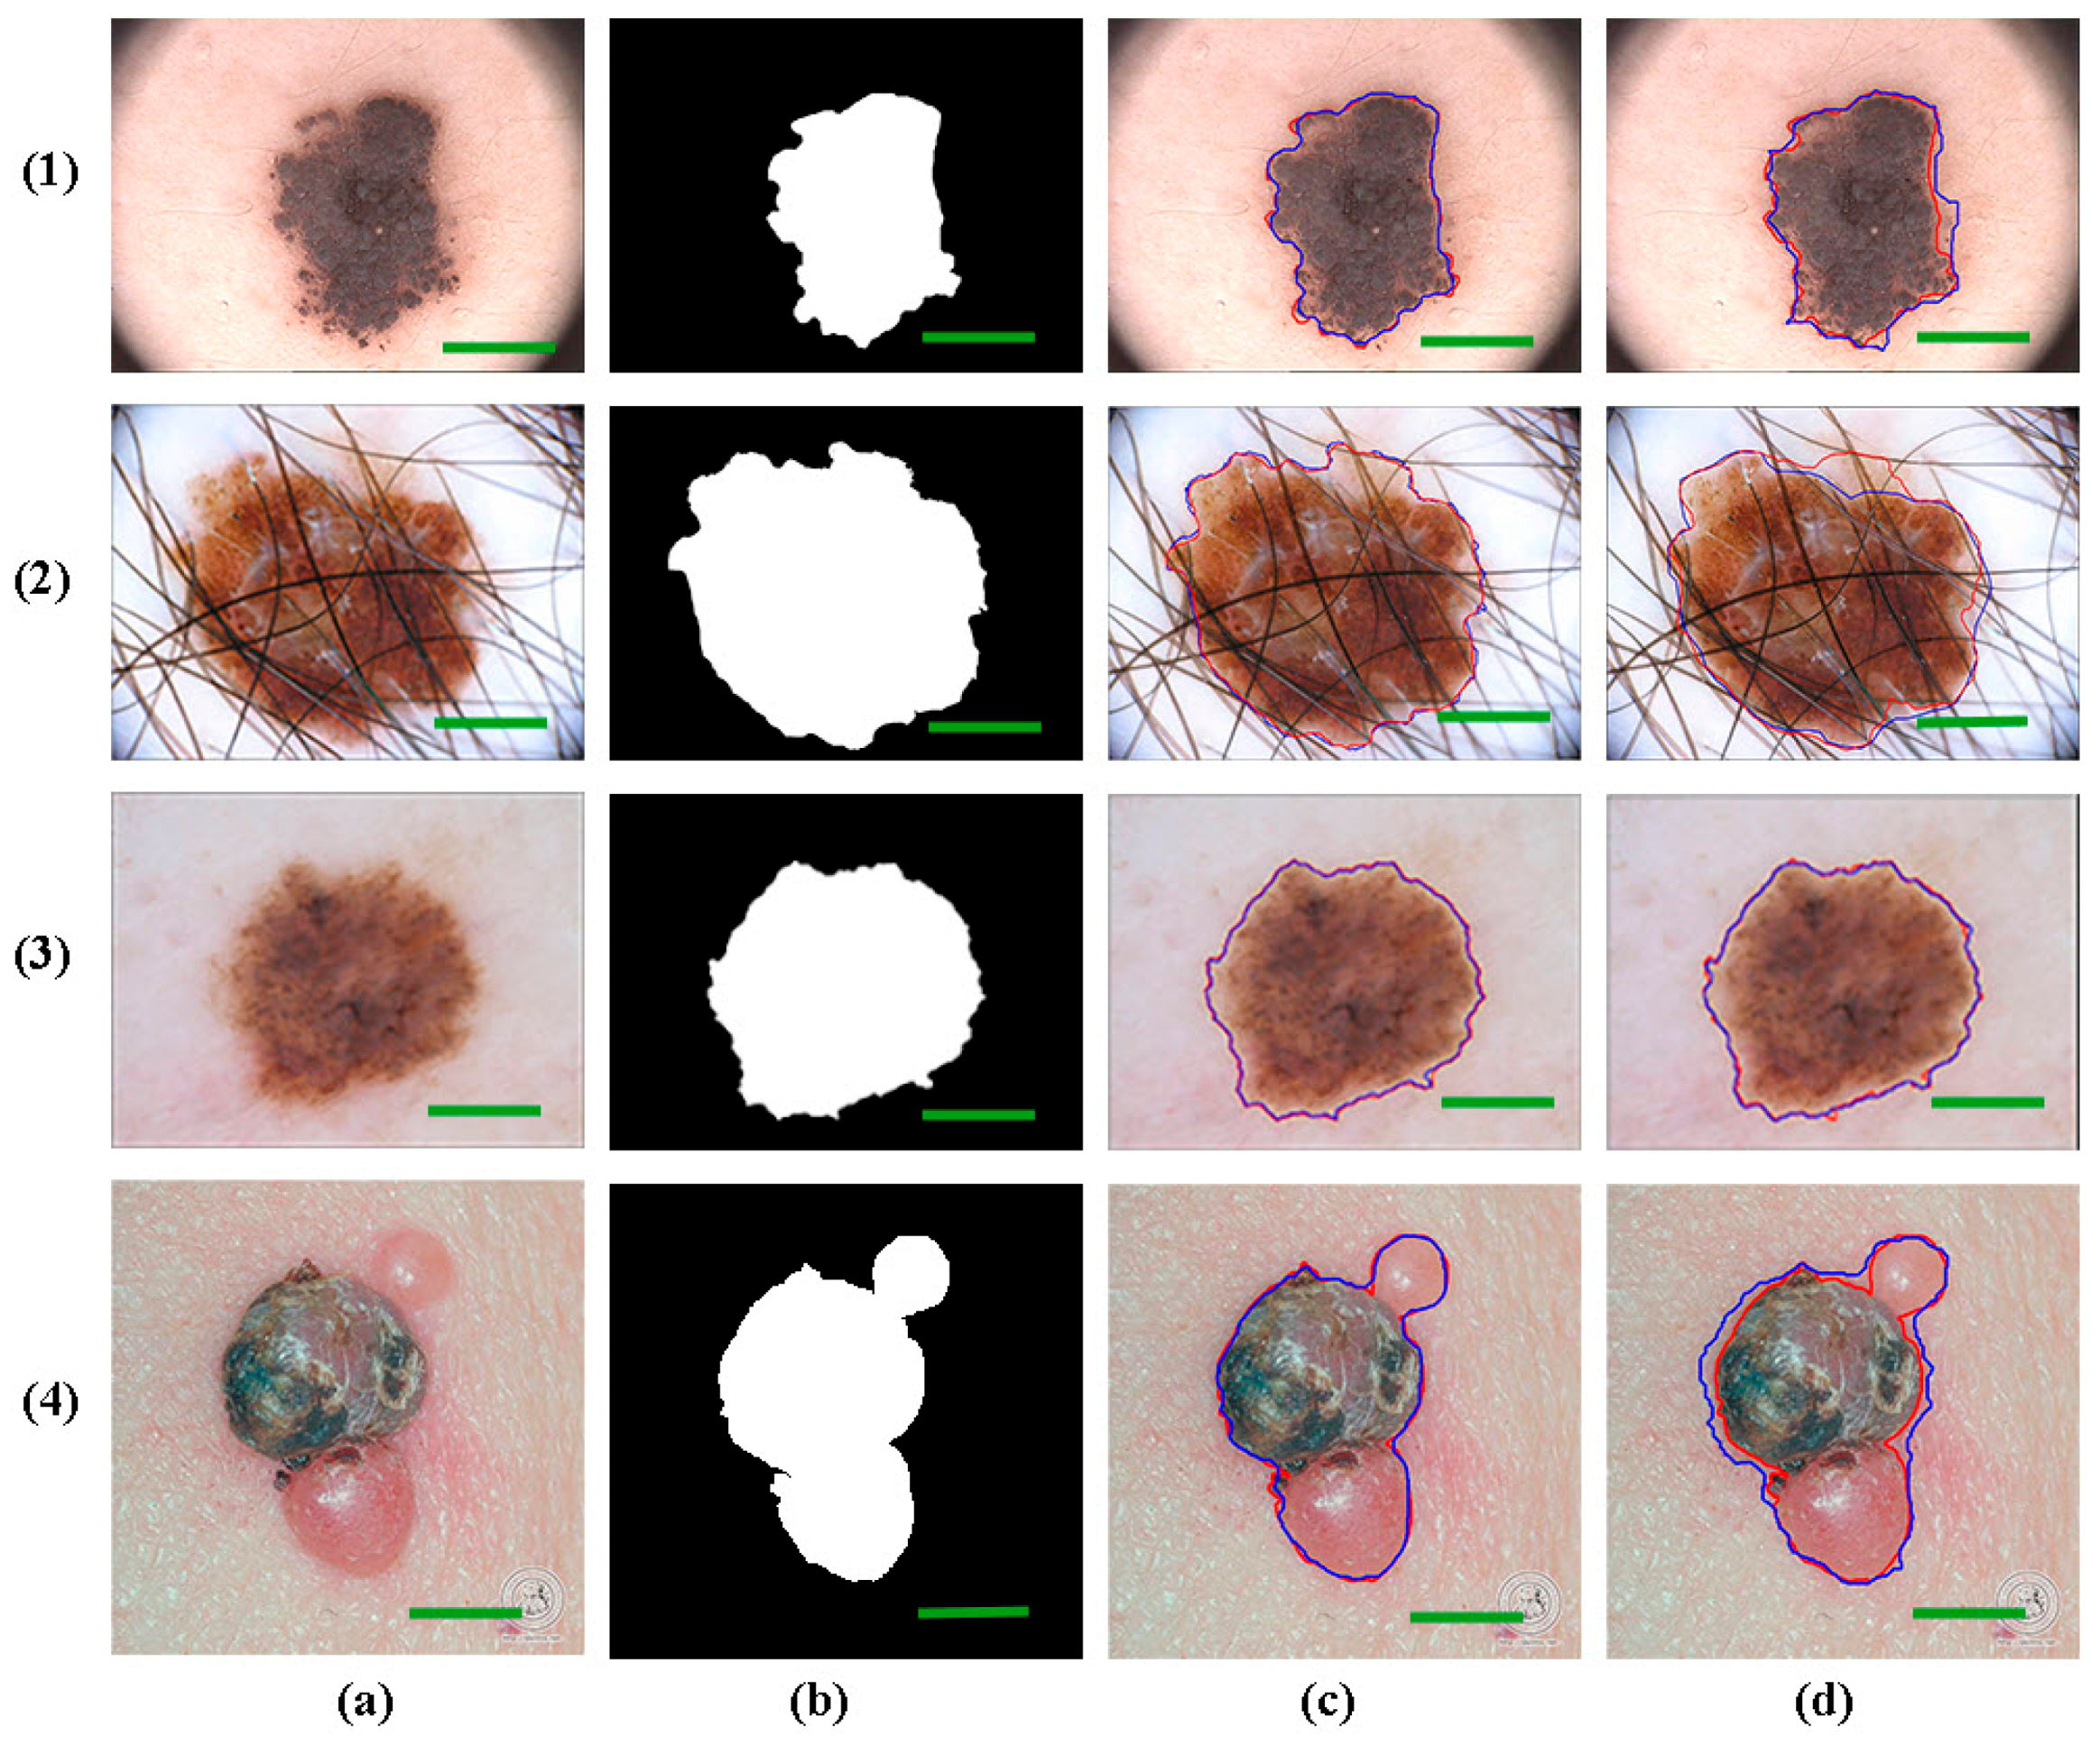
Figure 10 shows a comparison examples between the proposed method segmentation results and other representative methods that used the four datasets. We compare a sample image from PH2, ISBI 2016, ISBI 2017, and DermIS datasets with the work of Khan et al. [
40] (row 1), Yu et al. [
34] (row 2), Guo et al. [
22] (row 3), and Dey et al. [
6] (row 4). It can be observed that the proposed method surpassed these methods and the difference clear in the skin lesion segmentation border.
The ABC method shows fast convergence and low sensitivity to initial conditions. Remarkably, it also needs lower control parameters that lead to reducing the complexity. Moreover, the ABC method is very effective in finding the optimal threshold values.
Most studies used in the comparison for all the datasets images are recent studies.
Due to uneven bumps in the surrounding skin, such as freckles, dermoscopy image databases could have multiple small objects. By using the median filter, these tiny objects can be filtered out. In some cases, the filter fails to remove all impurities, leading to an effect on algorithm work and results.
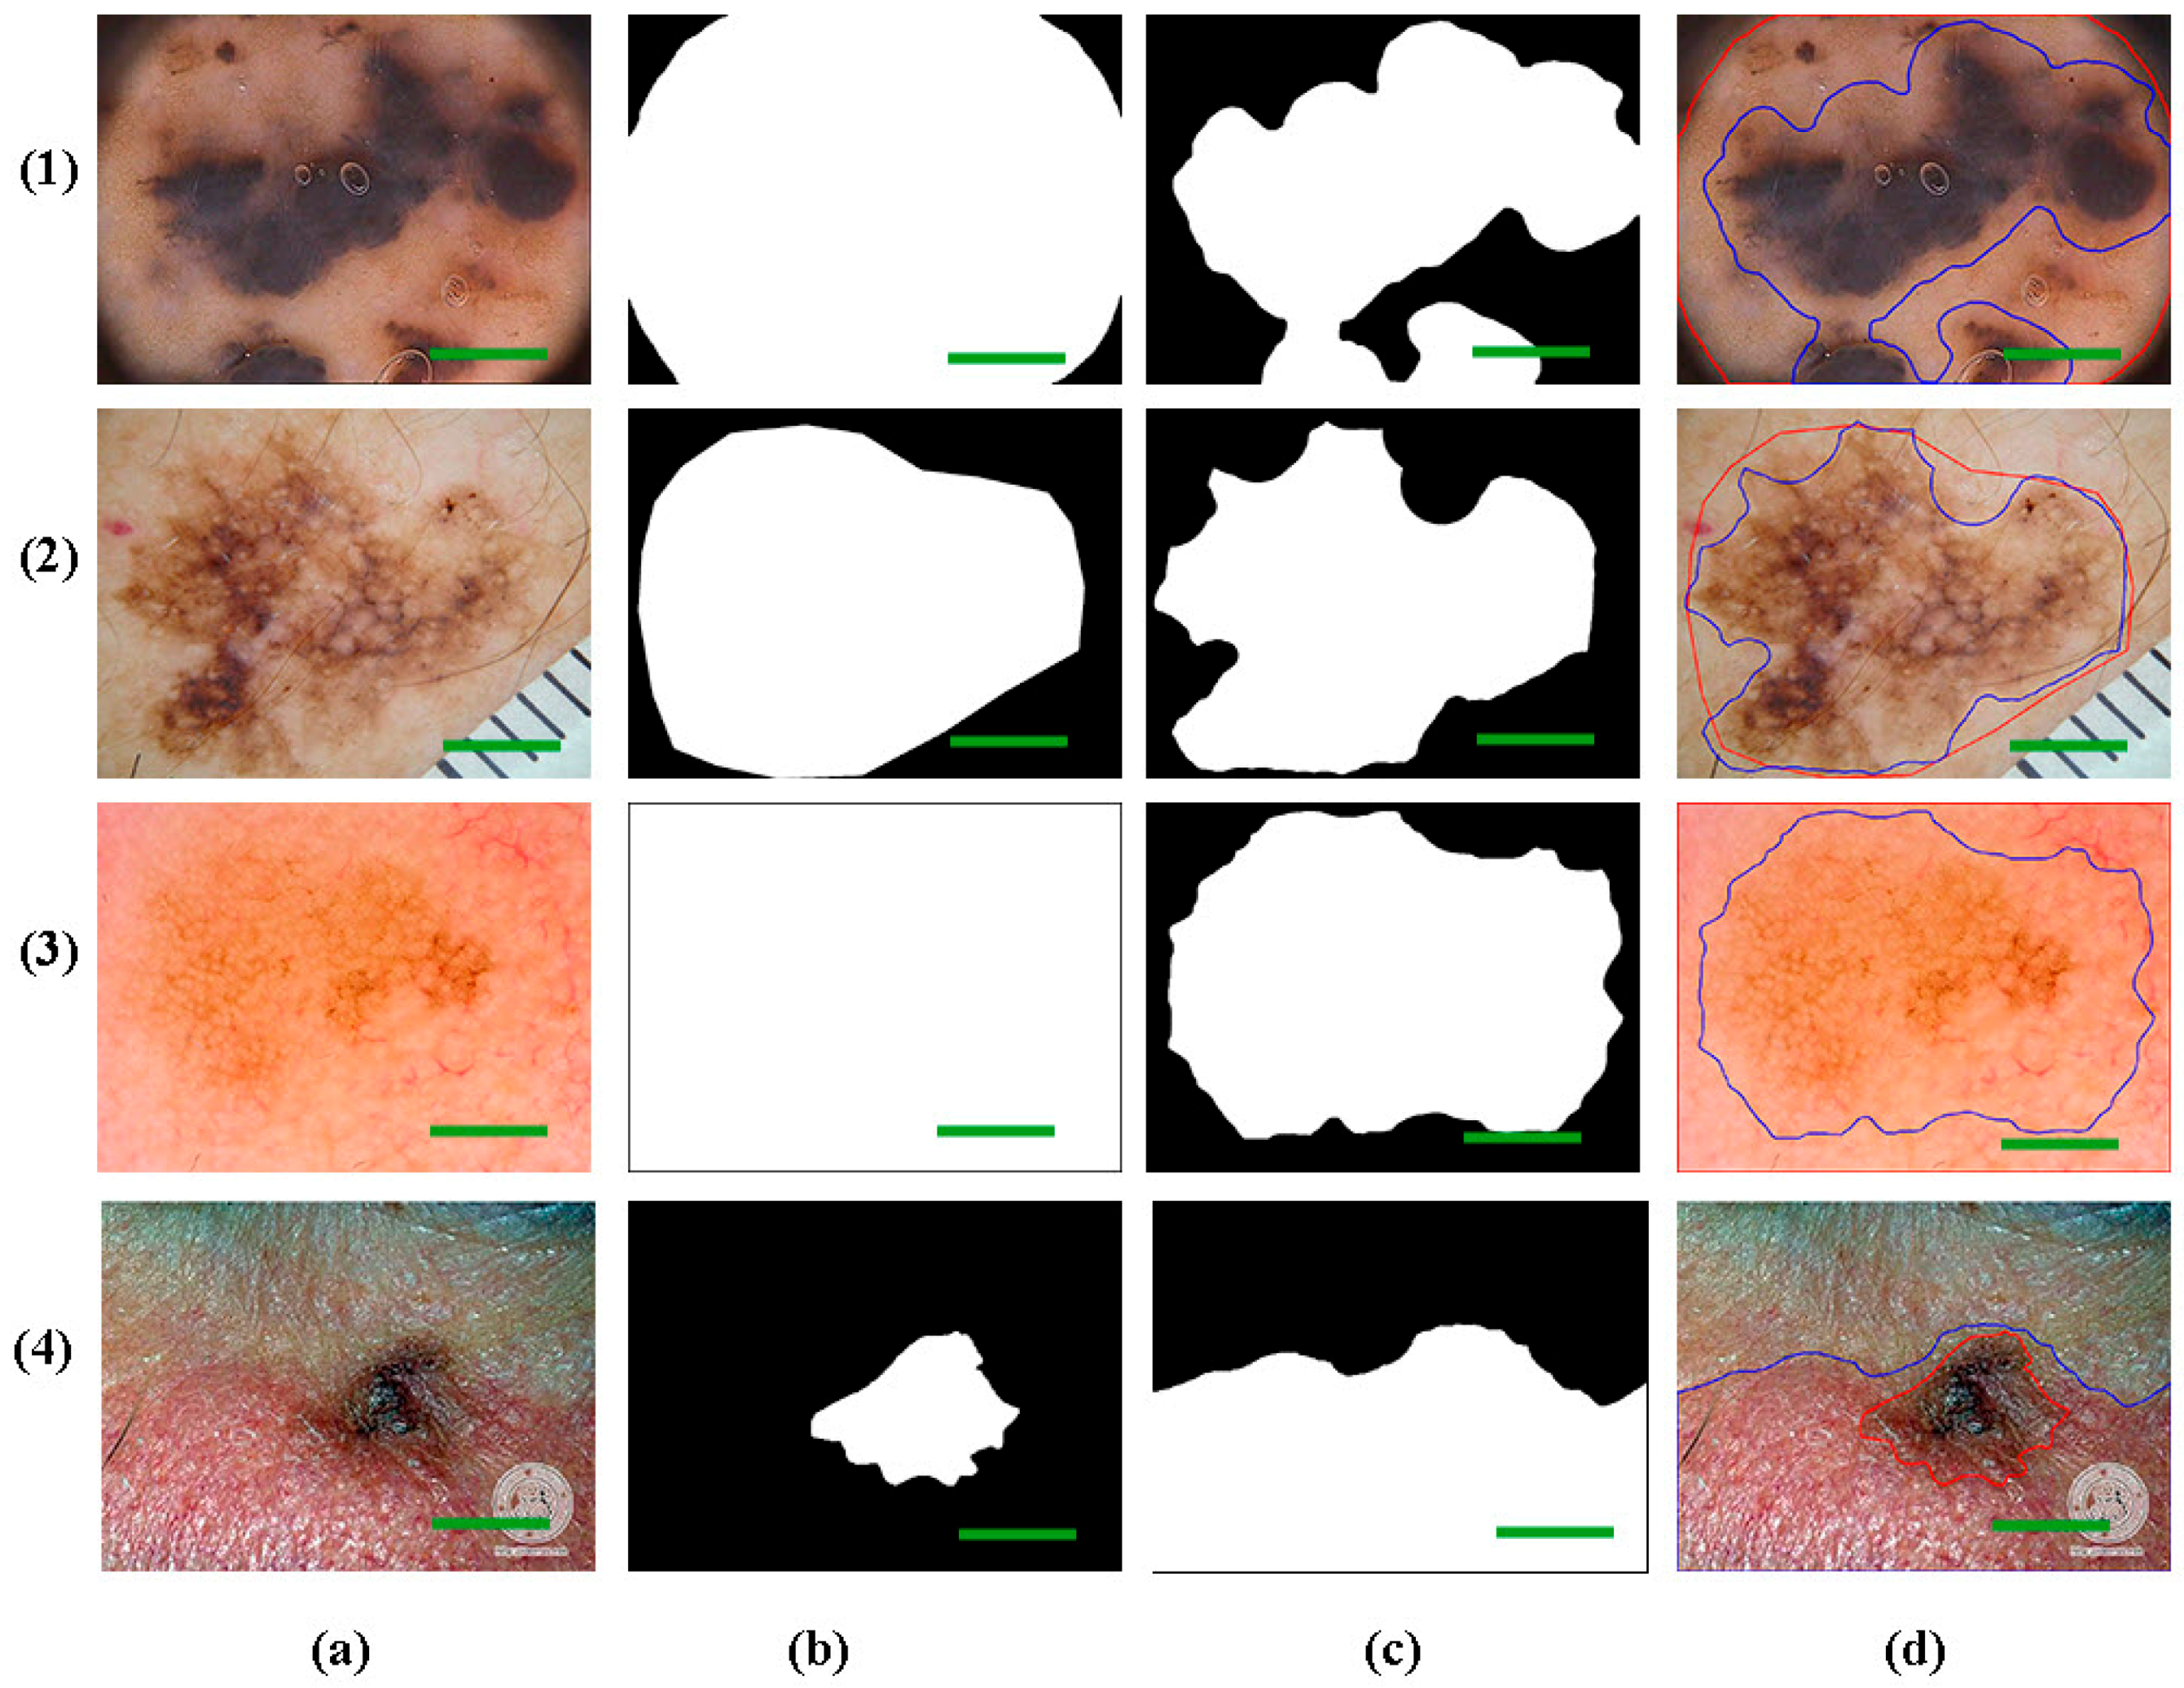
Figure 11 shows images which have segmentation failure. The images in rows 2 and 3 exhibit similar color intensity between skin lesion and background skin. In this case, it is difficult to determine the optimal threshold value due to color similarities between skin lesion and background and the lesions did not have significant pigmentation.
If the contrast between the skin lesion and surrounding skin is not good enough, the ABC’s gray threshold algorithm picks up a large chunk of the surrounding skin, extending all the way to the border of the image. This also results in a segmentation failure, as the mask extends all the way to the border of the image.
The image in
Figure 11, row 4, has failure segmentation because the background color has a high contrast between the upper and lower part of the image and separated by a sharp edge. In this case, the segmentation is concentrated on the upper part, and the skin lesion part is neglected.
As the primary skin lesion is a single contiguous region, segmented images should also contain only a single contiguous foreground region, without any disconnected components or holes. The foreground region may be of any size (including the entire image) and maybe bordering the image. That is why the image in row 1 failed.
