Abstract
This paper evaluated the water use efficiency in 12 Chinese western provinces from 2005 to 2015. Based on data availability and the index selection rationality and the slacks-based measure (SBM)-undesirable Window analysis model and the Malmquist productivity index, the water resource inputs and outputs were measured to analyze water use efficiency. Total investment in fixed assets for the whole society and total water, made up of total agricultural water, total industrial water, and total domestic water, were used as the input indexes, and regional GDP and waste water discharge were the output indexes, with the waste water discharge being regarded as an undesirable output. The data from different years and different provinces in the same period, and data from the same year and the same provinces in different periods were compared in order to derive the water resource efficiency and technical changes over time and space. It was found that the total water resource factor productivity in the 12 provinces grew slowly in the study period, that water resource technical progress positively affected water use efficiency, and that a lack of technical efficiency restricted water use efficiency growth. Several suggestions are given to optimize water use efficiency in the 12 provinces. The research findings and suggestions provide valuable reference for studies in related fields.
1. Introduction
Water availability is essential for the successful development of the economy, the society, and the environment [1,2]. Despite having a fresh water reserve of 223 billion m3 [3], because of the uneven spatiotemporal distribution of the water resources [4], China’s western region is the most water-deficient region in the country, which has restricted economic growth and social progress. The western region, and particularly the middle and lower reaches of Changjiang River, is an ecologically fragile area. To ensure the sustainable social and economic development in China’s western region, water use efficiency and water resource allocation need to be optimized [5].
As water resources are critical to ecological protection [6], social advancement, and economic development [7], water conservation is essential. Data envelopment analysis (DEA) has been widely used to analyze the use and efficient supply of water resources. For example, Liu and Zhang established a basic input-output framework in order to calculate water use efficiency by comparing water use efficiency in sub-sectors of China’s rivers and seas, and then developed a calculation model to assess the sub-sector water conservation possibilities in the Haihe River Basin [8]. Corrado lo Storto presented a benchmark study on the water and wastewater industry in Italy while using a three-stage modeling approach to measure the efficiency of 53 utility operators [9]. Byrnes et al. employed DEA to examine urban water supply efficiency in New South Wales and Victoria, Australia and assess the efficiency of recent urban water policy initiatives, from which it was found that the universal water restrictions policy would reduce the relative efficiency of the larger utilities in Victoria [10]. Ma et al. estimated China’s water use efficiency using a directional distance function that assessed the effect of the environmental degradation on the economy, and then used spatial panel data models to analyze the spatial correlations and the factors that impacted water use efficiency [11]. Guerrini et al. and lo Storto used DEA to analyze water service industry efficiency [12,13]. Deng applied DEA to analyze the water use efficiency in 31 provincial-level administrative regions in mainland China in 2010, and then applied the Malmquist-Luenberger index to assess the total factor water use efficiency and the water rebound effect that is caused by technological progress. It was found that there were significant differences in the water resource utilization efficiencies in the Chinese provinces, there was an overall increasing water resource utilization efficiency trend, and that there was a rebound effect that also varied across the provinces [14]. Liao and Dong measured total factor water use efficiency in 12 provinces in western China in 2007 and 2008 using the DEA method, and concluded that as technological progress was main factor restricting water resource use efficiency, in order to improve water resource use efficiency, it was necessary to first increase the technological input, then expand production scales, and optimize industrial structures [15]. Zhu examined water use efficiency in Jinhua City, Zhejiang Province, China, using DEA methods, in which five input indexes and eight output indexes were selected, and the undesirable output variables were applied as input variables for agriculture, industry, daily life, the ecology, and society. Then, using an improved analytic hierarchy process and DEA, a water use efficiency AHP (Analytical Hierarchy Process)-DEA analysis model was established [16]. However, DEA-based studies have some common problems. When the undesirable output variables are taken as input variables, there is a contradiction with the actual production situation. Further, selecting the variables from a single point of view tends to cause deviations in the efficiency values.
To overcome these problems, this paper adopts a non-radial, non-oriented slacks-based window model with undesirable outputs (hereinafter referred to as the slacks-based measure (SBM)-undesirable window model) and MaxDEA software to calculate the results. The model is able to effectively deal with the undesirable output problems for the water use efficiency evaluation. In addition, a Malmquist productivity index method is introduced to evaluate water resource productivity in 12 western Chinese provinces from 2005 to 2015 and to provide a scientific basis for policies that are aimed at the sustainable use of water resources. To compare the data from the different years, the different DMUs within the same time period, and the data in same year with DMUs in different time periods, it is necessary to calculate the efficiency changes, technical changes, pure efficiency changes, scale efficiency changes, and the total factor productivity changes in the water resources from a time and space perspective to determine the main reasons for the changes in total factor productivity. Therefore, the SBM-Undesirable Window Model and the Malmquist productivity index are used in concert to improve water use efficiency and provide a valuable water research reference.
2. Methodology
2.1. SBM-Undesirable Model
DEA is a linear programming method that measures the efficiency of multiple decision-making units (DMUs) when a production process involves multiple inputs and outputs [17,18]. Tone proposed a non-radial and non-oriented SBM model that considered the input and output of each DMU and which inserted slack variables directly into the objective function to overcome any slack in the input-output, which significantly improved the traditional CCR (Charnes, A. & Cooper, W.W. & Rhodes, E.) and BCC (Banker, R. & Charnes, A. & Cooper, W.W.) DEA models, and eliminated the effect of the subjective factors on the weights, thereby preventing data peaks and large fluctuations in the results [19].
Because of the interactions between water use efficiency and socioeconomic factors, water resource input-output is complex [20]. Therefore, the SBM-undesirable model, which was developed based on the SBM model, is adopted in this paper to accurately measure the water use efficiency in 12 Chinese western provinces.
Assume that the model system contains DMUs, each of which has three input-output vectors: input, desirable output, and undesirable output, which are, respectively, expressed as: , and . Matrices , and are defined as follows: , , and , where, , and .
The production possibility set (P) is defined as in [21]:
where is the intensity vector.
Definition 1 (Efficient DMU).
Ais efficient in the presence of undesirable outputs if there is no vectorsuch that,andwith at least one strict inequality.
From the method presented in [22], the SBM model of undesirable output can be written as:
where and are the excesses in the input and undesirable output, is the shortage in desirable output, and is the weight vector. The objective function () strictly decreases in relation to , and . A DMU is efficient if and only if ; that is, , and [23,24].
2.2. Window Analysis
MaxDEA and window analysis are able to solve the problem when the number of DMUs is less than the sum of inputs and outputs multiplied by three. The Window analysis is able to evaluate the relative efficiency of the same DMU at different times as the different time periods are grouped together while using a certain number and regarded as a window, with all windows sharing the same width [25]. As it regards the same DMU at different times as a different DMU, the analysis approach can make full use of the data value, and thereby it is able to reveal the real efficiency of the DMUs.
The first step in window analysis is to select the window width . The number of windows is therefore , where is the number of time periods. Charnes et al. suggested that a balance of reliability and efficiency could be achieved at a window width of three or four [26]. Here, the window width is set to three, and the number of windows is set to nine.
2.3. Malmquist Productivity Index
The Malmquist index was first introduced to DEA by Färe et al. It can be decomposed into an efficiency change (effch) and a technical change (techch) to reflect the catch-up effect and frontier shift of two periods. In the DEA analysis, the index depicts the shift in the production frontier. The efficiency change (effch) can be further divided into a pure efficiency change (pech) and a scale efficiency change (sech) [27].
The relationship between all of these parameters is:
where tfpch is the water use efficiency (the variation in the parameters reveals the degree of change in water use efficiency within a certain period of time), techch, or the frontier shift, is the technical change from period to period (techch > 1 indicates technical progress and techch ≤ 1 indicates technical regression), effch, or the catch-up effect, is the efficiency change from period to period (effch > 1 indicates efficiency improvement and effch ≤ 1 indicates efficiency decline), pech is the effect of the pure efficiency on productivity (pech > 1 indicates that the effect is positive and pech ≤ 1 indicates that the effect is negative), and sech is the DMU production and operation scale trends (sech > 1 indicates that the DMU is approaching the optimal scale and sech ≤ 1 indicates that the DMU is not approaching the optimal scale) [28].
3. Data Processing and Empirical Analysis
3.1. Case Study
The western region of China includes 12 provinces; five provinces in southwest China (Sichuan, Yunnan, Guizhou, Tibet, and Chongqing), five provinces in northwest China (Shaanxi, Gansu, Qinghai, Xinjiang, and Ningxia), as well as Inner Mongolia and Guangxi. Western China has an area of 6.86 million square kilometers, or 72% of the China’s total area. China’s geomorphic types have a three-step shape from west to east, with the recoverable natural groundwater resources in the west accounting for more than 80% of the country’s total water resources. However, in general, as China has a shortage of water, the abundant water resources in the southwest region are valuable assets that provide the essential conditions for industrial and agricultural development and the residents’ lives. However, the extreme water shortages in the northwest region have restricted economic development, with the water shortages in some areas even affecting the survival of local residents. As western China is the main area for agricultural development, the availability of agricultural water is directly related to its economic development; therefore, the rational use of the water resources and improvements in water use efficiency are vital for future survival and development.
3.2. Index Selection and Data Source
A rule of thumb suggests that the number of DMUs should be at least equal to the sum of the number of inputs and outputs multiplied by three. The research object of this paper is 12 provinces in the west, 12 decision-making units, and the sum of inputs and outputs is six, which obviously does not satisfy the triple relationship. Therefore, we introduce window analysis and set the window width to three, a total of nine test windows, 324 decision units were finally obtained [29], which is much larger than three times. Based on the data availability and rational index selection, the water use efficiency was measured from the water resource inputs and outputs, with the water use efficiency evaluation indexes being determined based on previous research. To demonstrate the natural properties that are associated with the water resources, regional GDP and total fixed assets investment were selected to reflect the economic properties of the water resources [30,31], total agricultural, industrial, and domestic water were adopted as the social water resources measure [32], and total wastewater was taken as the undesirable output [33]. Therefore, the water use efficiency in China’s western provinces was measured using the input indexes, which were the total agricultural, industrial, and domestic water, and the output indexes, which were GDP and the total wastewater [34,35]. The indexes are shown in Table 1.

Table 1.
Water Use Efficiency Measurement Index System.
The data for the 12 western provinces from 2005 to 2010 were extracted from the China Statistical Yearbook and the website of the National Bureau of Statistics of the People’s Republic of China. The extracted data were processed using MaxDEA to calculate the water use efficiency in the 12 provinces, and the final results were obtained by decomposing the panel data while using the Malmquist productivity.
3.3. Correlation Analysis
Pearson’s correlation coefficient is a statistical method used for linear coefficient correlation to measure the linear relationships between interval variables. The following conditions must be met: (1) both variables should be continuous variables; (2) both variables must come from a normal distribution, or a unimodal symmetric population distribution that is close to a normal distribution; (3) the variables must be paired data; and, (4) the two variables must be in a linear relationship. The correlation analysis research results are shown in Table 2.
Table 2.
Correlation.
From Table 2, it can be seen that only the total amount of agricultural water has not reached significant correlation with other indexes. However, due to the particularity of the study area, the economic development of a considerable number of provinces in western China is increasingly restricted by water shortages, and the restrictions on agricultural development are even more serious. With the acceleration of industrialization, urbanization, and the intensification of human activities, the increasing demand for water resources has a serious and far-reaching impact on agricultural production and food security. Nevertheless, while there are shortages of agricultural water, the problem of the waste of China’s agricultural water is serious that the use of water resources is extensive and agricultural water use efficiency is not high. Under the current supply and demand situation of water resources, the key to alleviating the shortage of agricultural water in western China is to improve the use efficiency of agricultural water, which has become the consensus of the theoretical and practical circles. Therefore, the index of the total amount of agricultural water should not be deleted.
3.4. Overview of Water Use Efficiency
Based on the window width (3) and the number of windows (9), the first window was determined as W1 (2005–2007), the second as W2 (2006–2008), and the ninth as W9 (2013–2015). The overall efficiency of the 12 DMUs in each window was calculated while using the SBM-Undesirable model, and the results are listed in Table 3.
Table 3.
Window Analysis Results for Water Use Efficiency in 12 western Chinese provinces.
As shown in Table 3, only a few of the 12 provinces achieved DEA efficiency in the different windows. The average water use efficiency showed a gradual decline in every western province, and the efficiency values fluctuated in the same provinces in different periods and in different provinces in the same period. From 2005 to 2015, Shaanxi had the highest water use efficiency (average: 0.968), while Guangxi had the lowest (average: 0.446). Chongqing, Shaanxi, and Inner Mongolia provinces all had high efficiency scores, indicating that there were strict water resource management systems in these provinces as the utilization control, water use efficiency, and pollutants that were contained in the water function zone did not cross the “red line” of development, effectively improving the water use efficiency. The efficiency value varied in the same space in different periods and in different windows. For example, the efficiency values in Yunnan in the nine windows were 0.593, 0.604, 0.648, 0.603, 0.517, 0.543, 0.570, 0.533, and 0.527, showing an irregular declining trend. This pattern was also seen for the efficiency values for different provinces in the same window. In the first window, the 12 provinces were ranked by efficiency value; Qinghai < Guizhou < Yunnan < Ningxia < Guangxi < Sichuan < Xinjiang < Inner Mongolia < Tibet < Gansu < Shaanxi = Chongqing.
To more vividly demonstrate the spatial water use efficiency distribution and its corresponding geographical location in the 12 western provinces, and while considering the scientificity and rationality of the interval division as well as the upper and lower value bounds, the water use efficiency of the 12 western provinces were plotted on a map of China, as shown in Figure 1, and divided into five levels: 0.4–0.52, 0.52–0.64, 0.64–0.76, 0.76–0.88, and 0.88–1.
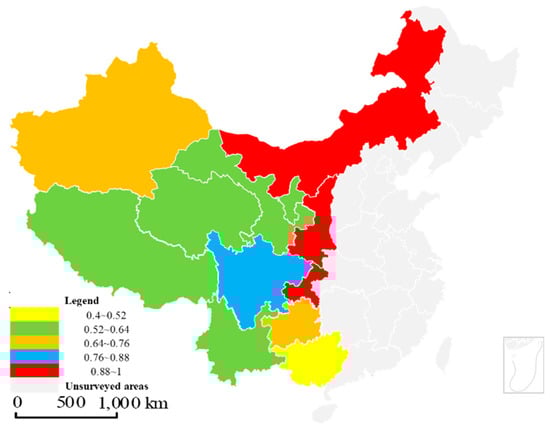
Figure 1.
Water Use Efficiency in China’s 12 Western Provinces.
As can be seen, most of the 12 western provinces fell into the 0.52–0.64 efficiency level and were concentrated in the middle area of China’s western region, indicating that the water use efficiency was relatively low in western China, but that there were significant provincial differences. This conclusion appeared to be different from the actual water resources development situation in western China because the undesirable output (the total wastewater) and the desirable output (regional GDP) were considered in the evaluation.
To further investigate the water use efficiency variations in the 12 western provinces, the average efficiency values in the same year and in different windows were calculated, and the results are shown in Table 4.
Table 4.
Average Water Use Efficiencies in Different Windows for the 12 Western Provinces from 2005 to 2015.
As can be seen in Table 4, Shaanxi had the best water use efficiency in the study period with the DEA being effective in all of the years except 2009 and 2010, followed by Chongqing, which had an effective DEA in eight years, except for 2007, 2009, and 2011. Yunnan and Qinghai had the worst water efficiency as there was no effective DEA in any of the years. In terms of spatial distribution, the average efficiency was ranked as: Guangxi < Qinghai < Yunnan < Ningxia < Guizhou < Gansu < Tibet < Xinjiang < Sichuan < Inner Mongolia < Chongqing < Shaanxi.
3.5. Non-Parametric Test
The non-parametric test, together with the parameter test constitutes the basic content for statistical inference, and it makes up for the simple assumption that the overall distribution cannot be assumed in the data analysis process. When the overall variance is unknown or there is little information, a sample data pair is used.
The results of the non-parametric test for efficiencies are shown in Table 5 and Table 6. As the asymptotic significance of each time window and province was 0.443 and 0.440, respectively, the significance test failed, which indicated that there were no differences in the efficiencies of the 12 western Chinese provinces and the nine time windows.
Table 5.
Test statistics a,b.
Table 6.
Test statistics c,d.
3.6. Water Use Efficiency Analysis Based on the Malmquist Productivity Index
Based on panel data from the 12 western provinces from 2005 to 2015, the Malmquist productivity index analysis was conducted from the perspective of time and space to calculate the efficiency changes (effch), the technical changes (techch), the pure efficiency changes (pech), the scale efficiency changes (sech), and the total factor productivity changes (tfpch). The detailed results are shown in Table 6 and Table 7.
Table 7.
Annual Total Factor Productivity Change Index and the Decomposition in 12 Provinces from 2006 to 2015.
From a time series perspective, the overall water use efficiency in the 12 provinces was increasing from 2005 to 2015, and had an average value of 1.065, which is probably due to the national soil and water conservation projects. The total factor productivity was boosted by technical progress. During the study period, in 2008, there was a massive growth of 19.8%, while the largest decline of 16.3% was in 2009, possibly because of the global financial crisis in 2008 when a severe economic recession led to a lack of desirable output and affected the water resource total factor productivity. After 2013, the decline in the water resource total factor productivity change index slowed because the People’s Republic of China Water Resources Department released the Twelfth Five-Year Plan for water conservancy development in western China in 2012. The decrease in total factor productivity was attributable to the limited investment in water conservancy facilities and the unplanned large-scale input into infrastructure.
The decomposition of the tfpch indexes showed that the water resources techch in the 12 western provinces fluctuated with an average growth rate of 8.6% from 2005to 2015, and a particularly prominent increase in 2012. The average value for the effch indexes was 0.980 with an overall fluctuation. The growth rate of tfpch was greatly affected by techch, indicating that the technological advances were having a positive impact on water use efficiency. The analysis showed that technical progress was one of the main driving forces for the growth in water use efficiency in the 12 western provinces. Both effch and pech had irregular fluctuation trends; from 2006 to 2009, the effch and pech indexes were low, owing to the insufficient management of water resources; however, from 2009, because of the focus on water resource reform in China, the effch and pech slowly rose.
The analysis of the provincial tfpch indexes indicated that the growth rates varied significantly across the provinces. Except for Yunnan, Guizhou, and Xinjiang, the other western provinces all had a growth trend, with an average value of 1.065. For Yunnan, Guizhou, and Xinjiang provinces, which all had declining trends, the declining trend in Guizhou Province was the most obvious with a tfpch value of only 0.905. As the tfpch is restricted by the techch, this further demonstrated the technical constraints on water use efficiency. As can be seen in Table 8, the provinces that had a top tfpch rank were also top ranked for the techch, further proving that the techch was a major influence on the tfpch for water resources.
Table 8.
Provincial Total Factor Productivity Change (tfpch) Index and the Decomposition of the Water Resources from 2005 to 2015.
The effch is influenced by both the pech and sech. In terms of input scale efficiency, only Guizhou, Chongqing, Gansu, Ningxia, and Guangzhou scored 1.000 in the sech indexes, indicating that they had attained an optimal scale allocation. These provinces were all pilot sites for the national societal water-conservation projects and were therefore focal points for China’s unified water resource management system. In contrast, the sech indexes were less than 1.000 and the returns-to-scale increased progressively in the other provinces. To improve this situation, continuous input is needed by the factors that benefit the water resource total factor productivity, and the returns-to-scale need to be suppressed so as to reduce the water resource investment scale.
In theory, water use efficiency grows from the combined effect of technical efficiency improvements, technical progress, and returns-to-scale. The decomposition results from the Malmquist productivity index indicated that the tfpch growth in the 12 provinces was mainly the result of an increase in the techch, which is consistent with existing theory. Of the 6.5% increase in tfpch, 8.6% was contributed by the techch and only 0.1% was contributed by the sech; therefore, the techch improvements were the main driving force for the increase in water use efficiency in the 12 provinces.
4. Conclusions
To evaluate the water use efficiency in 12 Chinese western provinces from 2005 to 2015, this paper adopted a non-radial, non-oriented MaxDEA-SBM window analysis model that accounted for the undesirable outputs. Then, an input-output index system was established, the data processed in MaxDEA software, and the water use efficiency influencing factors analyzed using the Malmquist productivity index. The research results and propositions were as follows:
First, the water use efficiency was found to be relatively low in western China during the study period and there were significant provincial differences. In general, however, the water resource effch in each province was low. To improve water resource technical efficiency, technological efficiency and innovation needs to be considered as part of the total factor productivity [46]. Therefore, relevant government departments need to encourage enterprises and scientific research institutions to implement innovative water resource technological strategies and to develop optimal strategies to improve the water resource total factor productivity in each province.
Second, the overall water use efficiency in the 12 western provinces increased slightly in the study period due to the impact of techch. Therefore, it is imperative that each province apply big data and intelligent methods to manage their respective water resources, so that the technical efficiency can make a greater contribution to the water resource total factor productivity [47].
Third, as water resources are the basis for urbanization and industrialization, each province needs to properly adjust its proportion of input elements to ensure water resources development with the aim of achieving the harmonious development of urbanization, industrialization, and agricultural modernization [48,49].
Finally, the government also needs to encourage economic and technical exchange and inter-provincial water resource cooperation. The developed provinces need to provide guidance to the developing provinces on technical diffusion and structural upgrading, and technical water resource reform must be promoted in each province to improve the total factor productivity of the water resources scale efficiency.
There are some limitations in this paper. The input-output index system is incomplete. For example, there are many factors that affect water resource use efficiency. When selecting the input indexes, because of the lack of data on ecological water, the input-output index selections did not fully reflect the water resource utilization. Therefore, the water use efficiency index system is to be improved in the future. In addition, the Malmquist index method is the most effective for long time series data. As we only analyzed 11 years of water use efficiency in western China, there may be some limitations in the results. In further studies, different methods will be taken for the comparative studies, the input-output index systems for evaluating water use efficiency will be further explored and improved, and a longer time series considered to determine the total changes in water use efficiency in other areas of China, so as to provide more practical research results.
Author Contributions
The authors had the same contributions to complete the paper.
Funding
This research was funded by the National Natural Science Foundation of China (Grant Nos. 71501019, 71501138, 71601164 and 71502019), the National Social Science Foundation of China (Grant Nos. 18XJY006 and 14CJY008), the Youth Program of Social Science Research of Sichuan Province for the Twelfth Five-year Plan (Grant Nos. SC15C005 and SC15C030), China’s Post-doctoral Science Fund Project (Grant No. 2018M631069), the Philosophy and Social Science Planning Program of Chengdu (Grant No. 2018A09), the General Program of the Education Department in Sichuan Province (Grant Nos. 16SB0071 and 16SB0049), the Key Program of Resource-based city Development Research Center (Grant No. ZYZX-ZD-1701), the General Program of the Sichuan Oil and Gas Development Research Center (Grant No. SKB17-01), the Funding Program for Middle-aged Core Teachers at Chengdu University of Technology (Grant No. KYGG201519), and the Special funding for post-doctoral research projects on Sichuan in 2017 Named “dynamic evolution of multi-system coupling in resource-oriented cities of western China from a technology innovation-driven perspective”.
Acknowledgments
The authors are deeply grateful to thank anonymous reviewers and the editors for their valuable and constructive suggestions that improved this paper.
Conflicts of Interest
The authors declare no conflicts of interest.
References
- Dogru, T.; Bulut, U. Is tourism an engine for economic recovery? Theory and empirical evidence. Tourism Manag. 2018, 67, 425–434. [Google Scholar] [CrossRef]
- Qin, Y.; Luo, Y.Y.; Zhao, Y.Q.; Zhang, J. Research on relationship between tourism income and economic growth based on meta-analysis. Appl. Math. Nonlinear Sci. 2018, 3, 105–114. [Google Scholar] [CrossRef]
- Lu, X.H.; Ke, S.G. Establishment of regional water resources ecological compensation model based on ecological footprint model-take the Yangtze River for example. Resour. Environ. Yangtze Basin 2016, 25, 334–341. [Google Scholar] [CrossRef]
- Liu, X.; Qu, J.S.; Liu, L.; Zeng, J.; Qian, Y.E. Review on climate change adaptation and its risk in western China. Ecol. Econ. 2017, 33, 185–189. [Google Scholar]
- Jia, L.; Gan, H.; Wang, L.; Qin, C.H. Discussion on water resources liabilities. J. Nat. Resour. 2017, 32, 1–11. [Google Scholar] [CrossRef]
- Fuentes, R.; Torregrosa, T.; Ballenilla, E. Conditional order-m efficiency of wastewater treatment plants: The role of environmental factors. Water 2015, 7, 5503–5524. [Google Scholar] [CrossRef]
- Yang, T.F. The changes of the balance of supply and demand of water resources ecological support capacity in watershed of Changjiang River and Zhujiang River-a case of Qiandongnan. Territory Nat. Resour. Study 2017, 1, 47–50. [Google Scholar] [CrossRef]
- Liu, X.; Zhang, B. Water use efficiency and water conservation potential in China. Adv. Sci. Technol. Water Resour. 2015, 35, 5–10. [Google Scholar] [CrossRef]
- Lo Storto, C. Efficiency, conflicting goals and trade-offs: A nonparametric analysis of the water and wastewater service industry in Italy. Sustainability 2018, 10, 919. [Google Scholar] [CrossRef]
- Byrnes, J.; Lin, C.; Dollery, B.; Villano, R. The relative economic efficiency of urban water utilities in regional New South Wales and Victoria. Resour. Energy Econ. 2010, 32, 439–455. [Google Scholar] [CrossRef]
- Ma, H.; Shi, C.; Chou, N.T. China’s water utilization efficiency: An analysis with environmental considerations. Sustainability 2016, 8, 516. [Google Scholar] [CrossRef]
- Guerrini, A.; Romano, G.; Leardini, C.; Martini, M. The effects of operational and environmental variables on efficiency of Danish water and wastewater utilities. Water 2015, 7, 3263–3282. [Google Scholar] [CrossRef]
- Lo Storto, C. Are public-private partnerships a source of greater efficiency in water supply? Results of a non-parametric performance analysis relating to the Italian industry. Water 2013, 5, 2058–2079. [Google Scholar] [CrossRef]
- Deng, G.Y.; Han, J.; Zhang, Z.J. Study on measure of water use efficiency and rebound effect of Chinese provinces. Soft Sci. 2017, 31, 15–19. [Google Scholar] [CrossRef]
- Liao, H.; Dong, Y. Utilization efficiency of water resources in 12 western provinces of China based on the DEA and Malmquist TFP index. Resour. Sci. 2011, 33, 273–279. [Google Scholar]
- Zhu, Y.; Chen, Z.; Jin, Y. Evaluation on utilization efficiency of water resources in Jinhua city. Yangtze River 2016, 47, 43–47. [Google Scholar] [CrossRef]
- Ueda, T.; Hoshiai, Y. Application of principal component analysis for parsimonious summarization of DEA inputs and/or outputs. J. Oper. Res. Soc. Jpn. 2017, 40, 466–478. [Google Scholar] [CrossRef]
- Deng, G.; Li, L.; Song, Y. Provincial water use efficiency measurement and factor analysis in China: Based on SBM-DEA model. Ecol. Indic. 2016, 69, 12–18. [Google Scholar] [CrossRef]
- Toneab, K. Network DEA: A slacks-based measure approach. Eur. J. Oper. Res. 2009, 197, 243–252. [Google Scholar] [CrossRef]
- Ma, H.L.; Ding, Y.Q.; Wang, L. Measurement and convergence analysis of green water utilization efficiency. J. Nat. Resour. 2017, 32, 406–417. [Google Scholar] [CrossRef]
- Tone, K. Dealing with undesirable outputs in DEA: A slacks-based measure (SBM) approach(DEA(1)). Spring operations research meeting of the Japan. Oper. Res. Soc. 2004, 2004, 44–45. [Google Scholar]
- Oviatt, D.P.; Baumann, M.R.; Bennett, J.M.; Garza, R.T. Undesirable effects of working while in college: Work-school conflict, substance use, and health. J. Psychol. 2017, 151, 1–20. [Google Scholar] [CrossRef] [PubMed]
- Gao, X.P.; Sun, B.W.; Zi, T.L.; Zhang, C.; Li, Y.J. Application of improved fuzzy comprehensive water quality assessment based on weight matrix of temporal distribution. China J. Environ. Eng. 2017, 11, 970–976. [Google Scholar] [CrossRef]
- Wang, P.; Zhu, B.; Tao, X.; Xie, R. Measuring regional energy efficiencies in China: A meta-frontier SBM-Undesirable approach. Nat. Hazards 2017, 85, 793–809. [Google Scholar] [CrossRef]
- Liu, F.; Wang, Y. Research on efficiency measurement of China’s high end equipment manufacturing enterprise based on meta-frontier-bootstrap-DEA method. Stat. Inf. Forum 2017, 32, 92–98. [Google Scholar] [CrossRef]
- Charnes, A.; Cooper, W.; Golany, B.; Learner, D.B.; Phillips, F.Y. A multiperiod analysis of market segments and brand efficiency in the competitive carbonated beverage industry. Data Envel. Anal. Theory Methodol. Appl. 1994, 47, 145–165. [Google Scholar] [CrossRef]
- Färe, R.; Grosskopf, S.; Norris, M.; Zhang, Z. Productivity growth, technical progress, and efficiency change in industrialized countries. Am. Econ. Rev. 1994, 84, 66–83. [Google Scholar] [CrossRef]
- Yao, X.; Yan, J.; Wang, L. Industrial heterogeneity offshoring and productivity spillover: Empirical analysis based on wiod database. Econ. Rev. 2017, 4, 57–72. [Google Scholar]
- Al-Refaie, A.; Wu, C.W.; Sawalheh, M. DEA window analysis for assessing efficiency of blistering process in a pharmaceutical industry. Neural Comput. Appl. 2018, 6, 1–15. [Google Scholar] [CrossRef]
- Lu, X.; Xu, C.X. Study the utilization efficiency of water resources in Yangtze River economic based on three-stage DEA and Malmquist index decomposition. Resour. Environ. Yangtze Basin 2017, 26, 7–14. [Google Scholar]
- Zhang, F.T.; Su, W.C. Measurement and projection optimization analysis of water resources use efficiency in Chongqing. China Rural Water Hydropower 2016, 11, 93–96. [Google Scholar]
- Han, Y.Q.; Su, S.P. Static and dynamic analysis on water use efficiency of Fujian Province-Based on DEA-BCC and DEA-Malmquist Model. Resour. Dev. Mark. 2015, 31, 578–583. [Google Scholar]
- Zhang, K.; Ma, J.Z.; Wu, Z.B. Study of correction method of deep water sounding and application. Yangtze River 2015, 46, 48–51. [Google Scholar] [CrossRef]
- Wu, W.B.; Liu, Y.N.; Hu, Z. Comparison of water use efficiency of provincial water resources based on DEA model. China New Technol. Prod. 2008, 7, 190–191. [Google Scholar]
- Dong, Z.F.; Yu, E.Y.; Qiu, L. Water efficiency evaluation of the provincial regions in China based on DEA model. Ecol. Econ. 2012, 10, 43–47. [Google Scholar]
- Zhao, C.; Wang, Y.; Gu, X.M. Water use efficiency of Jiangsu Province based on the data envelopment analysis approach. Acta Ecol. Sin. 2013, 33, 1636–1644. [Google Scholar] [CrossRef]
- Sun, C.Z.; Yan, D. Evaluation of sustainable development of water resources and socio-economy in Dalian based on DEA model. J. Econ. Water Resour. 2008, 26, 1–4. [Google Scholar]
- Li, Z.M.; Liao, H.C. Input and output analysis of water resources across China in 2010. Resour. Sci. 2012, 34, 2274–2281. [Google Scholar]
- Wu, J.Y.; Han, Z.L.; Wu, H.G. Water resource utilization efficiency and its spatial spillover efficiency measure in Liaoning Province. Resour. Dev. Mark. 2017, 33, 417–422. [Google Scholar]
- Wang, Y. Chinese provincial water resources utility efficiency and its influencing factors based on super-efficiency DEA and Tobit model. China Rural Water Hydropower 2015, 41–44. [Google Scholar]
- Jiang, B.Q.; Liu, X. Evaluation on efficiency of water utilization of bohai economic zone based on DEA-Malmquist. Resour. Dev. Market. 2015, 31, 49–51. [Google Scholar]
- Dong, M.Y.; Liao, H.C. Utilization efficiency of water resource in west capital cities based on DEA. Bull. Soil Water Conserv. 2011, 31, 134–139. [Google Scholar] [CrossRef]
- Yu, Y.G.; Liu, L.Y. Regional differences and influence factors of water resource efficiency in China: Based on super efficiency DEA-Tobit. Econ. Geogr. 2017, 37, 12–19. [Google Scholar]
- You, S.Q. Different cities in our country are green research on total factor water resources efficiency. Acad. Exch. 2016, 267, 173–176. [Google Scholar]
- Ma, H.L.; Huang, D.C.; Zhang, J.G. Water resource utility efficiency and its influencing factors considering undesirable goods. China Popul. Environ. 2012, 22, 35–42. [Google Scholar]
- Liu, J.; Bai, Y.; Han, X. The impact of urbanization on innovation on efficiency in China-based on SFA model test in two stage of innovation. Chin. J. Manag. 2017, 14, 704–712. [Google Scholar] [CrossRef]
- Wada, Y.; Gleeson, T.; Esnault, L. Wedge approach to water stress. Nat. Geosci. 2014, 7, 615–617. [Google Scholar] [CrossRef]
- Das, B.; Singh, A.; Panda, S.N.; Yasuda, H. Optimal land and water resources allocation policies for sustainable irrigated agriculture. Land Use Policy 2015, 42, 527–537. [Google Scholar] [CrossRef]
- Salmoral, G.; Willaarts, B.A.; Garrido, A.G.; Guse, B. Fostering integrated land and water management approaches: Evaluating the water footprint of a Mediterranean basin under different agricultural land use scenarios. Land Use Policy 2017, 61, 24–39. [Google Scholar] [CrossRef]
© 2018 by the authors. Licensee MDPI, Basel, Switzerland. This article is an open access article distributed under the terms and conditions of the Creative Commons Attribution (CC BY) license (http://creativecommons.org/licenses/by/4.0/).