1. Introduction
The control system of quadcopter movement has six degrees of freedom, consisting of three translational and three rotational movement, which are crucial for the maneuverings stability [
1]. By controlling the rotational speed of each rotor, one can also manage the thrust. Orientation sensors such as gyroscope, accelerometer, magnetometer, and GPS (Global Positioning System) are used to continuously read the quadcopter’s position, so each movement error can be assessed and corrected using sensor fusion algorithms [
2,
3]. The control system has the most important role in achieving a high stability [
4,
5,
6]. Quadcopter maneuver stability can be discerned with naked eyes, and can be read through the log of sensor data used for each acceleration and angular change in the three-axis coordinates. The control system and orientation sensors will adjust continuously to maintain the desired flight position [
7]. To improve the performance of the orientation sensors and to reduce the position error, monitoring of the speed rotors is needed, especially during hovering and throttling. Monitoring and control adjustment can be done in various ways, for example, using cascade iterative [
8], test bench system [
9], and spherical model for UAV (Unmanned Aerial Vehicle) [
10]. In this study, however, the development of a thrust data logger was adapted, and it was specially designed to read the thrust generated on each rotor–propeller simultaneously.
A common problem with quadcopters is unequal thrust, despite using an identical propeller and angular velocity. The propeller’s imbalances and vibrations, the values of the pulse width modulation (PWM) or pulse position modulation (PPM) on the electronic speed controller, as well as the remote-control rate, may cause uneven thrust. A data logger is needed to overcome this problem. It is used to read the vertical thrust from rotor–propeller and to assist in the pre-flight calibration process, which will result in equal thrust for each rotor–propeller in hover or throttle mode.
The thrust data logger was developed using four pieces of a load cell sensor. A load cell is one of the devices capable of measuring sheer force and bending movement [
11,
12]. In this study, the mechanic and electronic parts were modeled. The load cell position formed a rectangular coordinate system, which is parallel with the inertial frame of the quadcopter. Positions along the
x-axis and
y-axis of the coordinate system are used to discover the angular change in the roll and pitch position, respectively. The data obtained from the two-axis load cell allows a flight calibration to be performed on the control system to achieve flight stability. When the quadcopter has throttle with various speeds, all of the rotors must generate equal thrust. This system design covers the overall quadcopter movement through the generated thrust. Because the test was done on a quadcopter assembled entirely from spare parts, any propeller imbalance or differences in rotor speeds can be observed in detail. In this study, the specific mechanical design embedded with the load cell and electronic board will allow real-time signal processing, in which the serial data can be read every second via the USB (Universal Serial Bus) port as a serial monitor with a transmission rate of 9600 bits per second. An adjustment of the thrust value can be done easily by knowing the thrust error rate of each rotor. The thrust data logger is also used to perform trim calibration and a proportional integral derivative (PID) coefficient adjustment on the quadcopter control system. Thus, the thrust data must be simultaneously collected, this way allowing for real-time settings. The result will be validated by the orientation sensors data when the quadcopter flies under windless conditions.
2. Thrust Data Logger Model
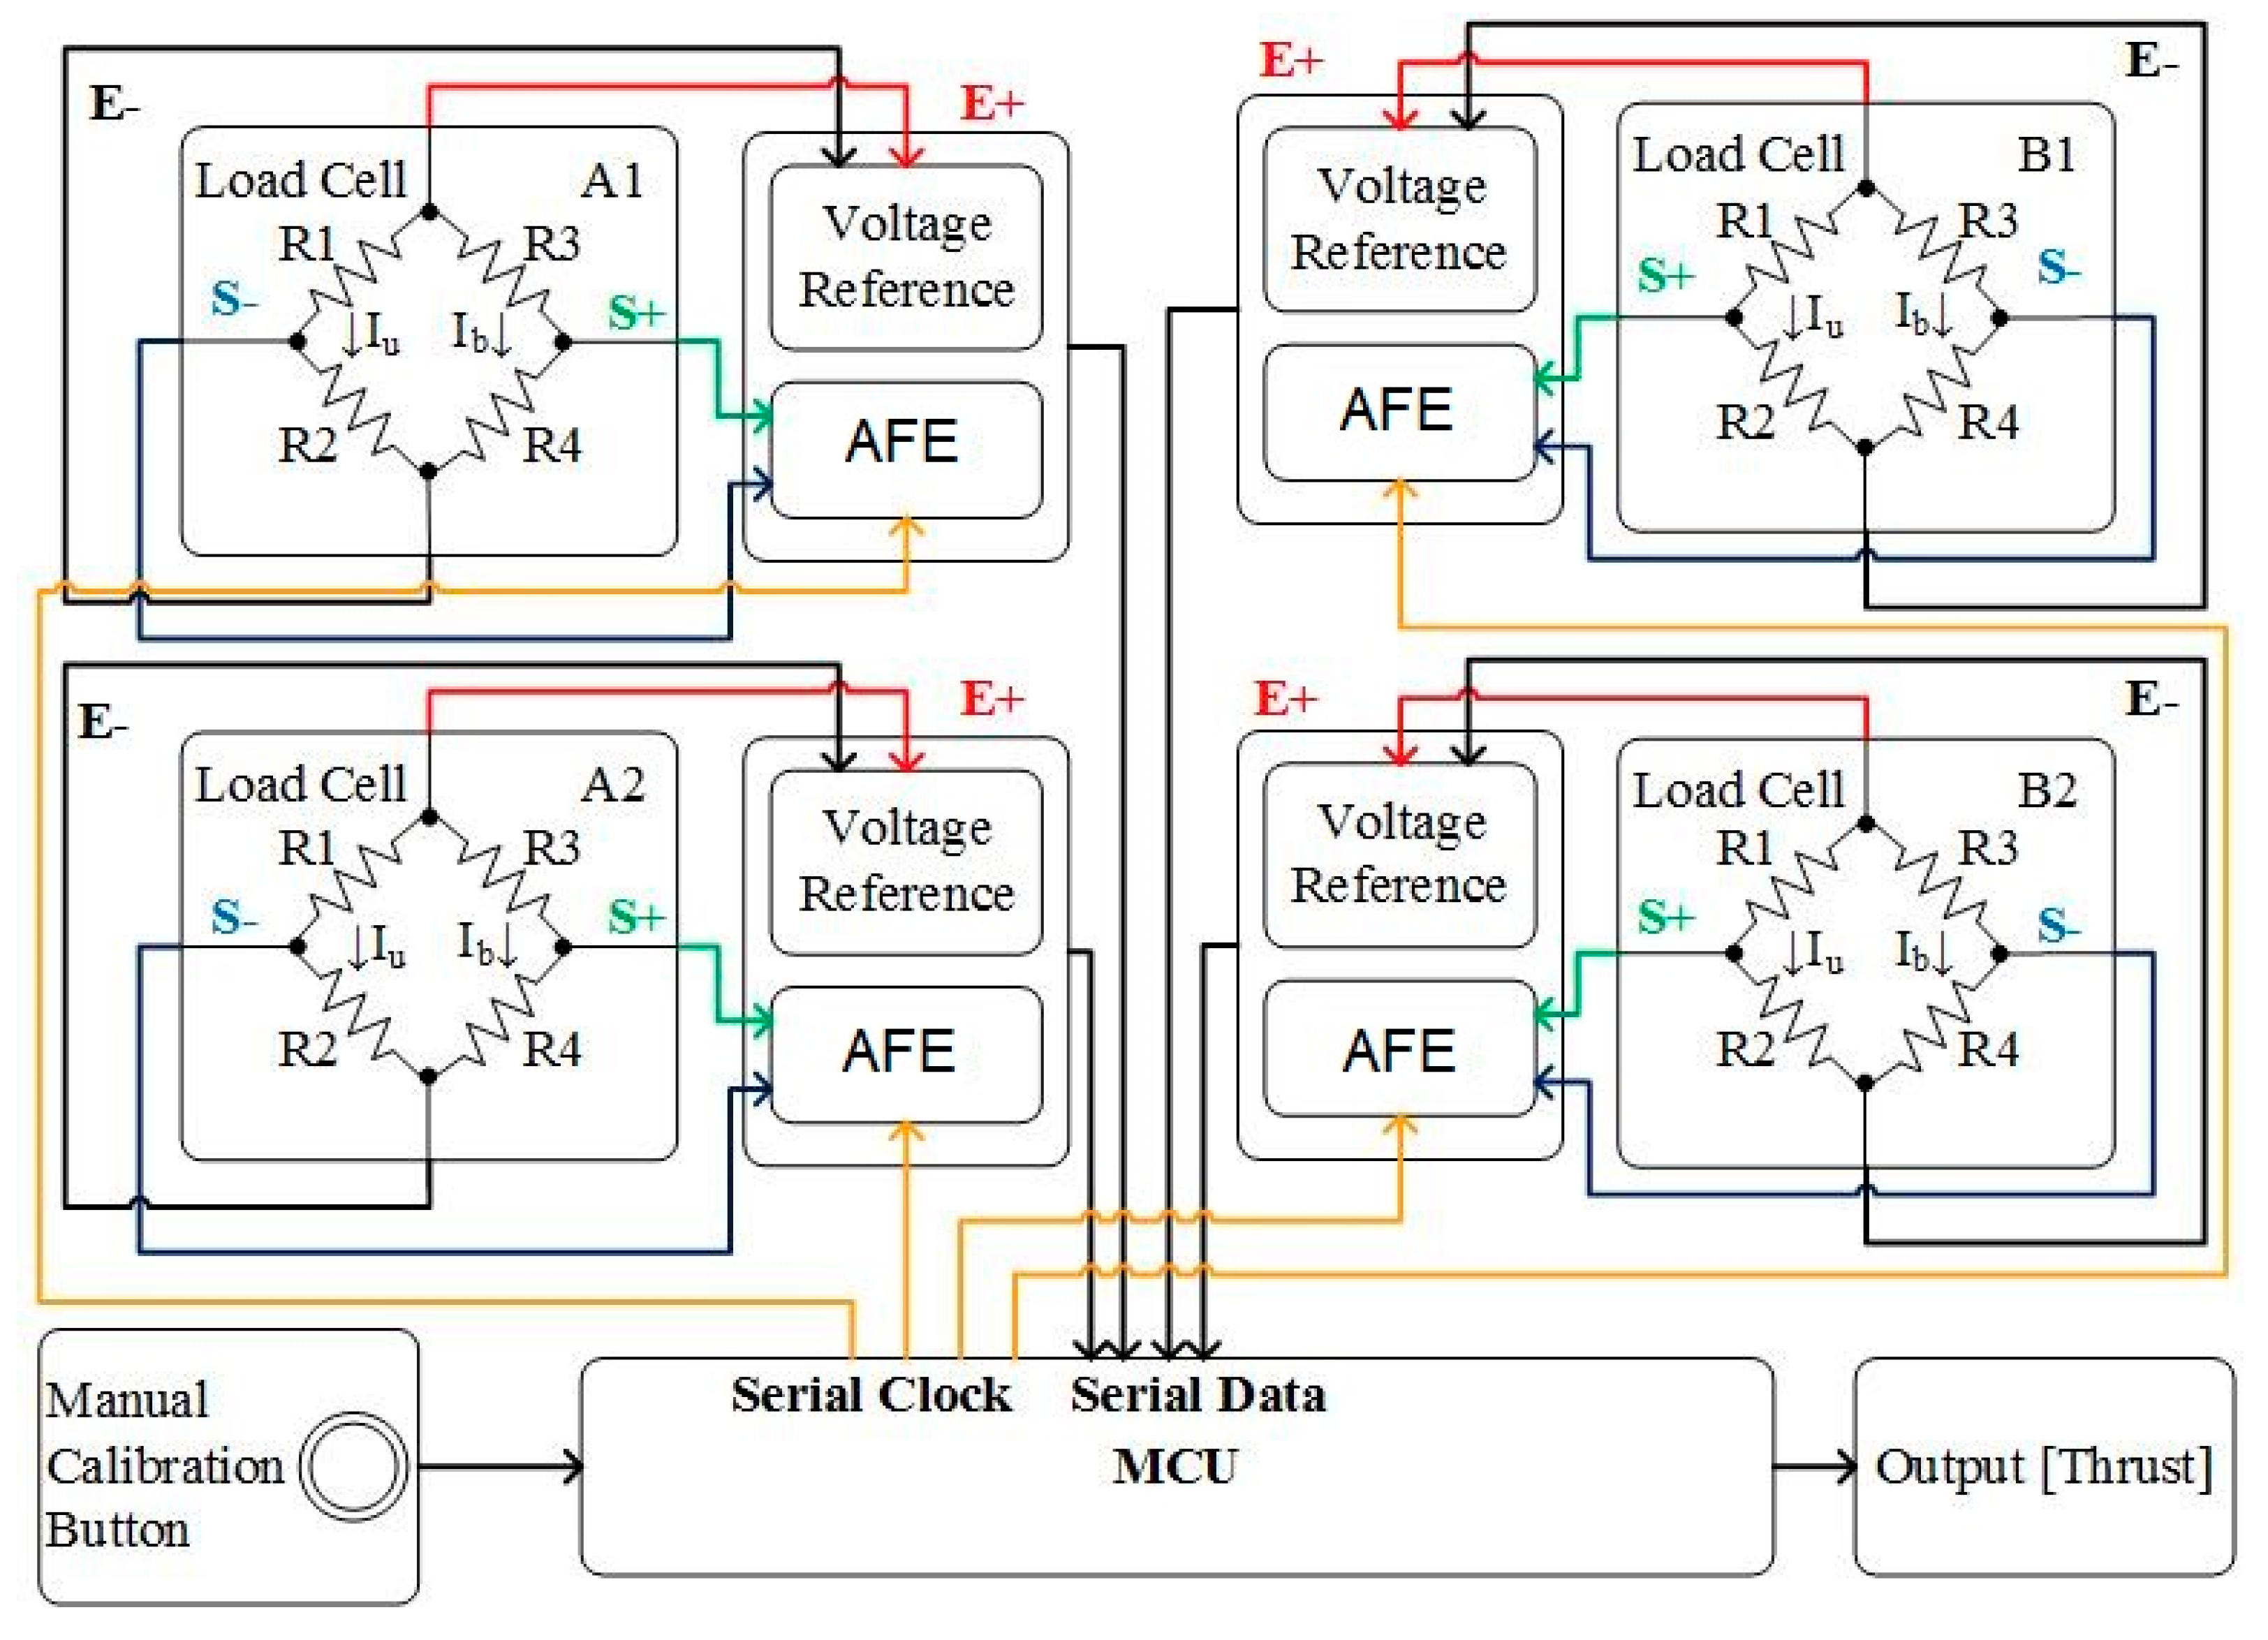
The thrust data logger was designed to continuously measure the thrust value generated by the quadcopter’s rotors and was used in the pre-flight calibration process. There are three components required to design this system, that is, a load cell sensor, an analog-front-end (AFE), and a microcontroller unit (MCU). A detailed schematic of this thrust data logger can be seen in
Figure 1. The load cell sensor is usually used as a tool to measure weight and force [
13,
14]. In this study, it was used to measure thrust based on the correlation between weight and the magnitude of the gravity acceleration. The output of the sensor is a voltage signal, which needs to be translated into a digital form using an AFE containing a 24-bit analog digital converter (ADC) driver before being processed by the MCU. The MCU calculates the analog input voltage between 0 to 5 volts, which yields a resolution between a reading of 4.9 mV per unit. With a 16 MHz MCU clock, the ADC must be set to a 125 kHz sampling rate. The thrust calibration was performed on the MCU, and this system was designed to retrieve data once a second. The thrust data logger was calibrated using professional equipment. An automatic zero calibration was designed so that the weight of the quadcopter is eliminated; thus, only the thrust value on each axis has been obtained. The manual calibration using buttons was provided to ensure the initial values before starting the data retrieval process.
The magnitude of the reference voltage is denoted by (E+) and (E−), the voltage output is denoted by (S+) and (S−), and the load cell sensors are denoted by (A1), (A2), (B1), and (B2). Load cell sensors with a maximum load of 1 kg were used to measure the magnitude of the upward and downward force on the z-axis on each rotor [
15]. The symmetrical position of the quadcopter rotor made the load sensors on the data logger be in symmetrical position as well. The quadcopter was placed together with the data logger sensor on the ground station, where the rotor and load cell sensor must be in parallel position.
The concept of measuring using a load cell sensor is to change the stimulus received by the sensor’s mechanical part into an electrical signal. The changes manifest in the form of resistance modification. The system is based on the concept of the Wheatstone bridge circuit, as seen in Equations (1)–(3) [
16].
The sensitivity of the sensors
can be calculated using Equation (4), where
is the excitation voltage,
is the rated output, and
is the maximum capacity of the load cell sensor. With a maximum capacity of 1 kg, the sensitivity of the load sensor is 0.7 mV/kg. The sensitivity of the load sensor still depends on the signal processing time [
17].
In this design, a 5 volt power supply was given as a reference voltage
or an excitation voltage. A detailed specification of the load cell sensor used can be seen in
Table 1.
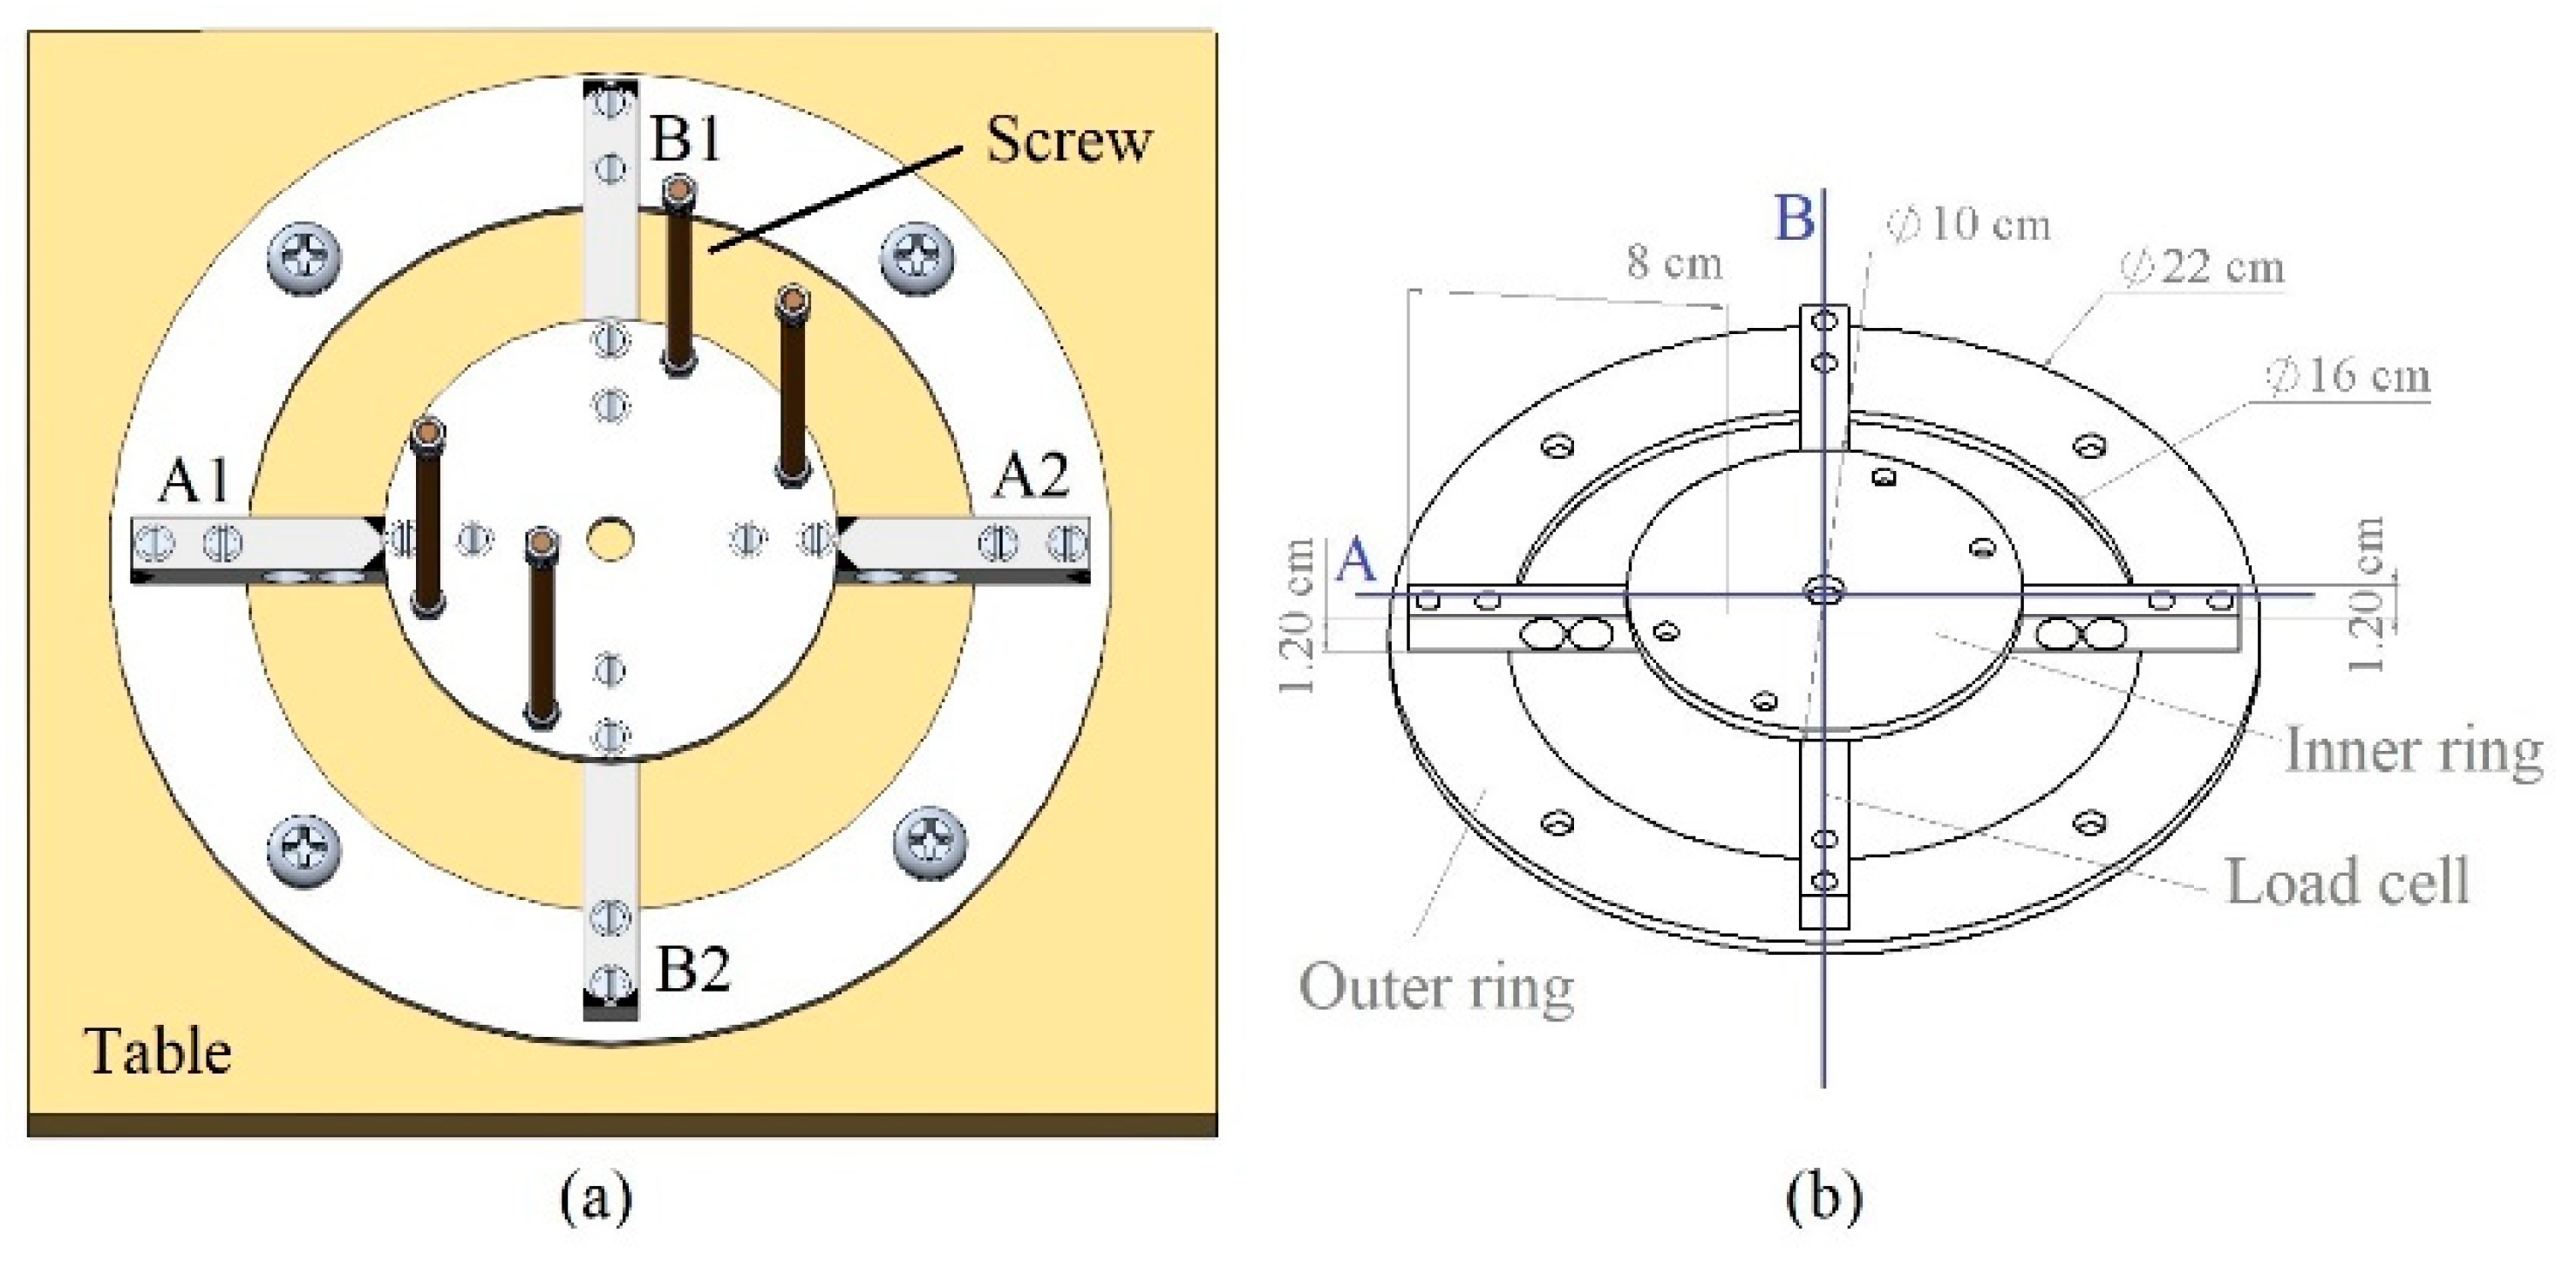
The design of the mechanical data logger and the details of the mechanical size can be seen in
Figure 2. The load cell sensor was attached with two types of aluminum ring with thickness of 4 mm. At the bottom, there was an outer ring connecting the load cell with a flat surface, where, in this case, there was a table with a weight significantly greater than the total force generated by the quadcopter. The inner ring on the top of the load cell sensor was used as the foundation for connecting the quadcopter with the sensor. Four M6x100 screws were used as connectors and each screw was in a symmetrical position.
This model shows the two axis load cells (i.e., the
A-axis and
B-axis) used to measure thrust, which correlates with the quadcopter’s three degrees of freedom. Knowing the changes in the thrust values for each of the four sensors points, the errors in the angular changes of the yaw
, pitch
, and roll
angles in a 3-dimensional (3D) coordinate system
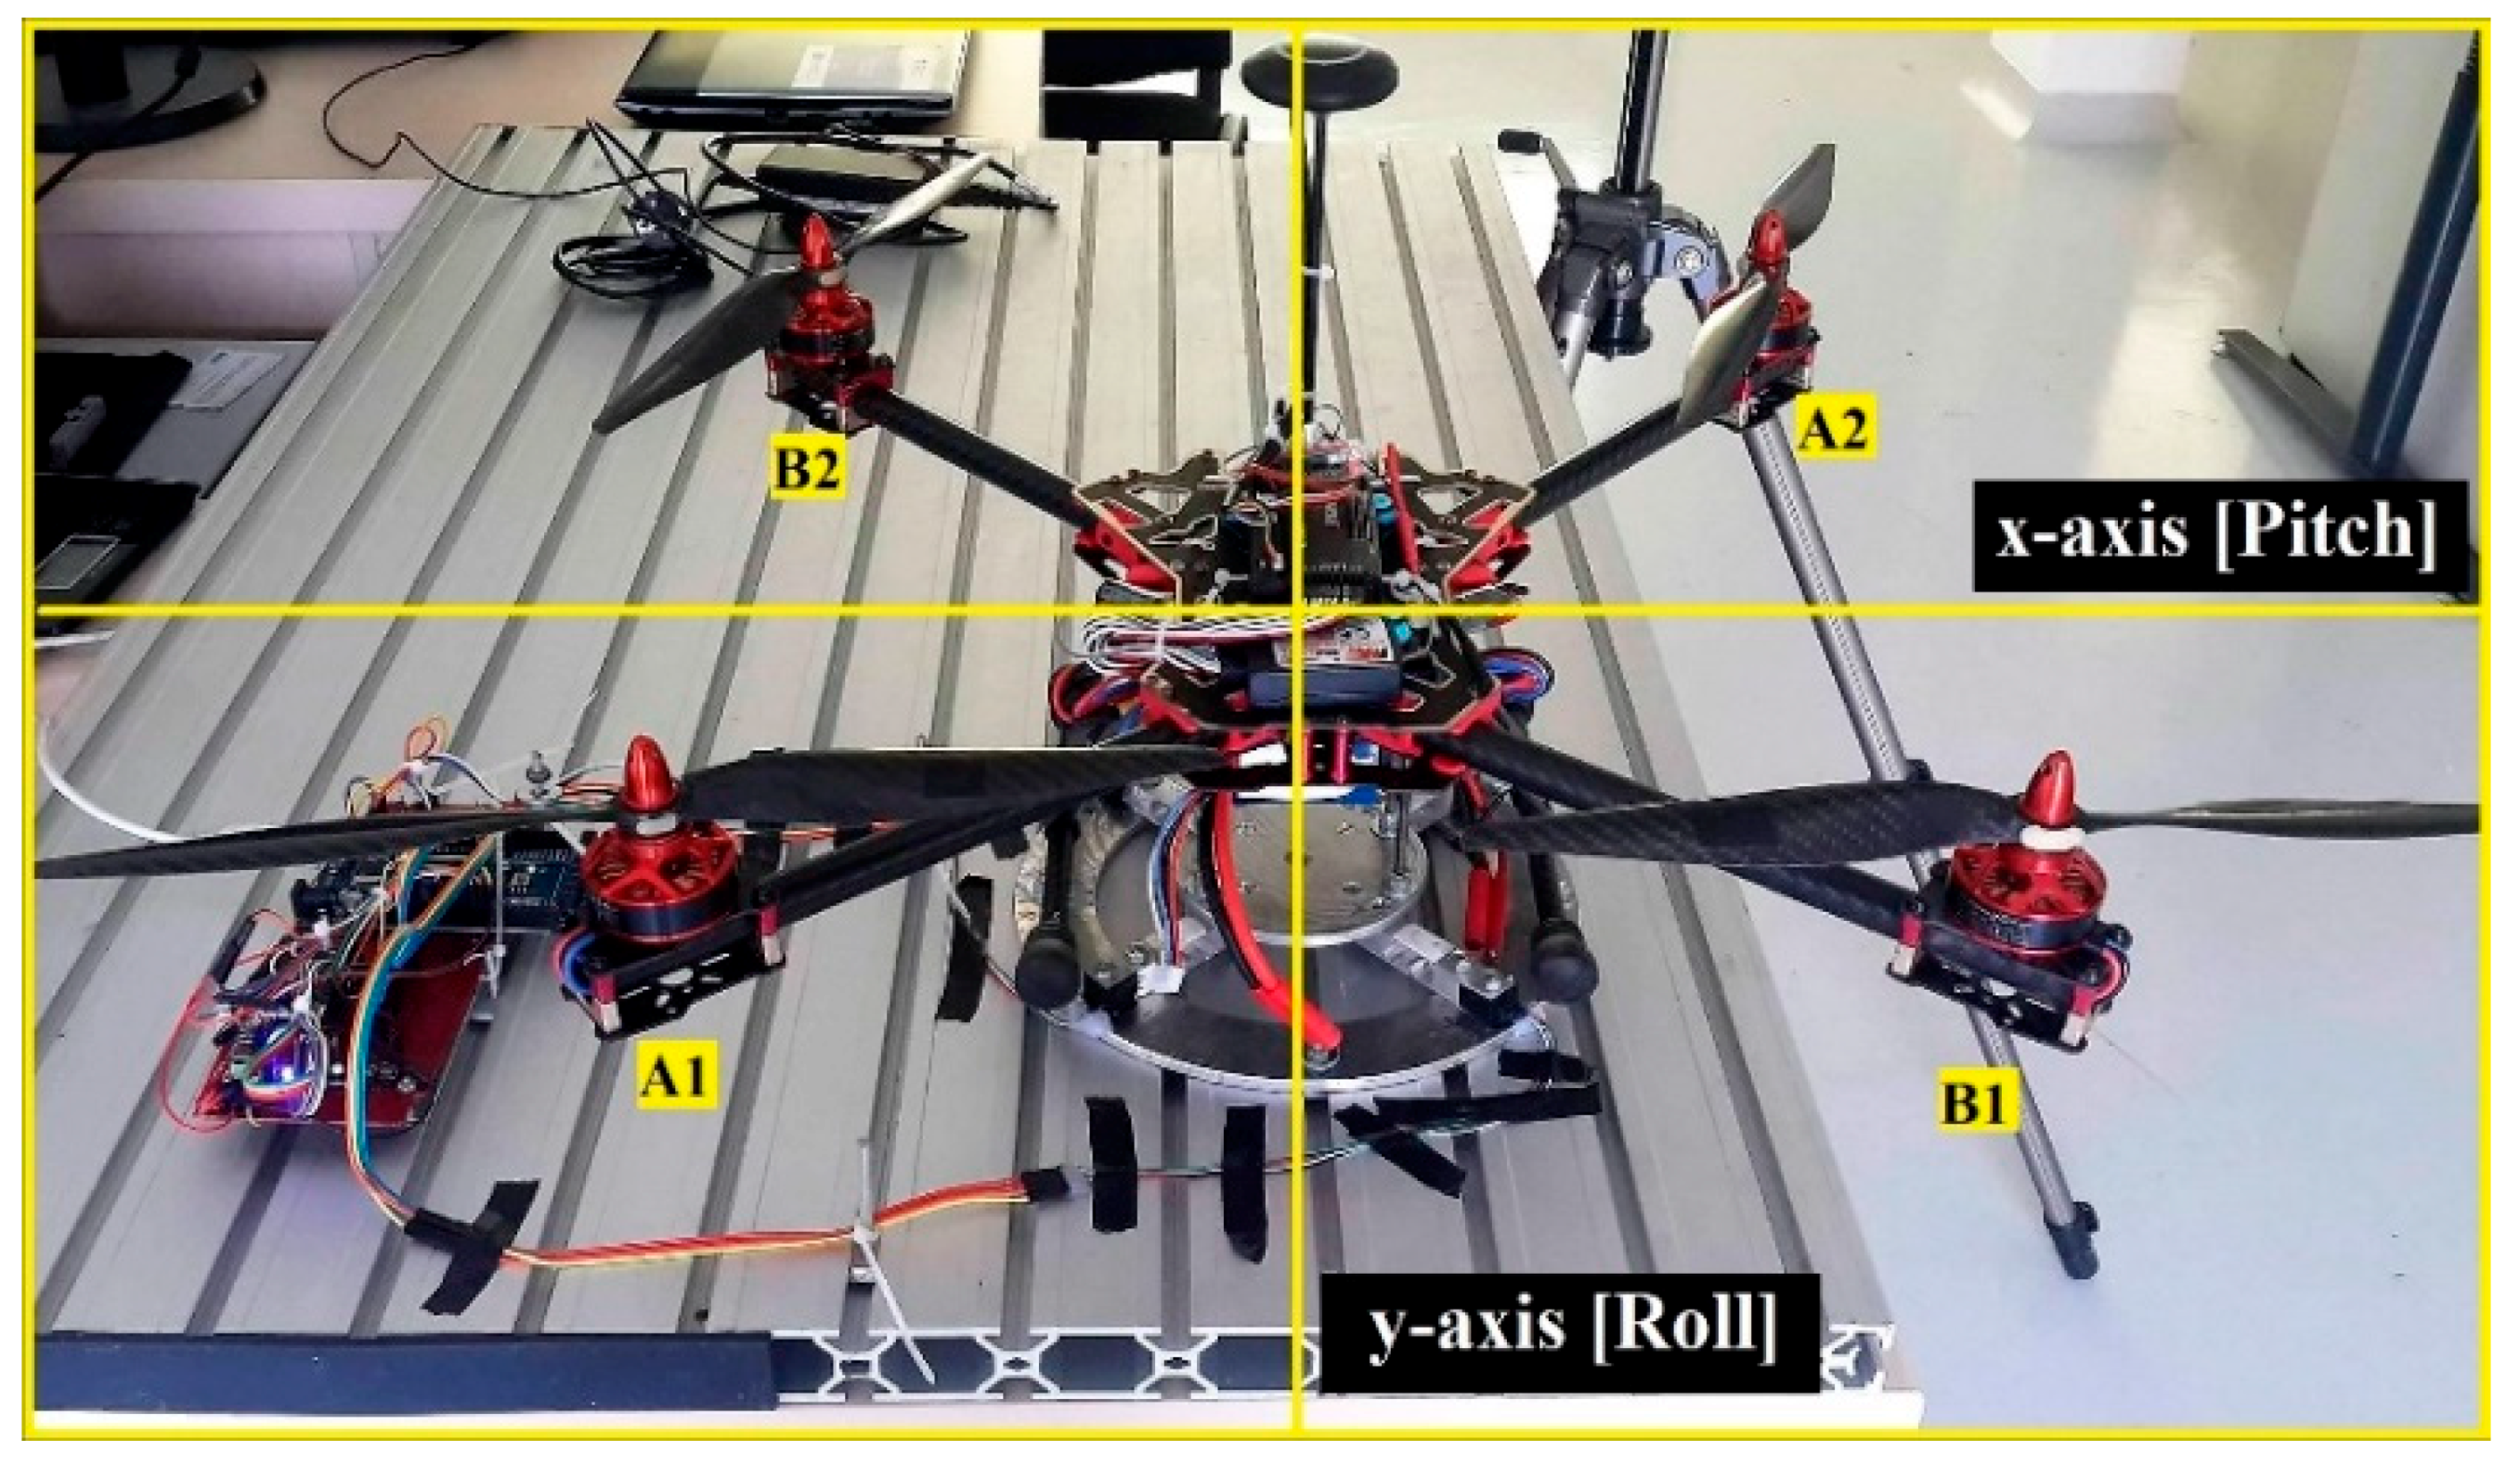
can be calculated and further reduced by adjusting the control system. One of the simplest concepts of quadcopter maneuvering is that, if one of the rotors produces a smaller thrust than the other, the quadcopter will move toward the smaller thrust. The prototype of the thrust data logger can be seen in
Figure 3. The quadcopter used in this test has a symmetrical length and width of 46 cm and a height of 8 cm, having 33 cm long propellers.
The experiment started with thrust data retrieval during the hovering state to see if each rotor produces the same value. Afterwards, when throttling, the speed of the quadcopter was increased from the lowest speed of 1200 rpm to the highest speed of around 4080 rpm. The angular velocity of the rotor was measured with a laser optical sensor using the time of arrival of the phase marker method, at a sampling frequency of 48 kHz and a resolution of 1.5625 Hz. The data obtained was then used to perform the calibration process on the quadcopter.
3. Data Processing
The MCU as the central processing unit on the data logger will process the serial data from all of the load sensors into thrust values. A dynamic compensation algorithm was needed to read the analog signal for each load cell [
19,
20]. The MCU was designed to be able to read the analog signal with a 125 kHz sampling rate, and a full-scale differential input voltage of 40 mV was used as a low noise programmable gain amplifier. In relation to the quadcopter movement stability calibration, signal processing occurs not only in the data logger, but also on the MCU on the quadcopter. It can be said that the data logger functions to continuously monitor the output during the quadcopter’s calibration. A manually controlled quadcopter with a remote control can be calibrated through the trim process. Data processing on the quadcopter commonly uses a PID control system. The exact output value of the coefficient gain adjustment process can be read through the data logger, which measures the thrust simultaneously. The designed data logger can work steadily when the rotor is in a steady speed.
3.1. Thrust Data Logger
The data processing on the data logger was made by reading the output signal of the load cell used in the weighing system, in which the measured weight had been converted into the thrust value [
21,
22]. A certain period is needed in order to avoid the oscillation of the response signal from the load cell, for getting more accurate data. The load cell sensor has one degree of freedom (along the z-axis) with dynamic behavior, and generally is used in weighting the devices. The mechanical design of this sensor produces elastic behavior with a linear output signal to facilitate the calibration process [
23]. The data processing speed for the load cell sensor can be calculated using Equation (5) [
24].
where
is the load cell response time,
is the natural frequency depending on MCU’s clock frequency,
is the load cell’s static gain, and
is the thrust value. From Equation (3), it can be seen that the sensor output is a voltage, and it needs to be calculated using Equation (6). The 24-bit ADC data is translated into units of weight by performing a data comparison between the measured values
, with the reference value at no load
. These results will be converted into a mass value by being divided by 61.9 as a weight calibration value. The expression for the thrust value can be defined in terms of the normal gravity acceleration
. This equation applies to all of the load cells’ sensors that are used in this system, and the output data can be read continuously through serial monitor.
3.2. Dynamic Movement of Quadcopter
The quadcopter control system algorithm can be analyzed using Newton Euler theorem, and there are various control systems that can be used to improve the stability of the quadcopter [
25,
26,
27]. The quadcopter’s dynamic behavior on each axis can affect the angular change [
28,
29]. The amount of thrust generated depends on the rotor’s angular velocity
. The value of the lifting constant depends on the air density generated by the propeller
, as seen in Equation (7). From the other perspective, the amount of torque
generated in each axis can be calculated based on the resulting thrust for the same axis
as well as the distance between the rotor and the center of mass
, as seen in Equation (8).
The torque generated on each axis affects the rotational angle alteration. The magnitude of the rotational acceleration for the resulting airframe will affect the quadcopter dynamic movement, and it can be calculated using Equation (9).
where
represents mass,
represents the 3
× 3 identity matrix,
represents the linear acceleration,
represents the linear velocity,
is the angular velocity,
represents the torque applied to the bodyframe,
represents the angular acceleration, and
represents the moment of inertia. The inertia matrix for the quadcopter can be written diagonally in a matrix transform because of the symmetry of the quadcopter’s geometry, as expressed in Equation (10).
where
Ixx,
Iyy, and
Izz are presented in Equation (11), considering that the rotors are assimilated as material points. The inertia moments are calculated based on angular momentum in the body-frame coordinate, with the mass of a quadcopter
The weight of the rotor
and the distance between the frame and the rotor
will affect the inertia moments for each axis. Because of the quadcopter’s symmetry, the value of the inertia moments for the
x- and
y-axis are equal. The motion of the quadcopter, especially the rotor’s thrust, affects its attitude.
The Newton–Euler equation for the quadcopter’s dynamic (Equation (9)) shows two components, one for the rotation movement and one for translation. The translational component is presented in Equation (12), in which the disturbances are highlighted in the d vector. The total vertical thrust is represented with
and is related to Equation (8). On the
z-axis, the gravitational force
and the total mass of the quadcopter
affect all of the rotational angles (i.e., pitch, roll, and yaw angles). The vector
affects the magnitude of the translational vector.
The correlation between the designed thrust data logger and the quadcopter dynamic movement can be seen in Equations (8), (9) and (12). On hover state, the value of the pitch, roll, and yaw angles must be equal to zero. If the thrust generated on each rotor–propeller are unequal, angle alteration and rotational acceleration on the airframe may occur. The rotational acceleration affects the translational vector on each axis on the quadcopter. In such a case, the quadcopter position can be maintained by adjusting the error. If the thrust values are known, the adjustment of the rotational speed on each rotor will be easier. It is important to note that the thrust generated are affected by the thrust factor, that is, the rotor rotation and air density generated by the propeller. The thrust factor is closely related with the propeller’s aspects (i.e., size, angle of attack, vibration, and balance).
3.3. PID Control System
One of the thrust data logger system applications in a quadcopter is to set the coefficient values of the PID control system. This control system allows for minimizing errors during manoeuvers, by performing a manual adjustment to the coefficient of the PID in correlation with the quadcopter’s angle and position on each axis. Details of the PID algorithm and simulation analysis are presented in previous research [
30]. A translation or rotational error can occur with different magnitudes on the pitch, roll, and yaw motion. Based on this condition, the PID control system is divided into three sub-systems, namely pitch, roll, and yaw. By adjusting the coefficient value of each motion using the Ziegler–Nichols rules, movement stability can be achieved [
31,
32]. After the data is processed, the thrust generated at the two-axis coordinates system (illustrated on
Figure 3) will affect the angular change on the pitch (
x-axis) and roll (
y-axis).
The dynamic value of the thrust on the
x- and
y-axis will affect the torque and thrust on the
z-axis. From Equation (9), the pitch movement with a positive torque value will move the quadcopter backwards, while the opposite will move the quadcopter forwards. In the roll movement, a positive torque value will cause the quadcopter to move leftwards, and vice versa. The yaw movement or rotation on the
z-axis can occur if a pair of rotors rotating in the same direction has a lower speed than the other. On the
z-axis, the throttle level can occur if all of the rotors produce an equal thrust while increasing or decreasing the rotors speeds, thus affecting the altitude of the quadcopter.
All of the dynamic movement trajectories are read through the orientation sensor, so that each acceleration and angular change can be compared with the desired position. The magnitude of this error value can be minimized with a PID control system and can indirectly set the amount of thrust generated by each propeller. By using the Euler equation, the angular velocity vector of dynamic movement can be taken into account, and the influence between the resulting angle and the thrust can be seen in Equation (13). This equation shows the PID algorithm used to perform the adjustment for each of the trajectories, in which the desired values of the pitch, roll, and yaw angles are represented by , and is the output read through the orientation sensor.
4. Result and Discussion
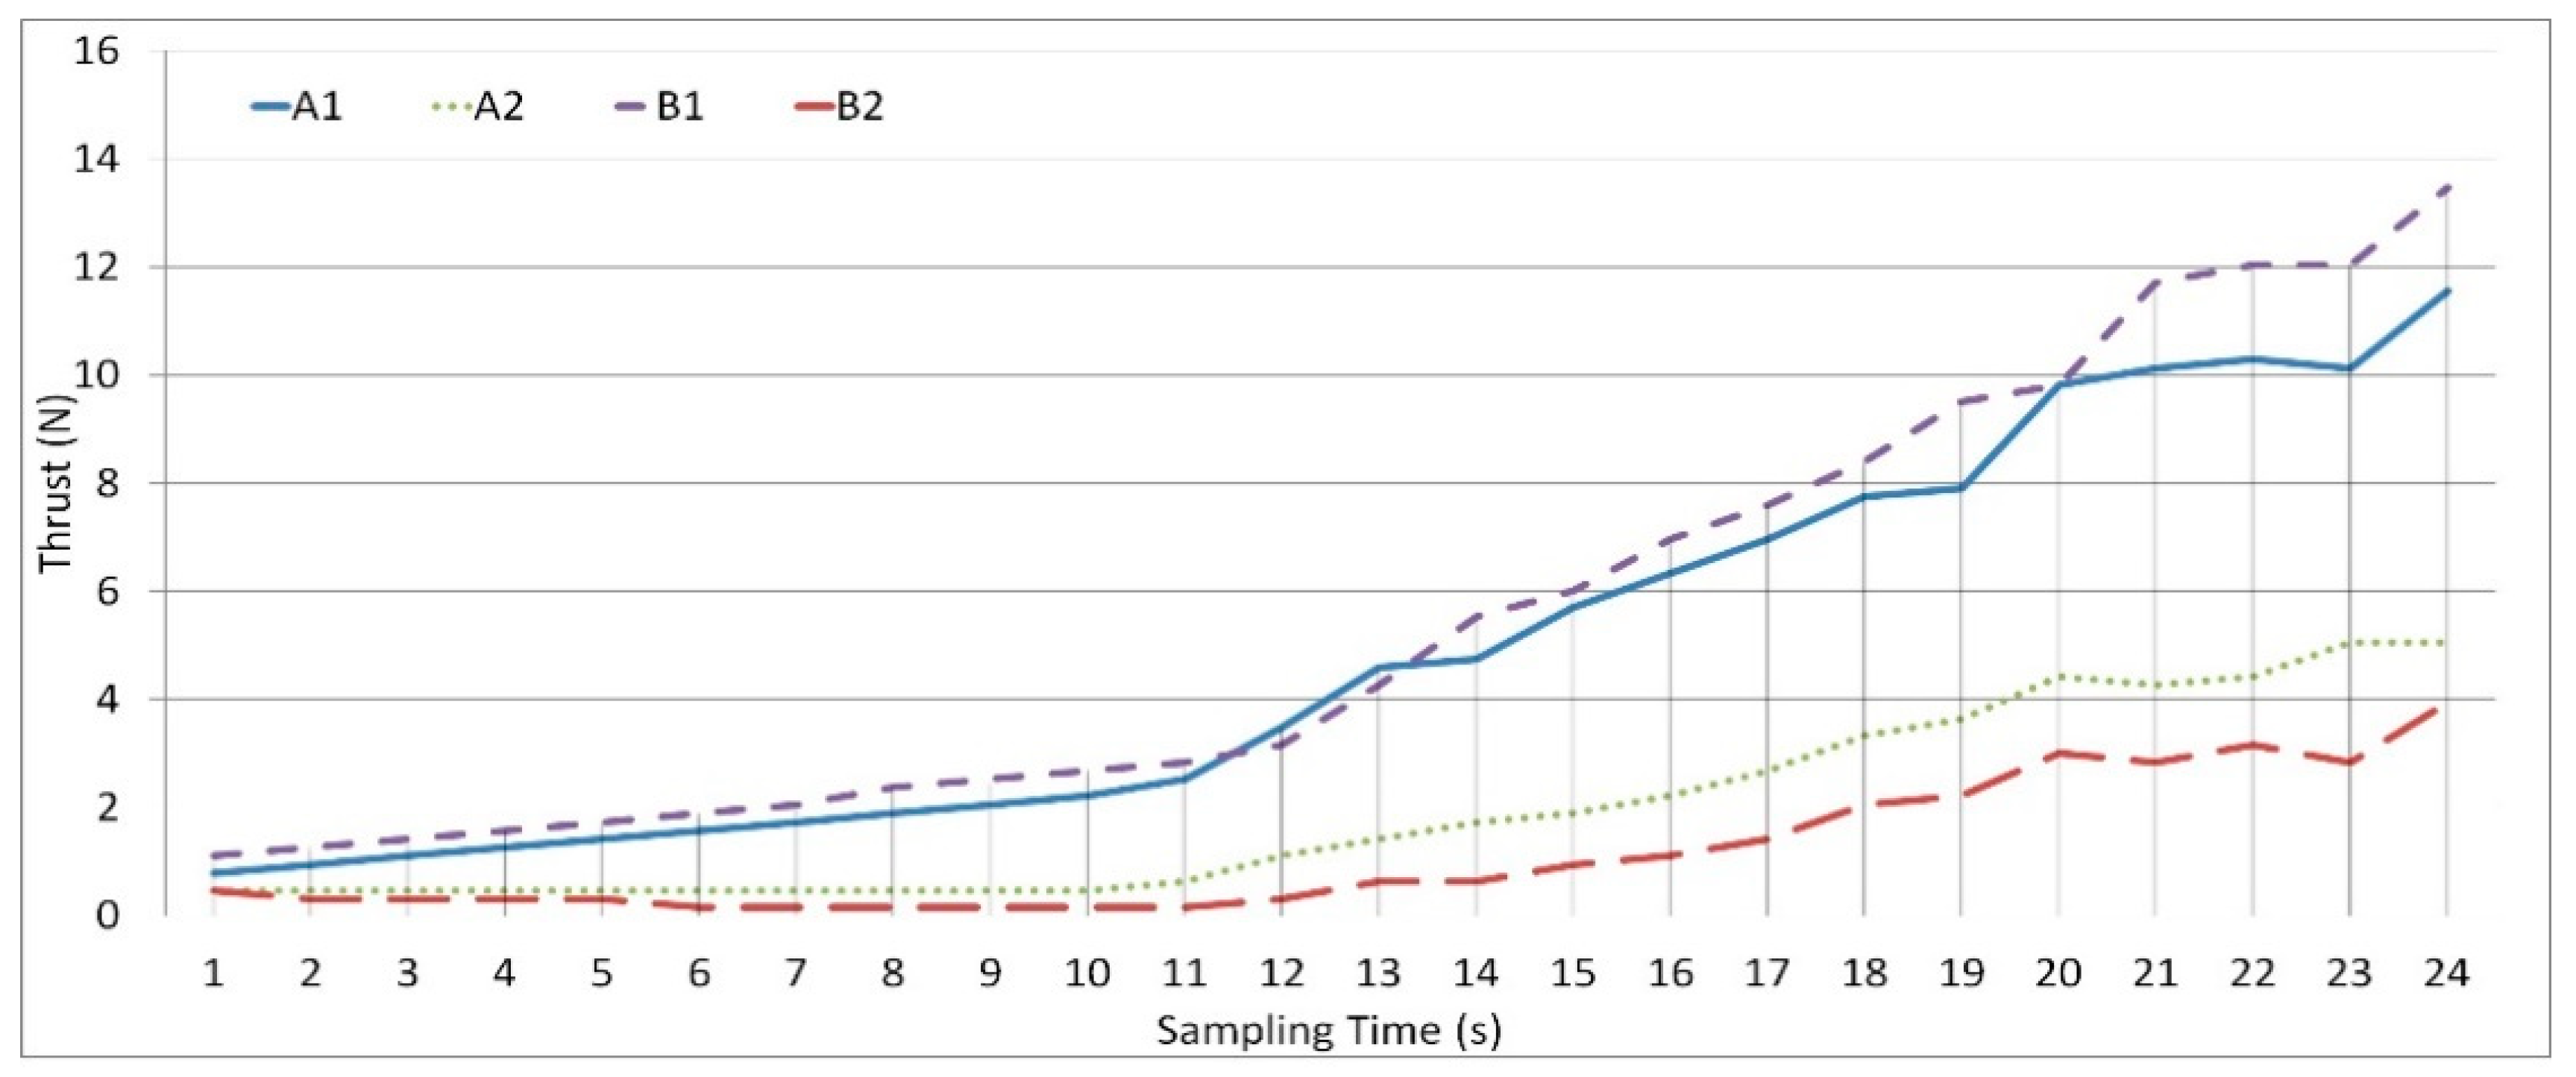
A thrust data logger with a maximum load of 4 kg was tested to measure the thrust value and perform a stability adjustment for a 1.8 kg quadcopter. A laser optical sensor was used to measure the angular velocity of the rotor–propeller. At the time of the measurement, all of the electronic and mechanical parts of the quadcopter should be in the same position under conditions similar to flight. The quadcopter’s center of the mass must be aligned with the thrust data logger’s center, otherwise the total reaction of the torque on the airframe quadcopter may be affected. The first test was performed to determine the thrust value generated in throttle mode, with the rotor speed increasing gradually from 1200 rpm to 4080 rpm. As much as 24 sample points have been considered, each sample being acquired during a period of 1 s. The trust obtained from the data logger can be seen in
Figure 4.
To analyze this data, it should be considered that the thrust produced by the propellers moving in the same direction (in
A-axis or
B-axis) will interfere with each other. Each rotor produces a different thrust with a significant error. In the
A-axis, at 1200 rpm, the difference in the thrust value is 0.3 N while in the
B-axis it is 0.5 N. With high speed, the thrust difference is approximately 5 N. The higher the speed, the greater the error, so stability cannot be obtained. If one rotor has a higher thrust than the other in the
z-axis, then the position of said rotor will have a greater positive value than the other.
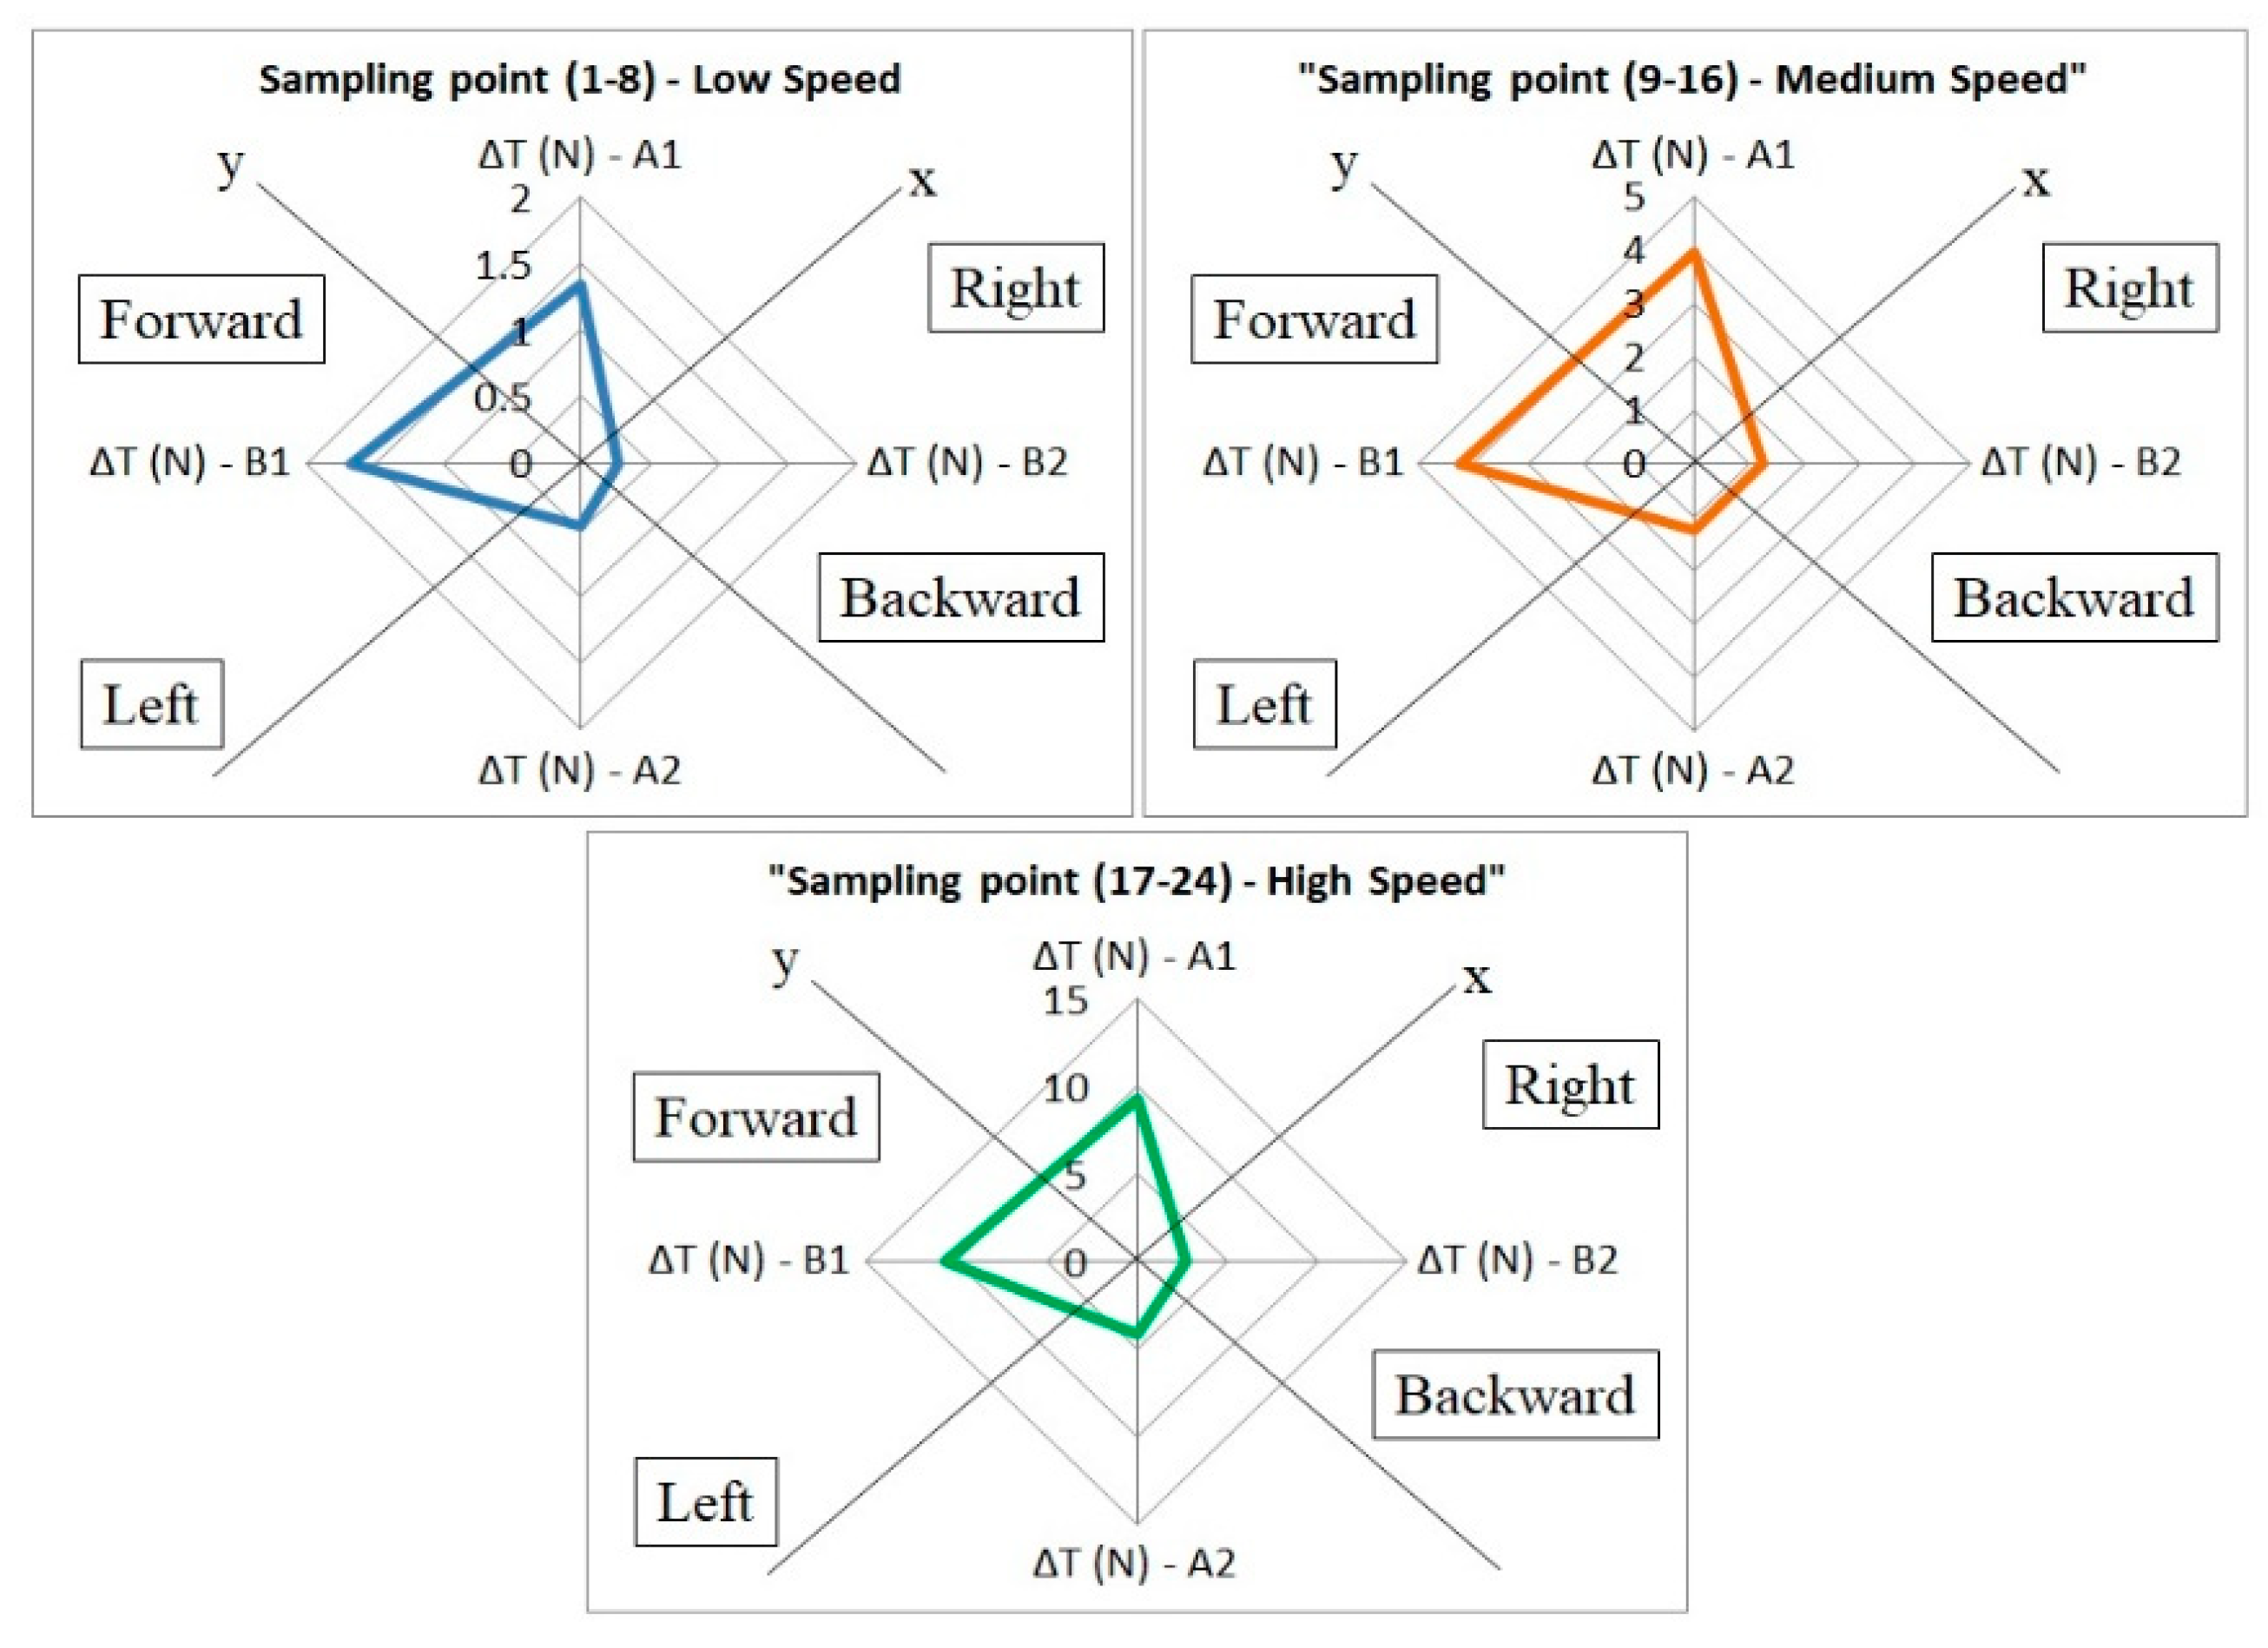
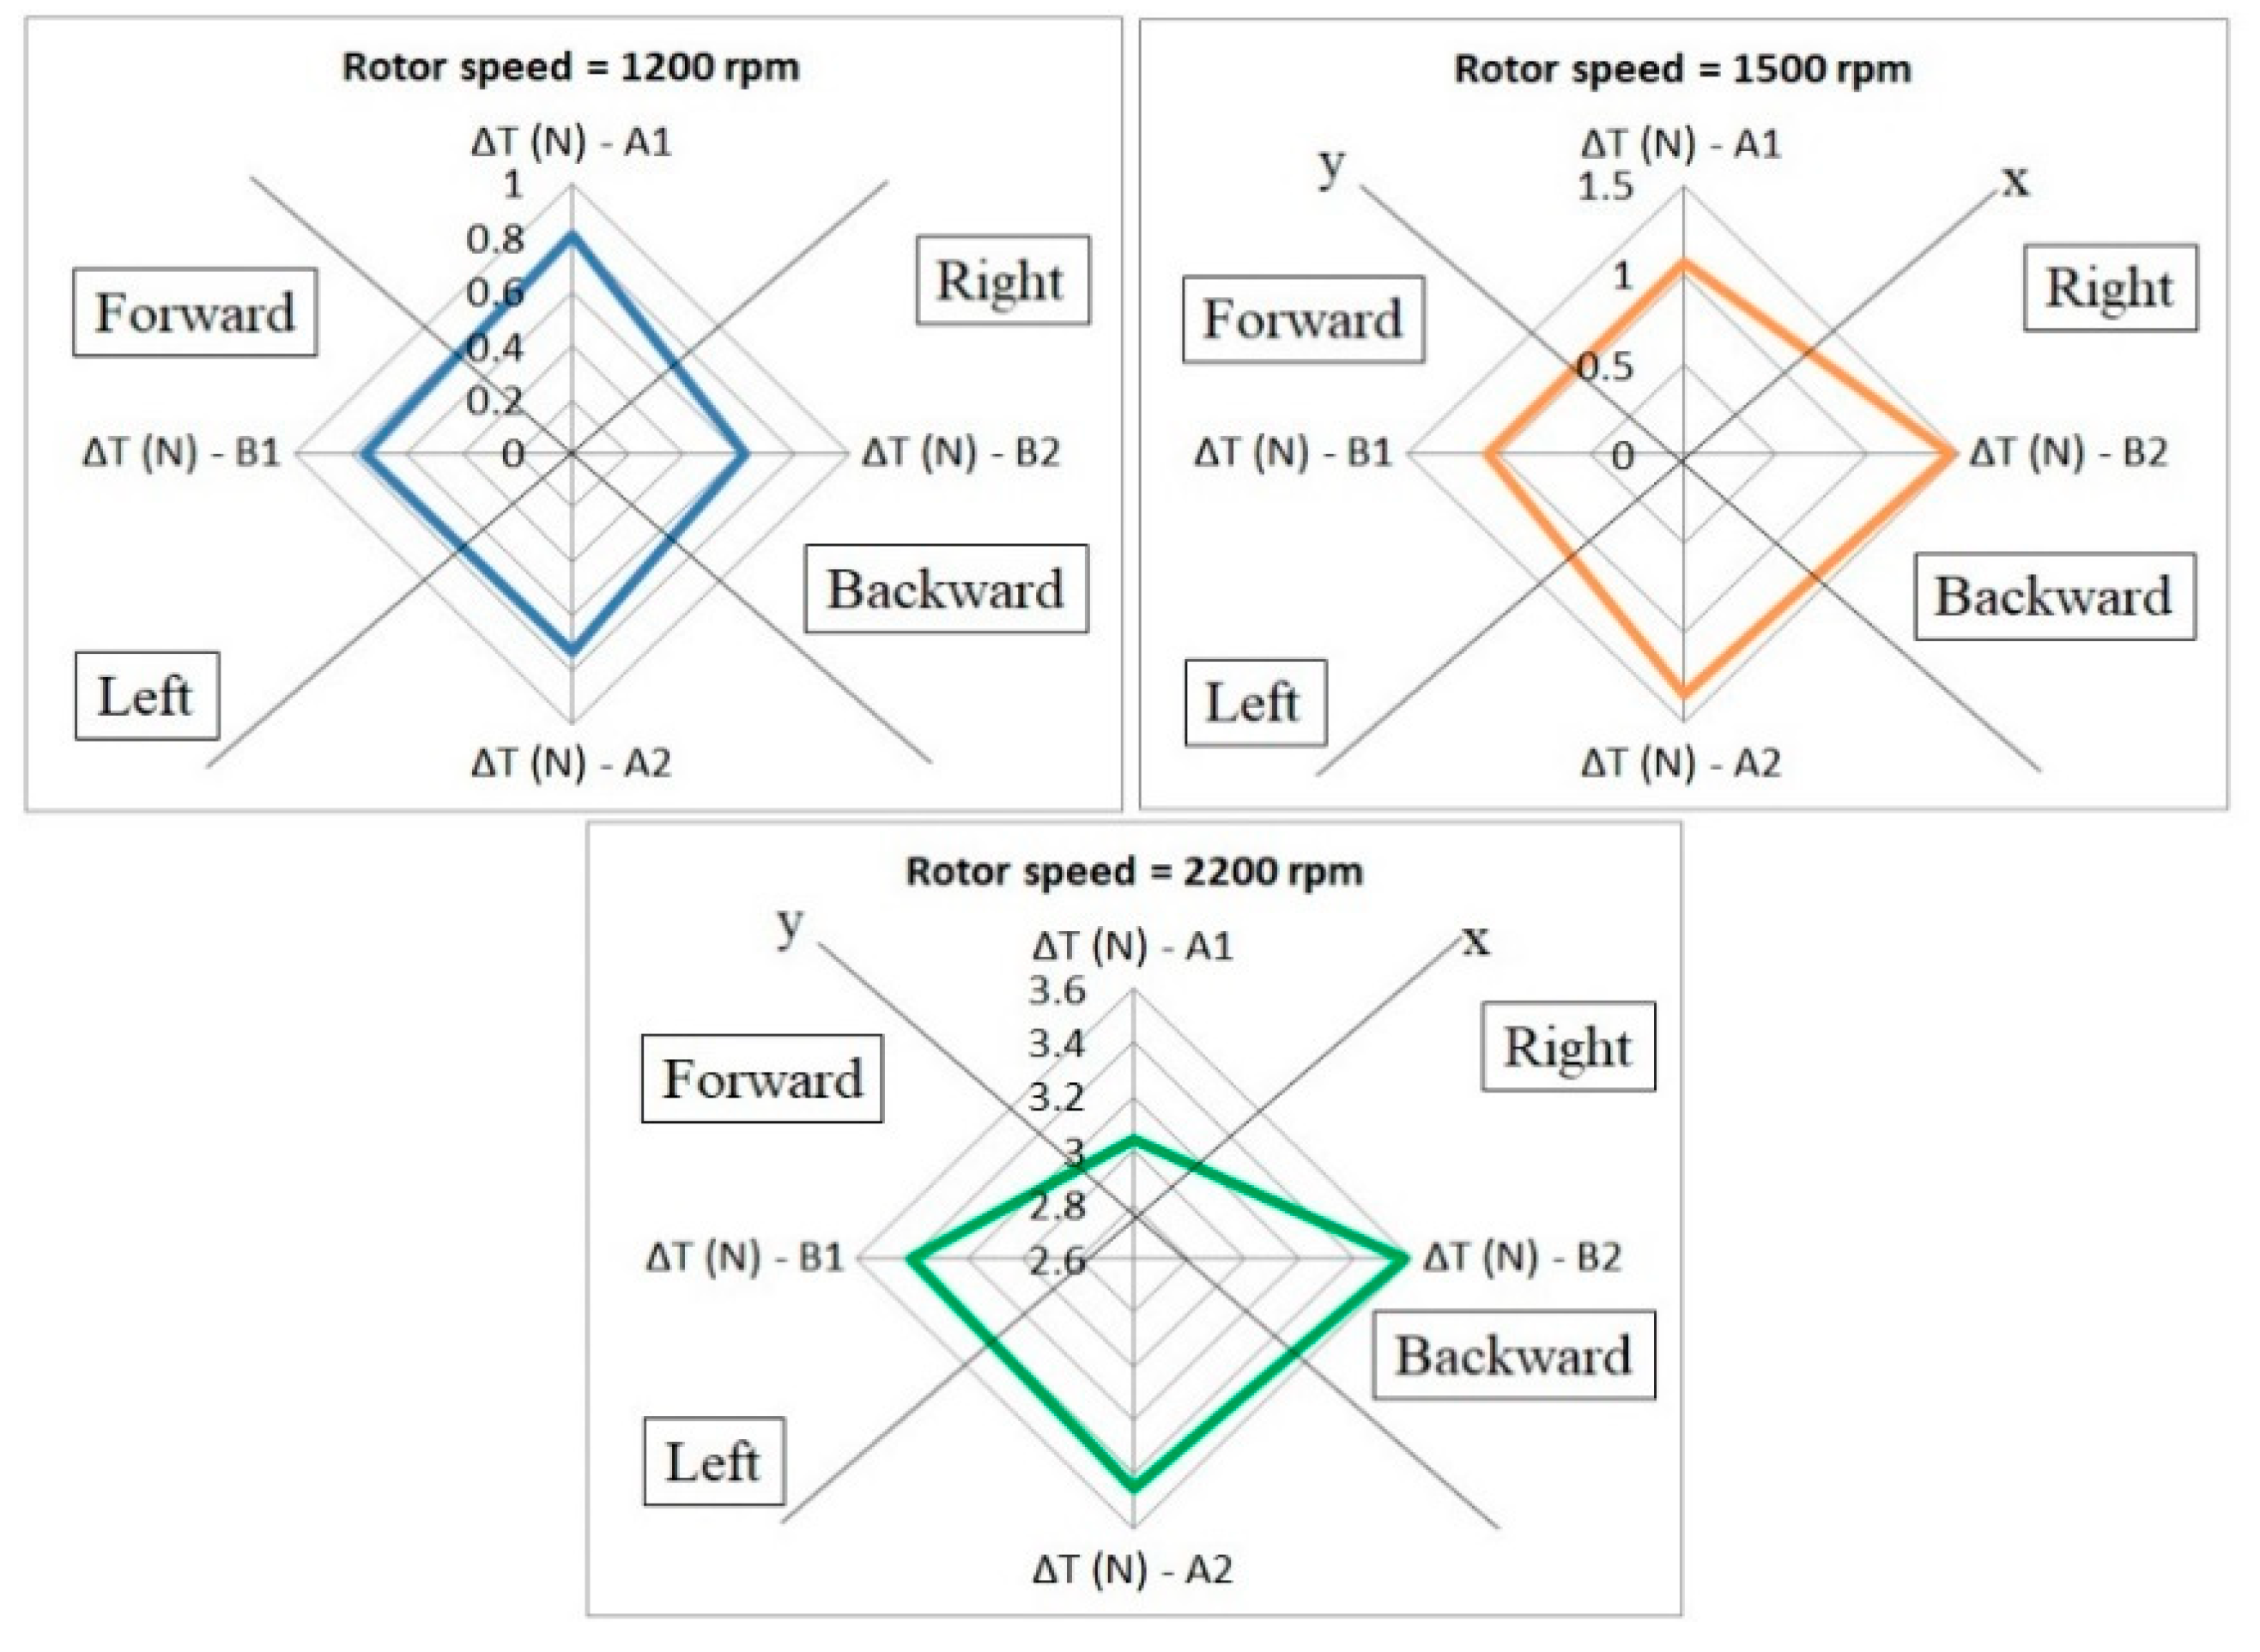
Figure 5 shows the position and direction of the quadcopter for various thrust values. The acquired data has been split into three equal parts, for each of them the thrust value being the average of the acquired data, to find out the position error. The results show that the quadcopter has a tendency to move backward at any speed, and the field tests also yield the same result. In the hovering state, the quadcopter cannot maintain its position because of the imbalanced thrust.
To overcome this problem, one can perform a trim calibration process and PID coefficient adjustment. Trim calibration is the adjustment of the zero value on both the remote control and the quadcopter, used only for manually controlled quadcopters. The trim positioning adjustment is done manually by doing a zero-positioning trim for the forward–backward channel. The thrust data calibration results were obtained using a data logger system for three speed values (i.e., 1200 rpm, 1500 rpm, and 2200 rpm). For each speed level, 50 thrust data acquired during 50 s sampling times are obtained. The corresponding data is then averaged to analyze the quadcopter’s position during hovering at the considered speed level, as shown in
Figure 6. The trim control adjustment only helps to set the zero point. The thrust difference is smaller than 0.5 N for the considered speed values and the thrust data obtained during the 50 s sampling time is quite stable.
Having the thrust data acquired, the adjustment process of the control system on the quadcopter can be started, especially for the pitch and roll angles. The quadcopter tends to move forward and slightly to the right. Based on the rate of error, the proportional gain in the PID for the pitch position must be greater than the one corresponding to the roll position. The data logger can be of assistance to notice the changes that occur by modifying each variable gain in PID. By manually adjusting all of the PID’s coefficients, the final value for each coefficient can be seen in
Table 2.
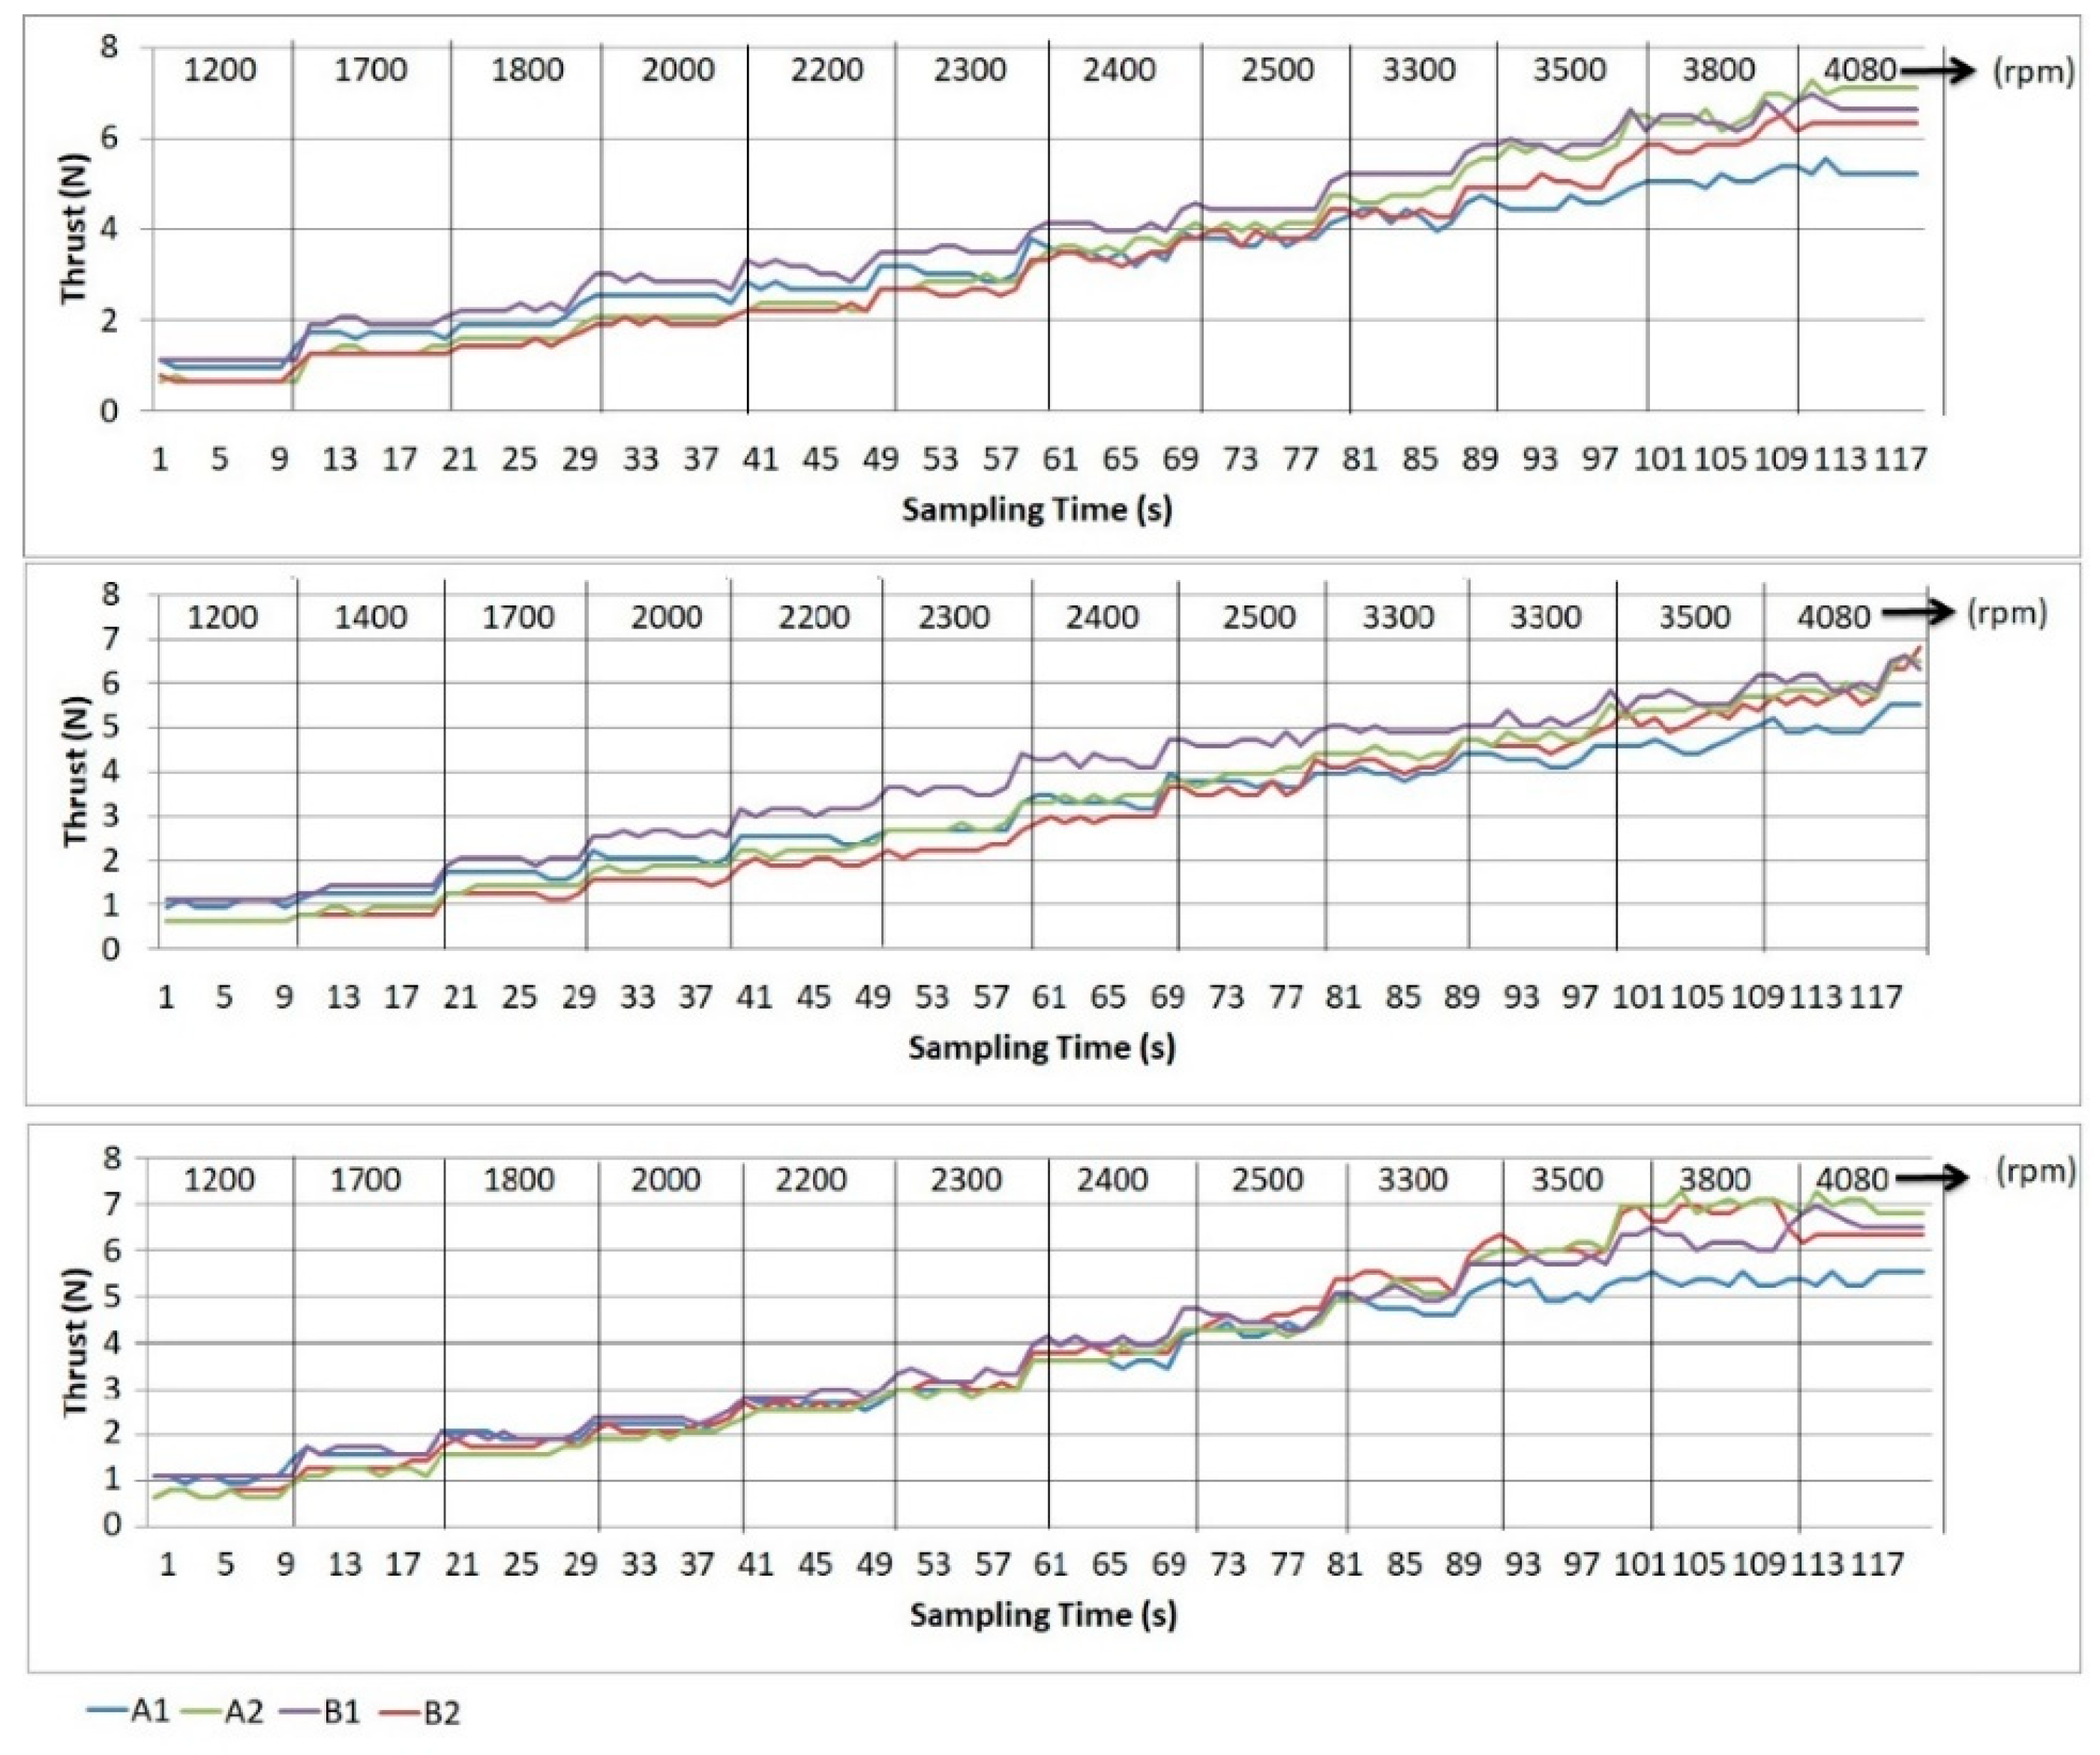
An experiment of thrust data retrieval using a data logger was conducted during a sampling time of 118 s, increasing the speed every 10 s. To ensure the accuracy and stability of the thrust data readings, the experiments were performed three times, and the thrust behavior of each rotor can be seen in this result. All of the results for the PID’s coefficient adjustment process can be seen in
Figure 7. Using Equation (8), the total thrust and torque on each axis can be calculated. This quadcopter model produces a total thrust of 26 N.
In a repetitive and continuous acceleration, it is difficult to obtain the exact angular velocity of a rotor for the same iteration of the sample acquisition. To get an exact angular velocity of each repetition, a discontinuous process can be done for each different angular velocity. However, to demonstrate the reliability and the stability of the data reading with a thrust data logger, this research chose a continuous process with a 10% error tolerance for data verification. The first verification was done to ensure the accuracy of the data thrust reading generated by the same speed parameter. Repeating the sampling process showed that the thrust data logger produced data with less than a 10% difference. This is linear with the error tolerance for the rotor velocity reading. From the 10 s of sampling time for each rotor speed, the stability generated by the data logger could be seen in data output. The flat line shows that the read data is the same, and the spike occurs when the rotor speed increases continuously through the remote control. From the perspective of the controller adjustment with trim and PID, the data showed that the speeds lower than 3000 rpm or the throttle less than 80% of the maximum speed, resulting in the thrust produced in the same axis, has a difference between 0.3–0.5 N.
This proves that the control system can improve the stability of the resulting thrust. For speeds greater than 3000 rpm, the thrust produced by each rotor have a significant value difference, with a maximum of 2 N in the same axis. This can happen because of the turbulence on the airframe caused by a high airflow on each propeller and also because of the vibration that occurs in the quadcopter frame. In the real test conditions, the vibration in the quadcopter can occur in high speed movement and stability can be achieved by adjusting the control system.
The result of the adjustment made by using the data logger can be validated during a field test, where the quadcopter position can be acquired by the means of an orientation sensor. Data acquisition during field tests have been done using telemetry and the Mission Planner open source software [
33]. In this case, telemetry was used as a wireless data transmission between the ground station and the quadcopter [
34], while Mission Planner was used to reading the data [
35,
36,
37]. The data retrieval result can be seen in
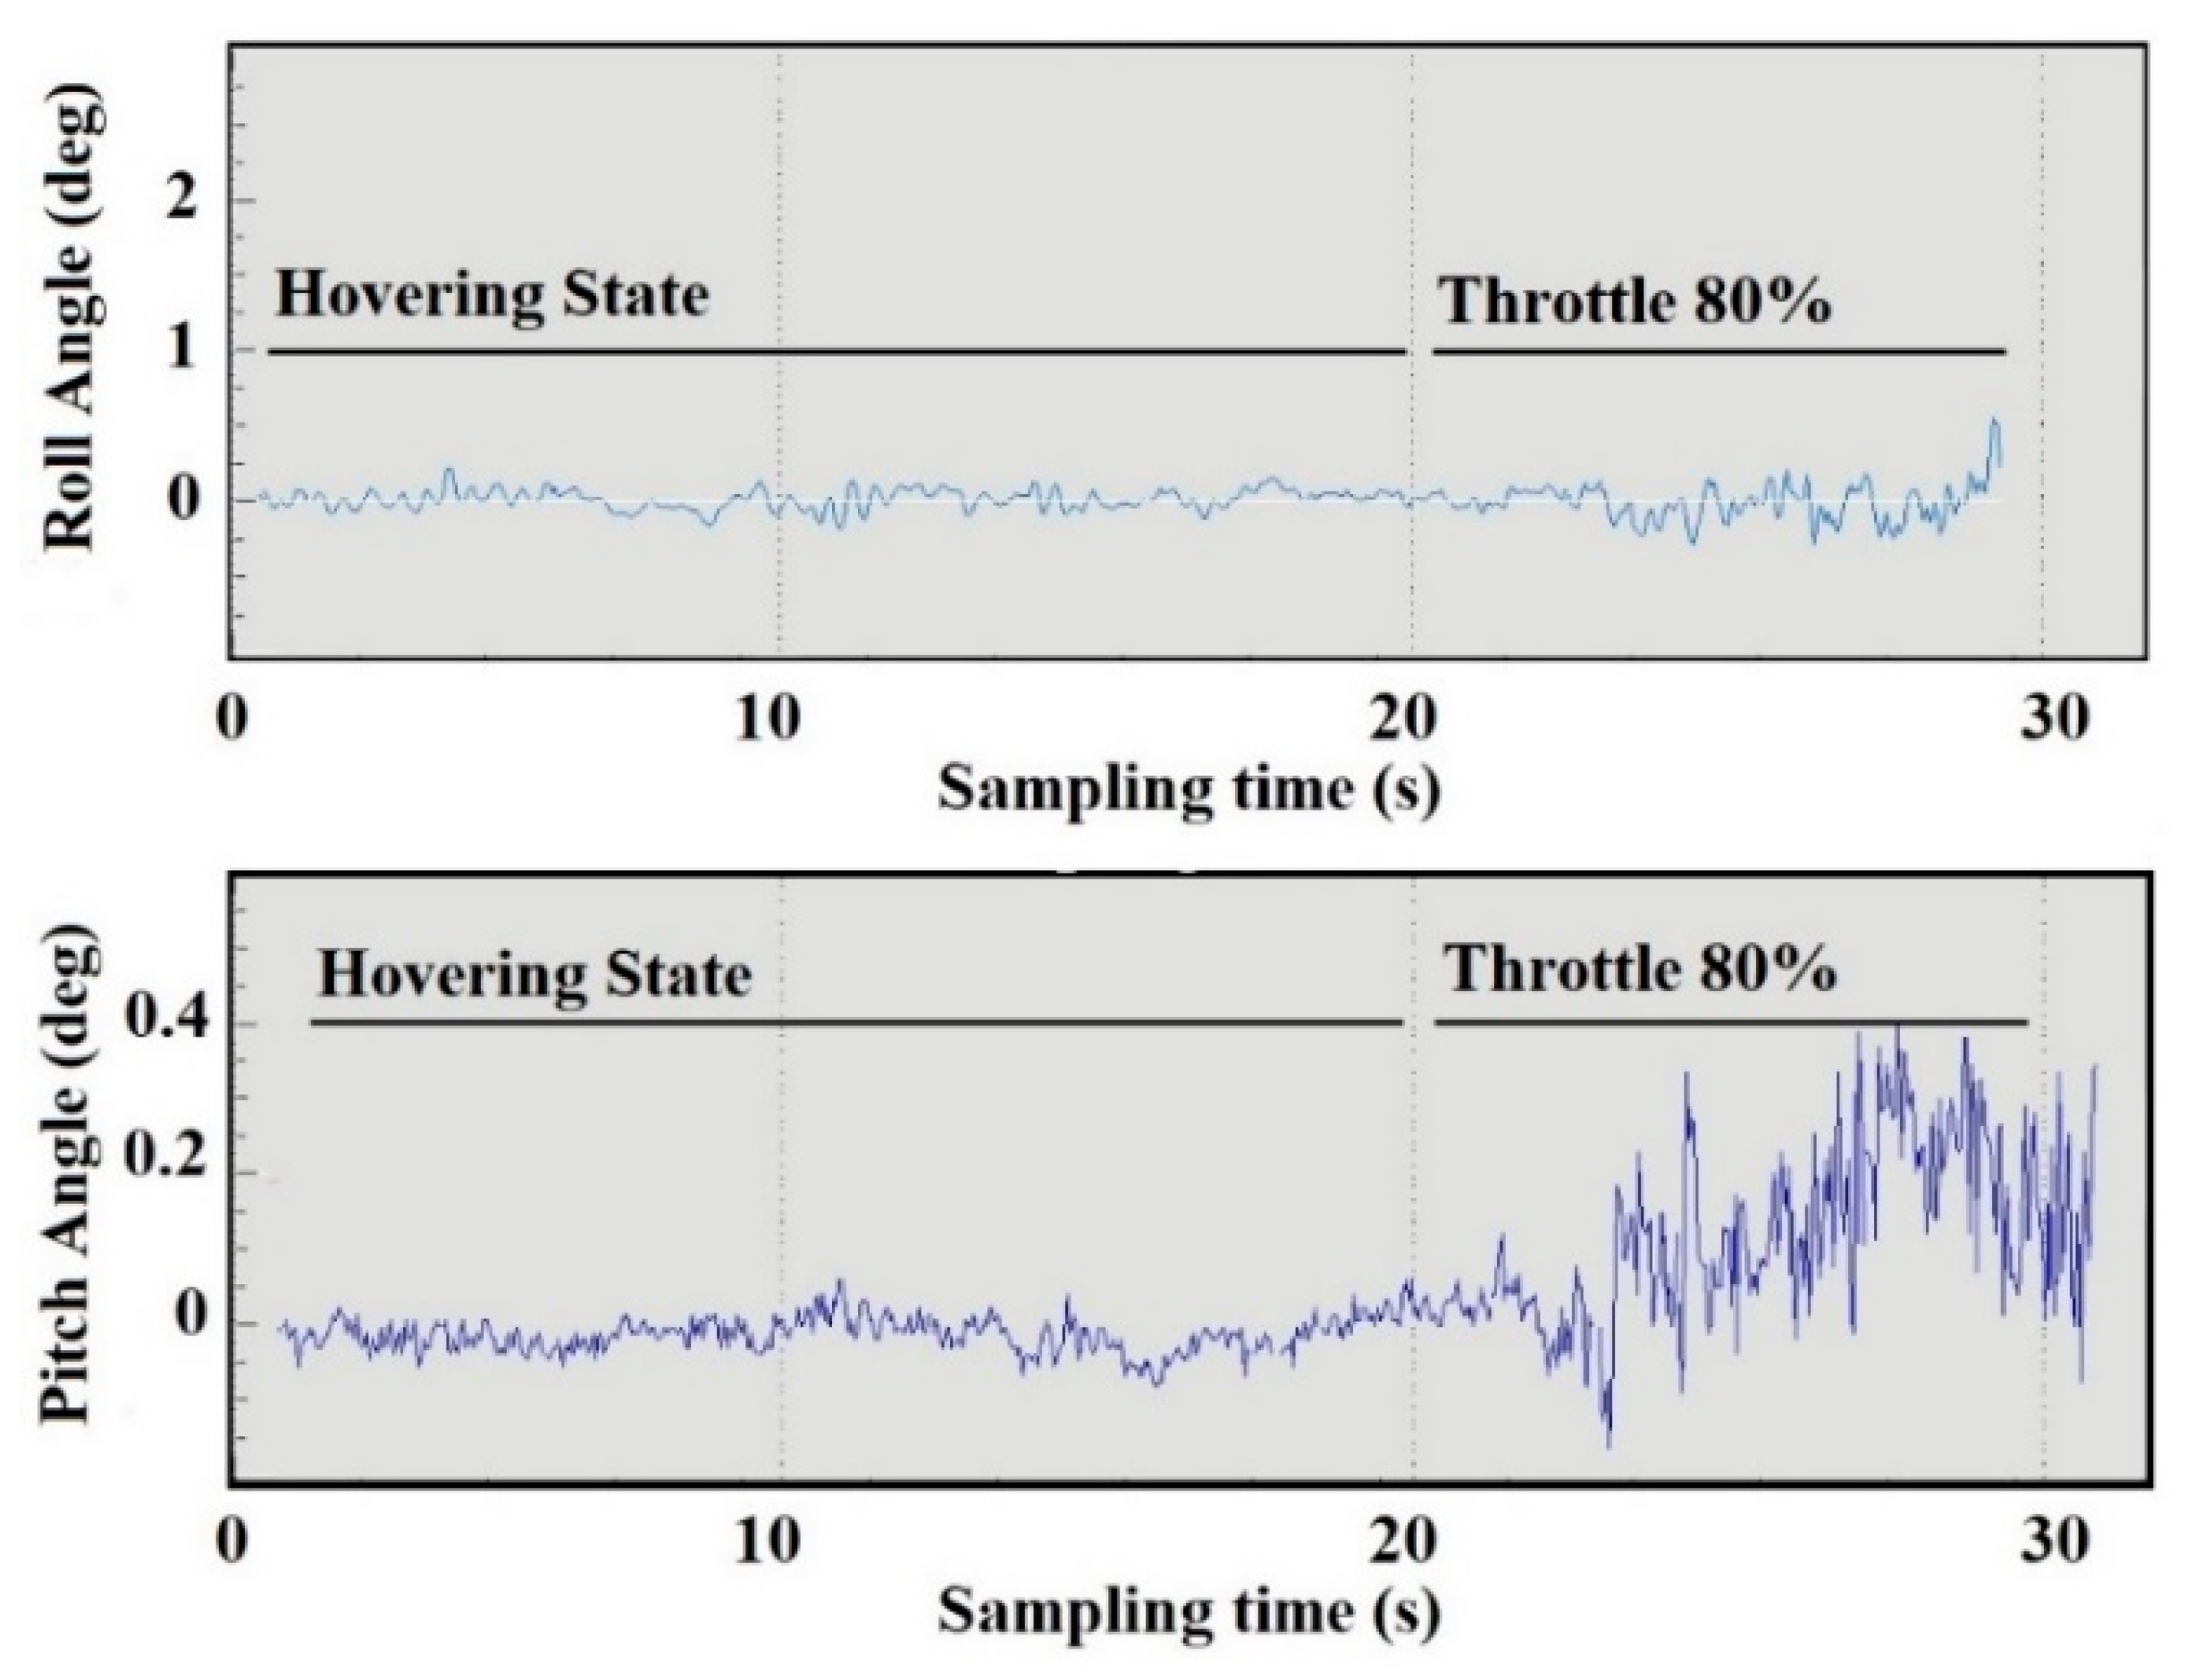
Figure 8.
Details of the position changes occurring during the hover state and throttle state can be seen by comparing the desired position with the actual one. The result showed a linear variation of the output, with the data indicated by a data logger, where the throttle with a high-speed level resulted in instability in the roll position. While hovering, the pitch position showed more stable data compared to the roll position. An angular change for both of the angles during hovering were less than 0.2° and both angles were oscillating at an angle of 0.5° at higher speeds. The orientation sensor with PID control in no-wind conditions seeks to stabilize the position of the quadcopter in a zero level, where high velocity oscillations may cause a vibration on the quadcopter’s frame. This proves that there is a linear correlation between the orientation sensor data and thrust data logger.
5. Conclusions
A data logger for measuring two-axis thrust on a quadcopter was successfully developed, with a sensitivity level of 0.7 mV/kg, a response time of 1 s, and a maximum thrust of 40 N. This model works at a 125 kHz sampling rate and can be applied only on a symmetrically-structured quadcopter. It was integrated with the quadcopter to measure the thrust value simultaneously on all rotors–propellers and able to perform a calibration process of the flight control system in real time. The results were validated by repeating the 118 s sampling time process to measure quadcopter’s thrust, using the same parameter values for each repetition. The maximum error percentage for each measurement was 10%. This value is given by the rotor’s speed tolerance for each repetition, which allows for a maximum of 10%. The tolerance level and linear thrust differences indicate that the data logger has a good accuracy level. This was proved by the equally generated thrust at a steady speed, after the quadcopter was set by the data logger. To improve the stability of the quadcopter, the system is used for trim and PID adjustment, for a maximum speed of 4080 rpm and total thrust of 26 N. Knowing the thrust value of each rotor makes it easier to manually set the coefficient value of the PID. In the final adjustment, with the quadcopter having the speed below 3000 rpm, the results have shown that the difference between the rotors is less than 0.5 N. From this experiment, it can be seen that high-velocity rotors can cause vibrations, so that the resulting thrust becomes unstable. Overall, it can be concluded that this low-cost equipment can be statically connected with the quadcopter in adjusting the value of the control system for the quadcopter’s dynamic movement. Data processing using a two-axis data logger is enough to obtain the positioning values of the quadcopter expressed in the pitch, roll, and yaw angles as well as the thrust condition during hovering and throttling.
In this study, the thrust value received from the data logger can assist the user in setting the quadcopter control system. For future research, the thrust data logger can be developed, making it able to connect with the flight controller for an automatic adjustment of the rotor speed. The designed data logger should also be able to measure thrust under windy conditions and assist in the flight control tuning process to reduce the imbalance effect of the propeller.


 ,
, 


