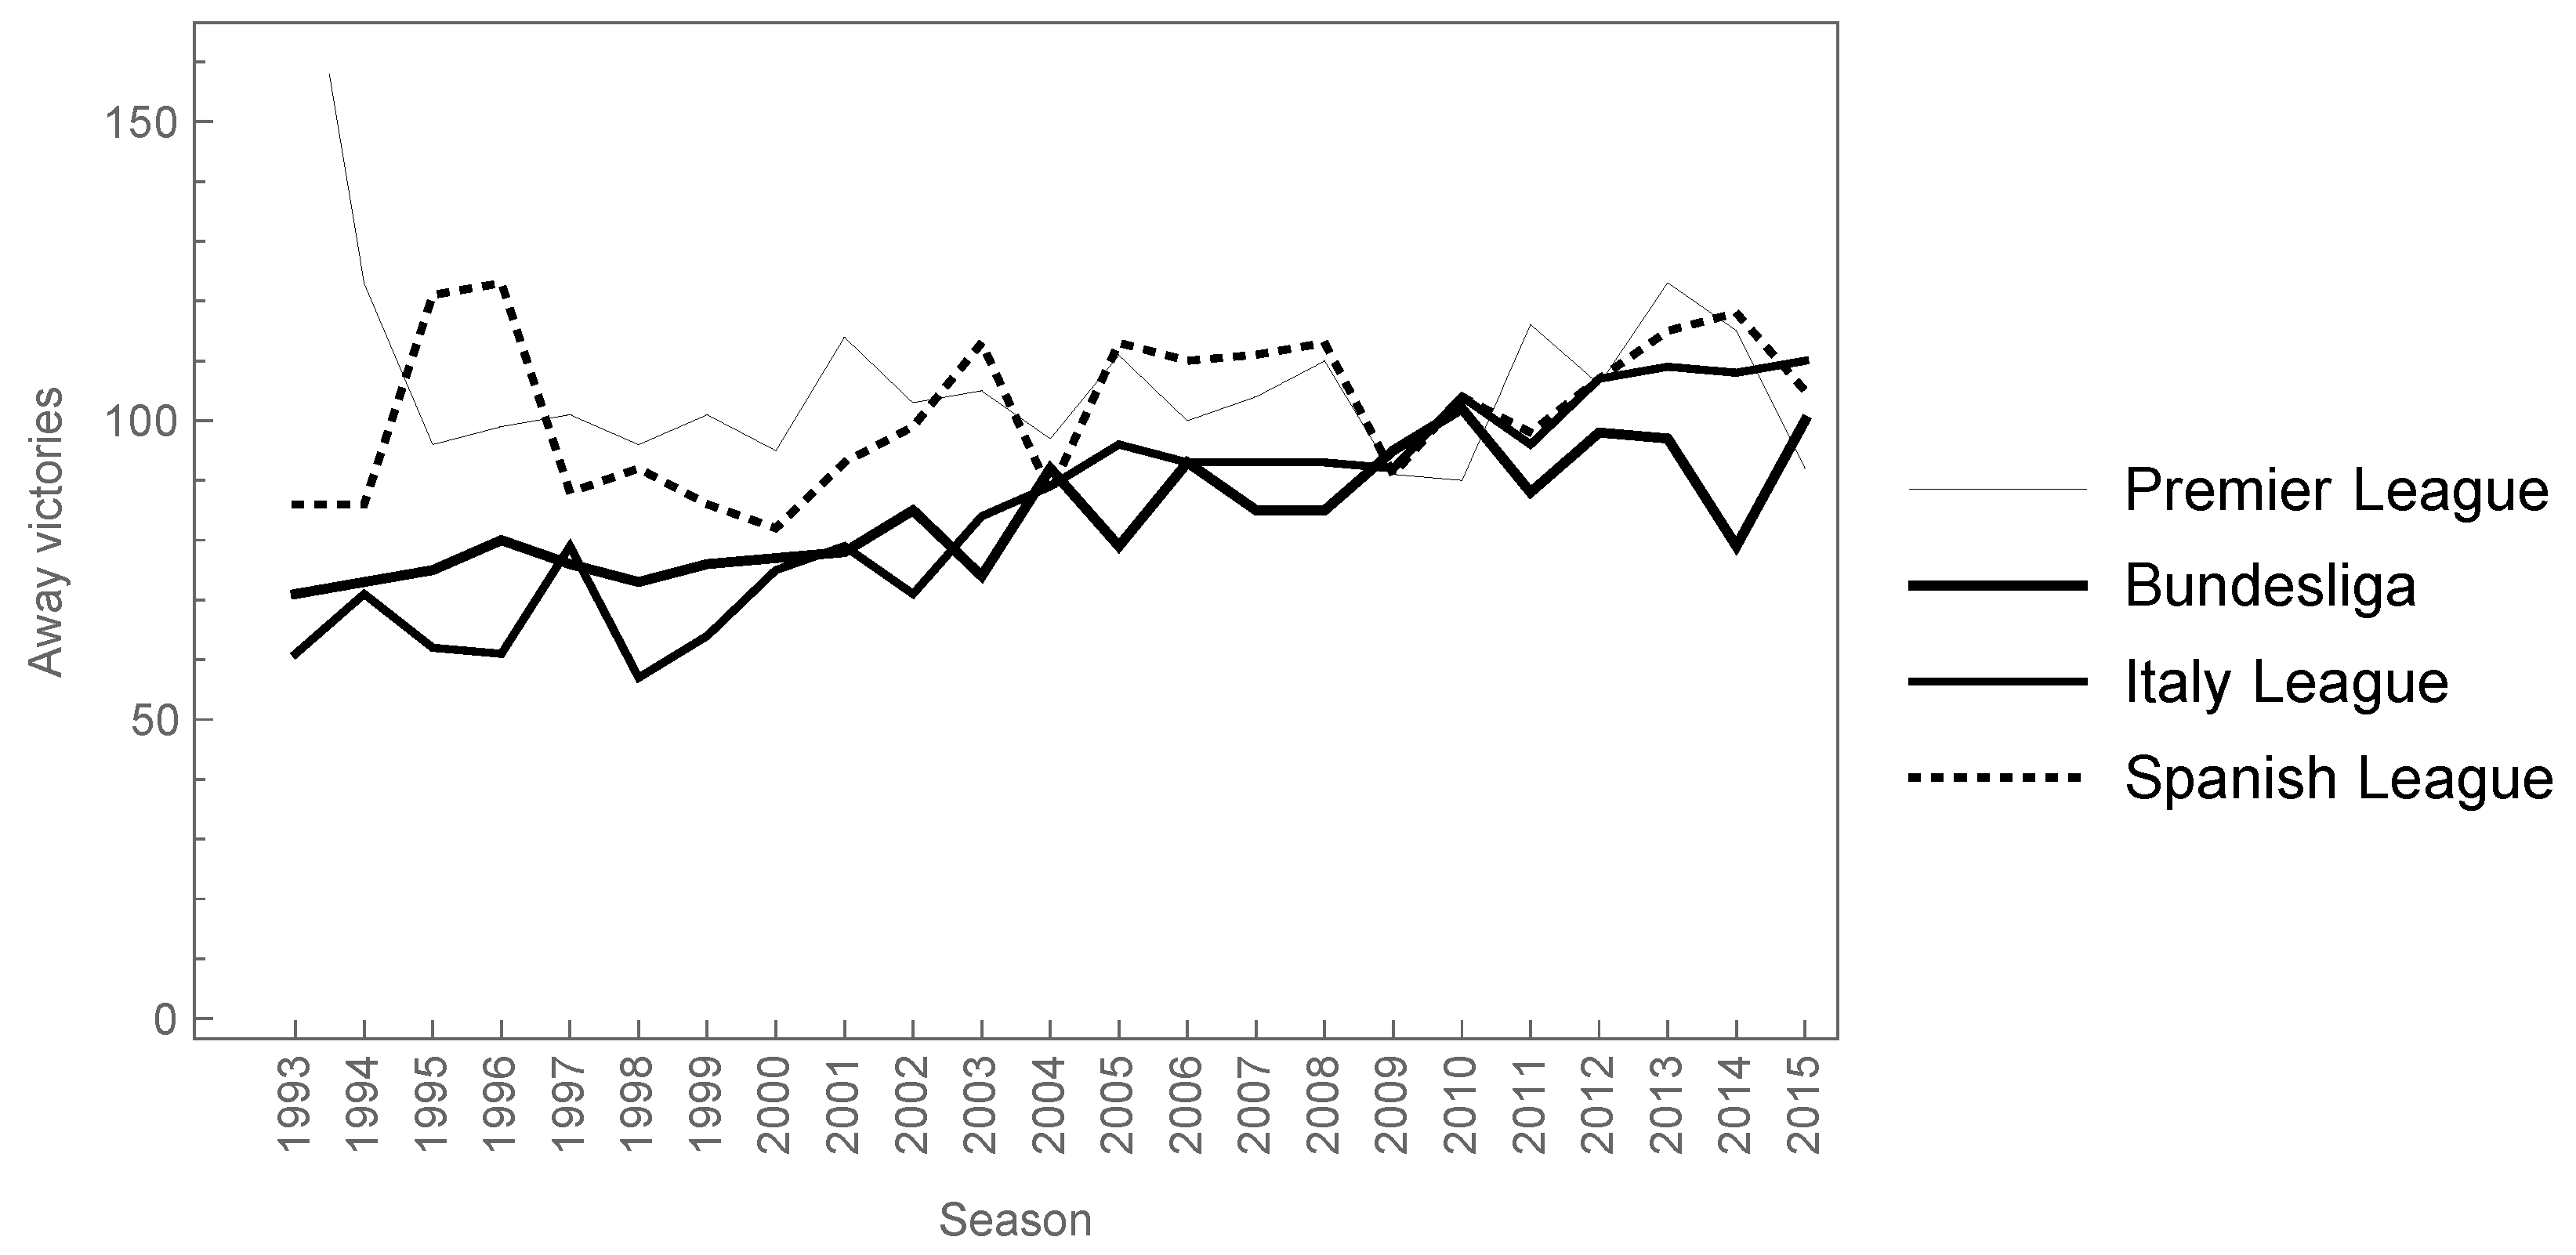
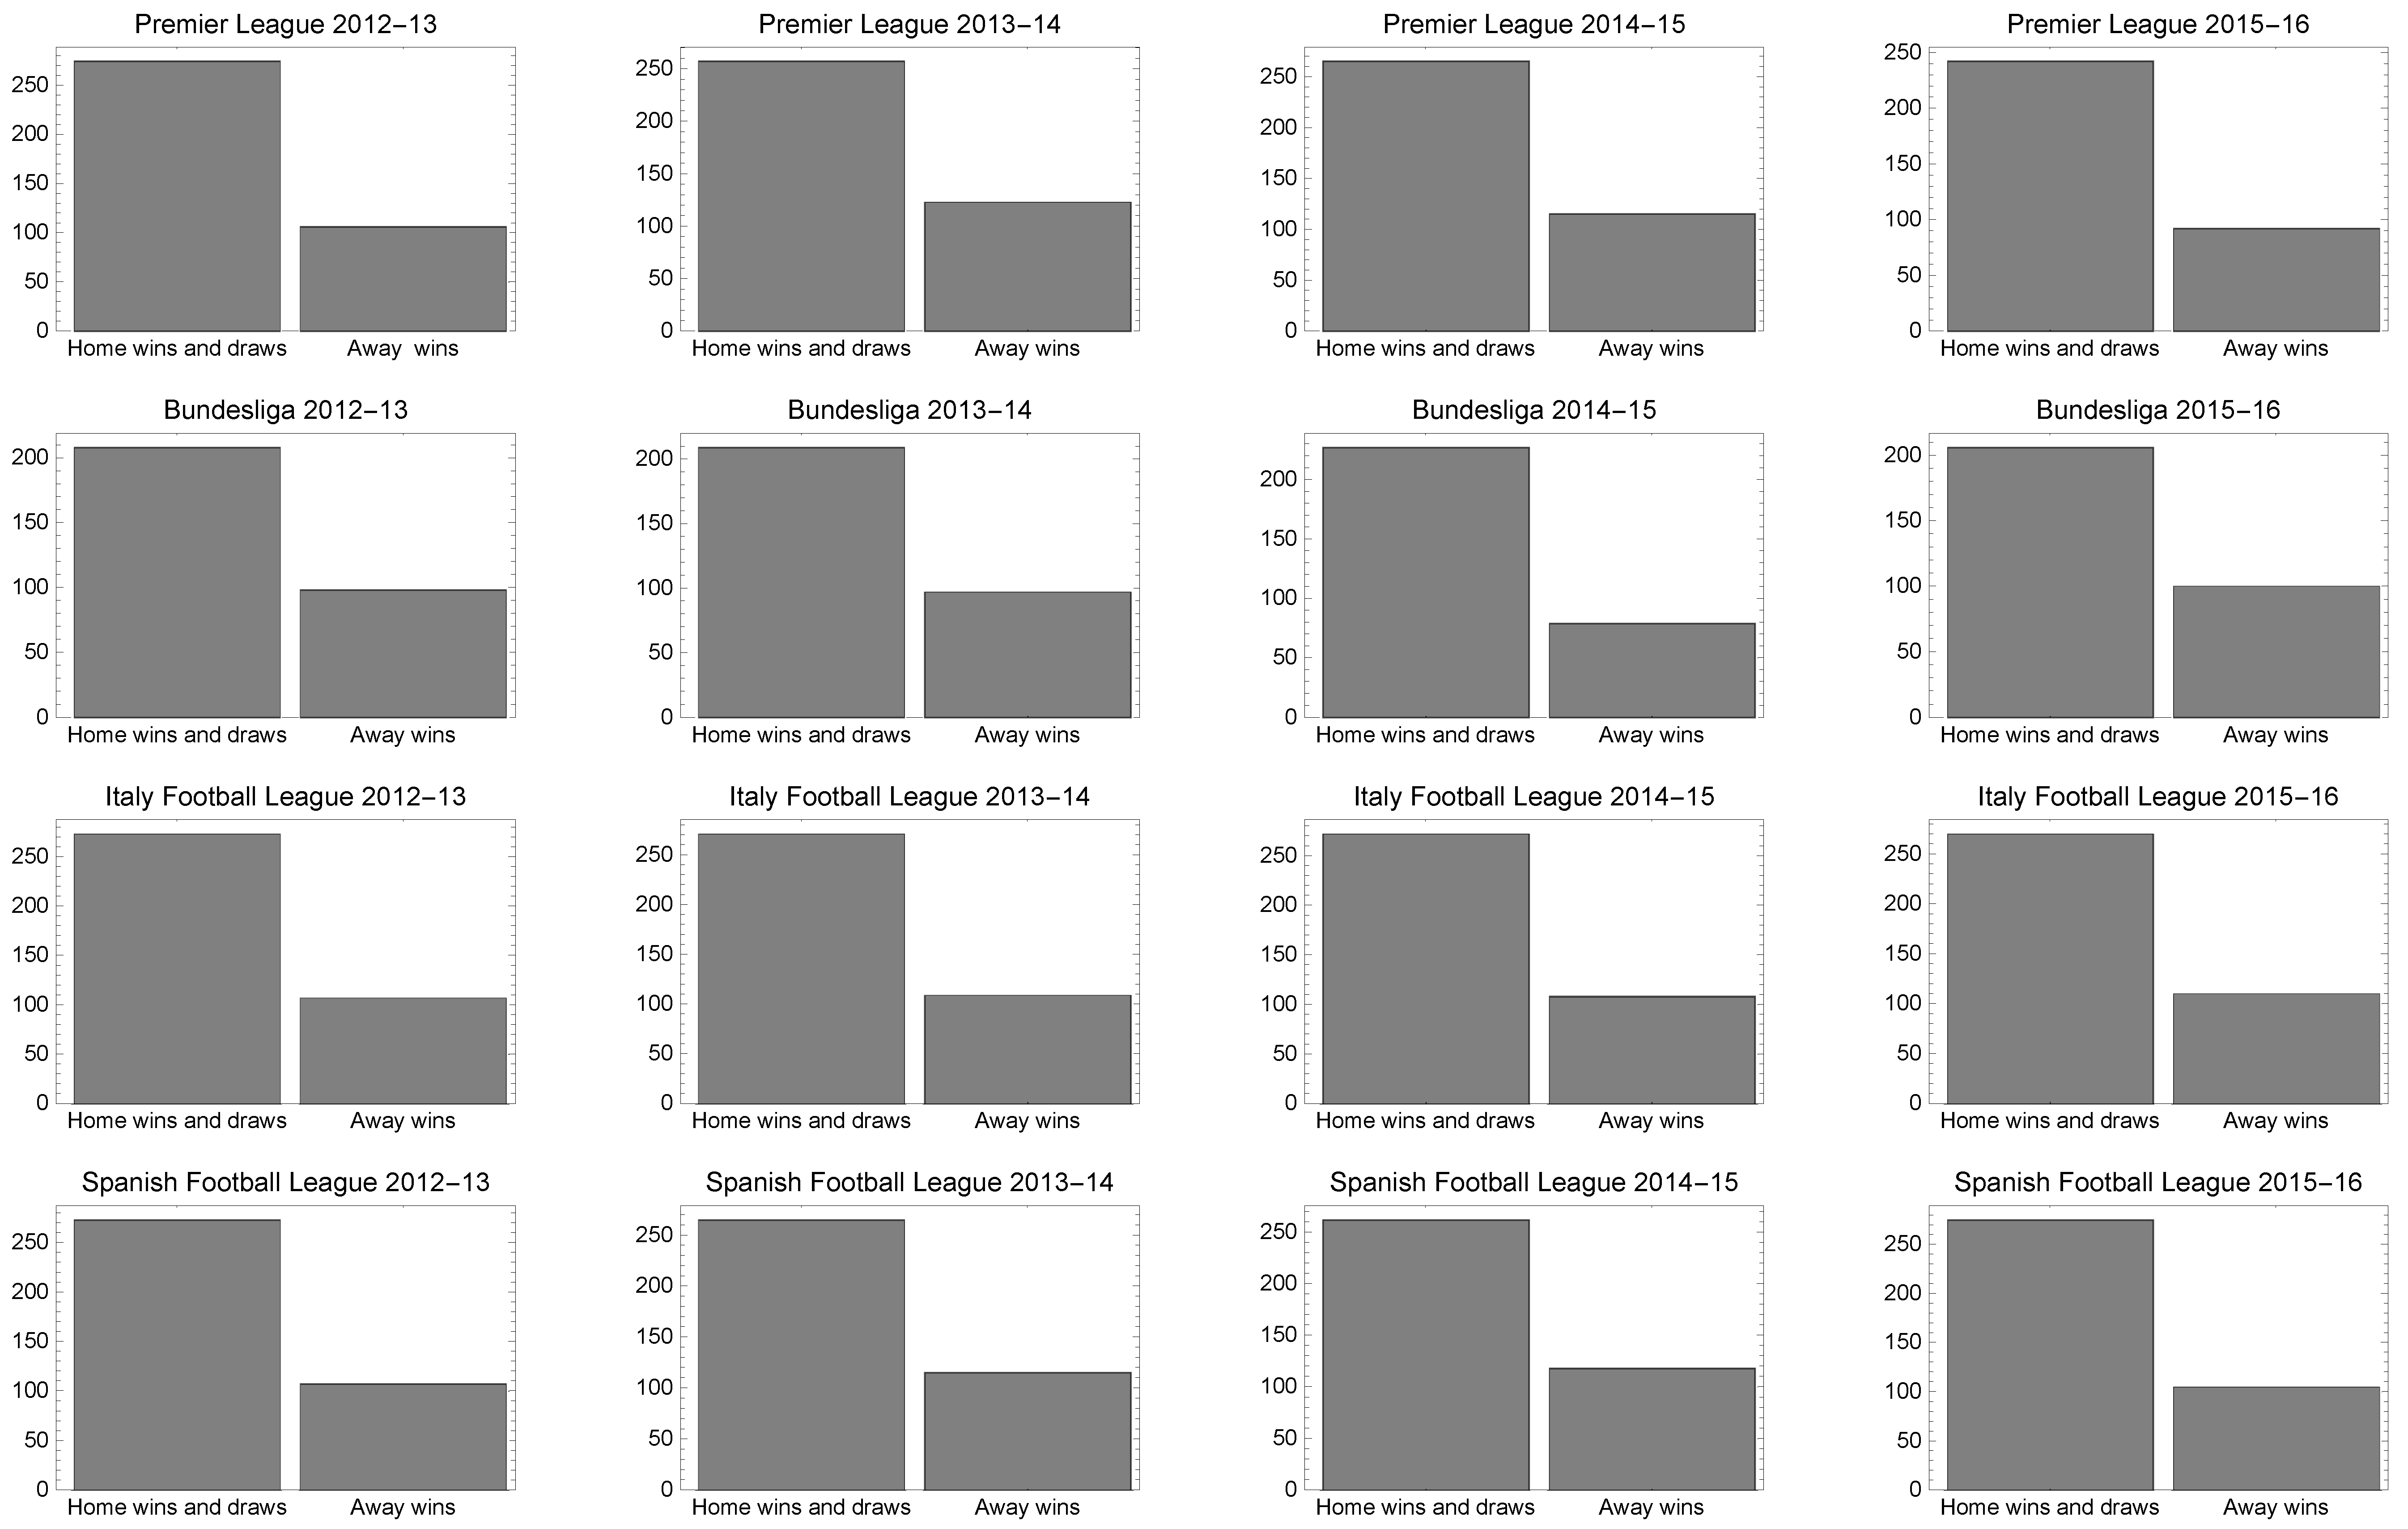
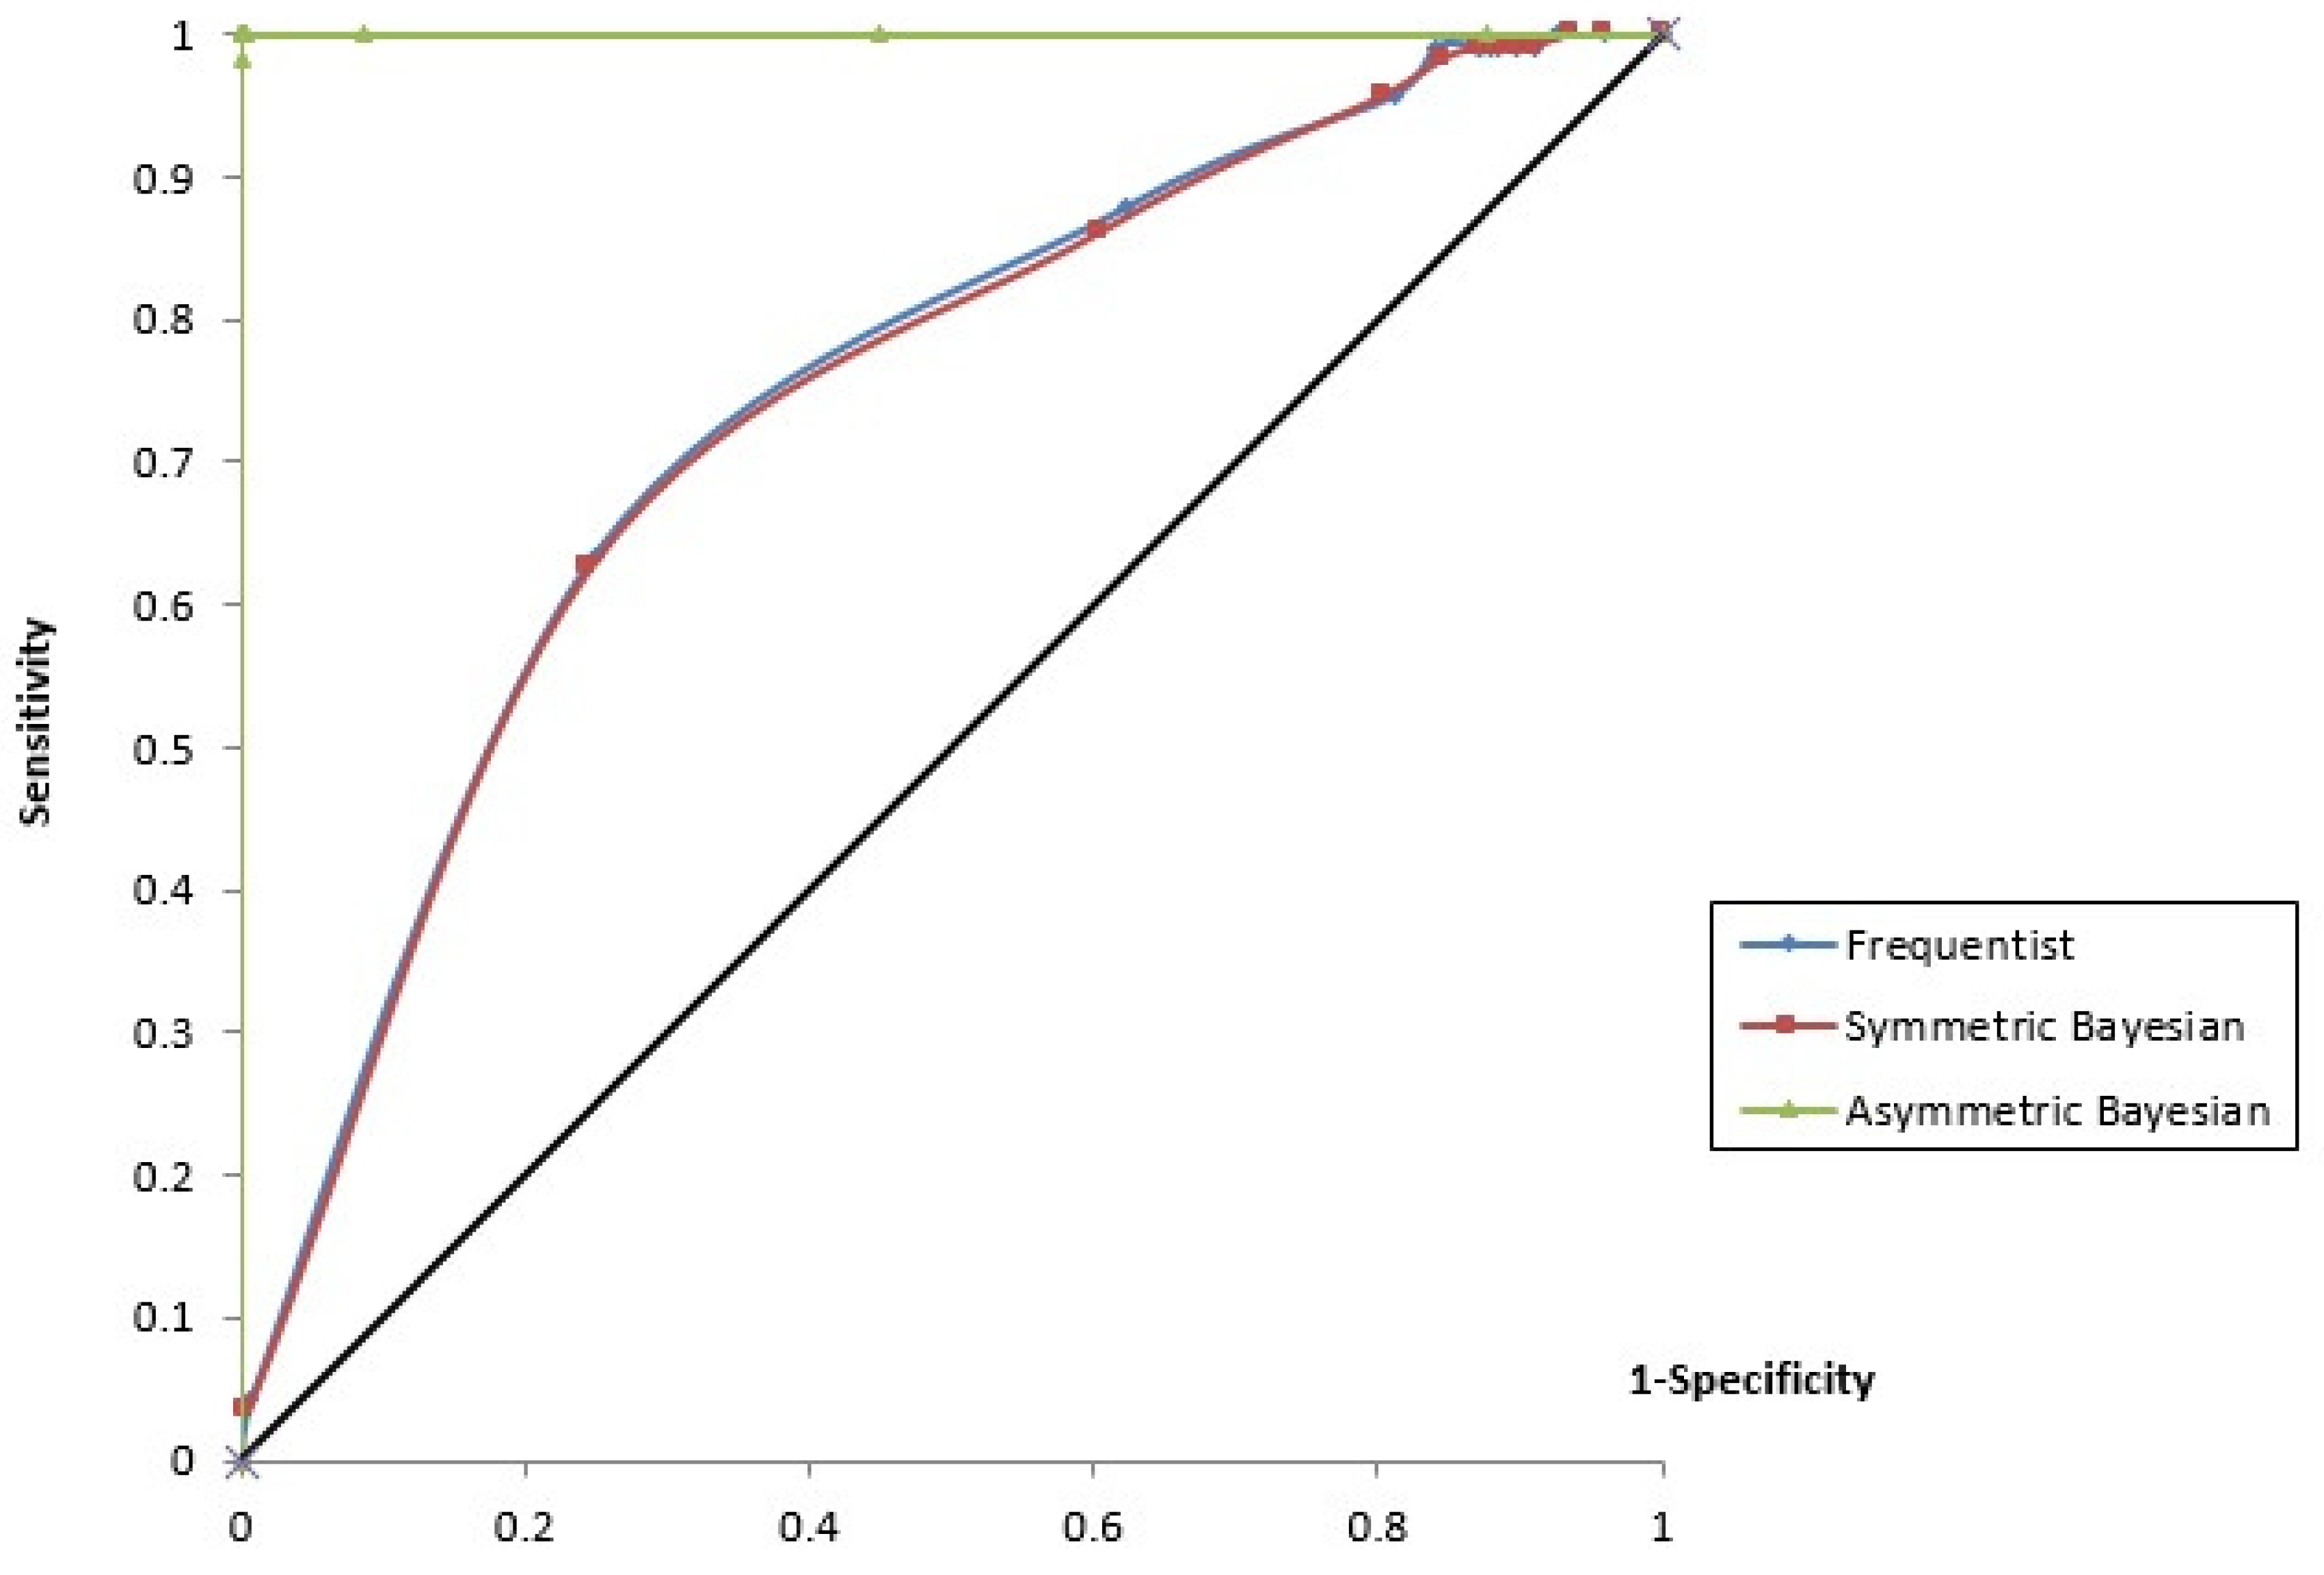
A Comparative Study of Logistic Models Using an Asymmetric Link: Modelling the Away Victories in Football
Abstract
1. Introduction
2. Logit Specifications
2.1. Frequentist Estimation
2.2. Bayesian Estimation
2.3. Bayesian Asymmetric Estimation
3. Description of Database
4. Empirical Results
5. Conclusions
Author Contributions
Funding
Acknowledgments
Conflicts of Interest
References
- Del Corral, J.; Prieto-Rodríguez, J.; Simmons, R. The effect of incentives on sabotage: The case of Spanish football. J. Sports Econ. 2010, 11, 243–260. [Google Scholar] [CrossRef]
- Halicioglu, F. The impact of football point systems of the competitive balance: evidence from some European football leagues. Rivista di Dritto ed Economia dello Sport 2006, 2, 67–76. [Google Scholar]
- Haugen, K. Point score systems and competitive imbalance in professional soccer. J. Sports Econ. 2008, 9, 191–210. [Google Scholar] [CrossRef]
- Brocas, I.; Carrillo, J. Do the ”three-point victory” and ”golden goal” rules make soccer more exciting? J. Sports Econ. 2004, 5, 169–185. [Google Scholar] [CrossRef]
- Dilger, A.; Geyer, H. Are three points for a win really better than two? a comparison of german soccer league and cup games. J. Sports Econ. 2009, 10, 305–318. [Google Scholar] [CrossRef]
- Guedes, J.; Machado, F. Changing rewards in contests: Has the three-point rule brought more offense to soccer? Empir. Econ. 2002, 27, 607–630. [Google Scholar] [CrossRef]
- Hon, L.; Parinduri, R. Does the three-point rule make soccer more exciting? evidence from a regression discontinuity design. J. Sports Econ. 2016, 17, 377–395. [Google Scholar] [CrossRef]
- Chen, M.; Dey, D.; Shao, Q. A new skewed link model for dichotomous quantal response data. J. Am. Statist. Assoc. 2013, 94, 1172–1186. [Google Scholar] [CrossRef]
- Bermúdez, L.; Pérez-Sánchez, J.; Ayuso, M.; Gómez-Déniz, E.; Vázquez-Polo, F. A bayesian dichotomous model with asymmetric link for fraud in insurance. Insur. Math. Econ. 2008, 42, 779–786. [Google Scholar] [CrossRef]
- Sáez, A.; Olmo-Jiménez, M.; Pérez, J.; Negrín, M.; Arcos, A.; Díaz, J. Bayesian analysis of nosocomial infection risk and length of stay in a department of general and digestive surgery. Value Health 2010, 13, 431–439. [Google Scholar] [CrossRef] [PubMed]
- Pérez-Sánchez, J.; Negrín-Hernández, M.; García-García, C.; Gómez-Déniz, E. Bayesian asymmetric logit model for detecting risk factors in motor ratemaking. Astin Bull. 2014, 44, 445–457. [Google Scholar] [CrossRef]
- Weisberg, S. Applied Linear Regression; John Wiley & Sons, Inc.: Hoboken, NJ, USA, 2005. [Google Scholar]
- Gómez, M.; Lorenzo, A.; Ibáñez, S.; Sampaio, J. Ball possession effectiveness in men’s and women’s elite basketball according to situational variables in different game periods. J. Sports Sci. 2013, 31, 1578–1587. [Google Scholar] [CrossRef] [PubMed]
- Sánchez, J.; Castellanos, P.; Dopico, J. The winning production function: Empirical evidence from Spanish basketball. Eur. Sport Manag. Q. 2007, 7, 283–300. [Google Scholar] [CrossRef]
- Alves, A.; de Mello, J.S.; Ramos, T.; Sant’Anna, A. Logit models for the probability of winning football games. Pesqui. Oper. 2011, 31, 459–465. [Google Scholar] [CrossRef]
- Chinwe, I.; Enoch, N. An improved prediction system for football a match result. J. Eng. 2014, 4, 12–20. [Google Scholar] [CrossRef]
- Zellner, A. An Introduction to Bayesian Inference in Econometrics; John Wiley & Sons, Inc.: Hoboken, NJ, USA, 1996. [Google Scholar]
- Lunn, D.; Thomas, A.; Best, N.; Spiegelhalter, D. Winbugs: A Bayesian modelling framework: Concepts, structure, and extensibility. Stat. Comput. 2000, 10, 325–337. [Google Scholar] [CrossRef]
- Jiang, X.; Dey, D.K.; Prunier, R.; Wilson, A.; Holsinger, K.E. A new class of flexible link functions with applications to species co-occurrence in cape floristic region. Ann. App. Stat. 2013, 7, 2180–2204. [Google Scholar] [CrossRef]
- Stukel, T. Generalized logistic model. J. Am. Statist. Assoc. 1988, 183, 426–431. [Google Scholar] [CrossRef]
- Albert, J.; Chib, S. Bayesian residual analysis for binary response regression models. Biometrika 1995, 82, 747–769. [Google Scholar] [CrossRef]
- Football-Data. Available online: http://www.football-data.co.uk/data.php (accessed on 10 April 2018).
- Akaike, H. A new look at the statistical model identification. IEEE Trans. Autom. Control 1974, 19, 716–723. [Google Scholar] [CrossRef]
- Spiegelhalter, D.; Best, N.; Carlin, B.; van der Linde, A. Bayesian measures of model complexity and fit (with discussion). J. R. Stat. Soc. Ser. B 2002, 64, 583–639. [Google Scholar] [CrossRef]


| Variable Name | Description |
|---|---|
| Game statistics | |
| HS | Home team shots. |
| AS | Away team shots. |
| AF | Fouls committed by the away team. |
| HC | Corners in favour of the home team. |
| AC | Corners in favour of the away team. |
| HY | Yellow cards shown to the home team. |
| AY | Yellow cards shown to the away team. |
| HR | Red cards shown to the home team. |
| AR | Red cards shown to the away team. |
| Game variable | |
| DERBY | Match played between teams from the same city or region or between the strongest teams in the league. |
| Extra games | |
| BUDH | Home team budget |
| BUDA | Away team budget |
| Referee | |
| INTERNATIONAL | International experience |
| ACIENT | Years of experience in the first division |
| Variables | Frequentist | Bayesian | Asymmetric Bayesian | ||||||
|---|---|---|---|---|---|---|---|---|---|
| Robust Sd | p -Value | Sd | MC Error | Sd | MC Error | ||||
| Intercept | −2.417 *** | 0.929 | 0.009 | −1.313 *** | 0.504 | 0.000 | 12.58 *** | 1.343 | 0.009 |
| HS | 0.006 | 0.031 | 0.836 | 0.006 | 0.031 | 0.000 | 0.020 | 1.343 | 0.0009 |
| AS | 0.051 * | 0.030 | 0.100 | 0.052 * | 0.030 | 0.000 | 0.592 *** | 1.532 | 0.014 |
| AF | 0.025 | 0.033 | 0.450 | 0.026 | 0.033 | 0.000 | 0.256 | 1.187 | 0.008 |
| HC | 0.055 | 0.054 | 0.306 | 0.058 | 0.056 | 0.000 | 0.284 | 1.075 | 0.007 |
| AC | −0.047 | 0.052 | 0.364 | -0.050 | 0.055 | 0.000 | −0.200 | 1.215 | 0.009 |
| HY | 0.034 | 0.098 | 0.730 | 0.034 | 0.098 | 0.000 | 0.417 | 1.135 | 0.007 |
| AY | −0.032 | 0.097 | 0.738 | −0.034 | 0.103 | 0.000 | 0.306 | 1.054 | 0.007 |
| HR | 1.390 *** | 0.326 | 0.000 | 1.460 *** | 0.342 | 0.000 | 15.417 *** | 1.765 | 0.020 |
| AR | −0.418 | 0.439 | 0.341 | −0.459 | 0.482 | 0.000 | −0.981 | 0.912 | 0.005 |
| DERBY | −0.026 | 0.324 | 0.936 | −0.035 | 0.354 | 0.000 | −0.206 | 3.246 | 0.024 |
| BUDH | −0.004 ** | 0.001 | 0.012 | −0.004 ** | 0.001 | 0.000 | −0.024 *** | 1.353 | 0.012 |
| BUDA | 0.003 *** | 0.0009 | 0.001 | 0.003 *** | 0.0009 | 0.000 | 0.035 *** | 1.897 | 0.020 |
| INTERNATIONAL | 0.369 | 0.276 | 0.182 | 0.389 * | 0.282 | 0.000 | 3.139 * | 2.345 | 0.024 |
| ACIENT | 0.001 | 0.031 | 0.968 | 0.001 | 0.031 | 0.000 | 0.042 | 1.294 | 0.009 |
| −35.03 *** | 6.488 | 0.1034 | |||||||
| AIC | 433.553 | 449.000 | 82.56 | ||||||
| DIC | 403.553 | 434.096 | 99.95 | ||||||
| % Correct Fitting | 73.68 | 71.58 | 100 | ||||||
| indicates 1% significance or relevance level | |||||||||
| indicates 5% significance or relevance level | |||||||||
| indicates 10% significance or relevance level | |||||||||
| Variables | Frequentist | Bayesian | Asymmetric Bayesian | ||||||
|---|---|---|---|---|---|---|---|---|---|
| Robust Sd | p -Value | Sd | MC Error | Sd | MC Error | ||||
| Intercept | −0.985 *** | 0.131 | 0.000 | −1.231 *** | 0.225 | 0.000 | 11.55 *** | 2.859 | 0.131 |
| AS | 0.158 | 0.131 | 0.227 | 0.156 | 0.135 | 0.000 | 2.63 *** | 1.381 | 0.039 |
| HR | 0.494 *** | 0.115 | 0.000 | 0.517 *** | 0.115 | 0.000 | 5.542 *** | 1.763 | 0.063 |
| BUDH | −0.578 ** | 0.228 | 0.011 | −0.641 *** | 0.23 | 0.000 | −3.119 *** | 0.992 | 0.030 |
| BUDA | 0.409 *** | 0.127 | 0.001 | 0.423 *** | 0.126 | 0.000 | 4.571 *** | 1.79 | 0.057 |
| INTERNATIONAL | 0.327 | 0.262 | 0.000 | 2.715 * | 2.13 | 0.06 | |||
| −33.19 *** | 7.125 | 0.335 | |||||||
| AIC | 420.119 | 426.7 | 67.43 | ||||||
| DIC | 410.119 | 420.75 | 108.105 | ||||||
| % Correct Fitting | 72.89 | 70 | 100 | ||||||
| indicates 1% significance or relevance level | |||||||||
| indicates 5% significance or relevance level | |||||||||
| indicates 10% significance or relevance level | |||||||||
© 2018 by the authors. Licensee MDPI, Basel, Switzerland. This article is an open access article distributed under the terms and conditions of the Creative Commons Attribution (CC BY) license (http://creativecommons.org/licenses/by/4.0/).
Share and Cite
Pérez–Sánchez, J.M.; Gómez–Déniz, E.; Dávila–Cárdenes, N. A Comparative Study of Logistic Models Using an Asymmetric Link: Modelling the Away Victories in Football. Symmetry 2018, 10, 224. https://doi.org/10.3390/sym10060224
Pérez–Sánchez JM, Gómez–Déniz E, Dávila–Cárdenes N. A Comparative Study of Logistic Models Using an Asymmetric Link: Modelling the Away Victories in Football. Symmetry. 2018; 10(6):224. https://doi.org/10.3390/sym10060224
Chicago/Turabian StylePérez–Sánchez, José María, Emilio Gómez–Déniz, and Nancy Dávila–Cárdenes. 2018. "A Comparative Study of Logistic Models Using an Asymmetric Link: Modelling the Away Victories in Football" Symmetry 10, no. 6: 224. https://doi.org/10.3390/sym10060224
APA StylePérez–Sánchez, J. M., Gómez–Déniz, E., & Dávila–Cárdenes, N. (2018). A Comparative Study of Logistic Models Using an Asymmetric Link: Modelling the Away Victories in Football. Symmetry, 10(6), 224. https://doi.org/10.3390/sym10060224


