Article

Microstructure and Properties of the Ferroelectric-Ferromagnetic PLZT-Ferrite Composites

by
Dariusz Bochenek
1,*,
Przemysław Niemiec
1,
Joanna Korzekwa
1,
Bartłomiej Durtka
1 and
Zbigniew Stokłosa
2
1
Faculty of Computer Science and Material Science, Institute of Technology and Mechatronics, University of Silesia in Katowice, 12 Żytnia St., 41–200 Sosnowiec, Poland
2
Faculty of Computer Science and Material Science, Institute of Material Science, University of Silesia in Katowice, 1a, 75 Pułku Piechoty St., 41–500 Chorzów, Poland
*
Author to whom correspondence should be addressed.
Symmetry 2018, 10(3), 59; https://doi.org/10.3390/sym10030059
Submission received: 29 December 2017 / Revised: 19 February 2018 / Accepted: 28 February 2018 / Published: 6 March 2018
(This article belongs to the Special Issue Multiferroic Dynamics)

Abstract

:
The paper presents the technology of ferroelectric-ferromagnetic ceramic composites obtained from PLZT powder (the chemical formula Pb0.98La0.02(Zr0.90Ti0.10)0.995O3) and ferrite powder (Ni0.64Zn0.36Fe2O4), as well as the results of X-ray powder-diffraction data (XRD) measurement, microstructure, dielectric, ferroelectric, and magnetic properties of the composite samples. The ferroelectric-ferromagnetic composite (P-F) was obtained by mixing and the synthesis of 90% of PLZT and 10% of ferrite powders. The XRD test of the P-F composite shows a two-phase structure derived from the PLZT component (strong peaks) and the ferrite component (weak peaks). The symmetry of PLZT was identified as a rhombohedral ferroelectric phase, while the ferrite was identified as a spinel structure. Scanning electron microscope (SEM) microstructure analysis of the P-F ceramic composites showed that fine grains of the PLZT component surrounded large ferrite grains. At room temperature P-F composites exhibit both ferroelectric and ferromagnetic properties. The P-F composite samples have lower values of the maximum dielectric permittivity at the Curie temperature and a higher dielectric loss compared to the PLZT ceramics, however, the exhibit overall good multiferroic properties.

1. Introduction

Multiferroics belong to the group of materials which, simultaneously, have at least two spontaneously-ordered subsystems among the following states: ferromagnetic, ferroelectric, ferroelastic, and ferrotoroidic [1,2,3,4,5]. Most frequently, multiferroic materials are designed in the form of simple compounds, solid solutions, and composites [6,7,8,9,10,11,12,13,14]. The application capabilities of multiferroic materials in modern microelectronics and micromechatronics depend primarily on the degree of coupling between specific subsystems (magnetic, electric, or elastic) [15,16,17].
The modified PZT (PbZr1−xTixO3) materials with perovskite structures have been practically the most widely known and widely used ones for many years [18,19,20,21,22,23,24]. The lead lanthanum zirconate titanate (PLZT) ceramic is a well-known perovskite material, too, with the general chemical formula of Pb1−xLax(ZryTi1−y)1−0.25xVB0.25xO3. Similarly to the commonly-used modified PZT materials, compositional changes within the PLZT material can significantly alter the electrophysical properties thereof. PLZT materials have very good dielectric, ferroelectric, and piezoelectric properties which allow the usage of the PLZT-type material in a variety of applications [25,26,27,28,29].
In recent years, scientists worldwide have been focusing on composite materials with functional properties [12,30,31,32]. A special place in these studies is occupied by multiferroic composites (for example, the combination of piezoelectric materials and ferrites). Such materials are formed from ferroelectric ceramic powder (with high piezoelectric properties) and ferrite powder with magnetic properties. This type of material connection allows the co-existence of ferroelectricity and magnetism. The applications thereof may concern new types of memory, where it can be used as a dielectric and magnetic center for multilayer ceramic capacitors (MLCC), multilayer microwave resonators, ferroelectromagnetic transducers, etc. The useful properties of this type of multiferroic material depend on the coupling between magnetic and polarization orders [1,15,33,34].
The aim of the work is to obtain and study the ceramic composites with good ferroelectromagnetic properties. The composite consisted of the ferroelectric PLZT component with the chemical formula: Pb0.98La0.02(Zr0.90Ti0.10)0.995O3 and the ferrite (magnetic) component with the chemical formula Ni0.64Zn0.36Fe2O4, in PLZT/ferrite proportions of 90/10. The structural, microstructural, DC electric conductivity, magnetic, dielectric, and ferroelectric properties of the composite samples were investigated, and the influence of the sintering temperature on the electrophysical properties of composites was researched.

2. Experiment

2.1. Preparation of the Ceramic Materials

The technological process of obtaining composite (P-F) samples consisted of several stages. The PLZT powder with the following chemical formula Pb0.98La0.02(Zr0.90Ti0.10)0.995O3 (material with a perovskite structure) and the ferrite powder with the chemical formula Ni0.64Zn0.36Fe2O4, were used to obtain the composite samples. The synthesis of the composite powder was carried out conventionally.
In the first stage, the PLZT ceramic powder was obtained from stoichiometric mixtures of PbO (99.9% Sigma-Aldrich, St. Louis, MO, USA), ZrO2 (99% Tosoh, Amsterdam, The Netherlands), TiO2 (99.8% Alfa Aesar, Karlsruhe, Germany) and La(OH)3 prepared from La2O3 (99.99% Alfa Aesar, Karlsruhe, Germany) by equilibrating it in a humid atmosphere. The technology of the PLZT powder was carried out using 3-steps of milling. The starting powders were homogenized in a planetary mill at 200 rpm for 2 h. Successively, after drying, the mixtures were calcined at 900 °C for 2 h, re-milled, and re-calcined. After a second calcination, the powders were mixed in an attritor mill and dried [35].
In the second stage, the ferrite powder (Ni0.64Zn0.36Fe2O4 powder) was obtained from NiO (99.99% Aldrich, Steinheim, Germany), Fe2O3 (99.98% Sigma-Aldrich, St. Louis, MO, USA), and ZnO (98% Fluka, Neu-Ulm, Germany). The ferrite components were mixed with a Fritsch planetary ball mill for 8 h (in ethyl alcohol medium) and calcined at 1100 °C for 4 h.
In the third stage, two powders (PLZT and ferrite) were mixed in the proportion of 90% of PLZT and 10% of ferrite, using a Fritsch planetary ball mill for 15 h (wet in ethyl alcohol medium). The mixture was synthesized by calcination under the following conditions: 1000 °C for 4 h.
The final sintering of the ceramic P-F composite samples was conducted under the following conditions: Ts1 = 1200 °C (P-F1), Ts2 = 1250 °C (P-F2) and Ts3 = 1300 °C (P-F3) for ts = 2 h. The three ceramic composites obtained in the above sintering conditions have been compared in this work. For the electrical measurements, sintered pellets with a thickness of 1.0 mm were prepared. Stress was removed by annealing the pellets at 750 °C. The surfaces of the pellets were covered with a silver electrode.

2.2. Characterization

Granulometric analyses of the milled PLZT powders were performed on a Cilas Hr-850-B laser granulometer manufactured by Alcatel (Compagnie Industrielle Des Lasers, Marcoussis, France). The sintering behavior of the calcinated PLZT powders was followed using a heating-stage microscope (Leitz, Wetzlar, Germany) in the temperature range from 25 °C to 1400 °C, in an oxygen atmosphere. The synthesis temperature of the P-F composite powder was selected on the basis of differential thermal analysis DTA, as well as DTG and TG, with the usage of a Q-1500D derivatograph (MOM, Q-1500D, F. Paulik, J. Paulik, L. Erdey system, Budapest, Hungary) in the temperature range from 20 °C to 1030 °C.
The X-ray powder-diffraction data (XRD) of the sintered P-F samples were collected at room temperature on a (PANalytical, Phillips X’Pert Pro, Eindhoven, The Netherlands) diffractometer (Cu-Kα radiation). The data were collected in the 2θ range from 10° to 65°, in steps of 0.02 degrees, with an integration time of 4 s/step. A scanning electron microscope SEM (Jeol Lid., JEOL JSM-7100 TTL LV, Tokyo, Japan), equipped with an energy-dispersive system EDS (Jeol Lid., EX-35170EDES, Tokyo, Japan) and a backscattered electron detector BSE (Jeol Lid., SCM-25D170, Tokyo, Japan) was used for the microstructural analysis. Prior to the SEM/EDS analyses, the samples were coated with gold to provide electrical conductivity and to avoid any charging effects.
Dielectric measurements were performed on a capacity bridge (QuadTech, Inc., 1920 Precision LCR meter, Maynard, MA, USA), for a cycle of heating (in temperature range from 20 °C to 420 °C). DC electrical conductivity has been measured using an electrometer (Keithley Instruments, Inc., 6517B, Cleveland, OH, USA) in the same temperature range. Ferroelectric hysteresis PE loops were made using a Sawyer-Tower circuit and a high voltage amplifier (Matsusada Precision Inc., HEOPS-5B6, Kusatsu, Japan) while the data were stored on a computer disc using an A/D, D/A transducer card and the LabView computer program. Magnetic properties were obtained by applying the Quantum Design PPMS system (Quantum Design, PPMS 7T ACMS module, San Diego, CA, USA). Dynamic magnetic susceptibility (the real and imaginary part and magnetic loss) was measured versus the AC magnetization field in the range from 40 A/m to 1200 A/m for 50 Hz, 120 Hz, and 1000 Hz, as soon as the field frequency (ranging from 50 Hz to 2000 Hz, magnetic field 800 A/m). All magnetic measurement was carried out at room temperature.

3. Results and Discussion

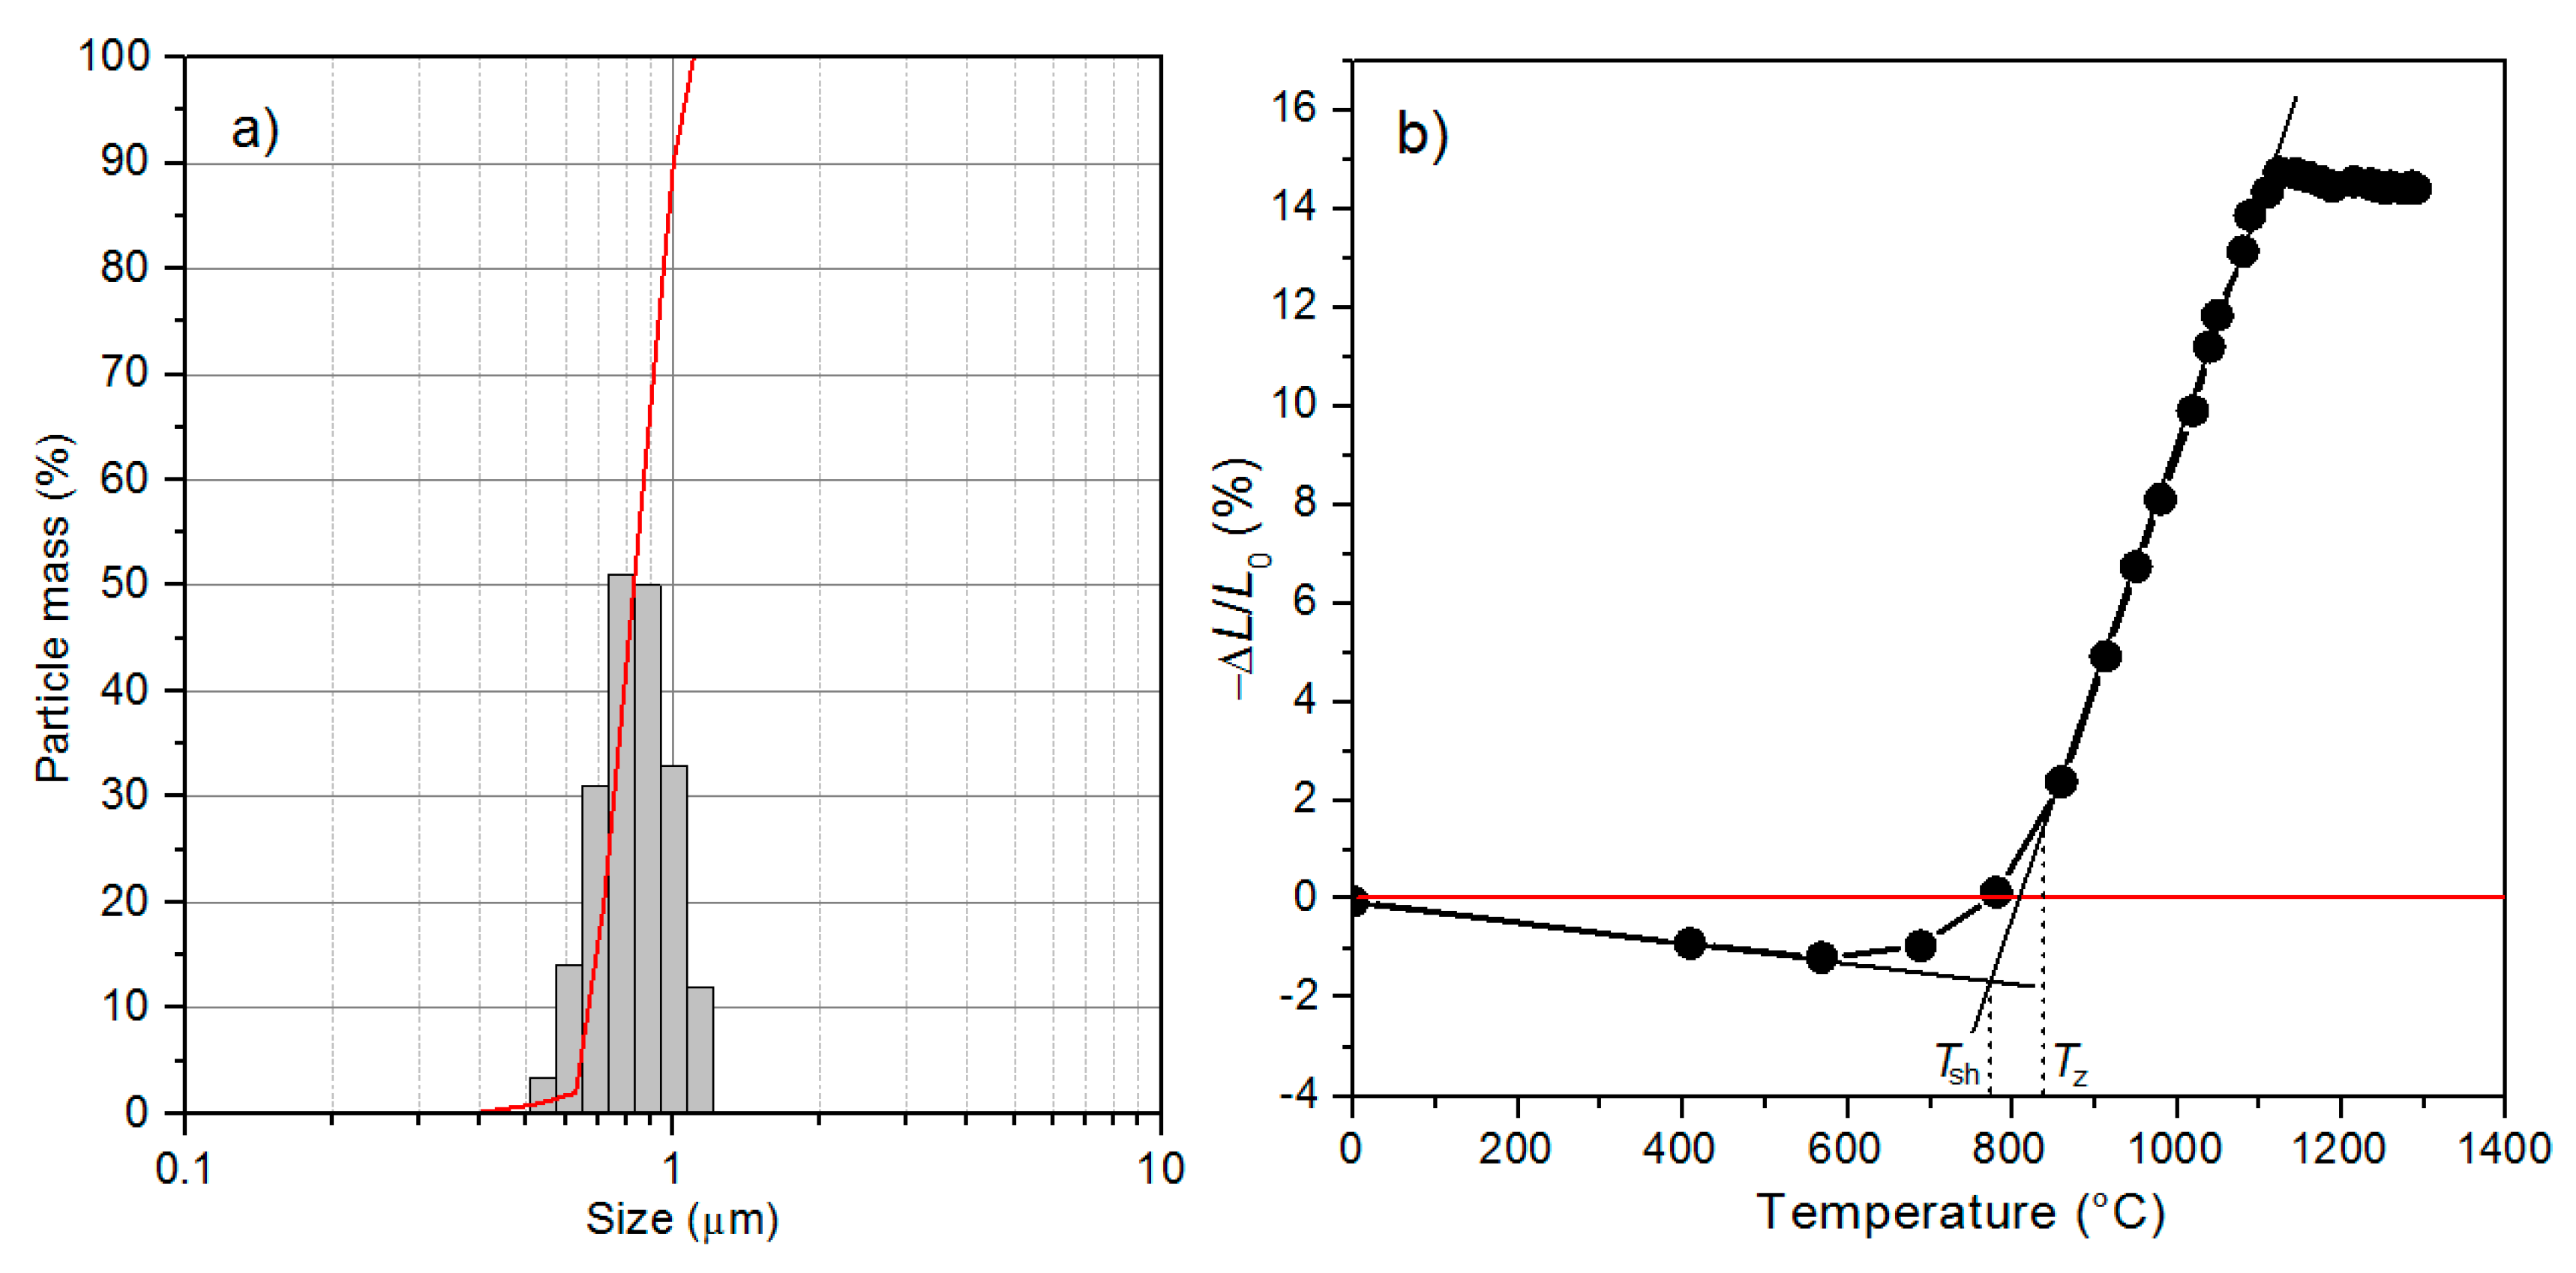
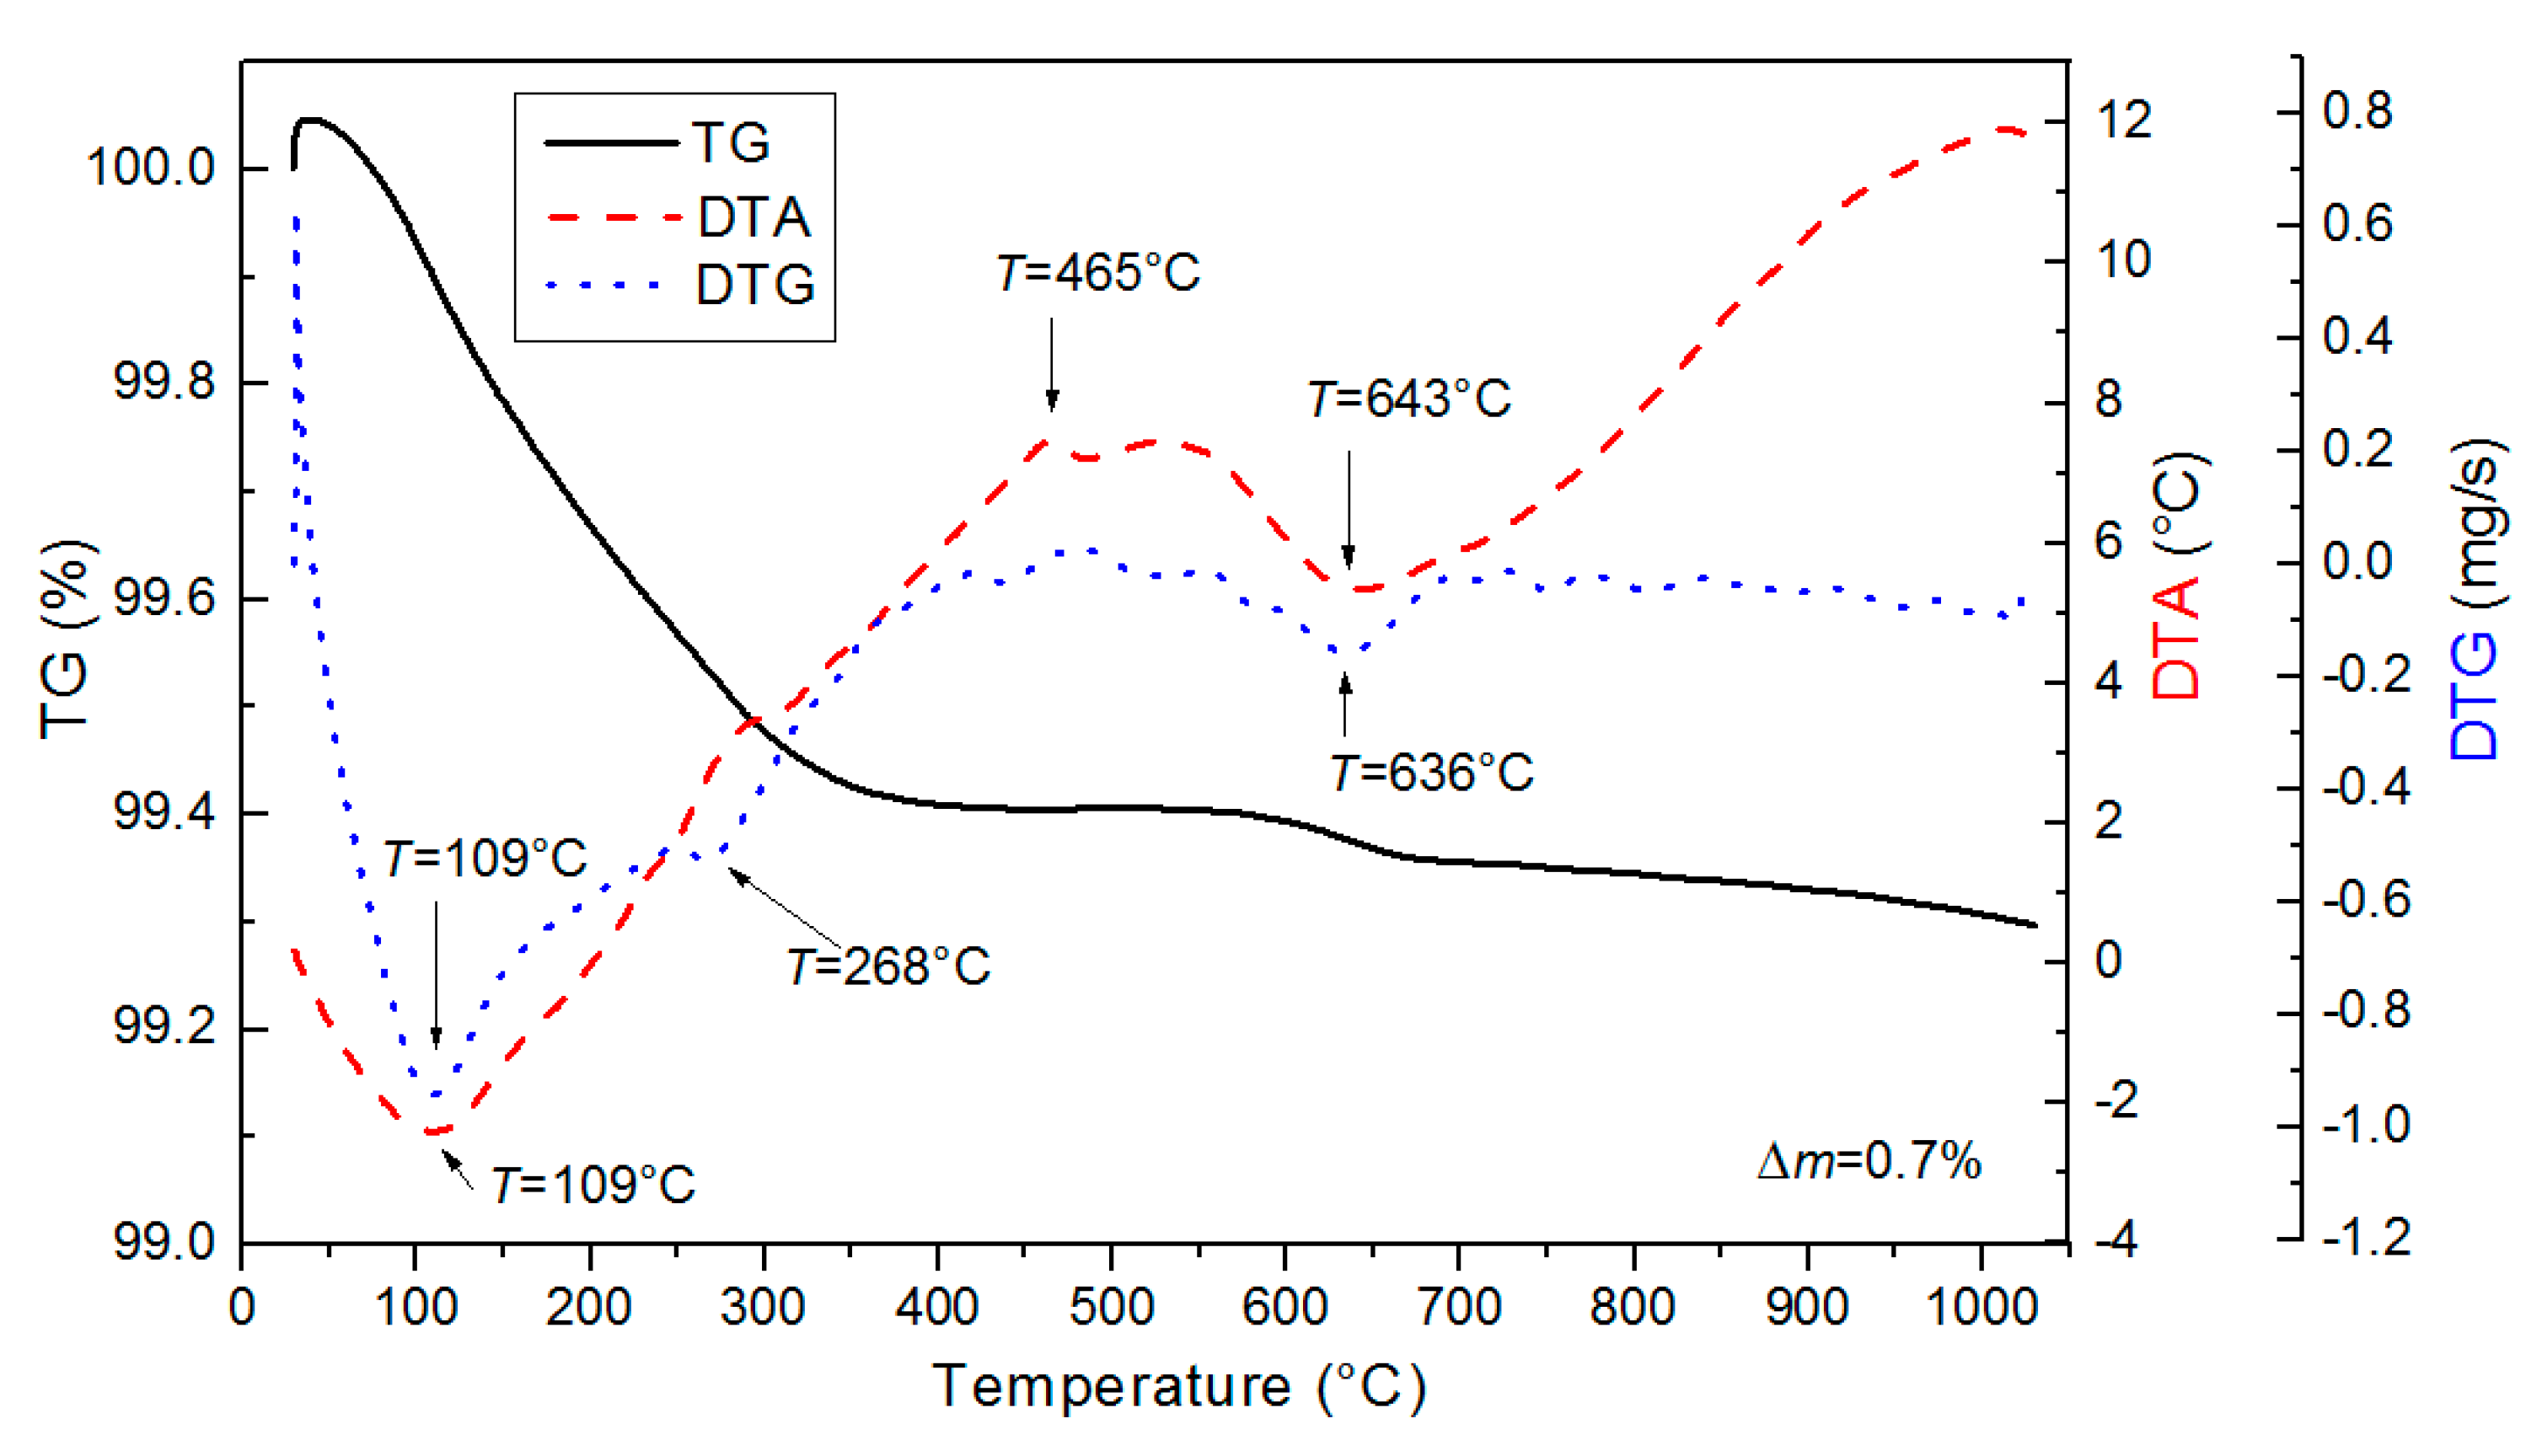
3.1. Analysis of Ceramic Powder

The histogram of particle size distribution of the PLZT powder (Figure 1a) shows a single-modal Gaussian distribution, with the average particle size ra = 0.82 μm. It confirms the homogeneous powder of the PLZT with the fine particle size. Figure 1b shows the shrinkage—temperature curves of the calcined PLZT powder. Judging by the shape of the curves, it is clear that the sintering process is finished at 1100 °C. In the graph the horizontal line (red line) separates two areas where volumetric changes of material are observed. A lower region corresponds to the material exhibiting cubical expansion; in the upper area one can observe the shrinkage of the material. Above 1100 °C, another change of the cubical expansion is observed. It is a result of the sintering mechanisms. Based on inflection points in the characteristic temperature areas, the start of the shrinkage temperature (Tsh = 765 °C) and the rapid thickening temperature (Tz = 830 °C) were determined.
The synthesis temperature of the P-F composite powder was determined with DTA/TG analysis (Figure 2). The DTA result has shown that the synthesis of the components of the analyzed material powder occurs to the temperature of 650 °C. The TG curve has shown the characteristic changes associated with the weight loss of the ceramic sample during heating. The extreme weight loss falls at a temperature of about 320 °C, and is associated with the evaporation of moisture from the sample. This confirms the occurrence of the peak on the DTA curve at 109 °C (endothermic maximum). The peak on the DTA curve (at 465 °C) is related to the phenomenon of nucleation and the formation of intermediate phases (including non-perovskite–pyrochlore phase). The right heating speed during the technological process eliminates the possibility of creating undesirable phases. The second clear mass loss on the TG curve is related to the formation of the perovskite phase, which confirms the occurrence of the peak at 643 °C on the DTA curve (endothermic maximum). Above the temperature of 750 °C further weight loss is not observed. In the whole range temperature the weight loss does not exceed 0.7%.

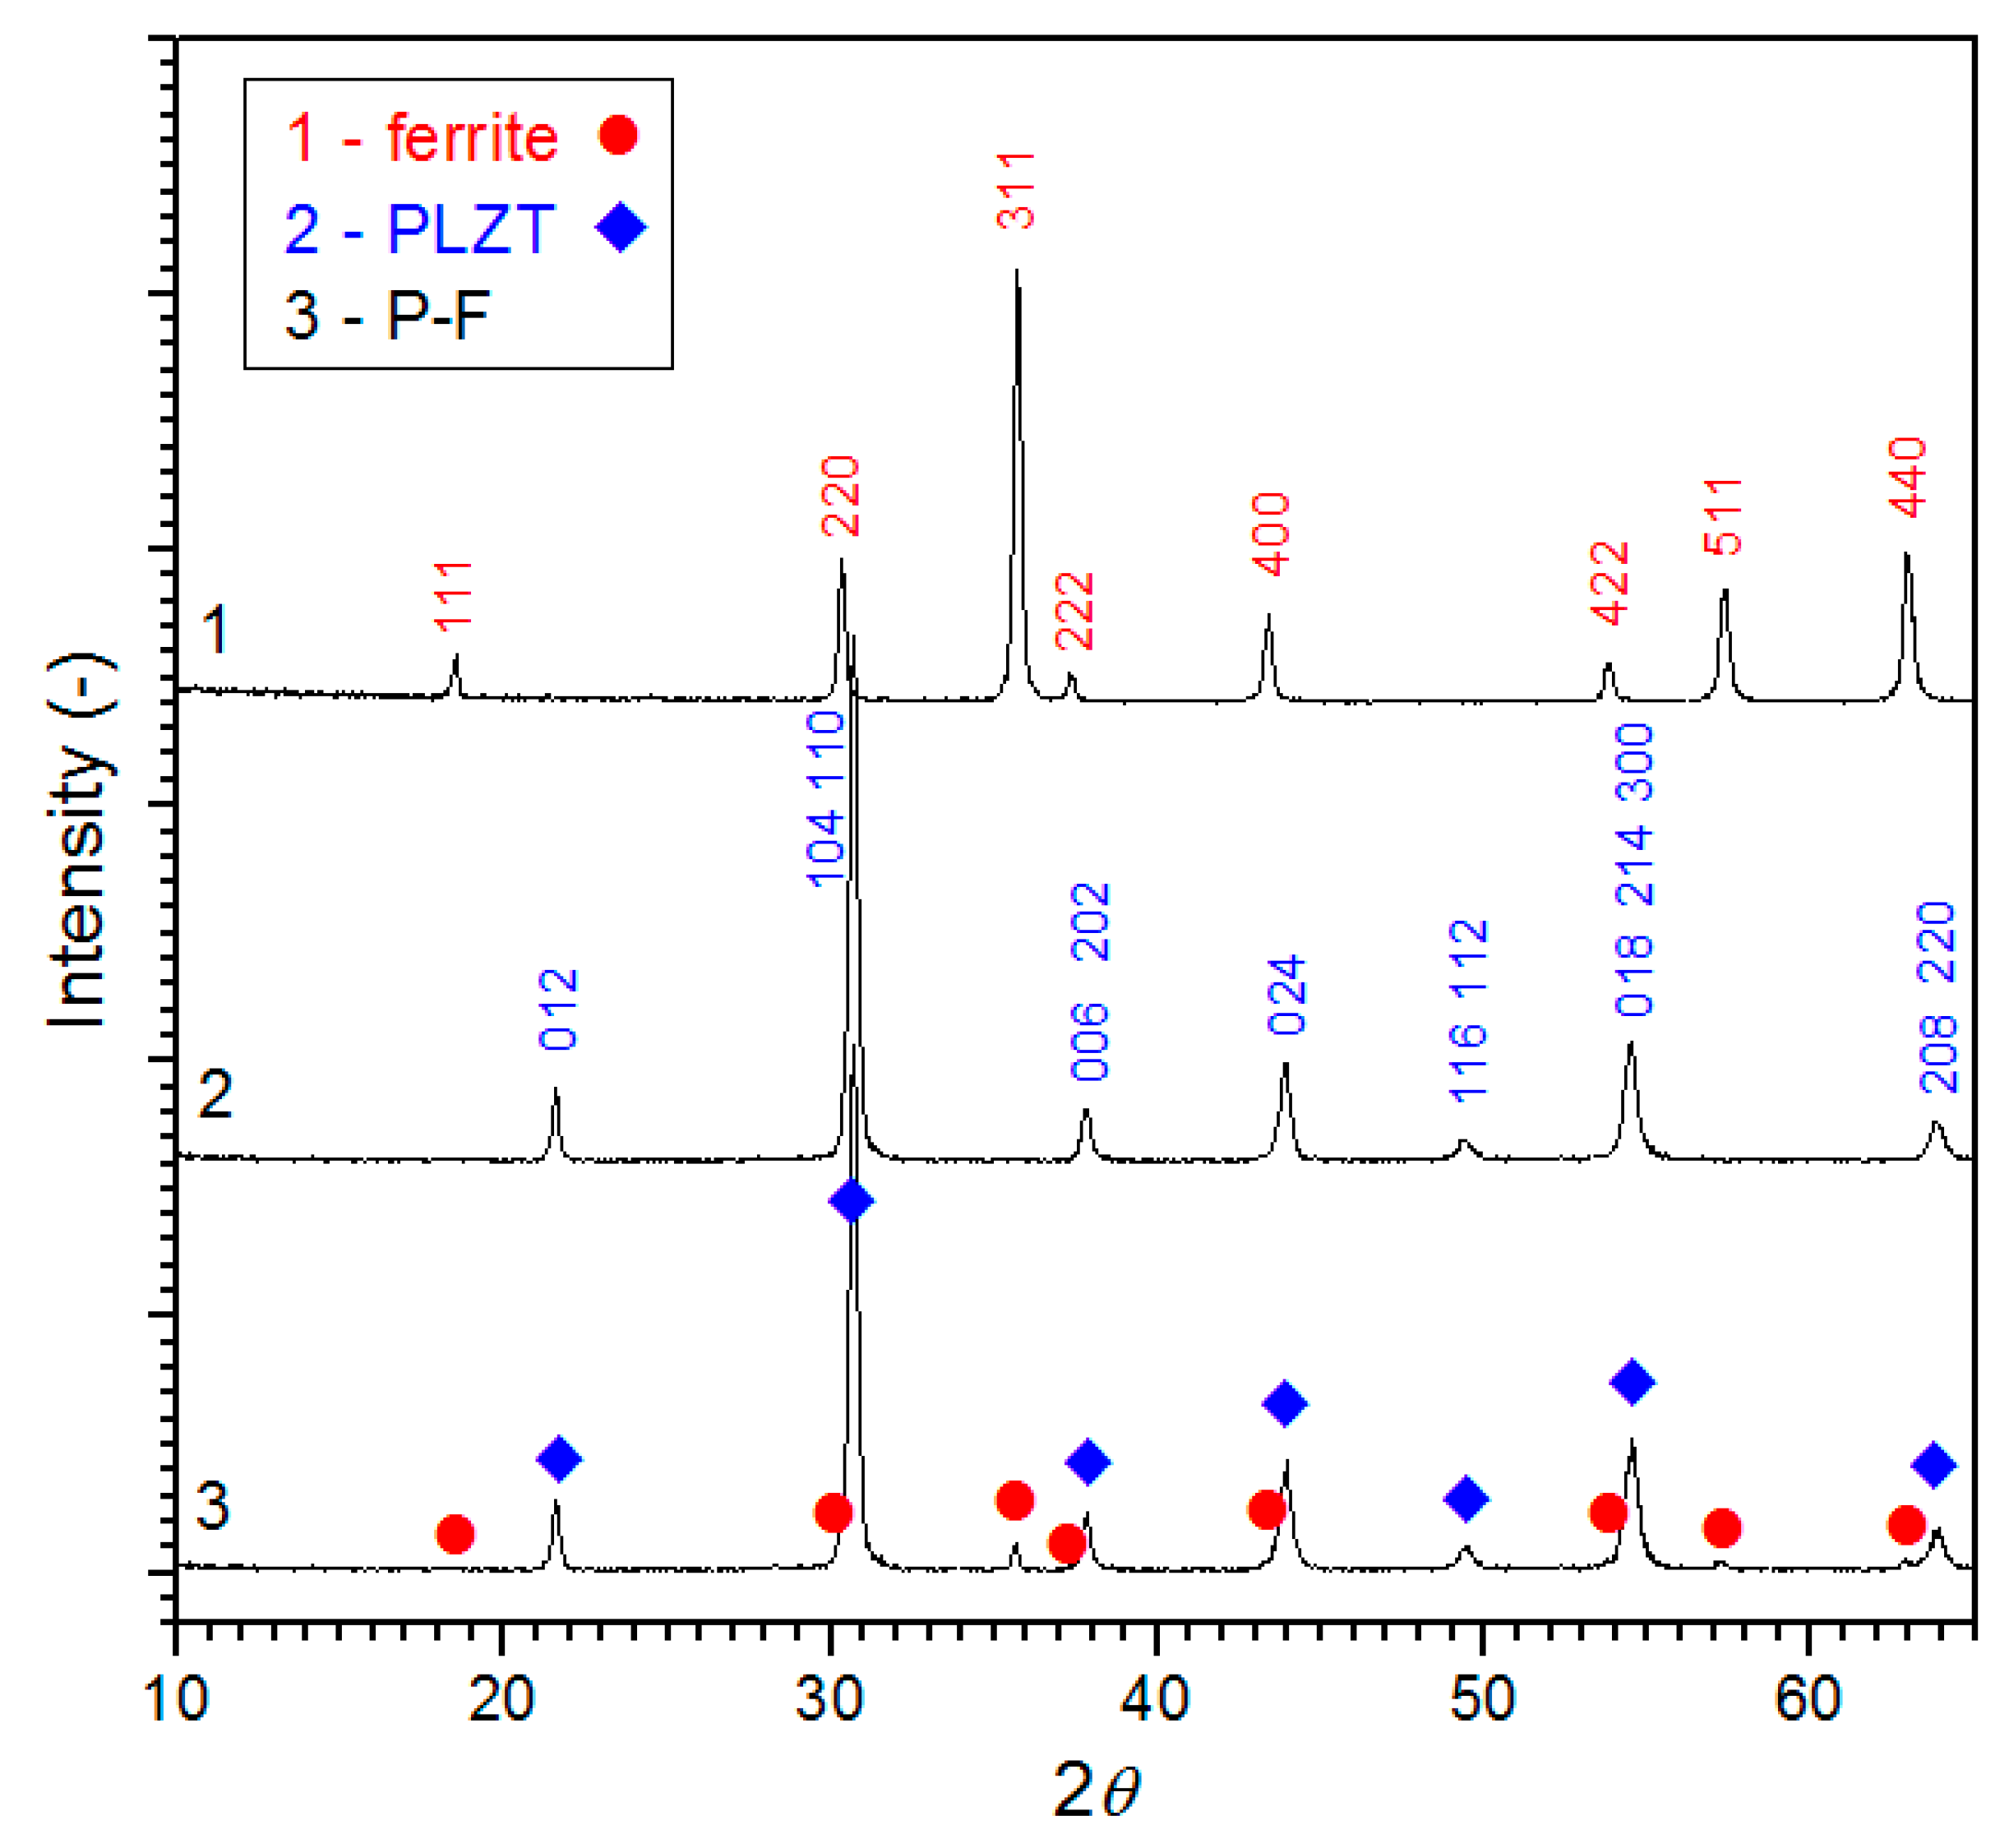
3.2. X-ray Diffraction Studies

X-ray powder-diffraction patterns of the PLZT, ferrite, and P-F materials are shown in Figure 3. The XRD studies of the ceramic powders have shown the absence of foreign phases. The diffraction peaks in the PLZT 2/90/10 patterns showed a perovskite structure, while the ferrite powder (Ni0.64Zn0.36Fe2O4) has a spinel structure. According to the phase diagram of PLZT proposed by Haertling [36] for low La3+ content (x ≤ 0.02), material PLZT 2/90/10 can be well indexed with the rhombohedral ferroelectric phase. For PLZT compositions with La3+ content from the area of 0.025 ≤ x < 0.035, the coexistence of orthorhombic-rhombohedral phases occurs, while with high La3+ content (x ≥ 0.035), the reflection is related to the presence of orthorhombic AFE phase [37]. The symmetry of PLZT with high La3+ content in [38] was also explained by a disordered rhombohedral, a monoclinic, or an orthorhombic phase.
The XRD test of the PLZT powder showed that the best-matched results were obtained for the pattern (no. PDF 77-1194) with a rhombohedral ferroelectric phase and R3c space group (with unit cell parameters: a0 = 5.8410 Å, c0 = 14.4160 Å, and α = 89.9953° [26]. In the case of the P-F composite material, the X-ray test shows peaks of the two components. Very strong peaks are derived from the PLZT component and the other weak peaks are derived from the ferrite materials with a spinel structure.

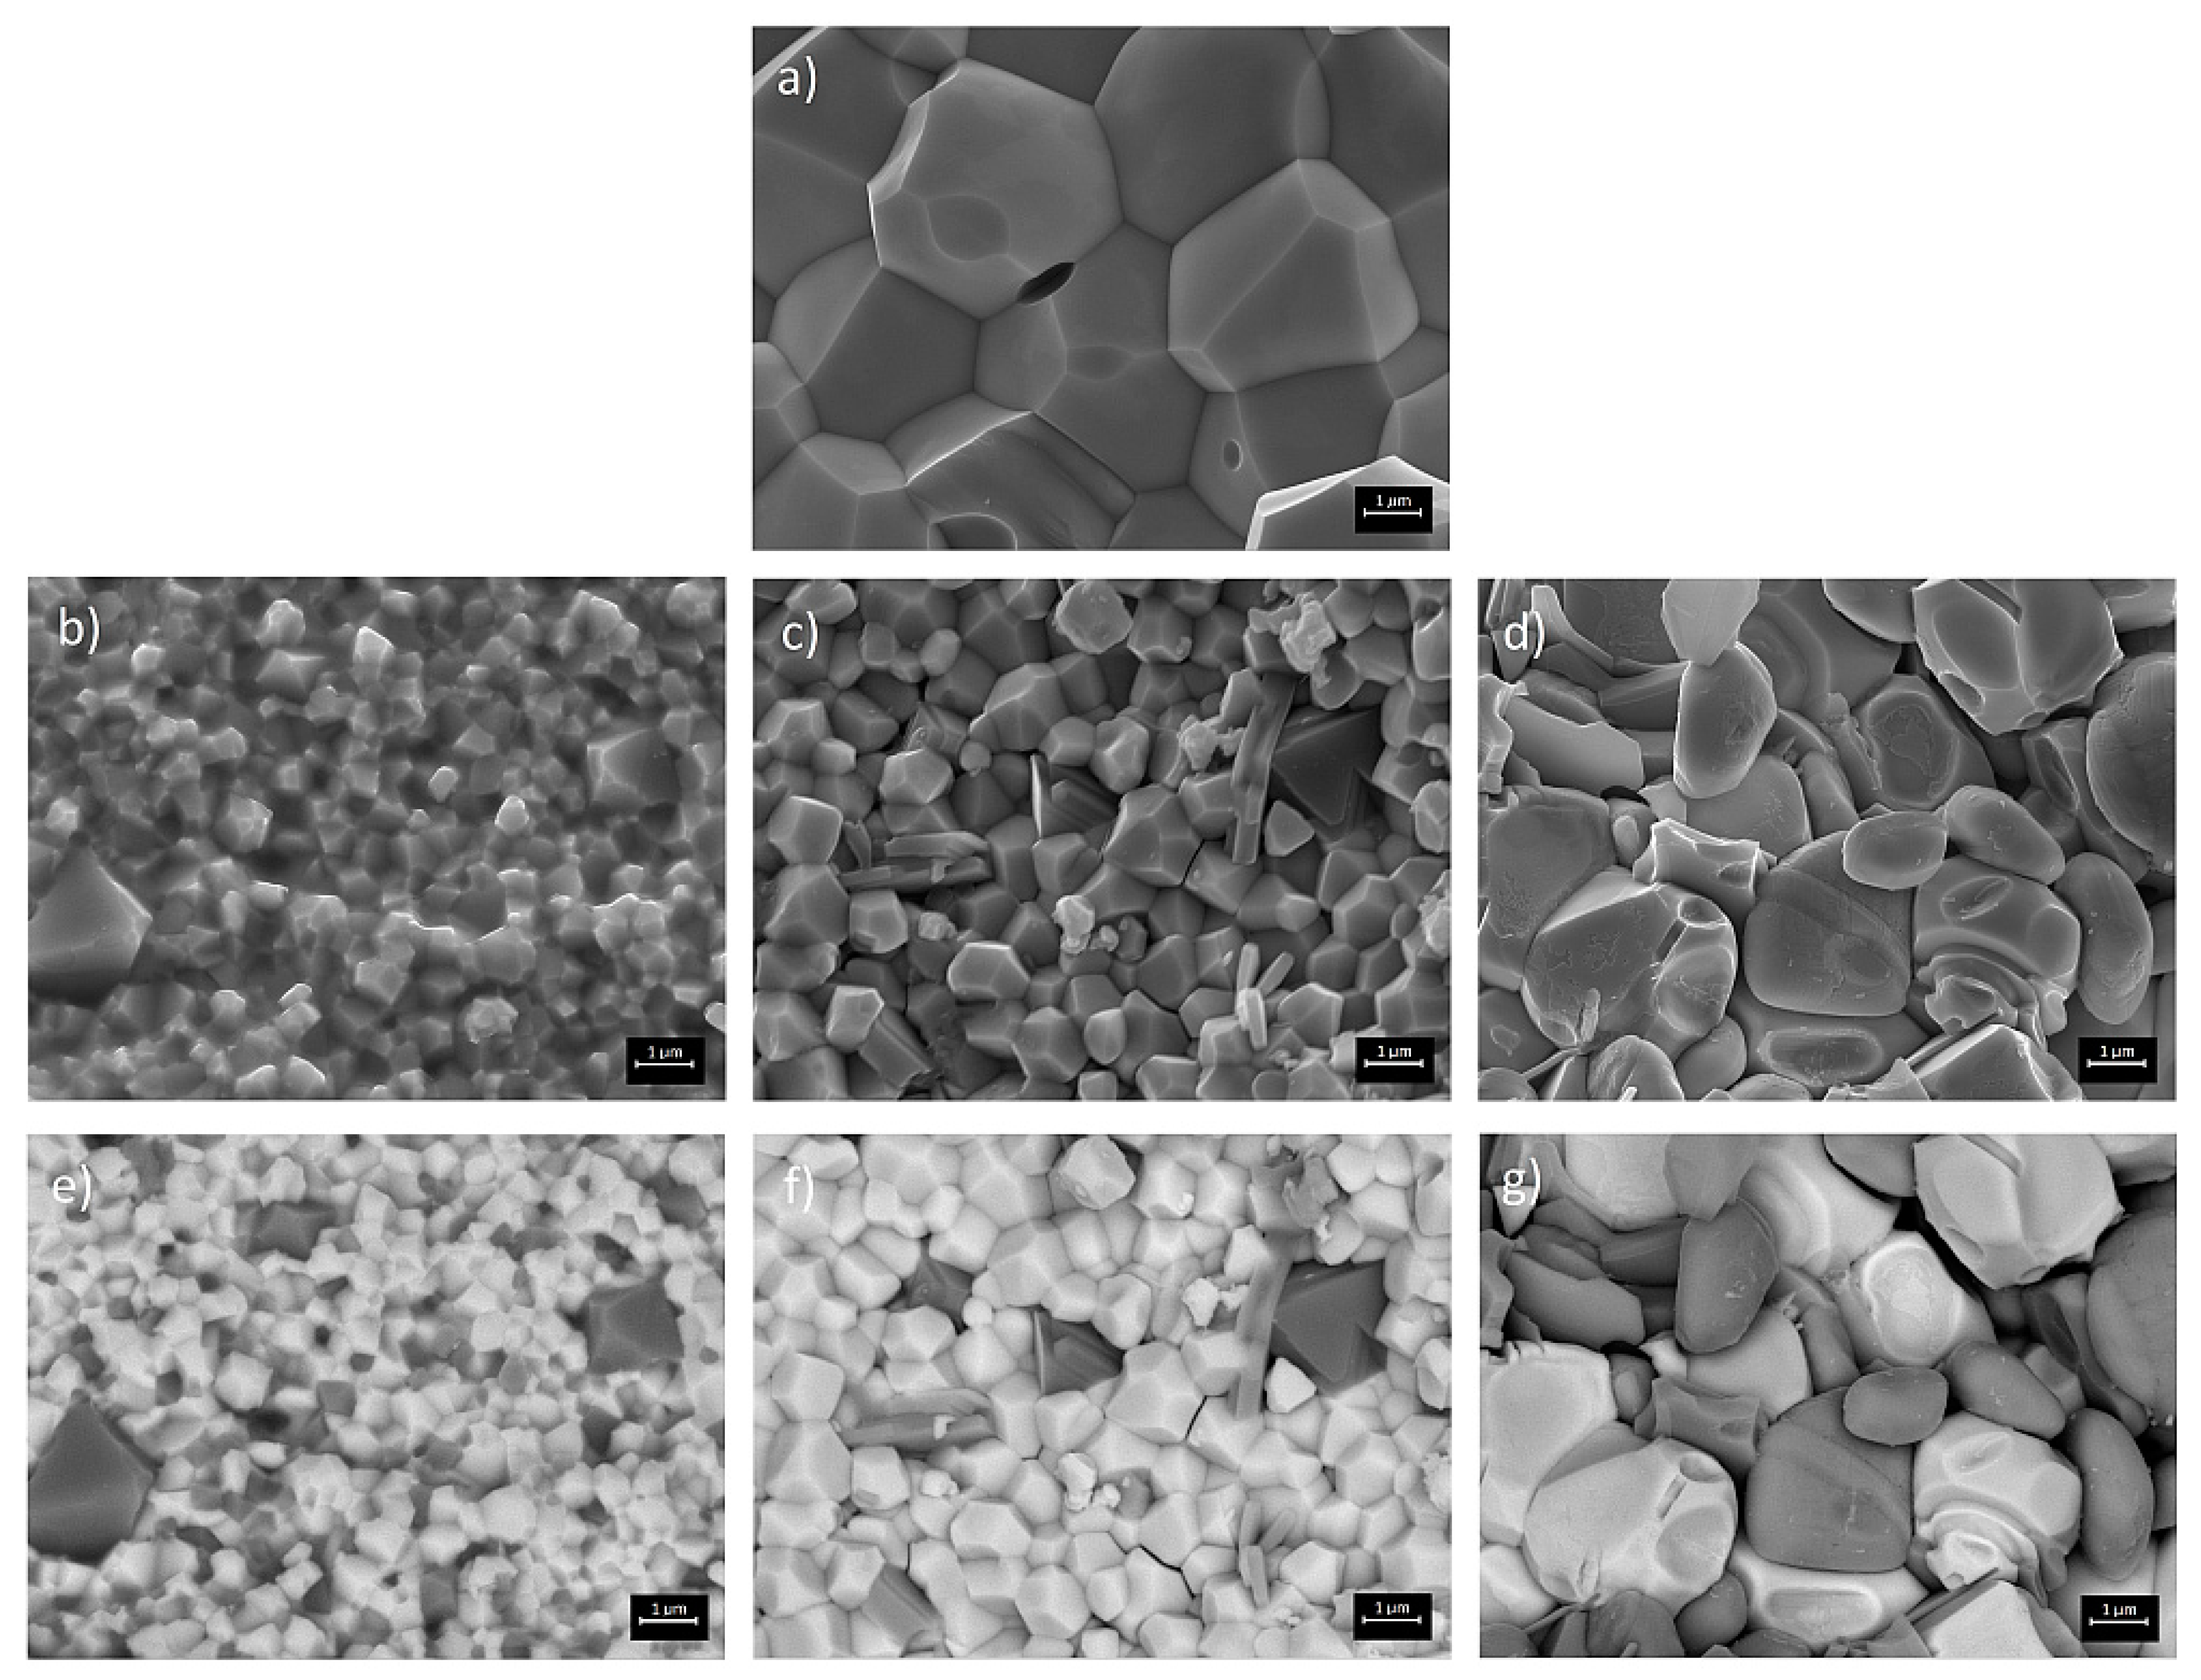
3.3. Microstructural Properties

The SEM microstructure of the PLZT ceramic sample (obtained for the following sintering conditions: Ts = 1250 °C for ts = 2 h), characterized by a non-porous microstructure with densely packed and properly crystallized grains, is shown in Figure 4a.
The P-F composite samples (Figure 4b–d) have a fine-grained microstructure, as compared to the PLZT ceramics: small, with well-formed shaped grains of the PLZT component, surrounded by larger grains of the ferrite with a characteristic pyramidal shape. This is clearly visible in pictures taken by the backscattered electron (BSE) technique (Figure 4e–g). The ferrite grains are evenly distributed in the whole microstructure of the composite samples. As the sintering temperature grows, the increase of the average grain size is observed. The increase of the sintering temperature to 1250 °C (P-F2) causes a significant growth of the grain size. Additionally, disparities between the PLZT and ferrite grains size are much more visible. At a sintering temperature of 1300 °C, the grains grow significantly (P-F3), whereas ferrite grains are of an irregular shape. The grain boundaries of the PLZT/ferrite composites are irregular and the microstructure shows a high porosity. The high sintering temperature adversely affects the ceramic composite microstructure—too high an increase of the grain leads to increased porosity and mechanical stresses.
The EDS analysis confirmed the presence of constituent elements in the test of the P-F composite samples. The results of the percentage of individual components of the P-F composite, summarized in Table 1, are the averaging of 10 randomly-chosen areas of the surface of the sample. In the case of the P-F1 and P-F2 composite samples, lead, lanthanum, and titanium deficiencies, as well as a small excess of iron, zirconium, zinc and nickel are observed, as compared to theoretical calculations. All deviations from the initial composition are within the acceptable range. In the case of the P-F3 sample, the disproportions of the components from the assumed composition are the highest (mainly a large loss of lead).

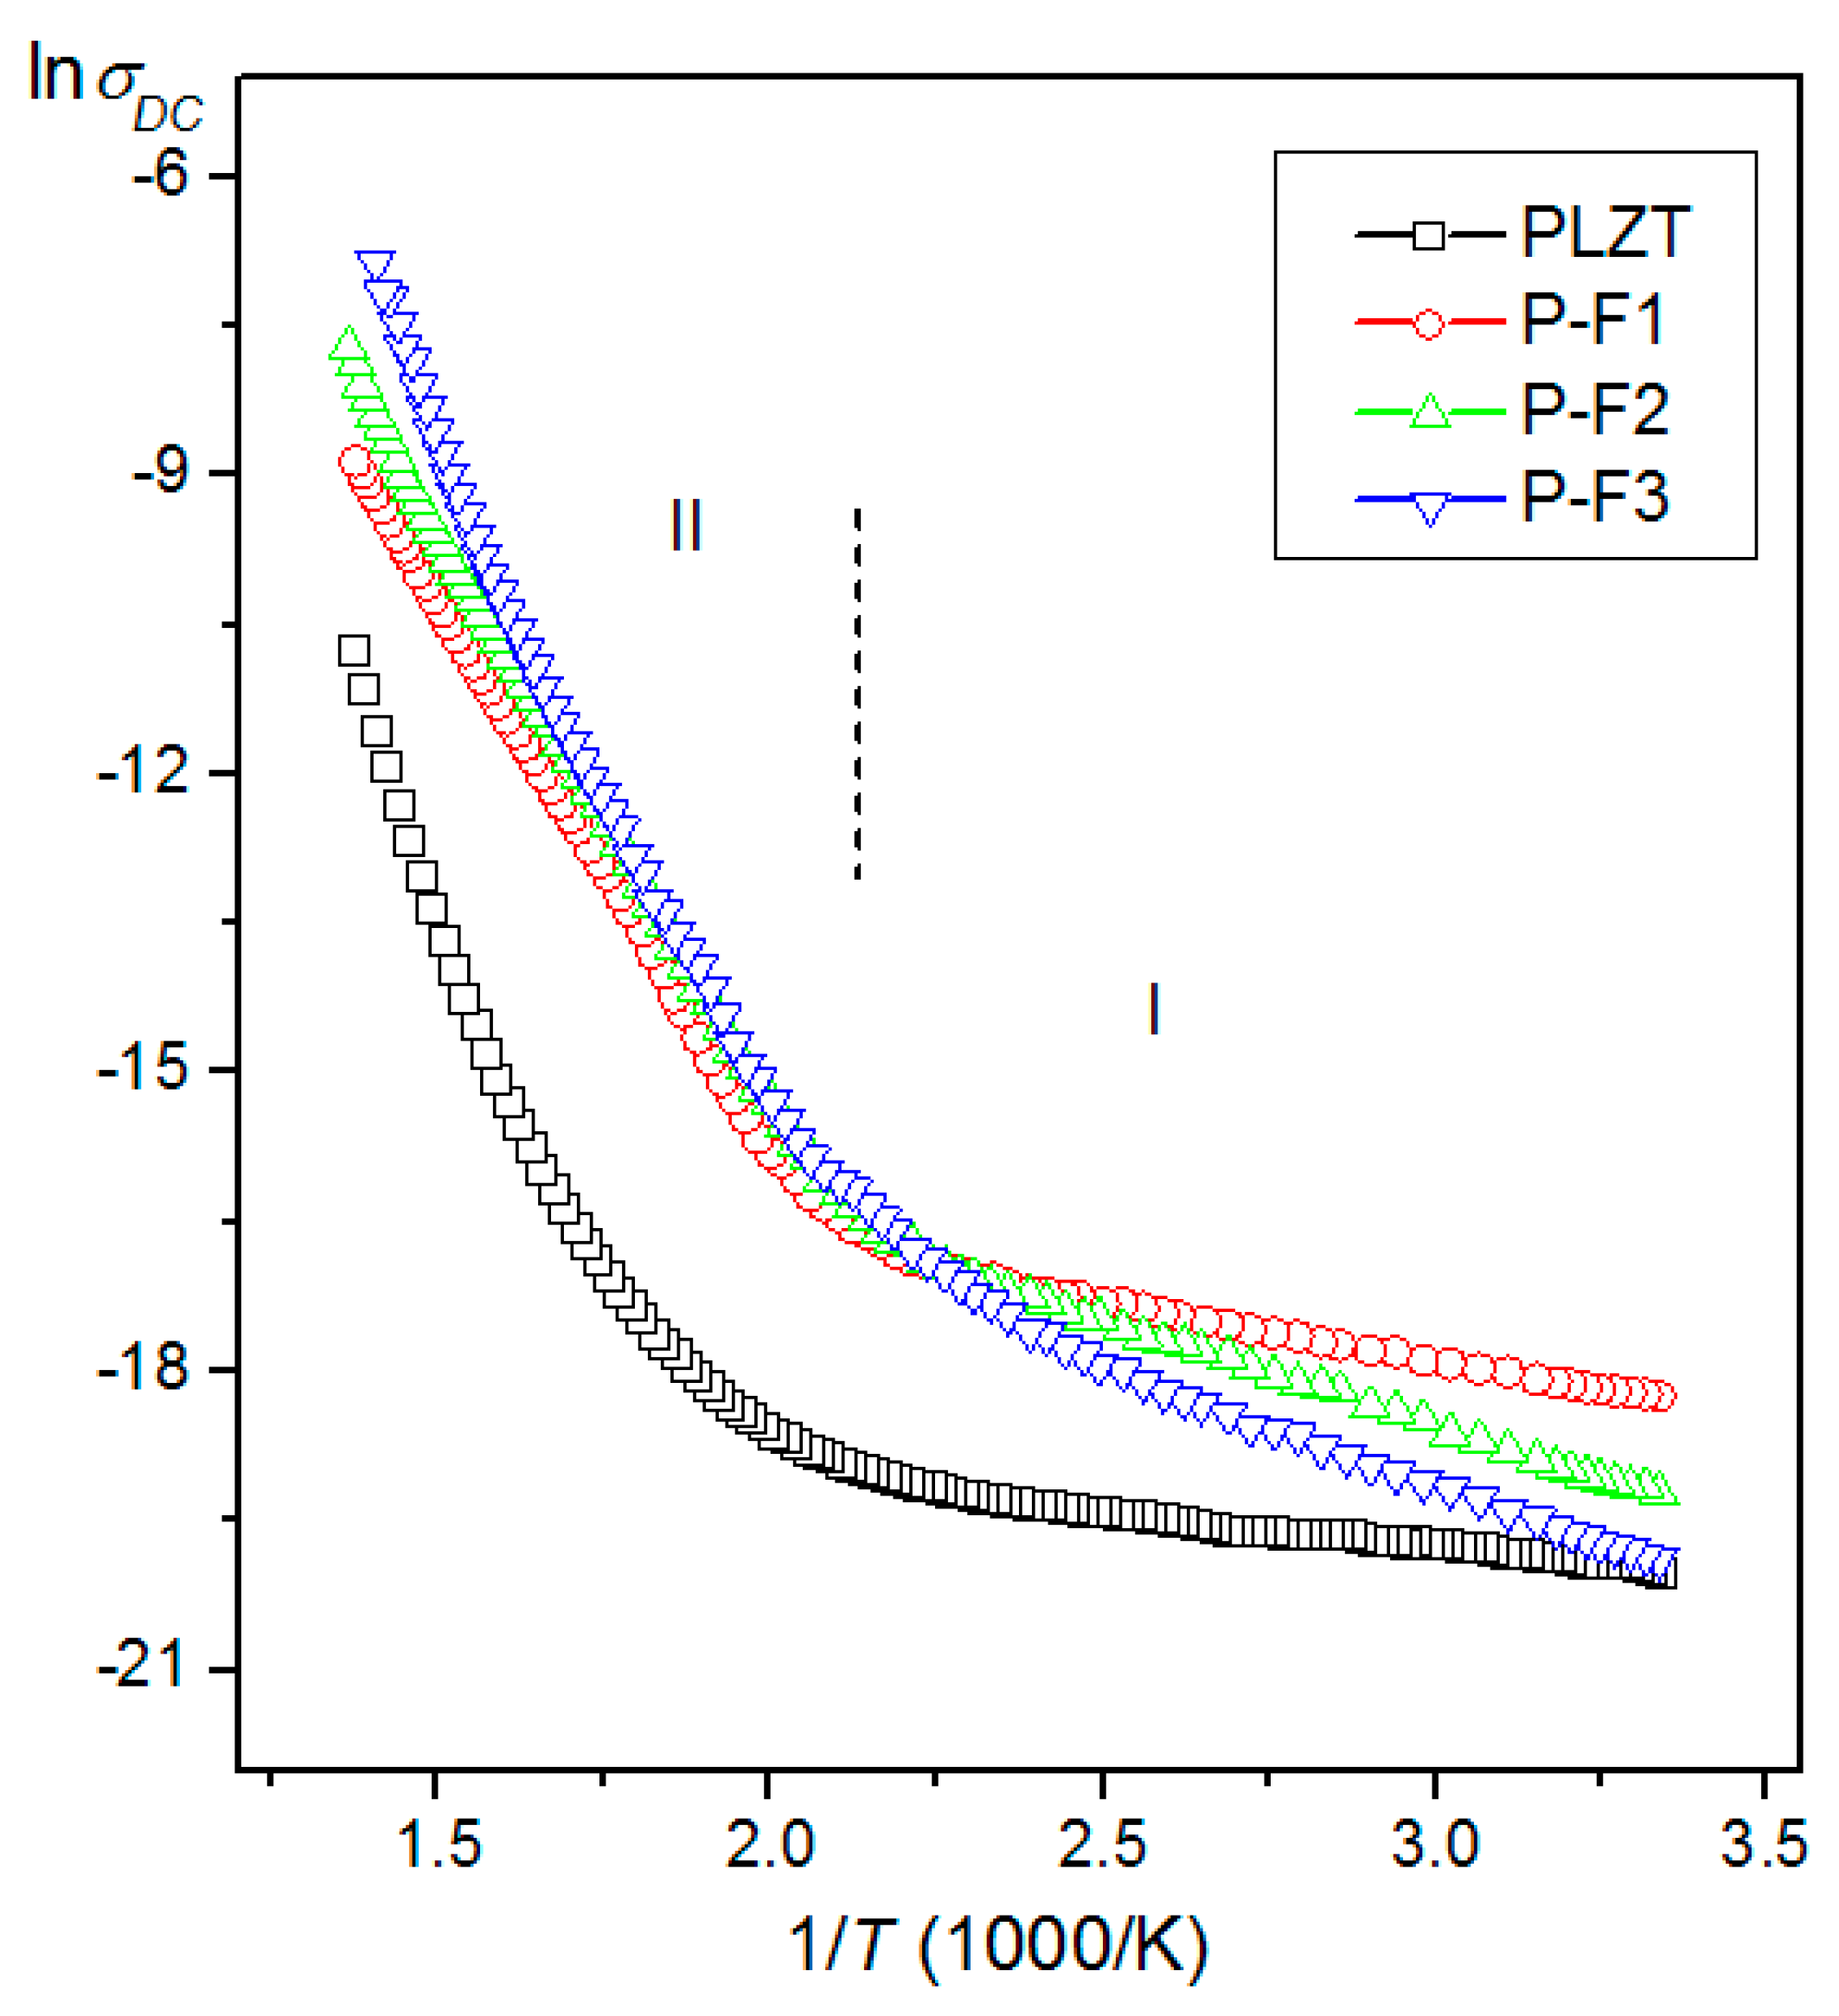
3.4. DC Electrical Conductivity Measurements

At room temperature, the ρDC resistivity of the PLZT ceramics is 1.2 × 10⁹ Ωm, while at the phase transition, the temperature ρDC is 3.0 × 10⁷ Ωm. At room temperature, the resistivity of the composite samples does not increase significantly. At higher temperatures, all the P-F composite samples have a higher electric conductivity, as compared to the PLZT ceramics (Figure 5).
The activation energy for the PLZT ceramics and the P-F composite samples was calculated according to Arrhenius’ law [39]:
σ = σ 0 exp ( E A c t k B T )
where σ0 is the pre-exponential factor, kB is Boltzmann’s constant, T is the absolute temperature, and EAct is the activation energy appointed from the slope of lnσDC vs. the 1/T plot. The values of the activation energy EAct at two characteristic regions are presented in Table 2.

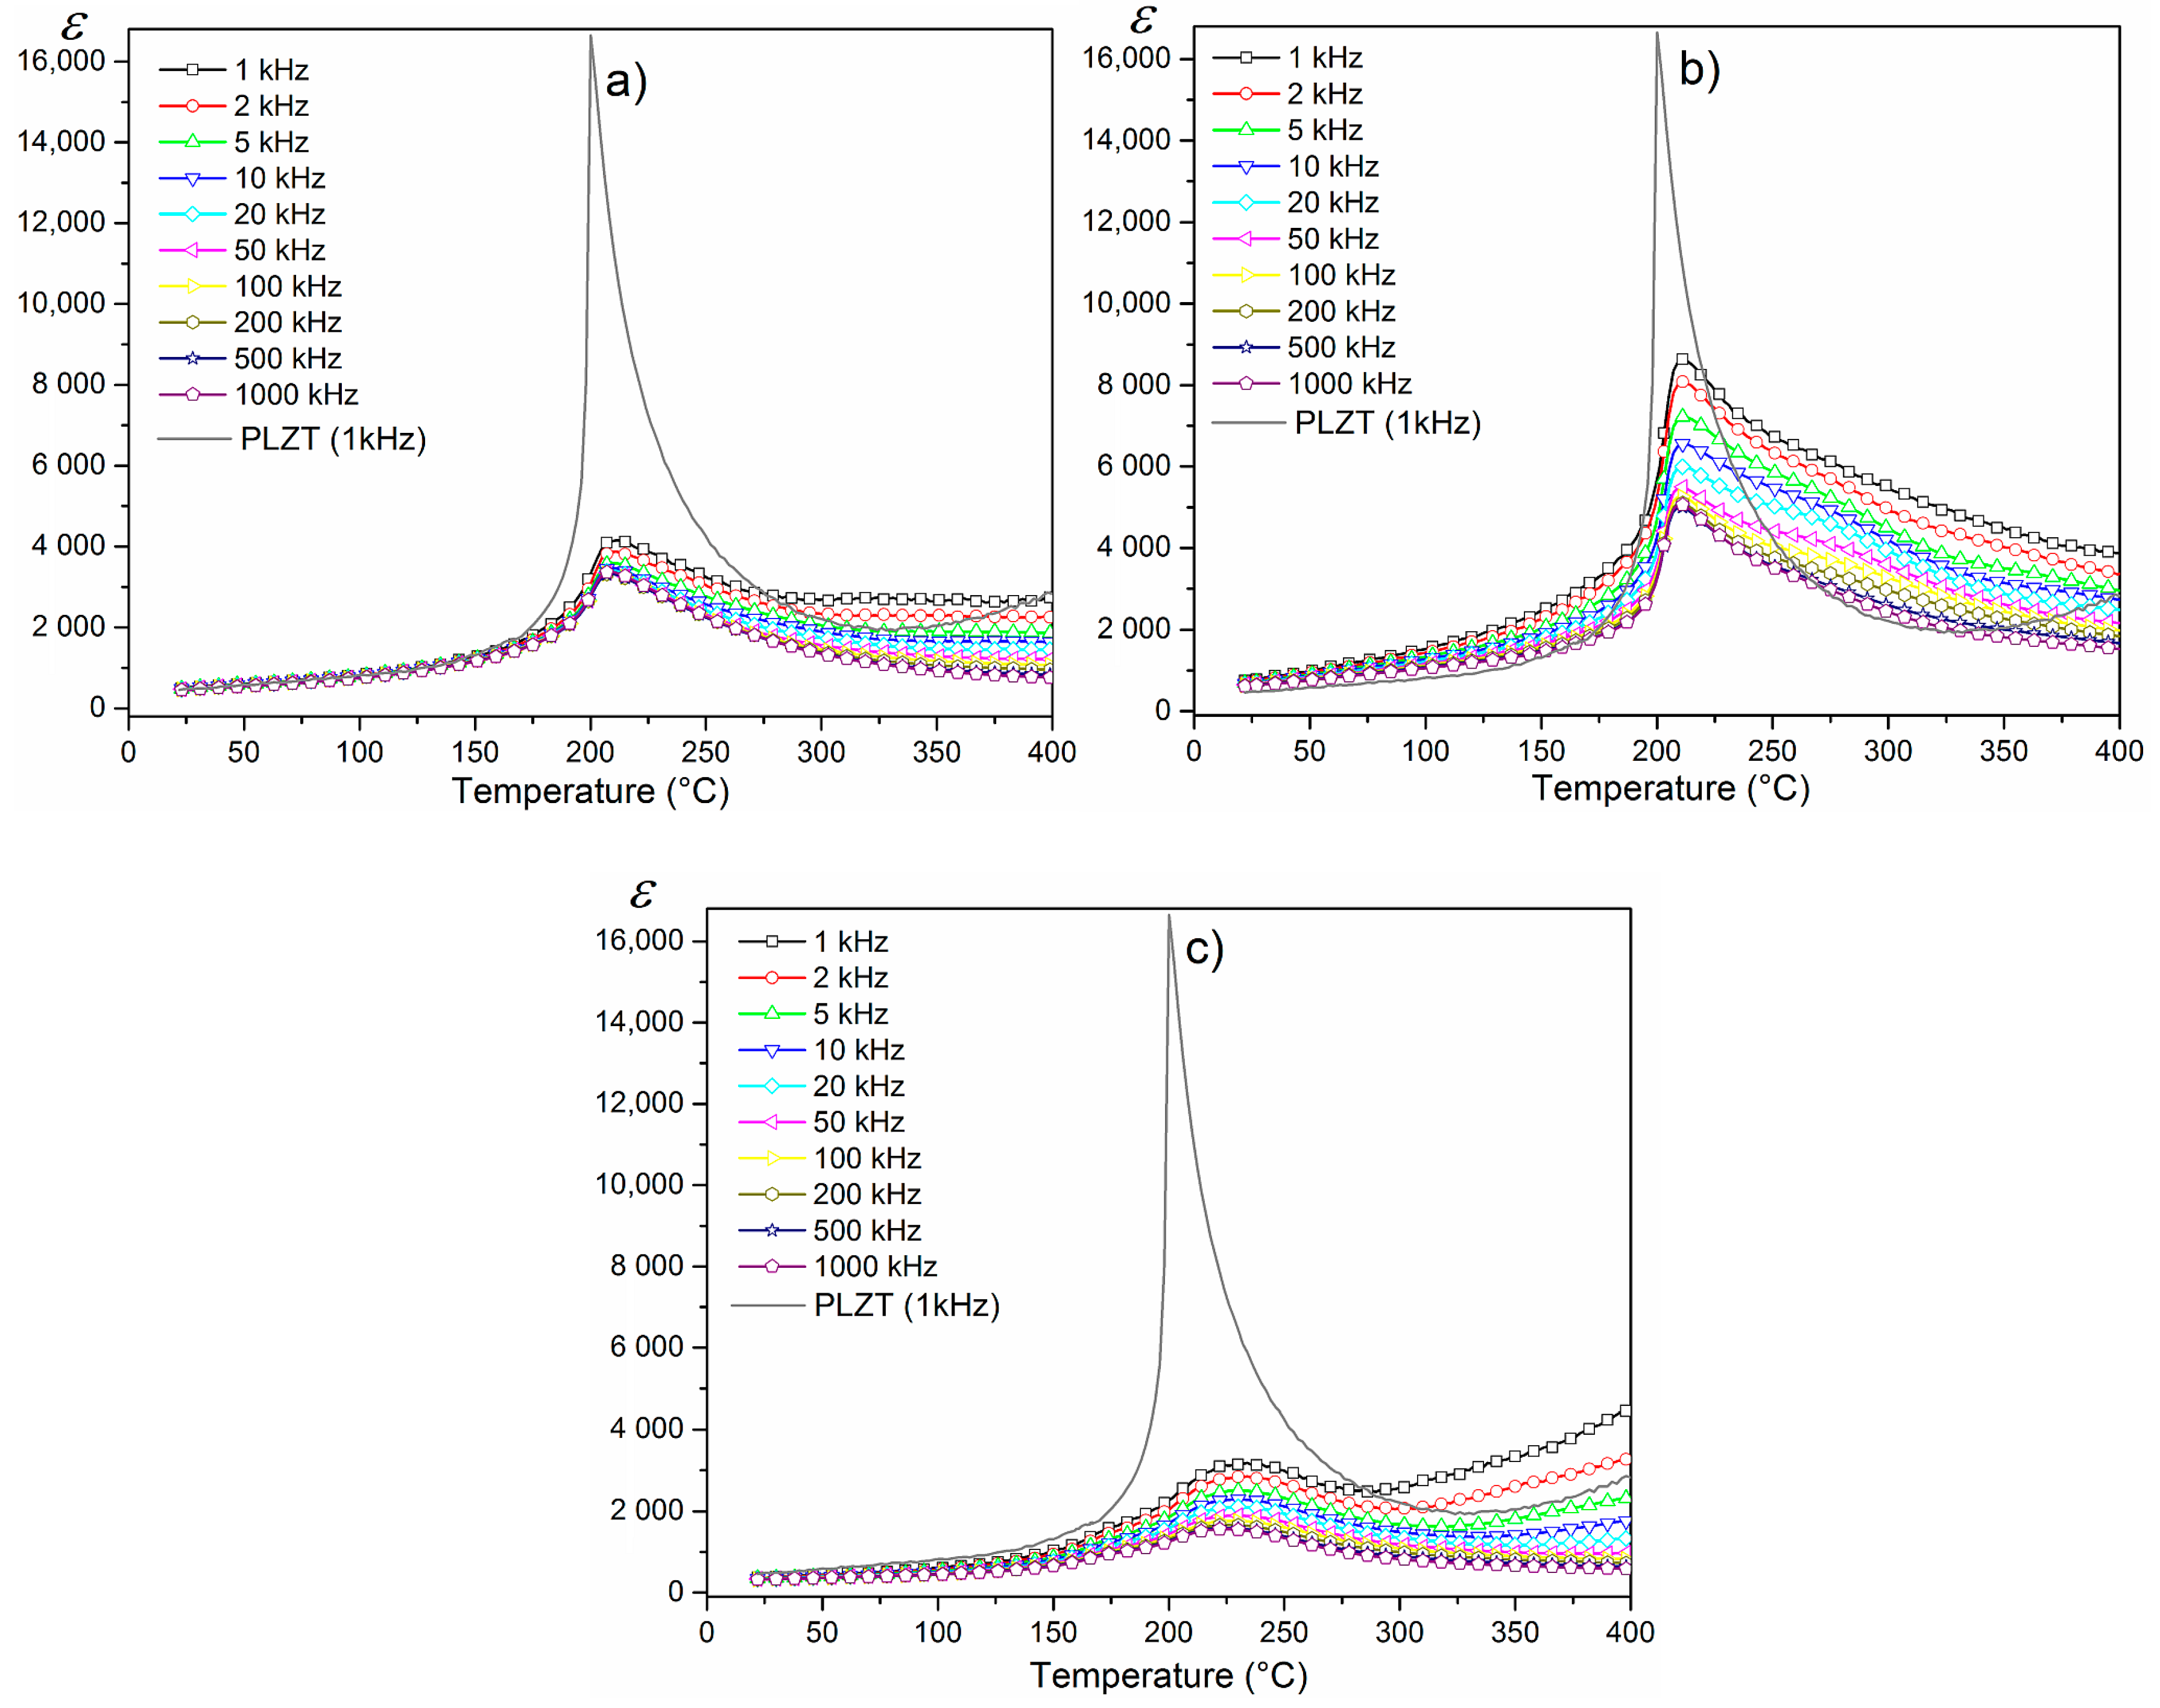
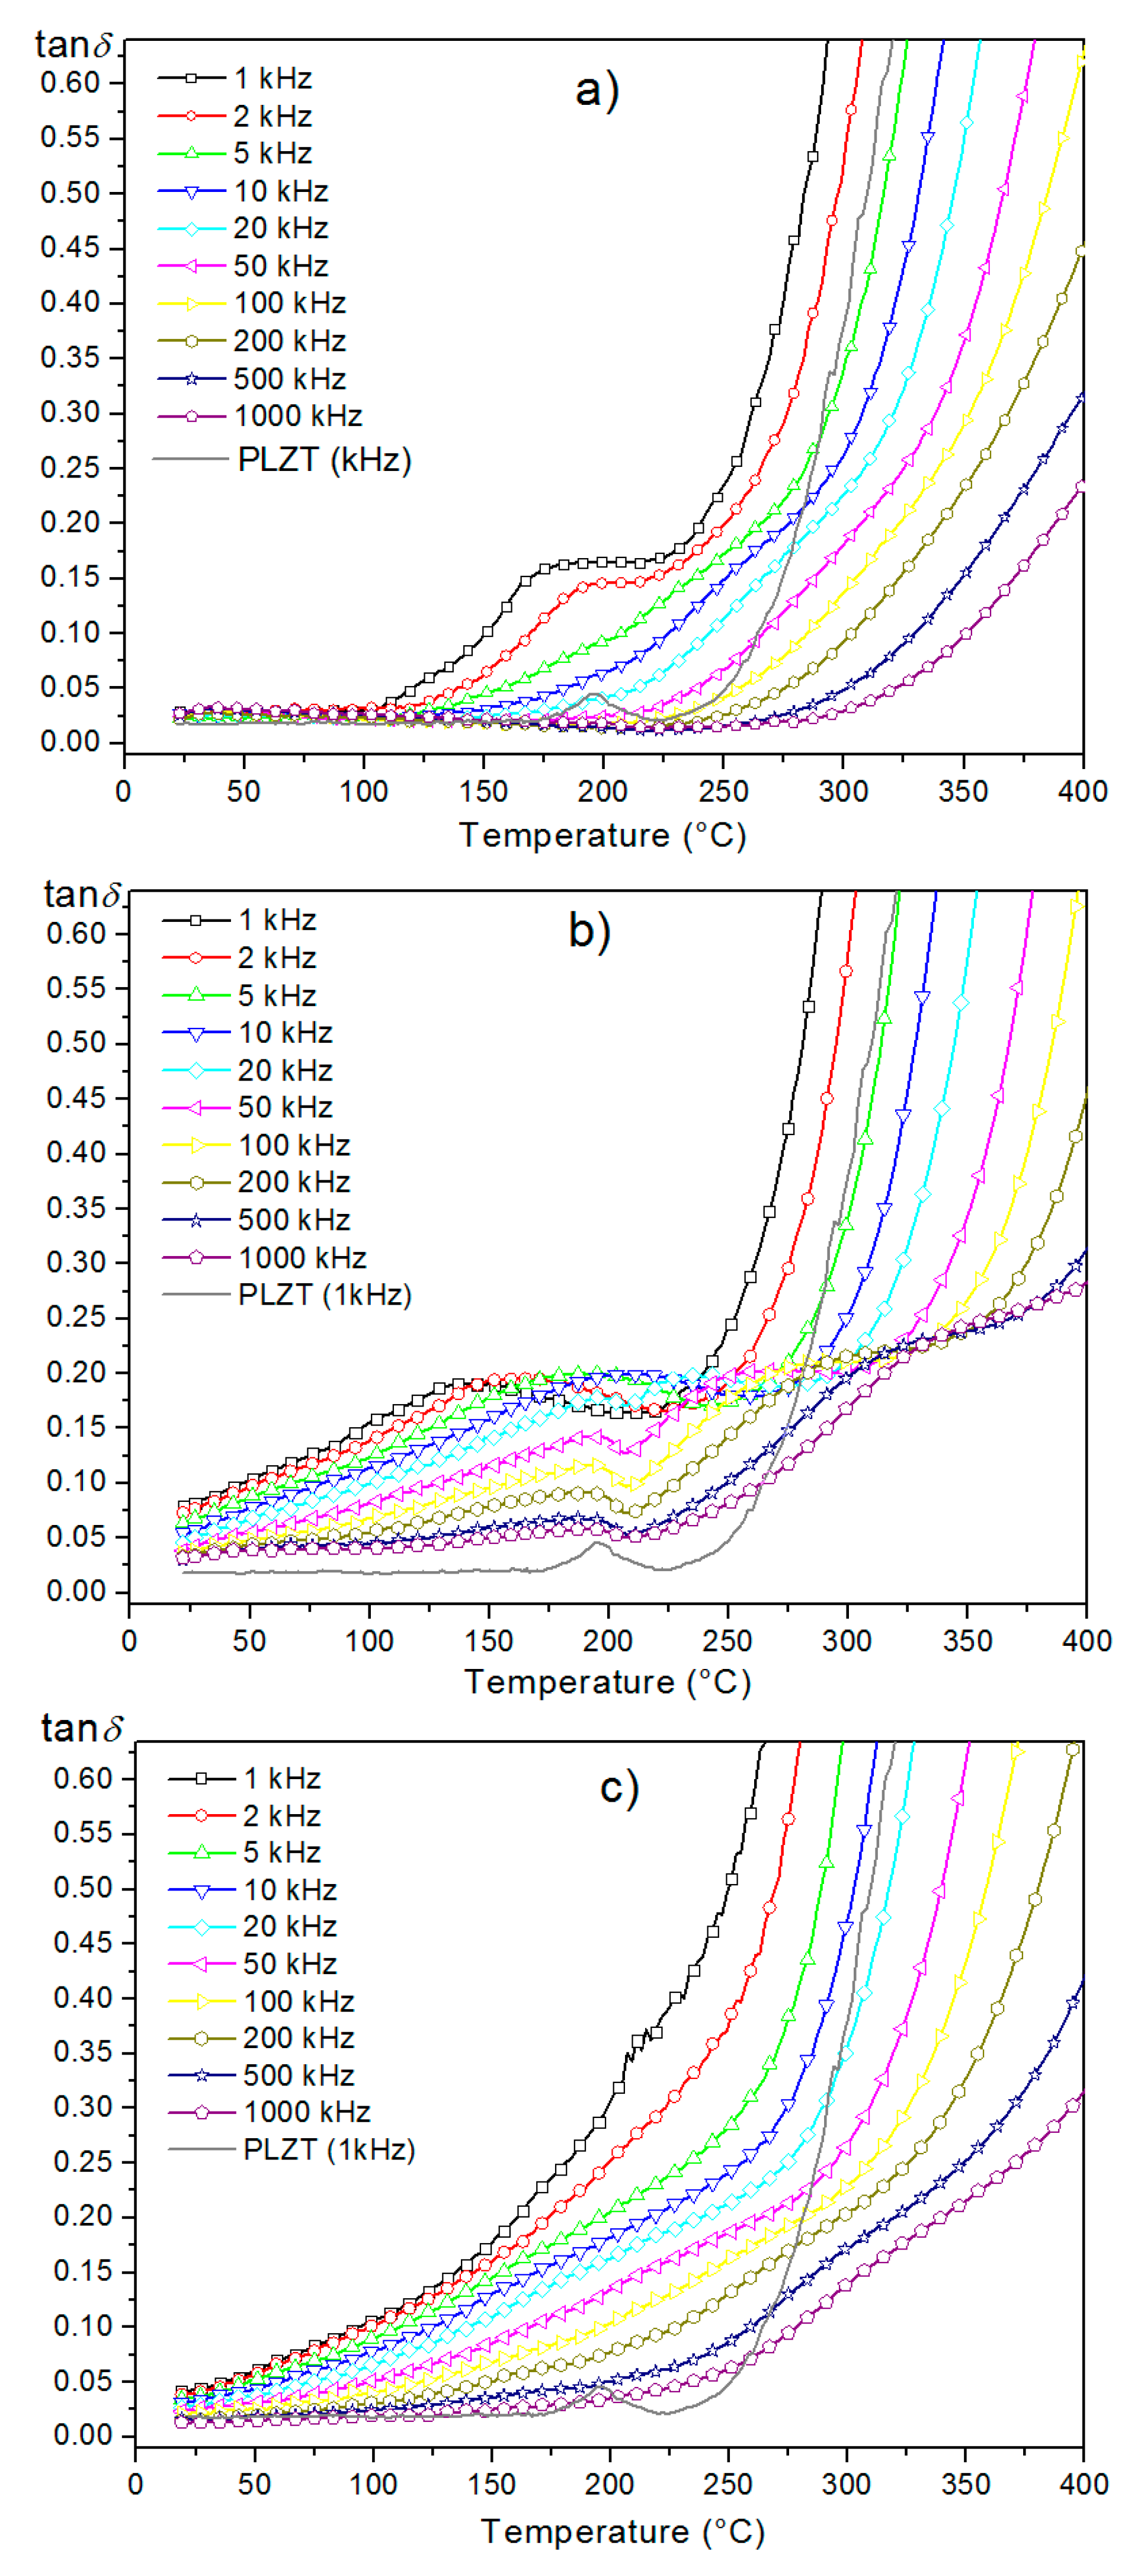
3.5. Dielectric Properties

The temperature dependences of dielectric permittivity (ε) for the P-F composites are presented in Figure 6. At room temperature, the values of dielectric permittivity are the same for the analyzed samples. The combination of the PLZT powder and the ferrite powder to the composite form significantly reduces the maximum of dielectric permittivity at the Curie temperature (the solid line for 1 kHz in Figure 6) and shifts the phase transition slightly towards the higher temperatures. A sharp phase transition from the ferroelectric to the paraelectric phase occurs in the PLZT, while in the P-F composite samples the phase transition is characterized by the broader peaks. One of the reasons for the broad temperature range of the phase transition may be related to the disorder in the distribution of B-side ions in the perovskite unit cell. This leads to random local Curie temperatures in different regions of the composite material.
However, the obtained composite does not lose good dielectric properties. Comparing the composite samples which were sintered at the different temperatures, it can be concluded that the highest values of dielectric permittivity are shown in the P-F2 sample. On the basis of this fact, it could be presumed that the optimal temperature in the technological process of the P-F composite is 1250 °C. Both the lower and the higher sintering temperatures extend the blur phase transition and decrease the values of dielectric permittivity.
The temperature dependencies of the dielectric loss tangent (tanδ) for the P-F ceramic composites are presented in Figure 7. The PLZT ceramics have very low values of dielectric loss (solid line for 1 kHz in Figure 7). At room temperature, the values of the dielectric loss for the P-F composite samples are low, as well.
The combination of the PLZT powder and the ferrite powder to the composite form contributes to increased dielectric loss, which can be clearly observed on the temperature waveforms. Additionally, the rise of the sintering temperature of composites causes an increase of the values of dielectric loss over the entire measurement area.

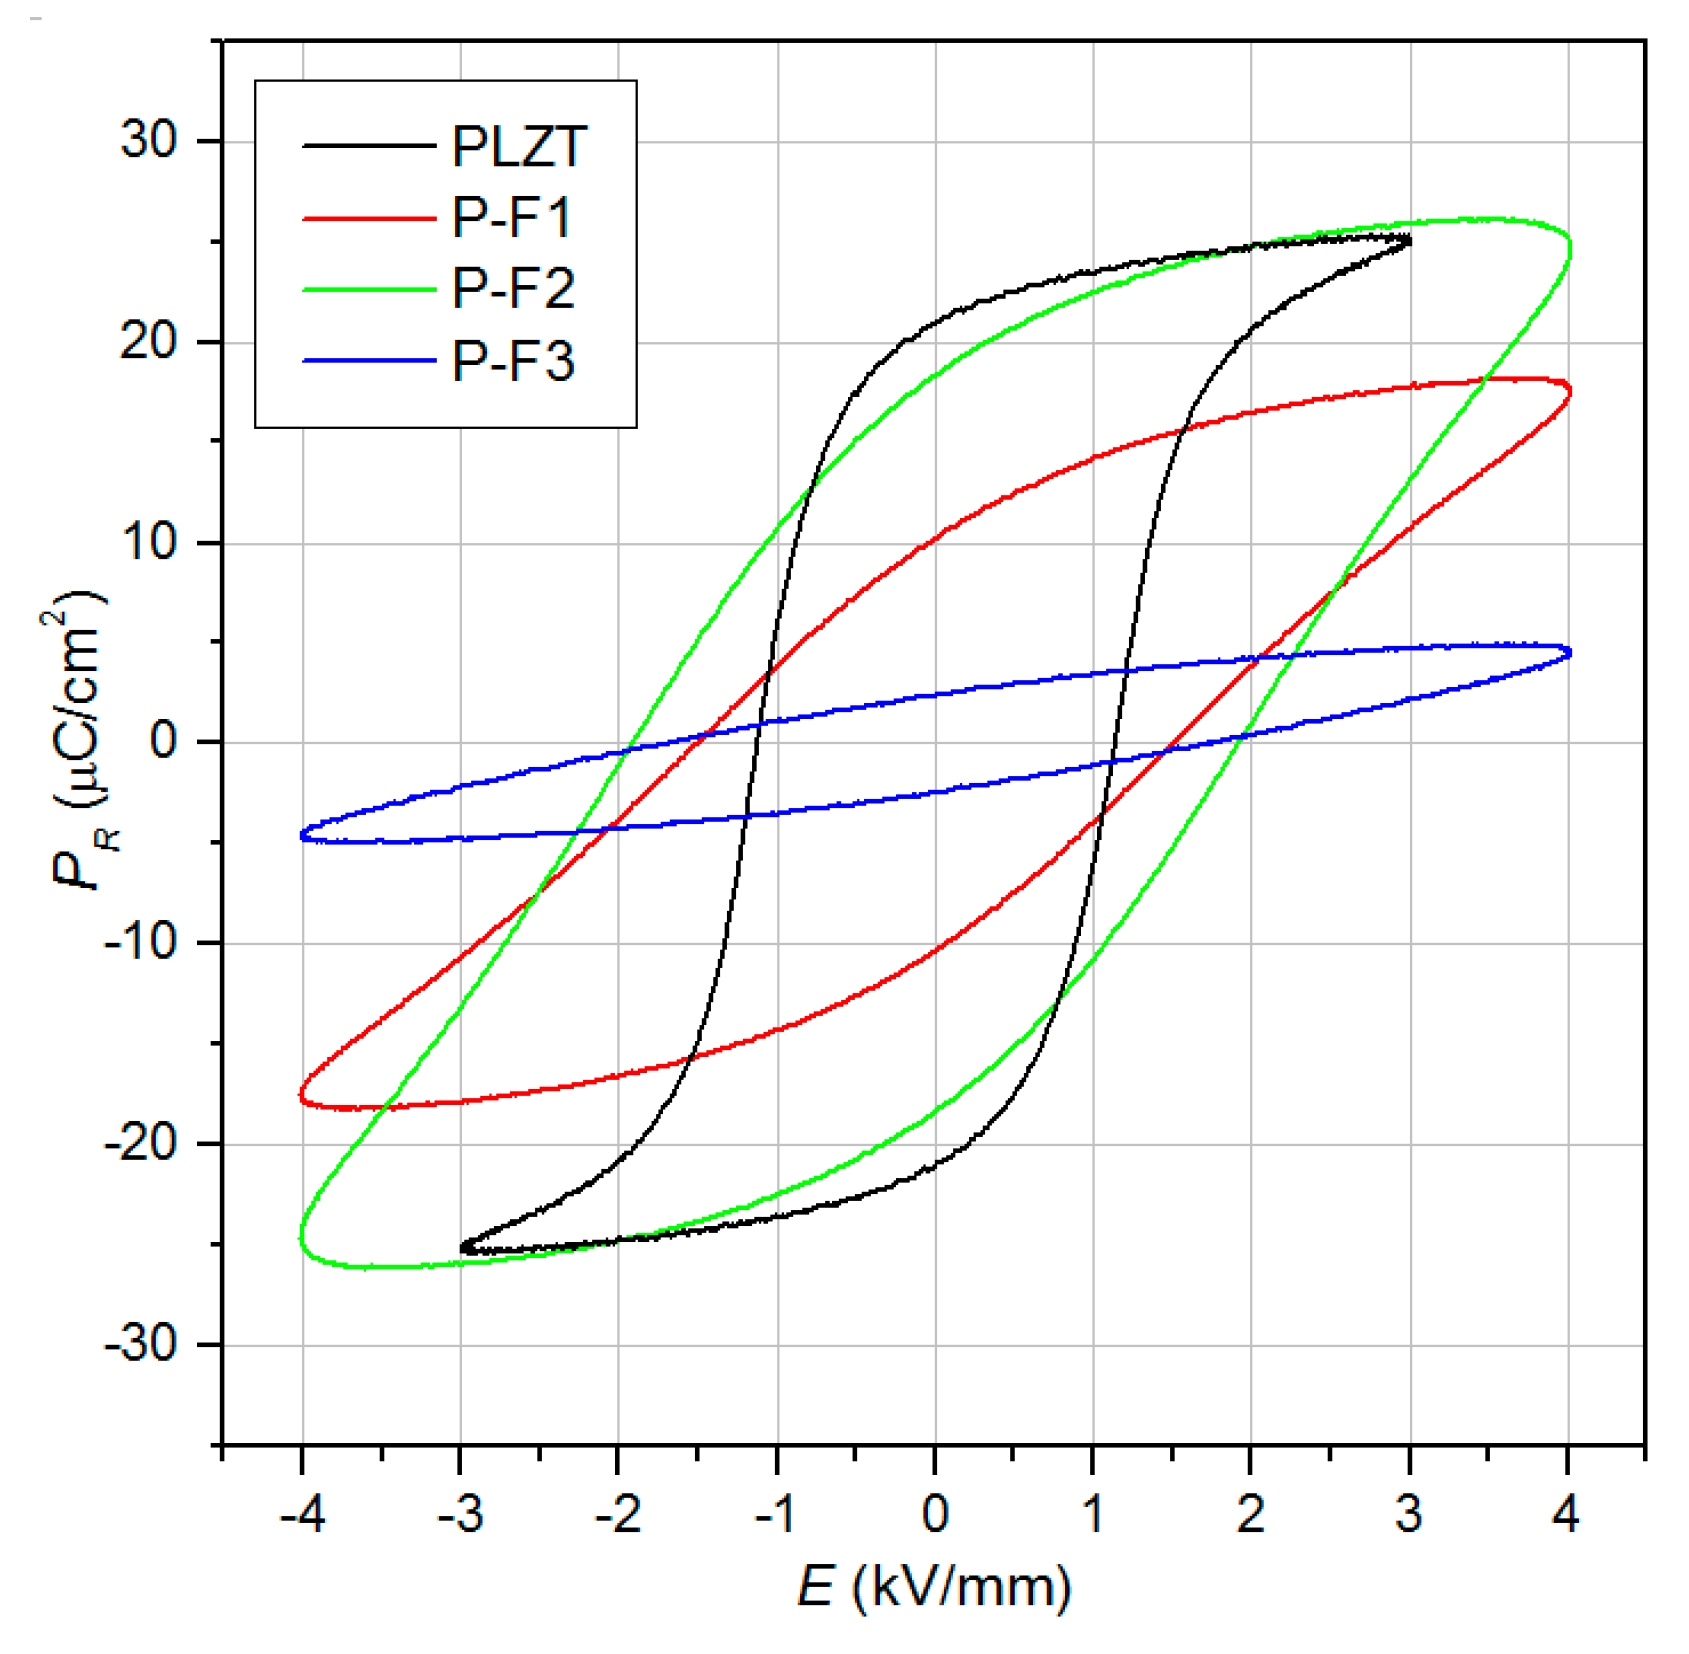
3.6. Ferroelectric Properties

The electric hysteresis loops tested at room temperature (at ν = 1 Hz frequency) of the PLZT ceramics and the P-F composite samples are presented in Figure 8. The PLZT ceramics have good saturated hysteresis loops (characteristic for ferroelectric materials) with a coercive field EC = 1.40 kV/mm (the value of spontaneous polarization Ps is 23.10 μC/cm2 and the value of the remnant polarization is Pr = 21.10 μC/cm2). In the case of the P-F composite samples, the coercive field increases and the loop loses its saturation, even with higher applied electrical fields (Table 2). In the case of the P-F3 sample, these changes are extremely large. The P-E tests of the PF composite samples show that the FE behavior decreases with increasing sintering temperature.

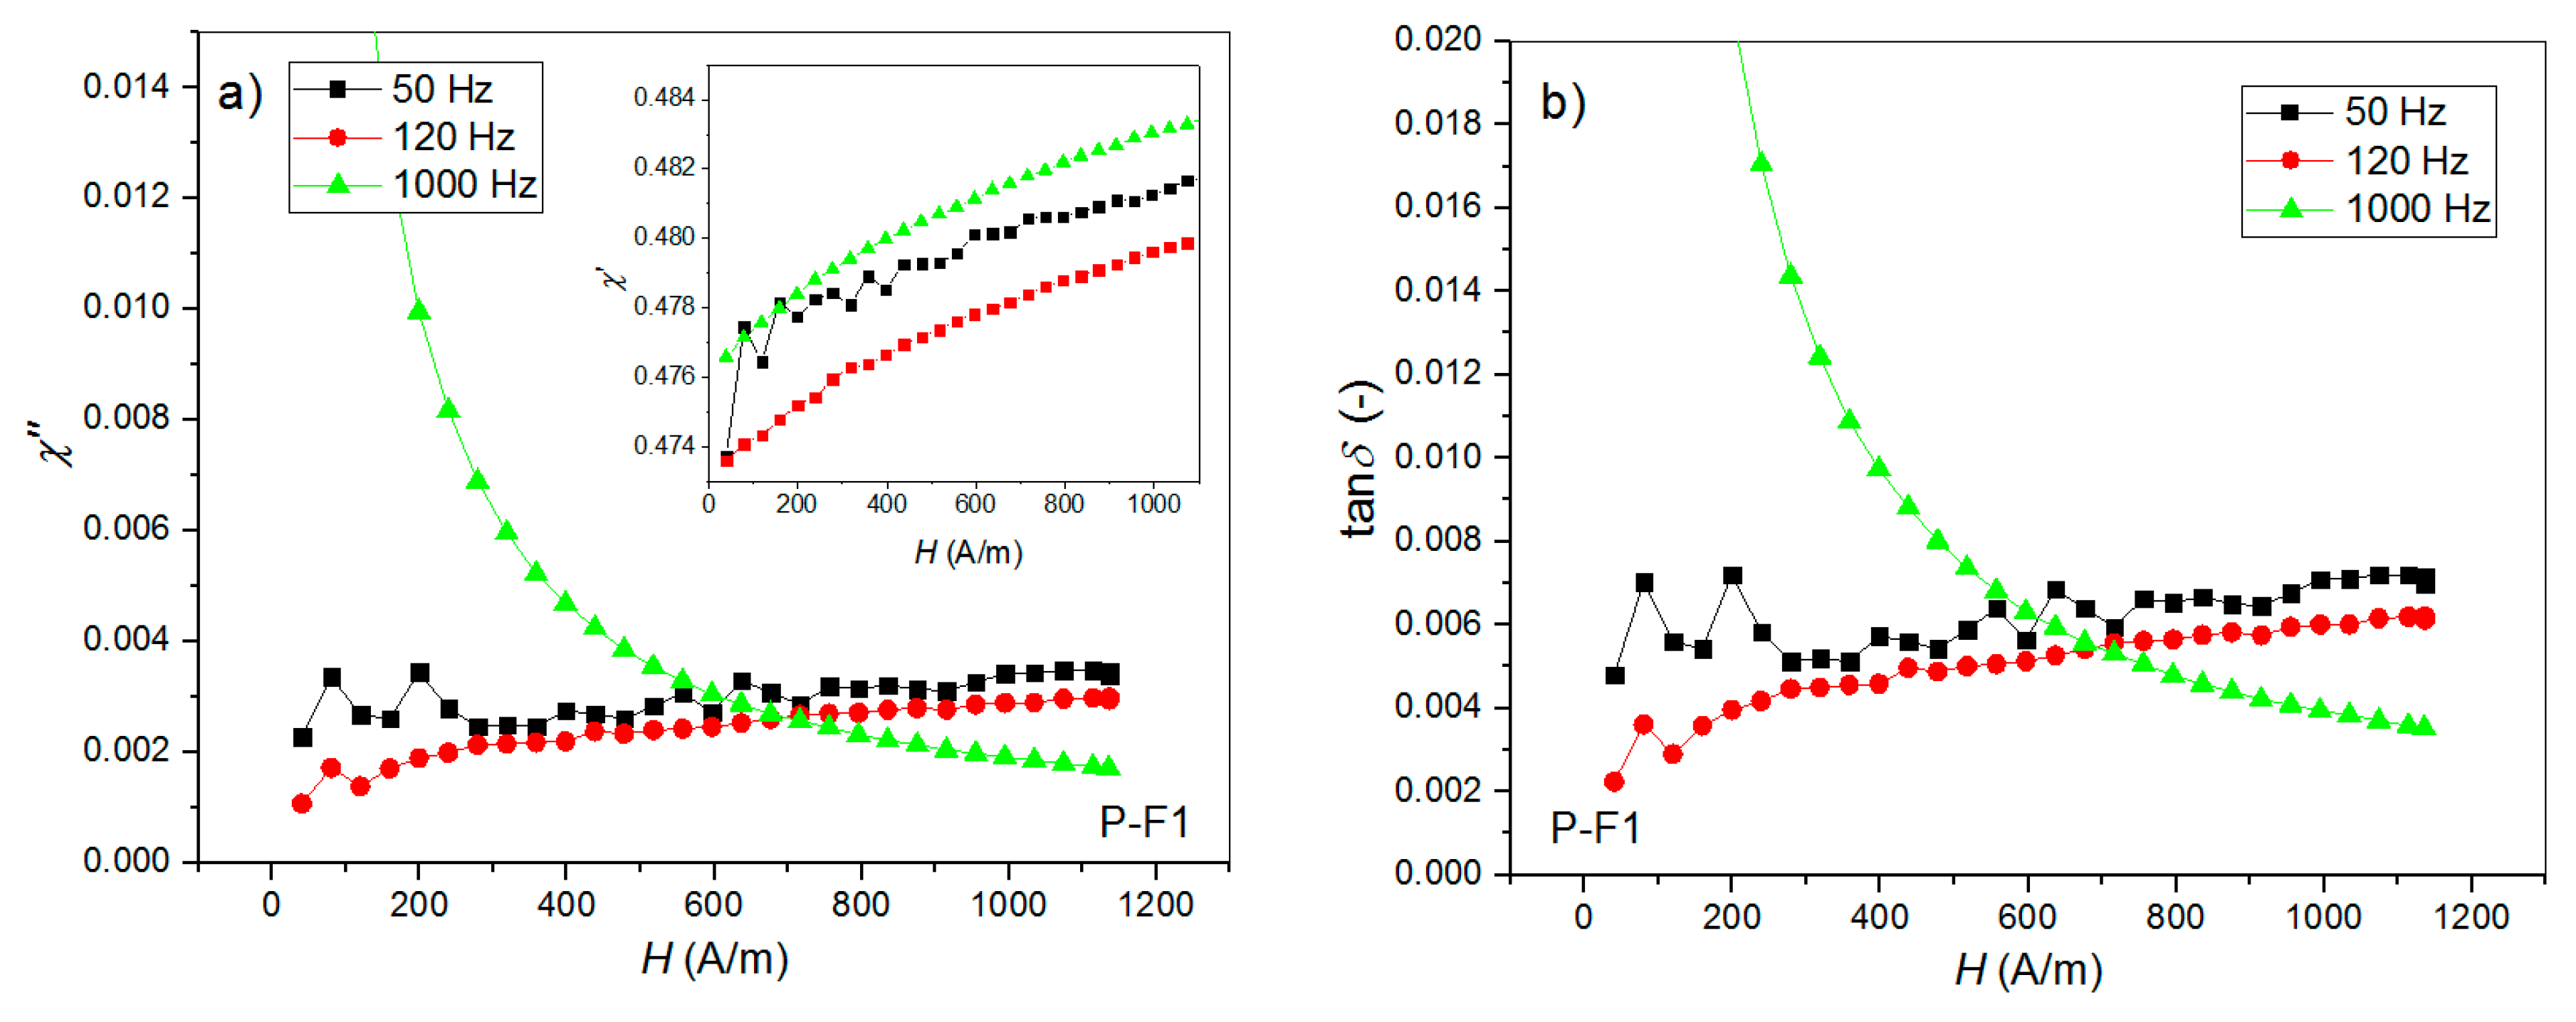
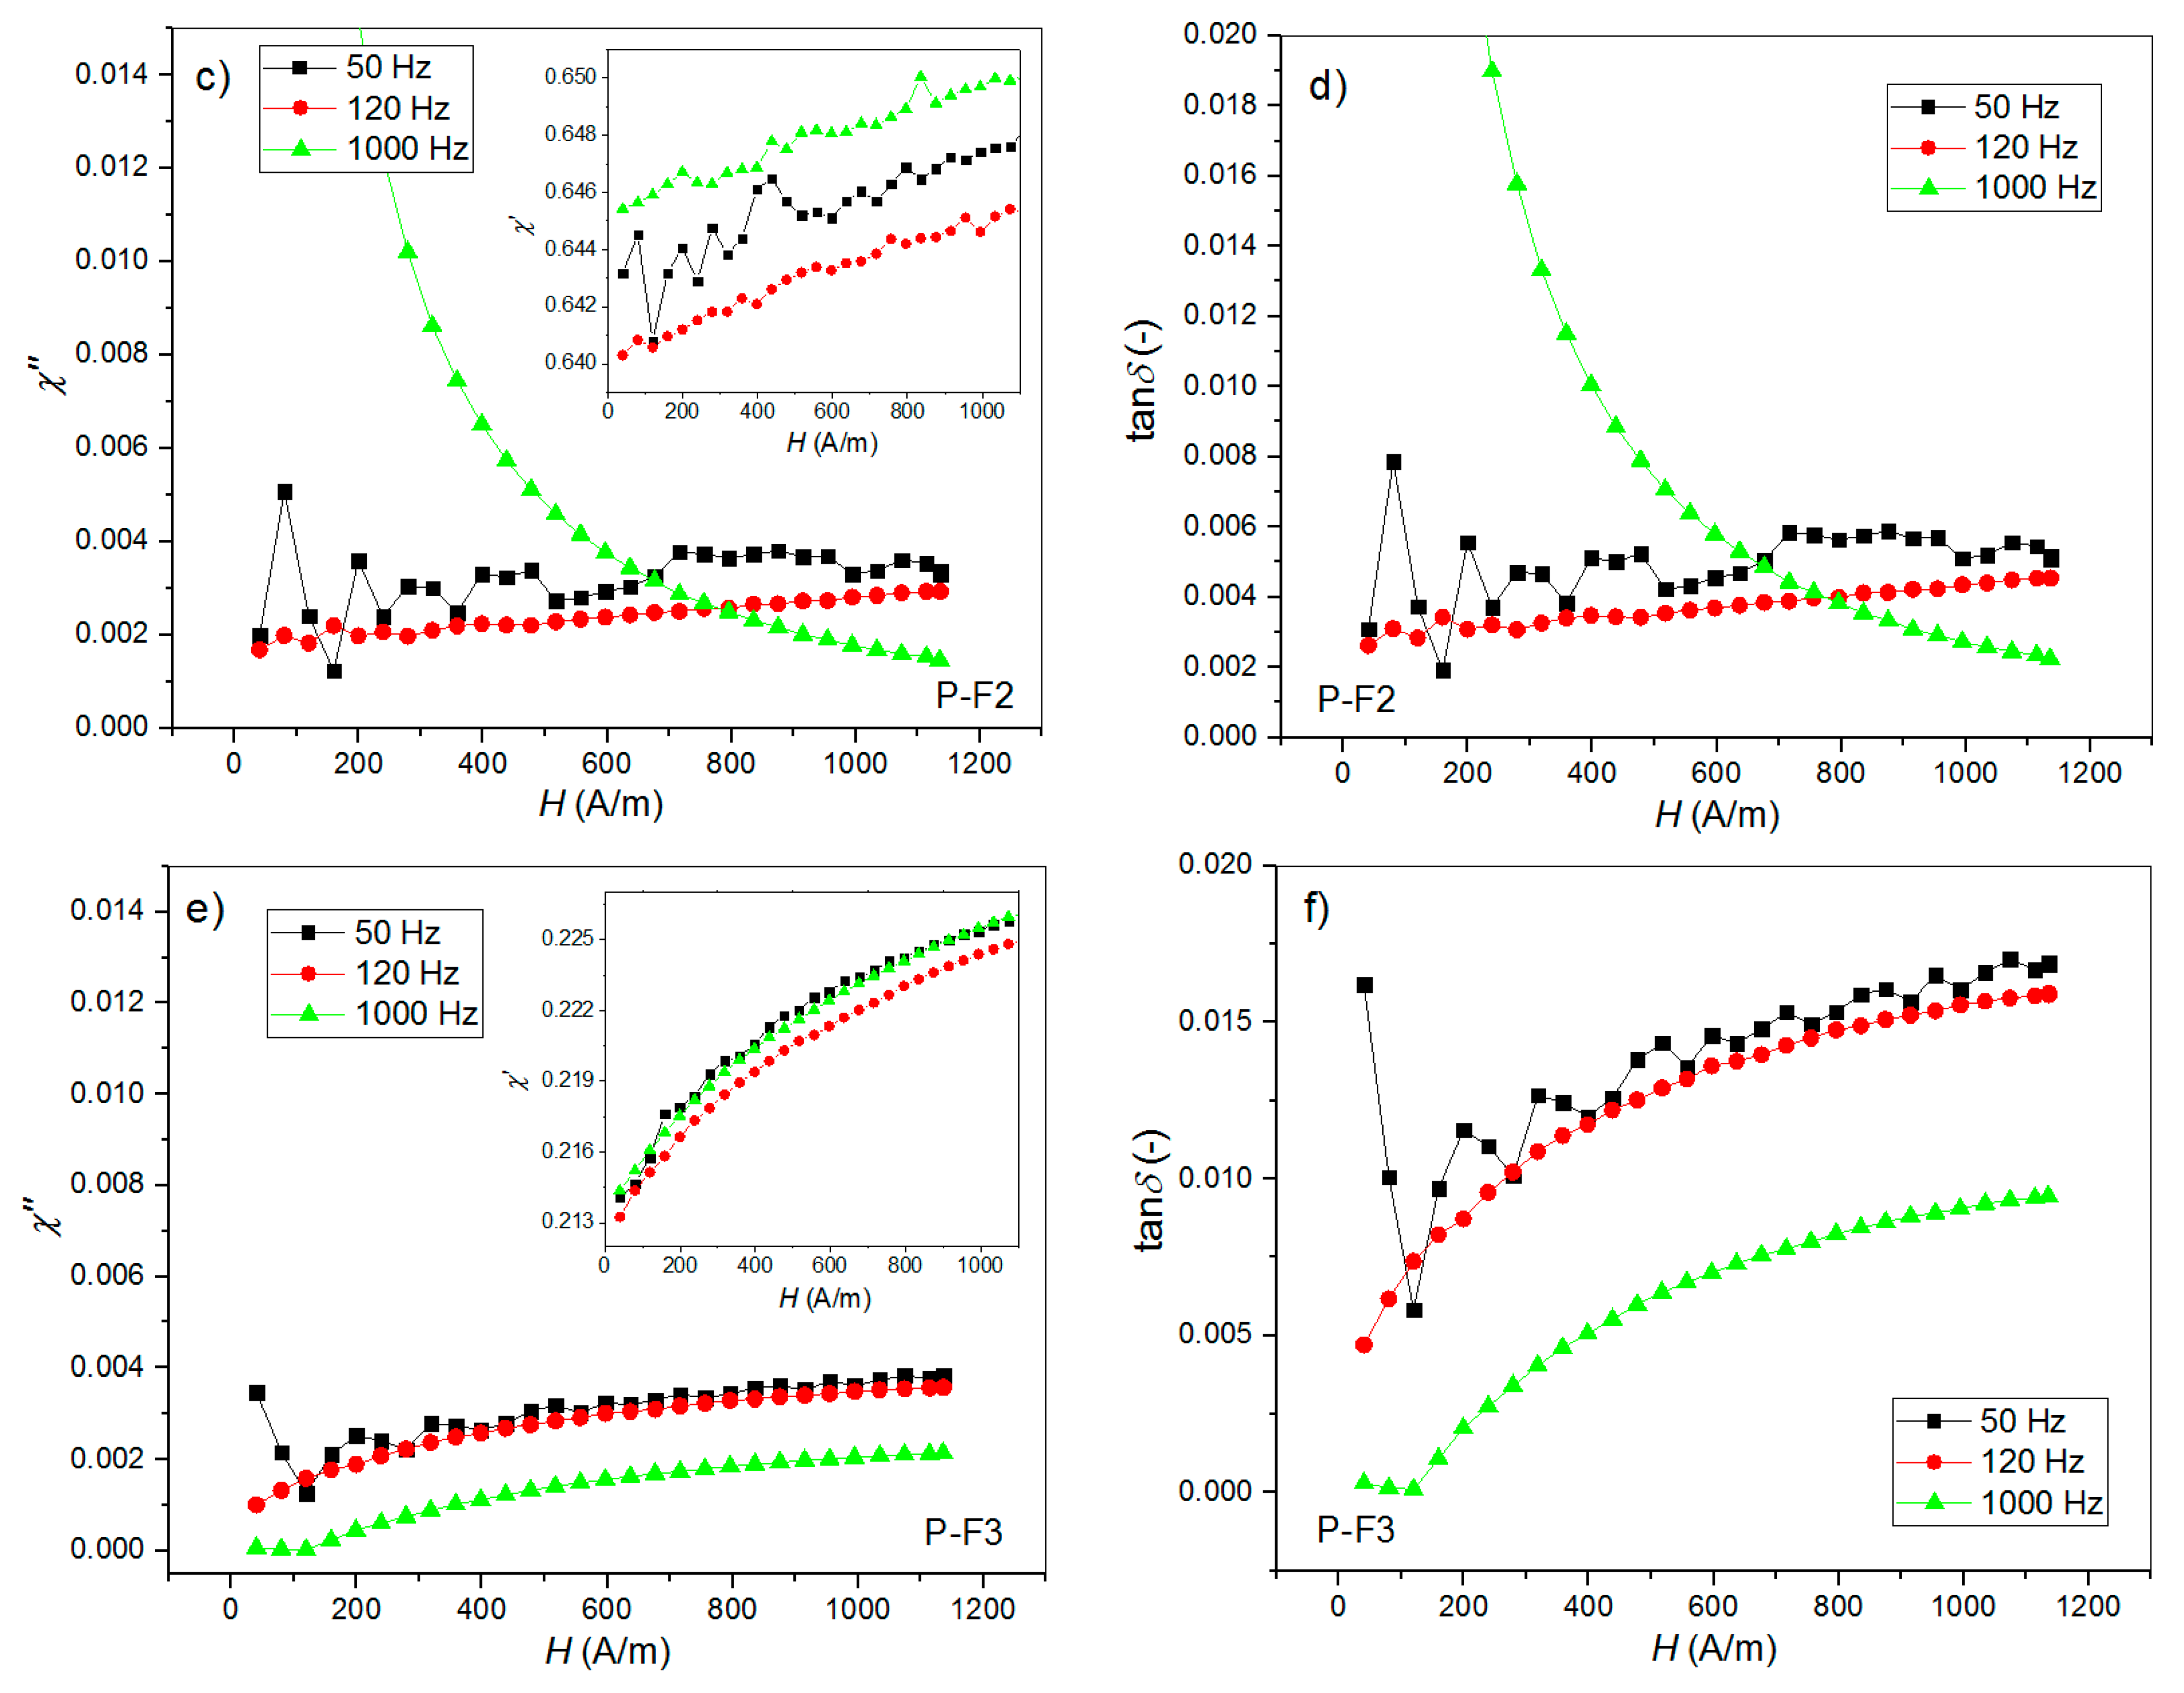
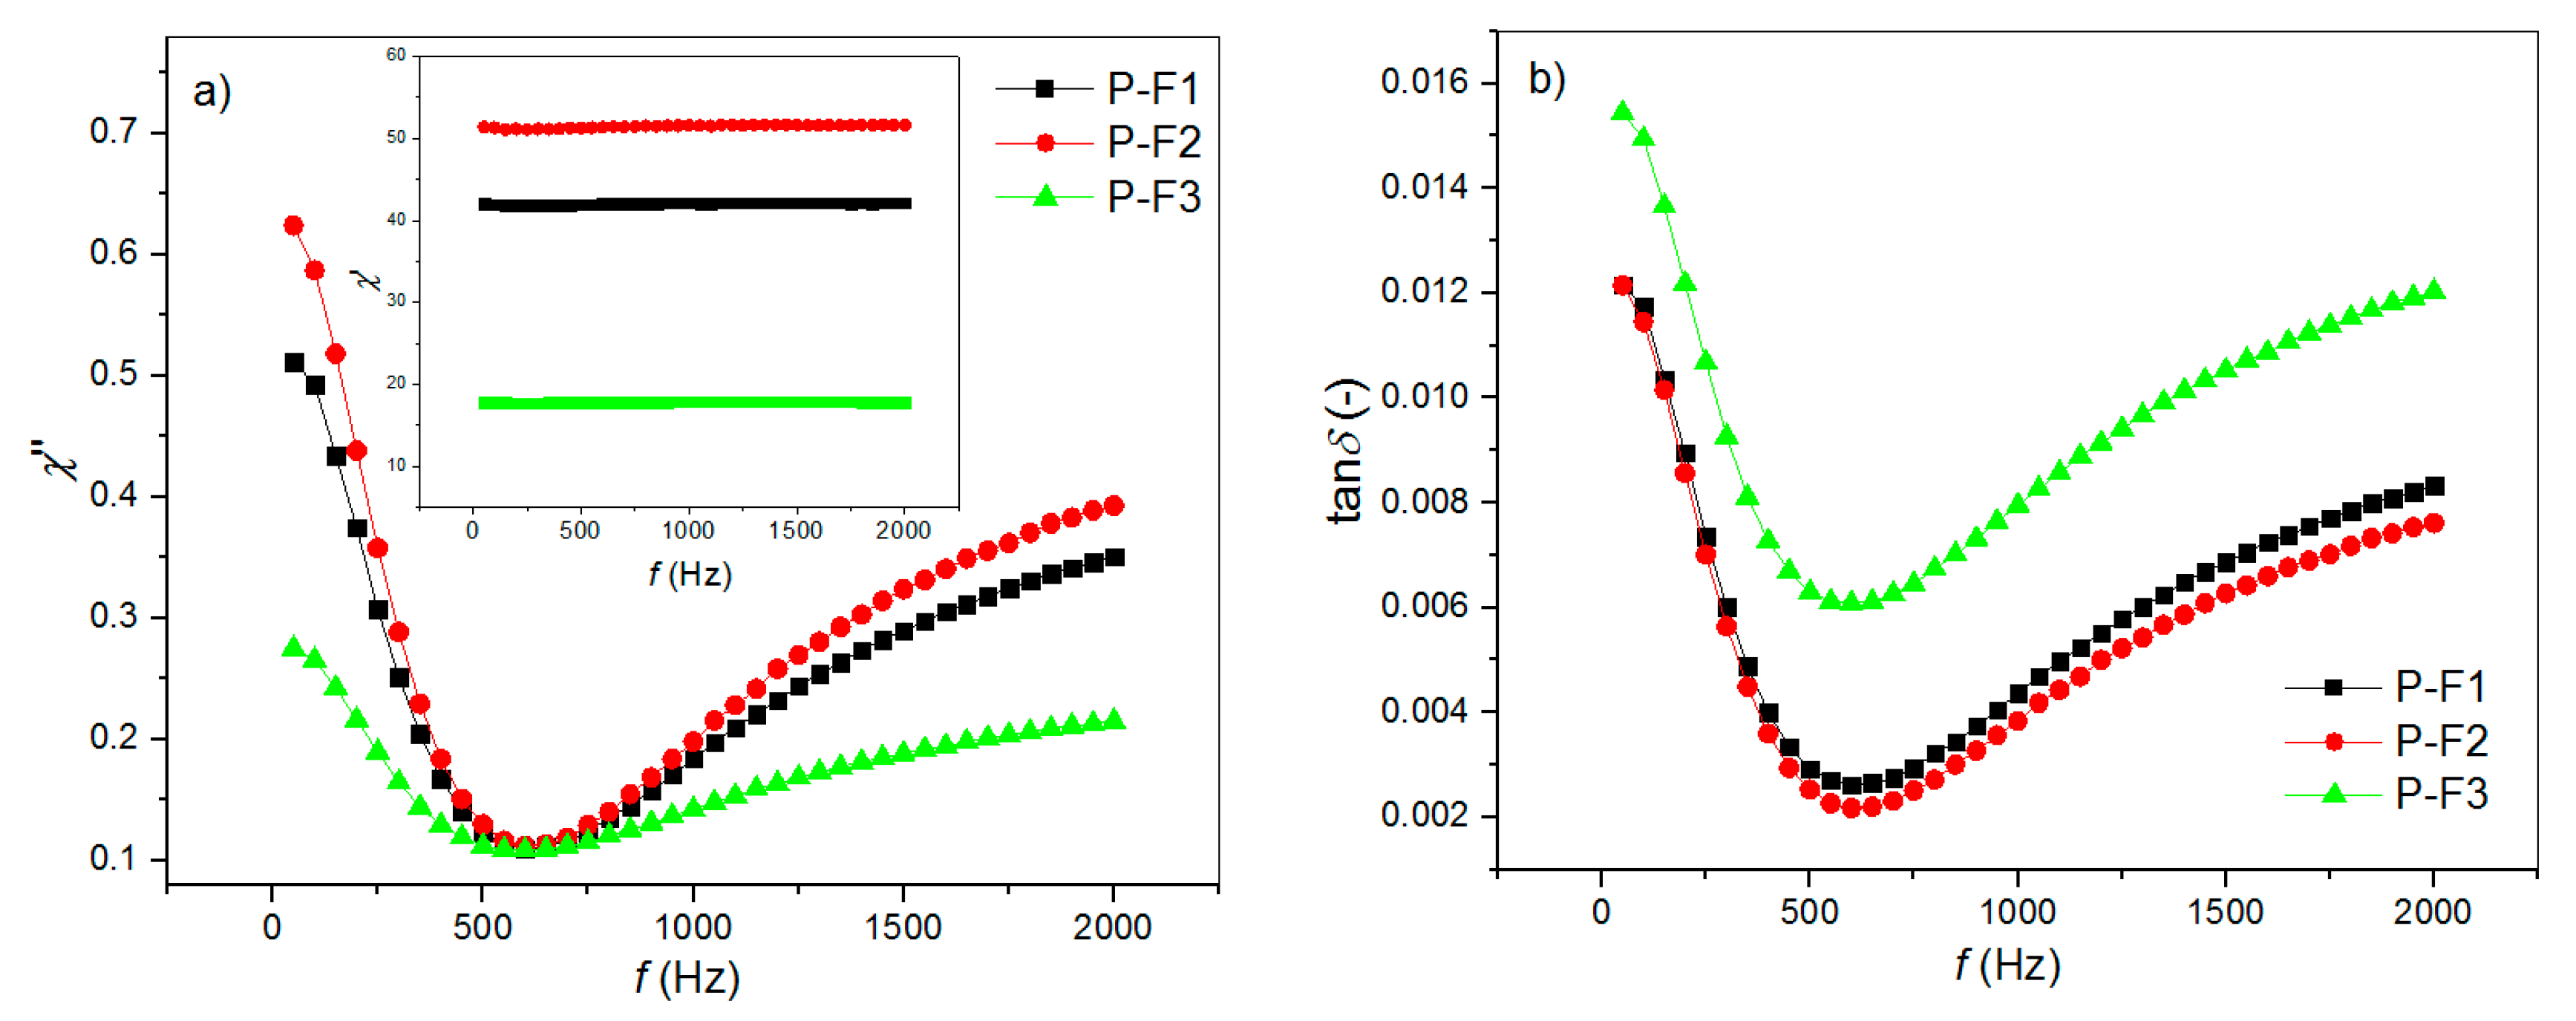
3.7. Magnetic Properties

The AC magnetic measurements were carried out at room temperature. These investigations allowed the determination of the real and imaginary parts of susceptibility, as well as magnetic loss, for several fields and frequencies (0.5–15 Oe, i.e., 40–1200 A/m, 50 Hz, 120 Hz, and 1000 Hz) for the investigated P-F ceramic composites.
The dependence of the real and the imaginary parts of the susceptibility (a, c, e), as well as the magnetic loss tangent (b, d, f) versus the intensity of the magnetic field (at frequencies of 50, 120, and 1000 Hz) obtained for P-F composites, are presented on Figure 9. In the case of P-F1 and P-F2 samples, a similar dependence was observed. On the contrary, for the PF-3 sample, the magnetic loss at low frequencies was much higher.
Figure 10 shows the real and the imaginary part of the magnetic susceptibility, as well as the magnetic loss tangent versus the frequency of the magnetic field (10 Oe = 800 A/m), for the investigated samples measured at room temperature. The decrease of magnetic loss up to 500 Hz for all composite samples was determined. For higher frequencies, the increase of the magnetic loss was observed.
The changes of magnetic loss of the P-F composite samples are probably caused by the relaxation processes in the material. The highest magnetic loss occurred for the P-F3 composite sample, while for the P-F1 one, the magnetic loss was the lowest.

4. Conclusions

The paper presents the technological process of the ferroelectromagnetic composite (P-F) based on ferroelectric Pb0.98La0.02(Zr0.90Ti0.10)0.995O3 material (PLZT) and the magnetic ferrite material (with the chemical formula of Ni0.64Zn0.36Fe2O4), with a PLZT/ferrite proportion equal to 90/10. The SEM microstructure analysis of the P-F composite showed that fine grains of the PLZT component surrounded larger ferrite grains. The ferrite grains had the shape of a pyramid. The increase of the sintering temperature causes the increase in the average grain size of the P-F composite.
At room temperature, the P-F ceramic composites show both ferroelectric and ferromagnetic properties. The frequency changes of the magnetic loss of the P-F composite samples are probably caused by relaxation processes in the material. The combination of the PLZT powder and the ferrite powder which form the composite of P-F significantly reduces the maximum dielectric permittivity at the Curie temperature, but the obtained P-F composite does not lose good dielectric properties, and exhibits overall good multiferroic properties. Both too low and too high sintering temperatures deteriorate the dielectric properties of the P-F composite samples. A high sintering temperature (1300 °C) also causes excessive grain growth, as well as increases in the heterogeneity of the microstructure. The loss of homogeneity of the microstructure composite samples deteriorates the electrophysical properties of the P-F composites. The optimal sintering temperature is 1250 °C, for a sintering time equal to 2 h.
The obtained P-F composite sample exhibits good useful properties, giving the possibility to use these types of materials to construct magnetoelectric transducers, as well as sensors in micromechatronics devices.

Author Contributions

Dariusz Bochenek—the main author and originator of the work, he carried out research on DTA, TG, DTG of the composite powders as well as X-ray, SEM and dielectric properties of the composite samples. He performed the interpretation of these results and developed the interpretation of the most measurements at the work; Joanna Korzekwa obtained a PLZT ceramic powder (component of the ceramic composite), performed its detailed research (including XRD tests) and developed the interpretation of results; Przemysław Niemiec participated in the technology of obtaining composite samples, performed P-E tests and measurements of electrical conductivity of composite samples; Bartłomiej Durtka participated in the technology of obtaining composite samples; Zbigniew Stokłosa carried out magnetic research and developed the interpretation of results.

Conflicts of Interest

The authors declare no conflict of interest.

References

  1. Wang, K.F.; Liu, J.-M.; Ren, Z.F. Multiferroicity: The coupling between magnetic and polarization orders. Adv. Phys. 2009, 58, 321–448. [Google Scholar] [CrossRef]
  2. Schmid, H. Some symmetry aspects of ferroics and single phase multiferroics. J. Phys. Condens. Matter 2008, 20, 434201. [Google Scholar] [CrossRef]
  3. Khomskii, D. Classifying multiferroics: Mechanisms and effects. Physics 2009, 2, 20. [Google Scholar] [CrossRef]
  4. Picozzi, S.; Yamauchi, K.; Sergienko, I.A.; Sen, C.; Sanyal, B.; Dagotto, E. Microscopic mechanisms for improper ferroelectricity in multiferroic perovskites: A theoretical review. J. Phys. Condens. Matter 2008, 20, 434208. [Google Scholar] [CrossRef]
  5. Nan, C.-W.; Bichurin, M.I.; Dong, S.; Viehland, D.; Srinivasan, G. Multiferroic magnetoelectric composites: Historical perspective, status, and future directions. J. Appl. Phys. 2008, 103, 031101. [Google Scholar] [CrossRef]
  6. Bochenek, D.; Surowiak, Z.; Krok-Kowalski, J.; Poltierova-Vejpravova, J. Influence of the sintering conditions on the physical proprieties of the ceramic PFN multiferroics. J. Electroceram. 2010, 25, 122–129. [Google Scholar] [CrossRef]
  7. Bochenek, D. Magnetic and ferroelectric properties of PbFe1/2Nb1/2O3 synthesized by a solution precipitation method. J. Alloy. Compd. 2010, 504, 508–513. [Google Scholar] [CrossRef]
  8. Bochenek, D.; Niemiec, P.; Chrobak, A.; Ziółkowski, G.; Błachowski, A. Magnetic and electric properties of the lead free ceramic composite based on the BFN and ferrite powders. Mater. Charact. 2014, 87, 36–44. [Google Scholar] [CrossRef]
  9. Kulawik, J.; Szwagierczak, D.; Guzdek, P. Multiferroic Cobalt Ferrite–Lead Iron Tungstate Composites. Acta Phys. Pol. A 2012, 121, 122–124. [Google Scholar] [CrossRef]
  10. Bochenek, D.; Niemiec, P.; Skulski, R.; Chrobak, A.; Wawrzała, P. Ferroelectric and magnetic properties of the PMN-PT-nickel-zinc ferrite multiferroic ceramic composite materials. Mater. Chem. Phys. 2015, 157, 116–123. [Google Scholar] [CrossRef]
  11. Niemiec, P.; Bochenek, D.; Chrobak, A.; Guzdek, P.; Błachowski, A. Ferroelectric–ferromagnetic ceramic composites based on PZT with added ferrite. Int. J. Appl. Ceram. Technol. 2015, 12, E82–E89. [Google Scholar] [CrossRef]
  12. Hrib, L.M.; Caltun, O.F. Effects of the chemical composition of the magnetostrictive phase on the dielectric and magnetoelectric properties of cobalt ferrite–barium titanate composites. J. Alloys Compd. 2011, 509, 6644–6648. [Google Scholar] [CrossRef]
  13. Kulawik, J.; Szwagierczak, D.; Guzdek, P. Magnetic, magnetoelectric and dielectric behavior of CoFe2O4-Pb(Fe1/2Nb1/2)O3 particulate and layered composites. J. Magn. Magn. Mater. 2012, 324, 3052–3057. [Google Scholar] [CrossRef]
  14. Kowal, K.; Guzdek, P.; Kowalczyk, M.; Jartych, E. Compositional dependence of hyperfine interactions and magnetoelectric coupling in (BiFeO3)x-(BaTiO3)1−x solid solutions. Nukleonika 2017, 62, 117–122. [Google Scholar] [CrossRef]
  15. Scott, J.F. Applications of magnetoelectrics. J. Mater. Chem. 2012, 22, 4567–4574. [Google Scholar] [CrossRef]
  16. Kulawik, J.; Szwgierczak, D.; Gröger, B. Investigations of properties of ceramic materials with perovskite structure in chosen electronic applications. Bull. Pol. Acad. Tech. 2007, 55, 293–297. [Google Scholar]
  17. Srinivas, S.; Li, J.Y. The effective magnetoelectric coefficients of polycrystalline multiferroic composites. Acta Mater. 2005, 53, 4135–4142. [Google Scholar] [CrossRef]
  18. Bartkowska, J.A.; Zachariasz, R.; Bochenek, D.; Ilczuk, J. The determination of the magnetoelectric coupling coefficient in ferroelectric-ferromagnetic composite base on PZT-ferrite. Arch. Metall. Mater. 2013, 58, 1401–1403. [Google Scholar] [CrossRef]
  19. Xu, Y. Ferroelectric Materials and Their Applications; Elsevier: North Holland, NY, USA, 1991. [Google Scholar]
  20. Bartkowska, J.A.; Ilczuk, J. The internal friction and the relaxation time spectrum of ferroelectric ceramic PZT type. Acta Phys. Pol. A 2008, 114, A7–A13. [Google Scholar] [CrossRef]
  21. Kozielski, L.; Adamczyk, M.; Erhart, J.; Pawełczyk, M. Application testing of Sr doping effect of PZT ceramics on the piezoelectric transformer gain and efficiency proposed for MEMS actuators driving. J. Electroceram. 2012, 29, 133–138. [Google Scholar] [CrossRef]
  22. Xiang, P.-H.; Dong, X.-L.; Chen, H.; Zhang, Z.; Guo, J.-K. Mechanical and electrical properties of small amount of oxides reinforced PZT ceramics. Ceram. Int. 2003, 29, 499–503. [Google Scholar] [CrossRef]
  23. Cho, K.H.; Seo, C.E.; Choi, Y.S.; Ko, Y.H.; Kim, K.J. Effect of pressure on electric generation of PZT(30/70) and PZT(52/48) ceramics near phase transition pressure. J. Eur. Ceram. Soc. 2012, 32, 457–463. [Google Scholar] [CrossRef]
  24. Sitko, R.; Zawisza, B.; Jurczyk, J.; Bochenek, D.; Płońska, M. Multielement XRF Semimicroanalysis of Pb(Zr,Ti)O3 Type Ferroelectric Ceramic Materials Doped with Pb(Nb,Mn)O3 and Bi2O3 by the Thin Layer Metod. Microchim. Acta 2004, 144, 9–15. [Google Scholar]
  25. Płońska, M.; Pisarski, W.A.; Wodecka-Duś, B.; Czekaj, D. The influence of fabrication conditions on the physical properties of PLZT:Nd3+ ceramics. Arch. Metall. Mater. 2013, 58, 1365–1369. [Google Scholar] [CrossRef]
  26. Wawrzała, P.; Korzekwa, J. Charge-discharge properties of PLZT x/90/10 ceramics. Ferroelectrics 2013, 446, 91–101. [Google Scholar] [CrossRef]
  27. Płońska, M.; Pisarska, J.; Pisarski, W.A. Pr3+/Yb3+:PLZT ferroelectric ceramics for near-infrared radiation at 1340 nm. J. Am. Ceram. Soc. 2017, 100, 1295–1299. [Google Scholar] [CrossRef]
  28. Płońska, M.; Adamczyk, M. Dielectric properties of neodymium-modified PLZT ceramics. Phase Transit. 2015, 88, 786–798. [Google Scholar] [CrossRef]
  29. Korzekwa, J.; Wawrzala, P.; Skulski, R. Electromechanical properties of PLZT x/90/10. Eur. Phys. J. Spec. Top. 2008, 154, 127–130. [Google Scholar] [CrossRef]
  30. Zhang, H.; Mak, C.-L. Impedance spectroscopic characterization of fine-grained magnetoelectric Pb(Zr0.53Ti0.47)O3–(Ni0.5Zn0.5)Fe2O4 ceramic composites. J. Alloy. Compd. 2012, 513, 165–171. [Google Scholar] [CrossRef]
  31. Bichurin, M.I.; Petrov, V.M. Modeling of magnetoelectric interaction in magnetostrictive-piezoelectric composites. Adv. Condens. Matter Phys. 2012, 1–12. [Google Scholar] [CrossRef]
  32. Ryu, J.; Priya, S.; Uchino, K.; Kim, H.-E. Magnetoelectric effect in composites of magnetostrictive and piezoelectric materials. J. Electroceram. 2002, 8, 107–119. [Google Scholar] [CrossRef]
  33. Roy, A.; Gupta, R.; Garg, A. Multiferroic memories. Adv. Condens. Matter Phys. 2012, 1–12. [Google Scholar] [CrossRef]
  34. Bartkowska, J. The magnetoelectric coupling effect in multiferroic composites based on PZT-ferrite. J. Magn. Magn. Mater. 2015, 374, 703–706. [Google Scholar] [CrossRef]
  35. Kuscer, D.; Korzekwa, J.; Kosec, M.; Skulski, R. A- and B-compensated PLZT x/90/10: Sintering and microstructural analysis. J. Eur. Ceram. Soc. 2007, 27, 4499–4507. [Google Scholar] [CrossRef]
  36. Haertling, G.H. Piezoelectric and electrooptic ceramics. In Ceramic Materials for Electronics, Processing, Properties and Applications; Buchanan, R.C., Ed.; In the Series: Electrical Engineering and Electronics; Marcel Dekker Inc.: New York, NY, USA, 1986; pp. 139–225. [Google Scholar]
  37. Ciuchi, I.V.; Craciun, F.; Mitoseriu, L.; Galassi, C. Preparation and properties of La doped PZT 90/10 ceramics across the ferroelectric-antiferroelectric phase boundary. J. Alloys Compd. 2015, 646, 16–22. [Google Scholar] [CrossRef]
  38. Buixaderas, E.; Bovtun, V.; Veljko, S.; Savinov, M.; Kužel, P.; Gregora, I.; Kamba, S.; Reaney, I. Ultrabroadband dielectric spectroscopy and phonons in Pb1−x/2LaxZr0.9Ti0.1O3. J. Appl. Phys. 2010, 108, 104101. [Google Scholar] [CrossRef]
  39. Bochenek, D.; Niemiec, P.; Adamczyk, M.; Skulski, R.; Zachariasz, R.; Wodecka-Duś, B.; Machnik, Z. The multicomponent PZT-type ceramics for micromechatronic applications. Arch. Metall. Mater. 2017, 62, 667–672. [Google Scholar] [CrossRef]
Figure 1. Graphs of PLZT powder particle size distribution the histogram and the summation curve (red line) (a) and the shrinkage–temperature curves for PLZT powder with a red reference line (b).
Symmetry 10 00059 g001
Figure 2. DTA, TG, and DTG of the P-F composite powder.
Symmetry 10 00059 g002
Figure 3. X-ray diffraction patterns of the PLZT, ferrite, and P-F composite materials.
Symmetry 10 00059 g003
Figure 4. SEM images of the PLZT ceramics (a) and the P-F composites: P-F1 (b), P-F2 (c), P-F3 (d), and BSE images of the P-F composites P-F1 (e), P-F2 (f), and P-F3 (g).
Symmetry 10 00059 g004
Figure 5. The lnσDC(1/T) relationship for the PLZT ceramics and P-F composite samples.
Symmetry 10 00059 g005
Figure 6. Temperature dependencies of the dielectric permittivity (ε) for the P-F composites: (a) P-F1, (b) P-F2, and (c) P-F3 (PLZT-solid line for 1 kHz).
Symmetry 10 00059 g006
Figure 7. Temperature dependencies of the dielectric loss tangent (tanδ) for the P-F composites: (a) P-F1, (b) P-F2, and (c) P-F3 (PLZT—solid line for 1 kHz).
Symmetry 10 00059 g007
Figure 8. Hysteresis P–E loops for PLZT ceramics and P-F composites (1 Hz, room temperature).
Symmetry 10 00059 g008
Figure 9. The dependence of the real and the imaginary part of the susceptibility (a,c,e), and the magnetic loss tangent (b,d,f) versus the intensity of the magnetic field for P-F composites, obtained at room temperature.
Symmetry 10 00059 g009aSymmetry 10 00059 g009b
Figure 10. The dependence of the real (inserted) and the imaginary (a) part of the susceptibility, and the magnetic loss tangent (b) versus frequency of the magnetic field for P-F composites, obtained at room temperature.
Symmetry 10 00059 g010
Table 1. Theoretical and experimental percentages of elements of the P-F composites (expressed as oxides).
Oxide FormulaP-FP-F1P-F2P-F3
Theoretical (%)Experimental (%)Experimental (%)Experimental (%)
PbO55.38952.4453.749.49
La2O30.8890.610.740.73
ZrO230.09931.7530.6336.99
TiO22.6032.392.882.21
NiO1.4492.111.411.28
ZnO0.8880.930.950.84
Fe2O39.6819.779.698.46
Table 2. The electrophysical parameters of the obtained composite samples.
ParameterPLZTP-F1P-F2P-F3
ρ (g/cm3)7.207.077.176.90
TC (°C) 1200211211233
εr at Tr 1460496747376
εmax at TC 116,646414186333247
tanδ at Tr 10.0180.0290.0790.041
tanδ at TC 10.0410.1650.1640.417
EAct in I (eV)0.0630.1080.1900.239
EAct in II (eV)0.9030.9340.9931.145
EC (kV/mm) 21.401.501.911.70
Pr (μC/cm2) 221.1010.2518.152.5
1 for 1 kHz, 2 for 1 Hz.

