Abstract
Recently, sound-based diagnosis systems have been given much attention in many fields due to the advantages of their simple structure, non-touching measurement style, and low-power dissipation. In order to improve the efficiency of coal production and the safety of the coal mining process, accurate information is always essential. It is indicated that the sound signal produced during the cutting process of the coal mining shearer contains much cutting pattern identification information. In this paper, the original acoustic signal is first collected through an industrial microphone. To analyze the signal deeply, an adaptive Hilbert–Huang transform (HHT) was applied to decompose the sound to several intrinsic mode functions (IMFs) to subsequently acquire 1024 Hilbert marginal spectrum points. The 1024 time-frequency nodes were reorganized as a 32 × 32 feature map. Moreover, the LeNet-5 convolutional neural network (CNN), with three convolution layers and two sub-sampling layers, was used as the cutting pattern recognizer. A simulation example, with 10,000 training samples and 2000 testing samples, was conducted to prove the effectiveness of the proposed method. Finally, 1971 testing sound series were recognized accurately through the trained CNN and the proposed method achieved an identification rate of 98.55%.
1. Introduction
In order to improve the utilization of coal resources, the shearer drum is controlled to move close to the interface of the coal seam and rock as much as possible [1]. Since the 1960s, cutting pattern recognition, defined as whether the shearer drum is cutting coal bed, rock bed, or the coal bed mixed with gangue, has been widely researched in many coal producing countries. Selection of the source signal is a key factor for the performance of the cutting pattern recognition system. Among these methods, γ-ray detection [2], infrared-ray detection [3], image identification [4], and vibration analysis [5] have mostly been researched in the past. However, none of them is applied in practice on a large scale due to its huge size, contact measurement, and frequent maintenance. Another important source signal, which is the cutting sound produced by the impact between the shearer drum and the coal-rock, has prompted wide attention recently. The acoustic-based system has obvious advantages due to its compact structure, non-touching measurement style, and convenient maintenance [6]. Therefore, it is widely applied in fault diagnosis [7,8], target detection [9], feature extraction [10], and so on.
Unfortunately, the original cutting signal acquired from the coal mining field is always nonlinear, nonstationary, and discontinuous. It is an exceedingly difficult problem to extract key information from the signal. Thus, a powerful signal process method is one of the keys to settling the tough matter. However, typical sound signal analysis approaches such as short-time Fourier transform (STFT), wavelet transform (WT), and wavelet packet transform (WPT) are inappropriate to treat the cutting sound. Due to the characteristics of strong nonlinearity and nonstationarity, STFT is unable to play an effective role on the signal due to the Dirichlet condition and Heisenberg uncertainty principle [11,12]. Similarly, the WT and WPT do not work on interval cutting sound signal due to the fixed wavelet basis [13]. In 1998, an adaptive decomposing method, named the Hilbert–Huang transform (HHT), was established by National Aeronautics and Space Administration (NASA) [14]. The HHT is composed of empirical mode decomposition (EMD), proposed by Huang and Wu in 2008, and the Hilbert transform (HT) [15]. As the basis is adaptive, the HHT is not affected by the restrictions of previous approaches and becomes an attractive tool to find faults in diagnosis [16], speech recognition [17], signal denoising [18], pattern recognition [19], forecasting [20], and so on.
After decomposing the original sound into a series of time–frequency characteristics, many researchers adopted some feature extractors to reduce the dimension and eliminate redundant information. The effectiveness of feature extracting is a key factor in the success of the recognition process. The extractor should distinguish characteristics of different classes and reserve identical features within the same class as much as possible [21,22]. On the other hand, appropriate features must be determined as the basis of the classifier first to improve the success rate. However, because the type, number, and weight of different feature always need a priori knowledge, it is difficult to have a common approach [23,24]. Moreover, the structure of the feature extractor is often difficult to fit the specific problem properly and is always a tedious and time-consuming task. Another efficient solution is combining the extractor and classifier together. Furthermore, the most representative method is deep learning. A deep learning approach describes information through simulating the human brain and is an important branch of machine learning. Typical algorithms, such as a convolutional neural network (CNN), recurrent neural network (RNN), deep belief network (DBN), and so on, contain multiple nonlinear hidden layers to conduct supervised or unsupervised feature extraction, pattern recognition, and classification [25]. CNN is a type of feed-forward artificial neural network with shared weights and local connections [26]. As a kind of supervised algorithm, CNN is widely applied in image detection, speech recognition, handwritten digits identification, and so on.
Inspired by the above background research, the authors of this paper aim to propose a cutting pattern recognition method for a coal mining shearer through the cutting sound. The sound is decomposed using the adaptive HHT and recognized by the deep learning CNN. The rest of this paper is organized as follows. Some related works are summarized according to recent literature in Section 2. In Section 3, the principle of HHT and the recognition process of CNN are presented. In Section 4, the combination of HHT and CNN is performed, and the cutting pattern recognition system based on HHT-CNN is elaborated. In Section 5, a simulation with 10,000 training samples and 2000 testing samples was performed to validate the effectiveness of the proposed method. Finally, some conclusions and future works are outlined in Section 6.
2. Literature Review
Recent research related to this paper can be divided into two research aspects: the Hilbert–Huang transform and convolutional neural networks.
2.1. Hilbert–Huang Transform
The HHT is the time series being decomposed in the time and frequency domains by integrating the EMD with the HT. Compared with the FFT and WT analysis by which a set of basis functions of constant amplitude is applied to describe each existing frequency component in the signal, the HHT scheme is given by the instantaneous frequency analysis that results from the HT of the signal [15]. Since it was established, HHT has been widely used in fault diagnosis, speech recognition, signal denoising, pattern recognition, forecasting, and so on. In order to identify the flow regime in a gas–solid two-phase flow system, a new methodology uses the artificial neural network (ANN) scheme and HHT proposed in Reference [27]. The electrostatic fluctuation signal was processed through HHT to obtain the Hilbert marginal spectrum, and four characteristics extracted from the spectra were treated as the input of ANN for recognition. In order to diagnose engine faults intelligently, Wang et al. proposed a comprehensive method based on HHT and a support vector machine (SVM). Seven IMFs decomposed from the EMD, the maximum value of HHT marginal spectrum, and its corresponding frequency component are extracted as the features, and the accuracy of the system was more than 90% [28]. In Reference [19], the authors proposed an acoustic emission pattern recognition approach based on a smoothed presentation of the Hilbert spectrum to monitor the structural health in polymer composite materials. Although the HHT has been widely applied in various fields, there still existed some problems, among which undesirable IMF components during the EMD process received increasing attention. Undesirable IMF components, especially in the low-frequency region, contained redundant and contradictory IMFs, which would decrease the recognition rate for following analyses and increase the computational time [29]. In Reference [30], an improved HHT based on the correlation between the IMFs and the original signal was applied to analyze the vibration signal of a machine. The IMFs’ confidence index was introduced to select proper components in Reference [31], and the effectiveness of the improvement was validated by the axle bearing fault diagnosis accuracy.
2.2. Convolutional Neural Network
CNN is a kind of deep learning algorithm equipped with convolutional layers and inspired by a cat’s visual cortex [26]. In the 1980s, Fukushima et al. proposed a new kind of neural network with multiple simple cells and complex cells, which was regarded as the embryonic form of a CNN [32]. Enlightened by a sparse local connection, LeCun et al. designed and trained convolutional networks using the back propagation and introduced the concept of weight sharing [33]. Several years later, a real sense of a CNN, named LeNet-5, was established with invariant characteristics under translation, scaling, and rotation operations [34]. As an automatic feature extractor and classifier, the CNN obtained key information of a signal through convolution, local connection, weight sharing, and subsampling, and classify the feature into different patterns using a fully-connected network. Recently, CNNs are widely applied in handwritten digit identification, image detection, face finders, speech recognition, and so on. In Reference [35], a trainable feature extractor for handwritten digit recognition based on the LeNet-5 CNN was proposed, and a test was conducted on the Mixed National Institute of Standards and Technology (MNIST) database with an error rate of 0.54%. Niu et al. designed another hybrid CNN-SVM classifier for this task and achieved an error rate of 0.19% without rejection [36]. A novel face detection approach based on a convolutional neural architecture was design for fast and robust face detection in Reference [37]. Chen et al. proposed a gearbox fault identification and classification method with FFT and CNN. The vibration was first decomposed using FFT, and then trained using a CNN. The identification accuracy indicated the dependability and applicability of the proposed scheme in diagnosing the industrial reciprocating machinery [38]. In Reference [39], in order to reduce the error rate during speech recognition, a CNN was applied as the extractor and classifier. The log-energy computed directly from the mel-frequency spectral coefficients was used as the input of the network. Furthermore, the experiment with a relative error reduction of about 6–10% compared with Gaussian mixture model-hidden Markov model (GMM-HMM) proved the efficiency of the scheme. In Reference [40], the authors investigated CNN for large vocabulary distant speech recognition. The training data was collected from a single distant microphone and multiple distant microphones.
2.3. Discussion
Recently, many valuable HHT-based analysis methods and CNN recognition systems have been proposed and applied by researchers. The publications push forward the improvement of these fields greatly. However, there still exist some disadvantages listed as follows. First, initial coefficients obtained from HHT are too numerous and contained redundant information or undesired IMFs. Traditional recognition solutions cannot handle these problems appropriately. Therefore, various statistical characteristics, such as the energy, maximum, correlation, and so on, are extracted as features. However, different characteristics apply to different problems, which results in certain blindness in selected proper statistical features that lack a strict selection mechanism. Second, a CNN-based approach is successfully used in speech identification, but the speech is decomposed into mel-frequency spectral coefficients, which is not suitable for a machinery acoustic signal. Deep learning aimed at machinery sound have prompted few studies; how to process the initial sound signal, organize the input of CNN, and design the structure of CNN are still open questions.
In order to solve the above problems, a novel acoustic-based cutting pattern recognition method integrated HHT and CNN is introduced in this paper. An industrial microphone was installed to record the cutting sound signal. The initial signal was first decomposed using HHT to obtain a Hilbert marginal spectrum. Then CNN was conducted to extract key information and classify it into different cutting patterns. In order to prove the validity and superiority of the proposed scheme, some simulations and an industrial field application were organized and conducted.
3. Basic Theories
3.1. Hilbert–Huang Transform
The HHT is composed of an EMD and a Hilbert transform. The original signal is first decomposed using EMD to obtain a series of intrinsic mode functions (IMFs). Then the Hilbert transform is performed for time-frequency characteristics of the signal. According to Huang’s theory, any one-dimensional time series can be decomposed into several IMFs and a remainder, where an arbitrary IMF must obey two constraints:
1) The extreme points and zero crossing points must be equal or the difference is no greater than one.
2) The mean value of the upper and lower envelope calculated by the average of local minima and maxima equals zero at any point.
According to the conditions of IMF, the procedure of EMD is given as below:
Step 1: For an arbitrary signal X(t), all extreme points are searched first. The upper and lower envelopes are constructed by connecting all the maximal points and the minimal points by cubic splines, respectively. The average value of the two envelopes is labelled as m1, then m1 is extracted from X(t) to obtain a reminder h1, which is given as follows:
If h1 obeys the two constraints of IMF, then h1, defined as C1, is the first IMF of X(t). Else, h1 is regarded as X(t), and the above step is repeated. In general, the highest frequency component of X(t) is contained in C1.
Step 2: Extract C1 from X(t), and the remainder component r1 can be described as follows:
Then, X(t) is replaced by r1, and the above step is repeated until the N-th remainder is a monotonic function, namely rN. Furthermore, rN can be expressed as follows:
Step 3: X(t) can be decomposed into N IMFs and a remainder, which can be described as follows:
where rN is the residual and represents the average trend of X(t).
Generally, X(t) is in the real domain, so IMFs decomposed from the original signal are also real functions. The Hilbert transform is then conducted on Cn as follows:
The analytical formula of Cn can be expressed as follows:
where an(t) is amplitude function and φn(t) is the phase function.
Then, the instantaneous frequency can be calculated as follows:
After ignoring the remainder term rN(t), X(t) can is given as follows:
where an(t) and φn(t) are functions of time. Furthermore, a three-dimensional time–frequency Hilbert spectrogram regarding time, frequency, and amplitude is established to describe the change of frequency and amplitude in the time domain. The Hilbert spectrum can be described as follows:
Finally, the Hilbert marginal spectrum is defined as an integrated spectrum about time as follows:
where the value of the Hilbert marginal spectrum is the total amplitude value of each frequency in a different time scale. It describes the variation tendency of amplitude with frequency across the whole frequency scale and also represents whether a given frequency is contained in the signal. The flowchart of HHT is given in Figure 1.
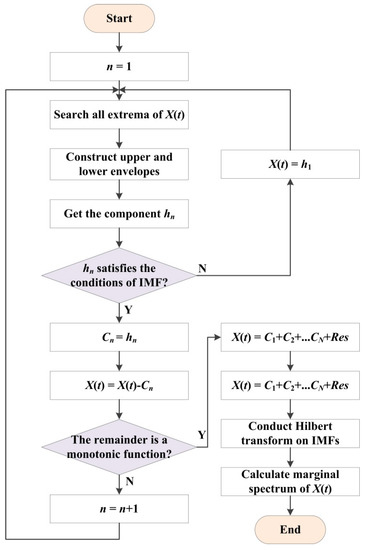
Figure 1.
Flowchart of Hilbert-Huang transform.
3.2. Convolutional Neural Network
Convolutional neural network (CNN) can be seen as a modification of a traditional neural network. The CNN introduces local connectivity and weight sharing in hidden layers, and adopts a special network structure, which consists of convolution layers and sub-sampling layers.
For a two-dimensional input map, being the pixel values at m and n (horizontal and vertical), feature extraction and classification through CNN are performed as shown in Figure 2. The early stage of a CNN consists of alternating convolution and sub-sampling operations, while the last few layers are fully connected one-dimensional layers.

Figure 2.
Structure of the convolutional neural network.
Step 1: Convolution. The convolution layers are core components of a CNN, which have the characteristics of local connectivity and weight sharing. The previous feature maps are convolved with trainable kernels and transformed by the activation function to generate convolution feature maps. Each feature map in a convolution layer combines characteristics of multiple input maps. In general, it is calculated as follows:
where σ(·) is a nonlinear sigmoid function, Mj donates a selection of input feature maps, l represents the l-th layer in a network, k donates a convolution kernel with the size of s × s, and b is an additive bias. The convolution kernel can also be regarded as a filter. The size of the feature map in the convolution layer is [(m − s)/f + 1] × [(n − s)/f + 1], where the size of input map is m × n, and f × f is the convolution shift size.
Step 2: Sub-sampling. A sub-sampling operation is used on the convolution layer to obtain its corresponding pooling ply. Generally, feature maps in this layer have the same number with the number of that in the convolution ply, while each map is smaller. The aim of the sub-sampling operation is to reduce the resolution of feature maps. The process is realized through using a sampling function to several units in a local area of a size determined by the sub-sampling size. Typically, the sampling function will get the sum of each p × p block in the previous map such that the output feature map is p times smaller along both spatial dimensions. The sub-sampling operation can be presented as follows:
where δ(·) donates the sampling function. The size of feature map in the sub-sampling layer is [(m1 − p)/g + 1] × [(n1 − p)/g + 1], where the size of the input map is m1 × n1, and g × g is the sub-sampling shift size. If p = g, then the size of pooling ply would be 1/p of the convolution ply.
Step 3: Classification. After the 2-D map is transformed by several convolution and sub-sampling operations, the remaining units are spread to a nonlinear classifier. Nodes of different layers in the classifier are fully connected through the sigmoid function. Finally, a vector with t nodes is output through the CNN, where t represents the category number of the specific issue.
4. The Proposed Method
To recognize the cutting pattern of the coal mining shearer accurately, the cutting acoustic signal is recorded and utilized in this paper. The original sound is processed using the HHT first. Instead of extracting statistical characteristics from the decomposed signal, such as the energy, maximum, correlation coefficient, and so on, the HHT coefficients are directly input into the deep learning CNN. The flow of the proposed HHT-CNN can be summarized as follows:
Step 1: Pretreatment. Acquire Q cutting sound samples, which can be classified into t averaged cutting patterns. The samples are divided into Q1 training samples and the remaining Q2 series are treated as testing samples.
Step 2: Decomposition. Decompose each sound sample into a series of IMFs using EMD. As the IMF quantity of different series may be different from each other, the biggest number is recorded as Tmax. Some zero vectors are added at low frequency if the IMF number is smaller than Tmax. Therefore, the signal can be described as follows:
where q = 1, 2, 3, …, Q.
Step 3: Hilbert–Huang transform. Perform a Hilbert transform on the IMFs to obtain the marginal spectrum of each signal. In the practical calculation, the marginal spectrum consists of a suite of discrete values. Therefore, the signal can be noted as Hq = [h1, h2, h3… hl], where Hq is treated as a feature vector of the sample and l donates the point number of the Hilbert transform.
Step 4: Reorganization. Each feature vector is reorganized into an m × n 2-D map, where l = m × n. The m × n feature map is regarded as the representation of the sound signal.
Step 5: CNN training and testing. Input the feature vector of each training sample into the CNN, and the output is the corresponding cutting pattern. The size of convolutional kernel is s × s, and the sub-sampling size is p × p. Finally, organize the testing samples as input maps of the cognitive CNN to validate the recognition accuracy. The flowchart of the proposed method is shown in Figure 3.
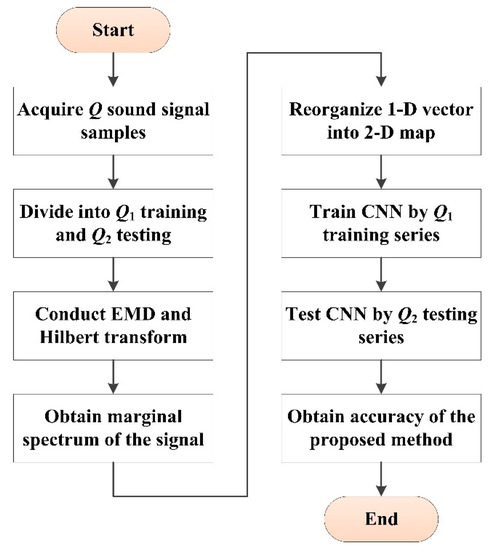
Figure 3.
Flowchart of the proposed method.
5. Simulation and Application
In order to prove the validity and superiority of the proposed scheme, some simulations and an industrial field application were organized and conducted. The sound signal of four cutting patterns were recorded. Then HHT and CNN were conducted in order. Finally, some analysis was performed based on the simulation results.
5.1. Cutting Sound Acquisition
A full-size, coal-rock cutting wall was built to simulate a real geological condition to obtain cutting sound under different cutting patterns. All experiments were performed in the National Coal Mining Equipment Research and Experiment Center at the China Coal Zhangjiakou Coal Mining Machinery Co., Ltd. (Zhangjiakou, China). Furthermore, the shearer model was an MG500/1130-WD, the cutting height range of the shearer was 1.6 meters to 3.3 meters and the production capacity was 1600 tons per hour, as shown in Figure 4. The pulling speed of the shearer was 3 m/min, and the cutting wall consisted of three typical sections: pure coal bed with a Protodikonov hardness coefficient of f2 (P1), pure coal bed with a hardness of f3 (P2), and coal bed gripping rock bed (P3). An industrial microphone was installed to record the cutting acoustic signal of P1, P2, P3, and the working condition of empty-load (P4). The sampling frequency of the cutting sound was 44.1 kHz and the initial sound was saved as a .wav file. A 25-min sound sample was extracted as sample signal for each cutting pattern. A total of 12,000 sample series, each with a duration time of 0.5 s were collected. A total of 10,000 series were the training samples and the remaining 2000 series were treated as the testing samples. Four typical kinds of cutting sound signals are shown in Figure 5.

Figure 4.
(a) The arrangement of the experimental suite. (b) The experiment process.
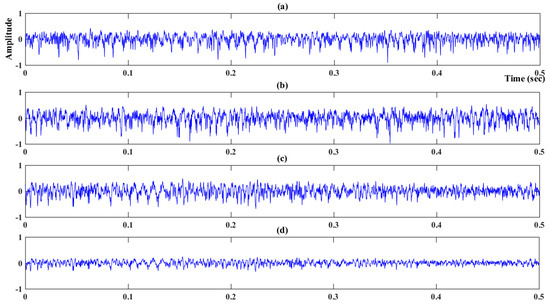
Figure 5.
(a) Cutting sound of coal bed with a hardness of f2. (b) Cutting sound of coal bed with a hardness of f3. (c) Cutting sound of coal bed gripping gangue. (d) Cutting sound of the empty-load.
5.2. Sound Decomposition
The sound signal was then decomposed using HHT adaptively, which contained EMD and the Hilbert transform. EMD was first conducted on the signal, and then the signal was decomposed into several IMFs and a residual, where the EMD result of P1 is presented in Figure 6. A Hilbert transform was performed on the IMFs subsequently to obtain the Hilbert time–frequency spectrum, which is shown in Figure 7. The time–frequency spectrum in the figure contained both time and frequency information of the cutting sound series. Furthermore, the value of the normalized frequency was described by gradation of color. The Hilbert marginal spectrum, using an integrated spectrum with respect to time, of the four typical cutting sound series is shown in Figure 8. In this paper, the marginal spectrum was discretized into 1024 frequency bands. Based on the Nyquist–Shannon sampling theorem, the sampling frequency should be at least twice as big as the highest frequency in the signal. In this paper, the sampling frequency was 44.1 kHz, so the biggest distinguishable frequency was 22.05 kHz. The length of each frequency band was about 21.53 Hz. Finally, each signal series was decomposed into a vector with 1024 elements.
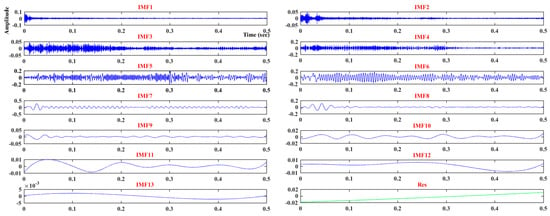
Figure 6.
EMD decomposition result of P1.
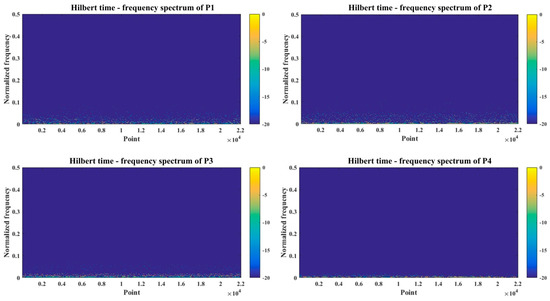
Figure 7.
Hilbert time-frequency spectrum of four different cutting signal.
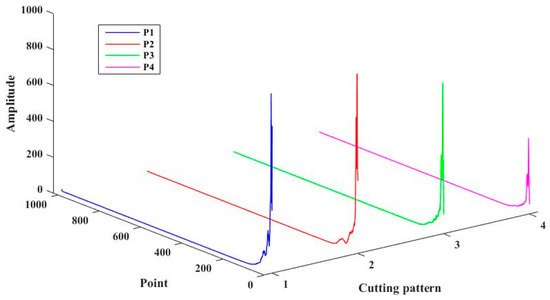
Figure 8.
Hilbert marginal spectrum of the four kinds of cutting sound.
5.3. CNN Training and Testing
As the input of the CNN was usually a 2-D map, the 1024 elements were reorganized as follows. The first 32 elements were regarded as the first row, elements from 33 to 64 were treated as the second row, and the remainders were also reorganized as the rule. Finally, the 1024 Hilbert marginal spectrum points were transformed into a 32 × 32 feature map.
In order to evaluate the feasibility of the proposed deep learning method, the initial CNN was trained using the 10,000 training samples. The LeNet-5 CNN was applied to recognize the cutting pattern of the shearer. The architecture of the LeNet-5 is shown in Figure 9. It could be seen that there were three convolution layers and two subsampling layers in the LeNet-5. The input map was a 32 × 32 map that was first transformed into six feature maps through a 5 × 5 convolution kernel and a 1 × 1 convolution shift step, so the size of map in the first convolution layer was 28 × 28. Then, the sub-sampling operation was conducted through a pooling size of 2 × 2. The map size in this ply was 14 × 14. The number of feature maps in the second convolution and sub-sampling layer was sixteen. The size of the convolution kernel and pooling block was the same as the previous layer. Then the sixteen 5 × 5 feature maps were convolved into 120 feature points. Finally, a fully connected classifier with 84 hidden nodes and 4 output nodes was designed to recognize the cutting pattern of the coal mining shearer. The output loss function in the LeNet-5 CNN was the maximum likelihood estimation criterion, which in this case was a minimum mean squared error (MSE) equivalent. Then, the deep learning network was trained through the 10,000 training sound signal series. The training procedure was stopped after 1500 epochs.

Figure 9.
Structure of the proposed CNN.
After training the CNN, the remaining 2000 testing samples were applied to validate the accuracy of the trained CNN. The same decomposition and reorganization were conducted on the testing series. Furthermore, the recognition result is presented in Figure 10. It could be seen from the figure that 1971 samples were recognized exactly. Therefore, the identification accuracy of the proposed cutting pattern recognition system based on HHT-CNN was 98.55%. A total of 29 samples were misjudged during the testing process. Among these, four samples in P1 were sorted into P2 and one sample each into P3 and P4. Seven sound series in P2 were classified into P1 and six into P3 mistakenly. Moreover, two acoustic samples in P3 were misclassified as P1 and six as P2. Only one series in P4 was misjudged. According to a deep analysis on the results, it could be seen that the acoustic signal of cutting objects with similar characteristics had a small deviation, and those with evident differences could be distinguished precisely.
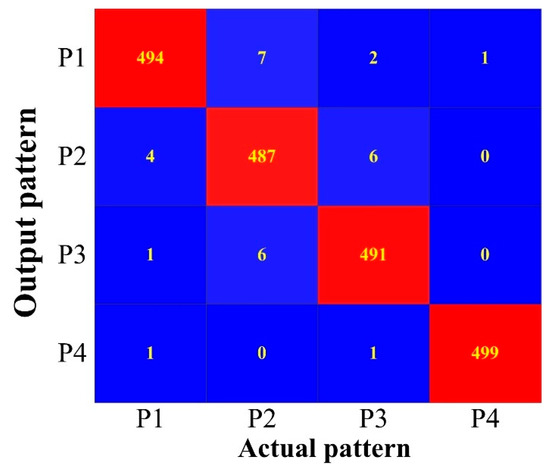
Figure 10.
The recognition result of the 2000 testing samples.
6. Conclusions and Future Work
In this paper, a novel approach regarding the cutting sound signal based on the HHT and deep learning CNN was proposed to identify the cutting pattern for the coal mining shearer. The adaptive HHT was applied to decompose the original acoustic signal into several IMFs and obtain a Hilbert marginal spectrum. Then the one-dimensional vector was reorganized into a two-dimensional 32 × 32 feature map. The LeNet-5 CNN was used to learn the cutting sound signal deeply. To validate the effectiveness and advantage of the proposed method, a simulation with 10,000 training samples and 2000 testing samples was conducted and analyzed. The simulation example result showed that the sound-based cutting pattern recognition approach could distinguish the cutting pattern accurately and the proposed method achieved a recognition rate of 98.55%. As the basis function and decomposition layer in HHT were determined according to the signal and the connection weights in CNN were obtained through the training process, the proposed HHT-CNN in this paper was extremely adaptive.
However, there are also some limitations as follow: (1) The training process of the deep learning algorithm needs too many samples since such a large-scale training sample is often difficult in practice. (2) The proposed HHT-CNN is still time-consuming. Therefore, the structure of the software program, execution efficiency of the code, and training process of CNN are to be improved. In further studies, the authors plan to introduce some improvements to the proposed approach. These may include a relatively small-scale training sample and shorter learning time of the algorithm code to realize online recognition. Moreover, there were only four typical cutting patterns are researched in this paper which is not representative of real working conditions. The authors will analyze more operating conditions to prove the proposed method.
Author Contributions
J.X. and Z.W. contributed the new processing method; J.X., C.T., B.W., Z.S., and Y.T. designed the simulations and experiments; C.T. performed the experiments; D.L. modifies English writing; and J.X. wrote the paper.
Funding
This research was funded by Marine Equipment and Technology Institute of Jiangsu University of Science and Technology (HZ20180008), National Natural Science Foundation of China (No. U1510117), and Natural Science Fund for Colleges and Universities in Jiangsu Province (17KJB416004 and 18KJB580005). Furthermore, the APC was funded by Marine Equipment and Technology Institute of Jiangsu University of Science and Technology (HZ20180008).
Conflicts of Interest
The authors declare no conflict of interest.
References
- Xu, J.L.; Wang, Z.C.; Zhang, W.Z.; He, Y.P. Coal-rock interface recognition based on MFCC and neural network. Int. J. Signal Process. Image Process. Pattern Recognit. 2013, 6, 191–200. [Google Scholar]
- Bessinger, S.L.; Neison, M.G. Remnant roof coal thickness measurement with passive gamma ray instruments in coal mine. IEEE Trans. Ind. Appl. 1993, 29, 562–565. [Google Scholar] [CrossRef]
- Dong, Y.F.; Du, H.G.; Ren, W.J.; Du, Y.M. Experimental Research on Infrared Information Varying with Stress. J. Liaoning Technol. Univ. (Nat. Sci. Ed.) 2001, 20, 495–496. [Google Scholar]
- Huang, S.J.; Liu, J.G. Research of coal-rock recognition technology based on GMM clustering analysis. J. China Coal Soc. 2015, 40, 576–582. [Google Scholar]
- Wang, B.P.; Wang, Z.C.; Zhang, W.Z. Coal-rock interface recognition method based on EMD and neural network. J. Vib. Meas. Diagn. 2012, 32, 586–590. [Google Scholar] [CrossRef] [PubMed]
- Yao, Y.; Wang, H.; Li, S.; Liu, Z.; Gui, G.; Dan, Y.; Hu, J. End-To-End Convolutional Neural Network Model for Gear Fault Diagnosis Based on Sound Signals. Appl. Sci. 2018, 8, 1584. [Google Scholar] [CrossRef]
- Glowacz, A. Acoustic-Based Fault Diagnosis of Commutator Motor. Electronics 2018, 11, 299. [Google Scholar] [CrossRef]
- Vaimann, T.; Sobra, J.; Belahcen, A.; Rassolkin, A.; Rolak, M.; Kallaste, A. Induction machine fault detection using smartphone recorded audible noise. IET Sci. Meas. Technol. 2018, 12, 554–560. [Google Scholar] [CrossRef]
- Nanda, M.A.; Seminar, K.B.; Nandika, D.; Maddu, A. A Comparison Study of Kernel Functions in the Support Vector Machine and Its Application for Termite Detection. Information 2018, 9, 5. [Google Scholar] [CrossRef]
- Vununu, C.; Moon, K.-S.; Lee, S.-H.; Kwon, K.-R. A Deep Feature Learning Method for Drill Bits Monitoring Using the Spectral Analysis of the Acoustic Signals. Sensors 2018, 18, 2634. [Google Scholar] [CrossRef]
- Loh, C.R.; Wu, T.C.; Huang, N.E. Application of the empirical mode decomposition-Hilbert spectrum method to identify near-fault ground-motion characteristics and structural responses. Bull. Seismol. Soc. Am. 2001, 91, 1339–1357. [Google Scholar] [CrossRef]
- Boudraa, A.O.; Cexus, J.C. EMD-based signal filtering. IEEE Trans. Instrum. Meas. 2007, 56, 2196–2202. [Google Scholar] [CrossRef]
- Xuan, B.; Xie, Q.W.; Peng, S.L. EMD sifting based on bandwidth. IEEE Signal Process. Lett. 2007, 14, 537–541. [Google Scholar] [CrossRef]
- Huang, N.E.; Shen, Z.; Long, S.R. The empirical mode decomposition and the Hilbert spectrum for nonlinear and non-stationary time series analysis. In Proceedings of the Royal Society of London A; The Royal Society: London, UK, 1998. [Google Scholar]
- Huang, N.E.; Wu, Z.H. A review on Hilbert-Huang transform: Method and its applications to geophysical studies. Rev. Geophys. 2008, 46. [Google Scholar] [CrossRef]
- Su, Z.Y.; Zhang, Y.M.; Jia, M.P.; Xu, F.Y.; Hu, J.Z. Gear fault identification and classification of singular value decomposition based on Hilbert-Huang transform. J. Mech. Sci. Technol. 2011, 25, 267–272. [Google Scholar] [CrossRef]
- Tychkov, A.Y.; Alimuradov, A.K.; Churakov, P.P. Adaptive Signal Processing Method for Speech Organ Diagnostics. Meas. Tech. 2016, 59, 485–490. [Google Scholar] [CrossRef]
- Li, H.; Xue, G.Q.; Zhao, P.; Zhong, H.S.; Khan, M.Y. The Hilbert-Huang Transform-Based Denoising Method for the TEM Response of a PRBS Source Signal. Pure Appl. Geophys. 2016, 173, 2777–2789. [Google Scholar]
- Hamdi, S.E.; Le Duff, A.; Simon, L.; Plantier, G.; Sourice, A.; Feuilloy, M. Acoustic emission pattern recognition approach based on Hilbert-Huang transform for structural health monitoring in polymer-composite materials. Appl. Acoust. 2013, 74, 746–757. [Google Scholar] [CrossRef]
- Kurbatskii, V.G.; Sidorov, D.N.; Spiryaev, V.A.; Tomin, N.V. On the Neural Network Approach for Forecasting of Nonstationary Time Series on the Basis of the Hilbert-Huang Transform. Autom. Remote Control 2011, 72, 1405–1414. [Google Scholar] [CrossRef]
- Guido, R.C. A tutorial review on entropy-based handcrafted feature extraction for information fusion. Inf. Fusion 2018, 41, 161–175. [Google Scholar] [CrossRef]
- Glowacz, A. Fault diagnosis of single-phase induction motor based on acoustic signals. Mech. Syst. Signal Process. 2019, 117, 65–80. [Google Scholar] [CrossRef]
- Nanni, L.; Costa, Y.M.G.; Lucio, D.R.; Silla, C.N.; Brahnam, S. Combining visual and acoustic features for audio classification tasks. Pattern Recognit. Lett. 2017, 88, 49–56. [Google Scholar] [CrossRef]
- Dennis, J.; Tran, H.D.; Li, H. Spectrogram Image Feature for Sound Event Classification in Mismatched Conditions. IEEE Signal Process. Lett. 2011, 18, 130–133. [Google Scholar] [CrossRef]
- Sohaib, M.; Kim, C.-H.; Kim, J.-M. A Hybrid Feature Model and Deep-Learning-Based Bearing Fault Diagnosis. Sensors 2017, 17, 2876. [Google Scholar] [CrossRef] [PubMed]
- Khawaldeh, S.; Pervaiz, U.; Rafiq, A.; Alkhawaldeh, R.S. Noninvasive Grading of Glioma Tumor Using Magnetic Resonance Imaging with Convolutional Neural Networks. Appl. Sci. 2018, 8, 27. [Google Scholar] [CrossRef]
- Hu, H.L.; Zhang, J.; Dong, J.; Luo, Z.Y.; Xu, T.M. Identification of gas-solid two-phase flow regimes using Hilbert-Huang transform and neural-network techniques. Instrum. Sci. Technol. 2011, 39, 198–210. [Google Scholar] [CrossRef]
- Wang, Y.S.; Ma, Q.H.; Zhu, Q.; Liu, X.T.; Zhao, L.H. An intelligent approach for engine fault diagnosis based on Hilbert–Huang transform and support vector machine. Appl. Acoust. 2014, 75, 1–9. [Google Scholar] [CrossRef]
- He, K.F.; Zhang, Z.J.; Xiao, S.W.; Li, X.J. Feature extraction of AC square wave SAW arc characteristics using improved Hilbert–Huang transformation and energy entropy. Measurement 2013, 46, 1385–1392. [Google Scholar] [CrossRef]
- Peng, Z.K.; Peter, W.T.; Chu, F.L. An improved Hilbert–Huang transform and its application in vibration signal analysis. J. Sound Vib. 2005, 286, 187–205. [Google Scholar] [CrossRef]
- Yi, C.; Lin, J.; Zhang, W.; Ding, J. Faults Diagnostics of Railway Axle Bearings Based on IMF’s Confidence Index Algorithm for Ensemble EMD. Sensors 2015, 15, 10991–11011. [Google Scholar] [CrossRef]
- Fukushima, K.; Miyake, S. Neocognitron: A new algorithm for pattern recognition tolerant of deformations and shifts in position. Pattern Recognit. 1982, 15, 455–469. [Google Scholar] [CrossRef]
- LeCun, Y. A learning scheme for asymmetric threshold networks. In Proceedings of the Cognitiva’85, Paris, France, 4–7 June 1985; pp. 599–604. [Google Scholar]
- LeCun, Y.; Bottou, L.; Bengio, Y.; Haffner, P. Gradient-Based Learning Applied to Document Recognition. Proc. IEEE 1998, 86, 2278–2324. [Google Scholar] [CrossRef]
- Lauer, F.; Suen, C.Y.; Bloch, G. A trainable feature extractor for handwritten digit recognition. Pattern Recognit. 2007, 40, 1816–1824. [Google Scholar] [CrossRef]
- Niu, X.X.; Suen, C.Y. A novel hybrid CNN–SVM classifier for recognizing handwritten digits. Pattern Recognit. 2012, 45, 1318–1325. [Google Scholar] [CrossRef]
- Garcia, C.; Delakis, M. Convolutional face finder: A neural architecture for fast and robust face detection. IEEE Trans. Pattern Anal. Mach. Intell. 2004, 26, 1408–1423. [Google Scholar] [CrossRef] [PubMed]
- Chen, Z.Q.; Li, C.; Sanchez, R.V. Gearbox Fault Identification and Classification with Convolutional Neural Networks. Shock Vib. 2015, 2015. [Google Scholar] [CrossRef]
- Ossama, A.H.; Abdel-rahman, M.; Hui, J.; Li, D.; Gerald, P.; Dong, Y. Convolutional Neural Networks for Speech Recognition. IEEE Trans. Audio Speech Lang. Process. 2014, 22, 1533–1545. [Google Scholar]
- Swietojanski, P.; Ghoshal, A.; Renals, S. Convolutional Neural Networks for Distant Speech Recognition. IEEE Signal Process. Lett. 2014, 21, 1120–1124. [Google Scholar]
© 2018 by the authors. Licensee MDPI, Basel, Switzerland. This article is an open access article distributed under the terms and conditions of the Creative Commons Attribution (CC BY) license (http://creativecommons.org/licenses/by/4.0/).