Article

A Critical Note on Symmetry Contact Artifacts and the Evaluation of the Quality of Homology Models

1
Bioinformatics Division, Indian Institute of Information Technology, Allahabad 211012, India
2
CMBI, Radboud University Nijmegen Medical Centre, 6525 GA 26-28 Nijmegen, The Netherlands
*
Author to whom correspondence should be addressed.
Present address: Institute for Computer Science and Department of Biology, Heinrich Heine University, 40225 Düsseldorf, Germany.
Symmetry 2018, 10(1), 25; https://doi.org/10.3390/sym10010025
Submission received: 20 November 2017 / Revised: 2 January 2018 / Accepted: 2 January 2018 / Published: 11 January 2018
(This article belongs to the Special Issue Structural Symmetry and Protein Function)

Abstract

:
It is much easier to determine a protein’s sequence than to determine its three dimensional structure and consequently homology modeling will be an essential aspect of most studies that require 3D protein structure data. Homology modeling templates tend to be PDB files. About 88% of all protein structures in the PDB have been determined with X-ray crystallography, and thus are based on crystals that by necessity hold non-natural packing contacts in accordance with the crystal symmetry. Active site residues, residues involved in intermolecular interactions, residues that get post-translationally modified, or other sites of interest, normally are located at the protein surface so that it is particularly important to correctly model surface-located residues. Unfortunately, surface residues are just those that suffer most from crystal packing artifacts. Our study of the influence of crystal packing artifacts on the quality of homology models reveals that this influence is much larger than generally assumed, and that the evaluation of the quality of homology models should properly account for these artifacts.

1. Introduction

Knowledge of the three dimensional structure of proteins is a prerequisite for rational drug design, for many forms of protein engineering, or for explaining the molecular phenotype associated with the disease phenotype caused by a mutation in the human genome. It is considerably easier to determine the sequence of a protein than it is to determine its structure, and consequently homology modeling will be an essential aspect of most studies that require protein structure data. The homology modeling community is continuously working on improving all aspects of the process, and the bi-annual CASP ‘competition’ [1,2,3,4,5,6,7,8,9] is a good benchmark for where the field stands. The root mean square deviation of the atomic positions in a homology model from the equivalent atoms in the corresponding real structure after they have been optimally superposed is an important aspect of the evaluation of the quality of homology modeling procedures [10,11,12]. Selecting correct rotamers [5,6,7,8] is another aspect. Other measures have also been proposed [13,14,15,16,17,18,19].
The expected frequency of occurrence of a molecule or residue in a certain conformation is exponentially related to the energy calculated for that conformation. This is a direct result of application of the Boltzmann law [20]. A frequency plot will thus have much sharper peaks than an energy plot. Similar reasoning suggests that amino acids will prefer to have their χ1 torsion angle rather close to +60°, 180°, and −60°. Many articles have been written on this topic e.g., [21,22,23,24,25,26] so that the valine χ1 frequency distribution plot, shown as an example in Figure 1, does not come as a surprise.
The relations between the backbone structure and the preferred side chain rotamer have long been known [27], and a series of rotamer libraries have been designed over the years; most often to improve homology modeling [28,29,30,31,32,33,34,35,36,37,38]. Rotamers are also of great importance when analyzing the quality of experimentally determined protein structures and homology models. The rotameric state of side chains has often been used as a quality measure of homology models [5,6,7,8,39]. Most studies suggest that rotamer distributions are a function of secondary structure, to a lesser extend of the accessibility, and barely of the absence or presence of symmetry contacts. However, if two distributions are similar, they do not need to reflect the same underlying data.
Figure 2 shows, as an example, the rotamer distributions for a few amino acid types in an α-helix, a β-strand, or a loop region. In most cases the g− conformation is preferred. The three plots for isoleucine are shown because they are representative for the whole set of 51 plots (Gly, Ala, and Pro do not have a meaningful χ1 angle). Phenylalanine in a β-strand and histidine in an α-helix are shown because their curves differ most from all other plots. The general absence of significant differences between the subsets of the data as a function of either solvent accessibility or the presence/absence of symmetry contacts seem to suggests that this factor is not important.
88% of the protein structures in the PDB have been elucidated with X-ray crystallography, 11% with NMR, and about 1% with other techniques. Structures solved by X-ray tend to be more accurate. NMR, on the other hand, often gives a better impression of any mobility present in the structure, and it does not suffer, from artifacts caused by crystal packing contacts.
Table 1 shows that on average about one-fifth of the amino acids at the surface of a protein are involved in crystal packing. Table 1 also shows that not all residue types are equally likely to be involved in crystal packing contacts, but that study is beyond the scope of this article.
The distributions were determined using 2980 protein chains that were culled to not share any pair-wise sequence identity larger than 30% and that are selected from PDB files solved at 1.8 Ångstrøm resolution or better with an R-factor of 19.0 or better. Five curves are shown in each graph. Purple: S− accessible; Red: S− intermediate; Yellow: S− buried; Green S+ accessible; Blue S+ intermediate. S+ buried, obviously, does not exist. Differences between the five plots are not significant and consequently barely visible. All five plots were scaled to have the same area under the curve. In most cases the curves are so similar that only the dark colors are visible. A: Ile in a loop; B: Ile in a β-strand; C: Ile in an α-helix; D: Phe in a β-strand; E: His in an α-helix.
Figure 4 shows, as an example, the χ1-χ2 distribution of all isoleucines observed in PDB files solved by X-ray crystallography at better than 2.0 Ångstrøm resolution. This plot reiterates that certain χ1-χ2 combinations are seldom found in protein structures, presumably because of intra-residue steric hindrance. The torsion angles that correspond to the most favorable rotamers are not exactly 60° + N*120° (N = 0,1,2) but tend to compromise between the SP3 hybridization of the Cα and the Cβ, and 1-4 and 1-5 repulsions between the backbone and side chain atoms. Indeed, Figure 4 looks slightly different for isoleucines in an α-helix, in a β-strand, or in a loop [42]. These deviations from the ideal SP3 angles are one of the main reasons that rotamer libraries became the method of choice in many homology modeling programs.
The left-hand panel in Figure 4 shows the χ1-χ2 distribution for all isoleucines without symmetry contacts while the right-hand panel shows the same distribution for isoleucines that are involved in a crystal packing contact. Except for the absolute counts, these two distributions look remarkably similar in terms of distribution over the nine panels as well as distributions inside the nine panels.
We previously studied the influence of symmetry contacts on the observed rotamer in the most direct way by analyzing corresponding loops (with different symmetry contacts) in X-ray structures that contain two identical protein chains in the crystallographic asymmetric unit [41]. A problem with this study was that, for reasons we do not understand yet, identical loops tend to make very similar numbers of contacts even in very different environments (see Figure 3). Loops will even change their backbone conformation to find these contacts. As stated earlier, rotameric states strongly depend on the local backbone conformation [28,29,43], so that this study did not provide any answer to our question how much the rotameric states are influenced by (crystal) packing contacts. The associated website nevertheless holds a series of statistics on rotamers and symmetry contacts in these files.
While Figure 2 and Figure 4 suggest that symmetry contacts have no influence on rotamers, our study makes clear that it is more accurate to state that: symmetry contacts do not have an influence on rotamer distributions, but they do have an influence on individual rotamers. The best way to provide evidence for the latter statement would be to find proteins that have been crystallized under exactly the same biophysical conditions but nevertheless crystallized in different space groups. Such data, unfortunately, is exceedingly scarce, and the aforementioned problem that surface loops like to have similar numbers of contacts even under very different conditions adds to the difficulties with this direct approach. We therefore address the influence of crystal packing on individual rotameric states in a more indirect way by comparing homologous pairs of proteins that are bi-directionally homology modeled. In all cases the residues that were located in unambiguously modeled areas were compared. As the real structures are known for all models used, determining which residues to use for counting statistics was straightforward.
We show that crystal contacts have a strong influence on individual rotameric states in homology modeling, and this influence might even extend to conclusions drawn in studies that involve homology models.

2. Methods

79 pairs of protein structures were collected from the PDB. They all had a resolution better than 2.8 Å and an R-factor better than 0.289. The first protein of each pair was selected from a PDB_SELECT culled dataset (available at http://swift.cmbi.ru.nl/gv/select/index.html) so that they had no pair-wise sequence identity bigger than 30%. This data set was representative for the four major classes in SCOP [44,45]. For each protein a homolog was sought with 35–95% sequence identity. These pairs were structurally superposed using the MOTIF superposition option [46] of WHAT IF [47] as implemented in the YASARA twinset software [48]. The resulting structure-based sequence alignments were used as the basis for bi-directional homology modeling.
The selected structures contained no extra covalent bonds other than the canonical peptide bonds. The structures contained no large ligands, no obviously misassigned ions, no missing atoms, no residues with alternate side chain conformations and no errors that WHAT IF’s structure validation suite calls severe.
Homology modeling was performed using WHAT IF’s homology modeling option that uses rotamer distributions as described by Filippis et al. [28]. No attempts were made to optimize the models as WHAT IF’s modeling module puts great emphasis on position specific rotamers [1,29], and that was exactly the goal of this exercise.
Homology models were compared with the real structures using a dedicated module in the WHAT IF software. This same module also determined symmetry contacts and solvent accessibilities. YASARA [44] was used for molecular visualization.
Residues have been classified along three lines:
  • Conserved versus Mutated in structure superposition bases sequence alignment of the template and the model.
  • Symmetry Contact (SMC) versus No Symmetry Contact (NoSMC). Obviously, residues in homology models do not make symmetry contacts. Therefore, a residue is called SMC if either the residue in the template structure, or the equivalent residue in the real structure, or both of them make a symmetry contact. A residue is called making a symmetry contact if any atom in the residue’s side chain makes a tight contact with any symmetry related atom other than water. A contact is called tight when there is maximally 0.25 Å space between their Van der Waals’ surfaces (or 1.4 Å, which is half of the diameter of a water molecule, for Table 1).
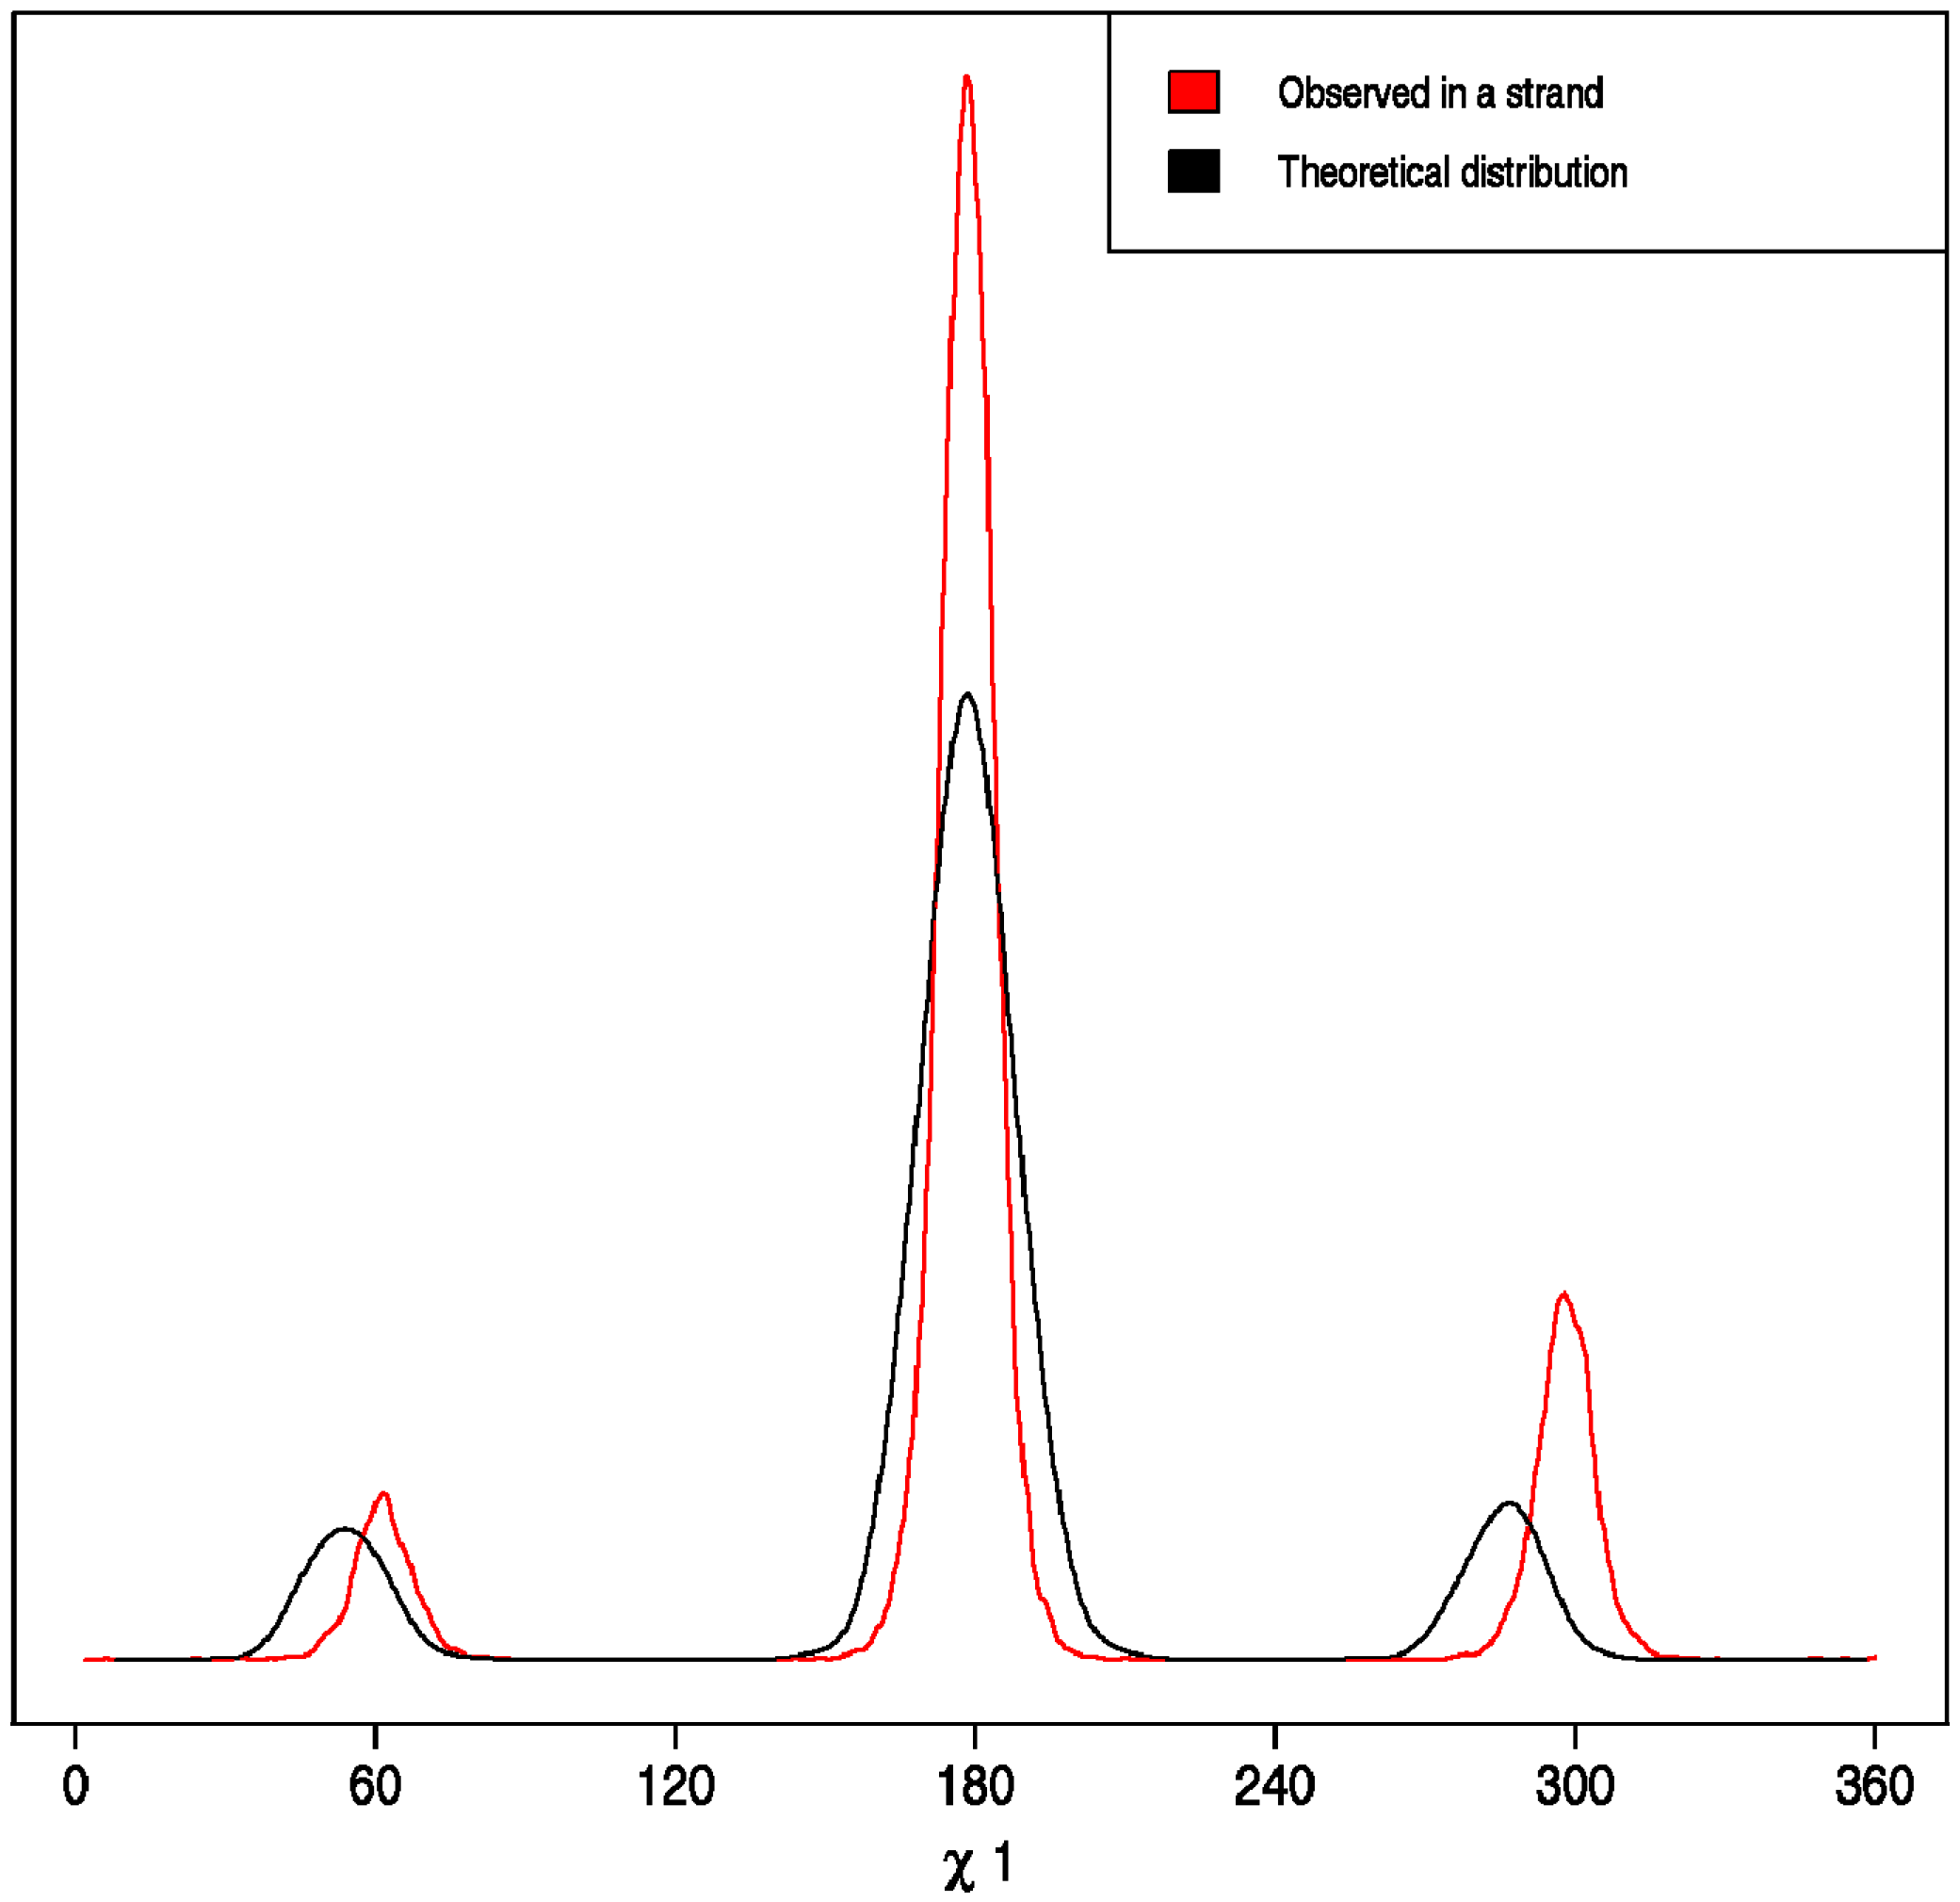
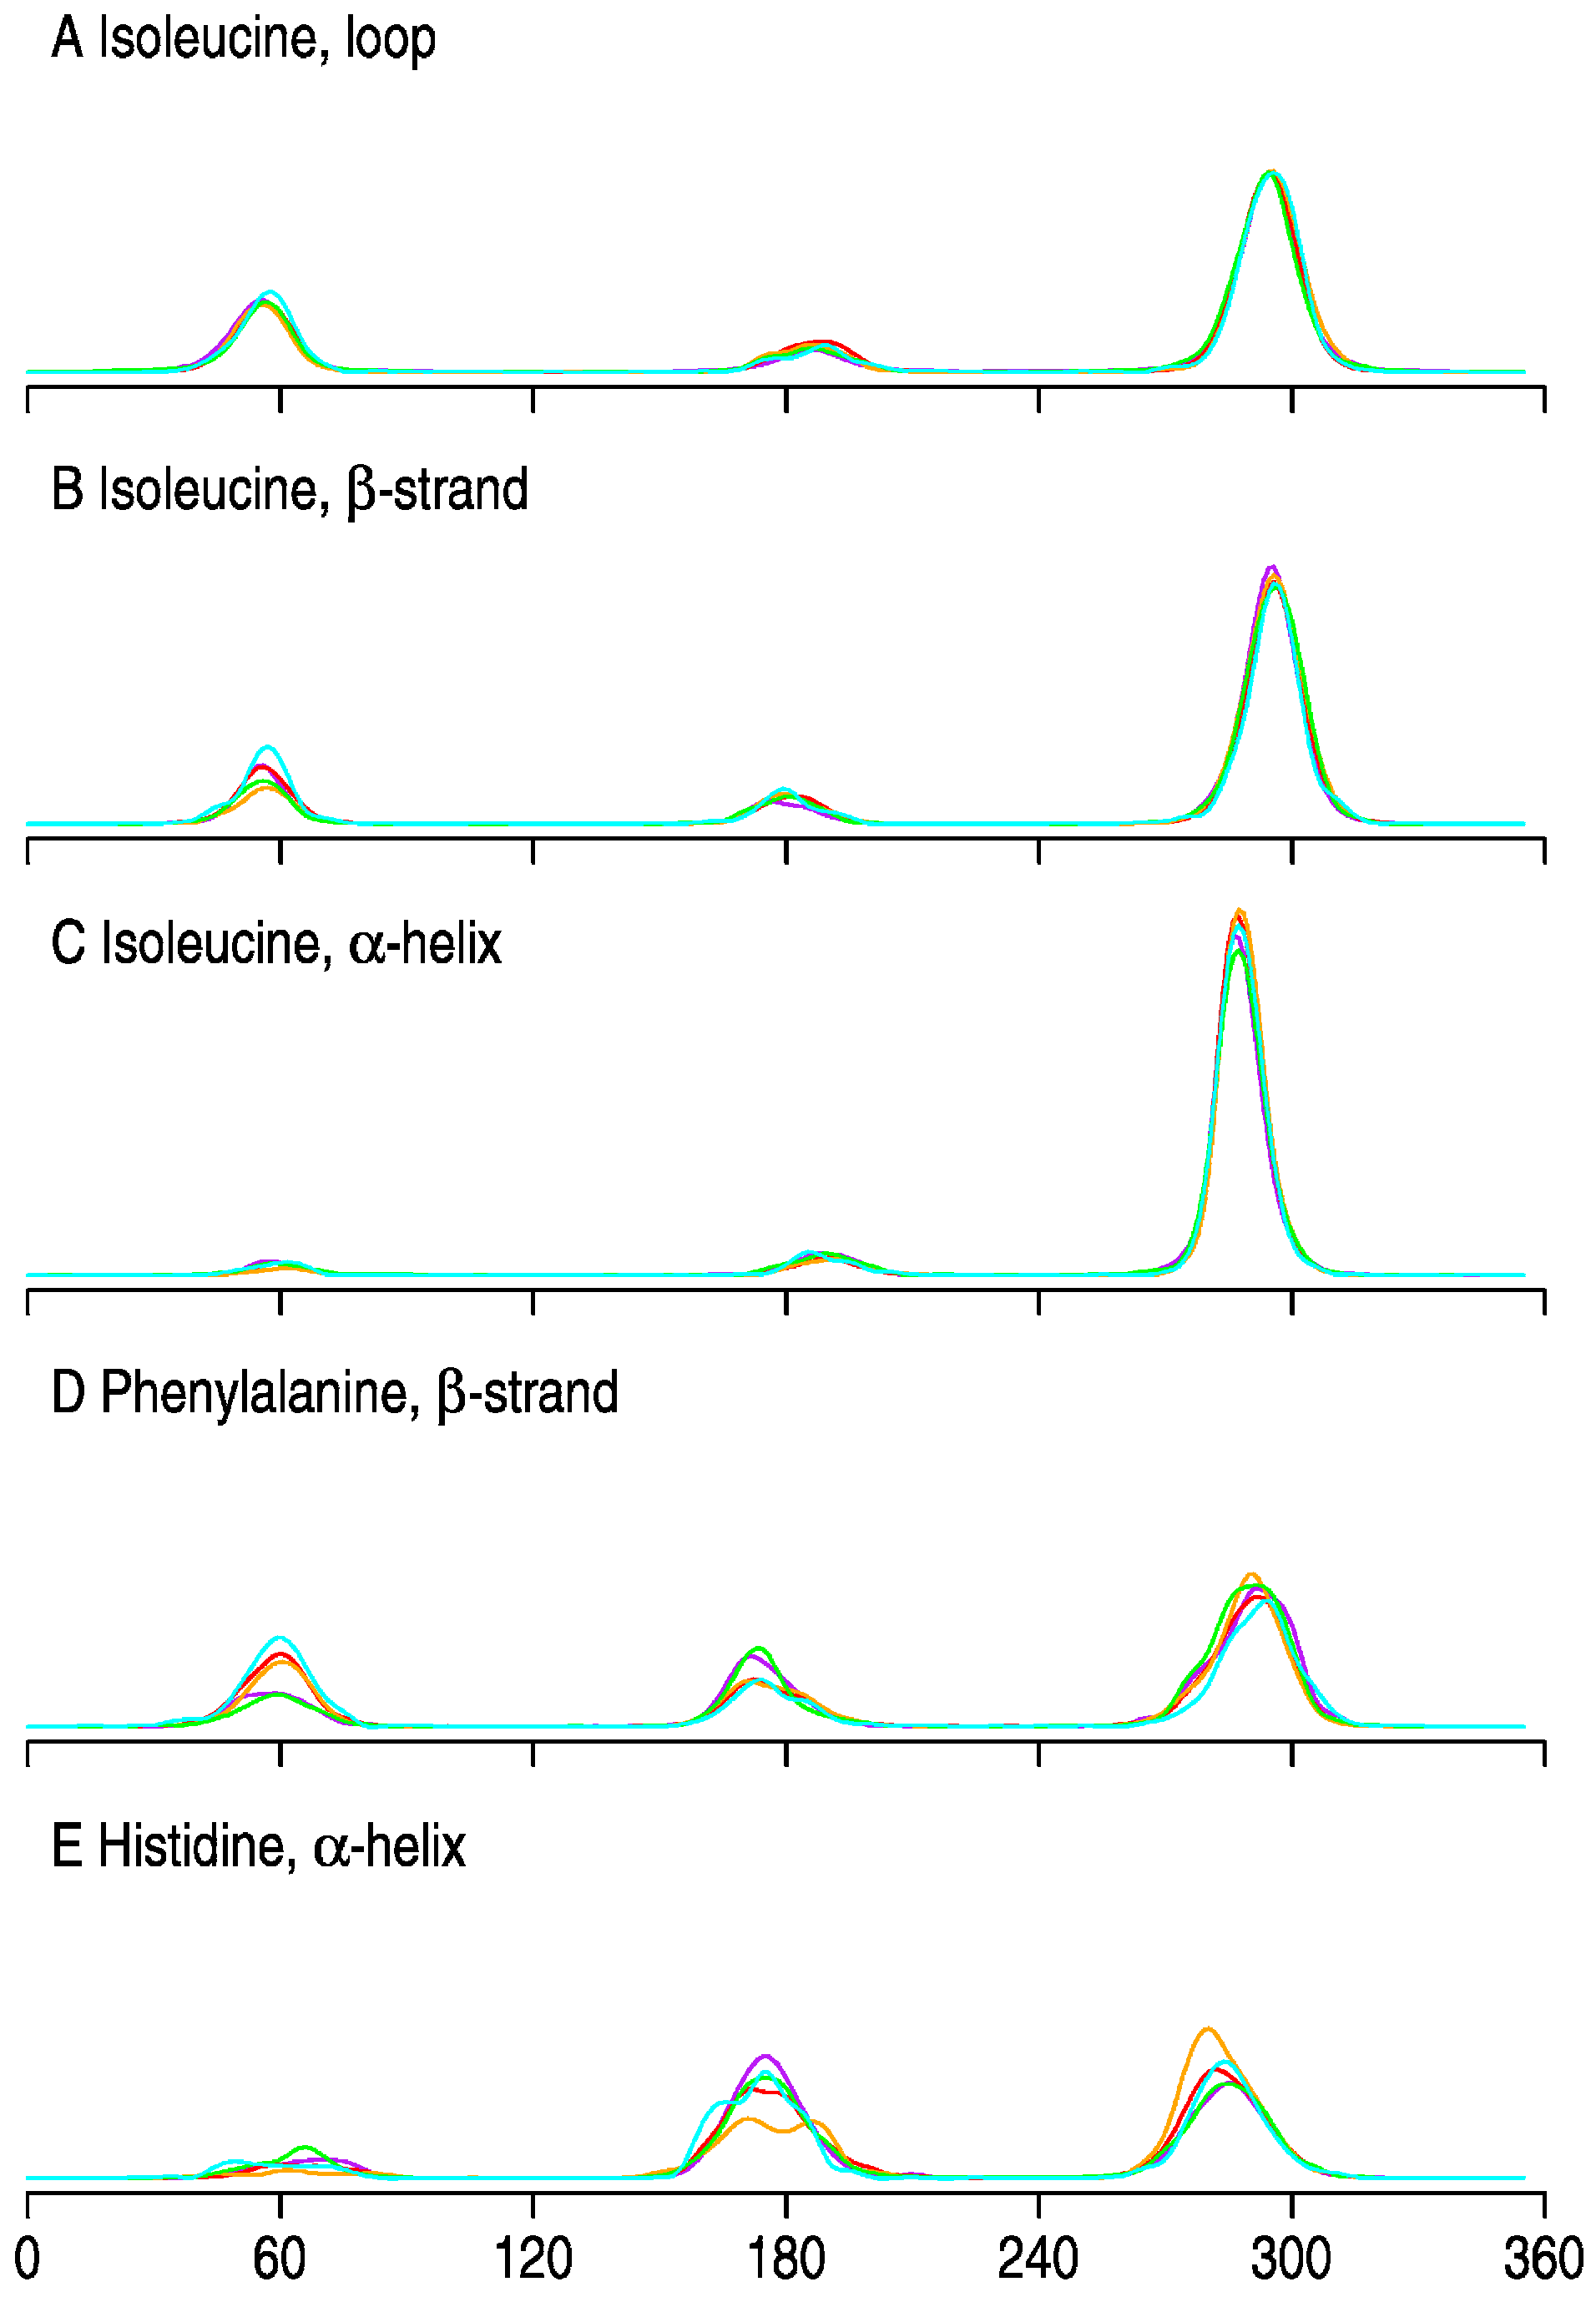
  • Correct versus Wrong. A side chain is said to have the correct rotamer if the χ1 torsion angles of the model and the real structure differ less than 45°.
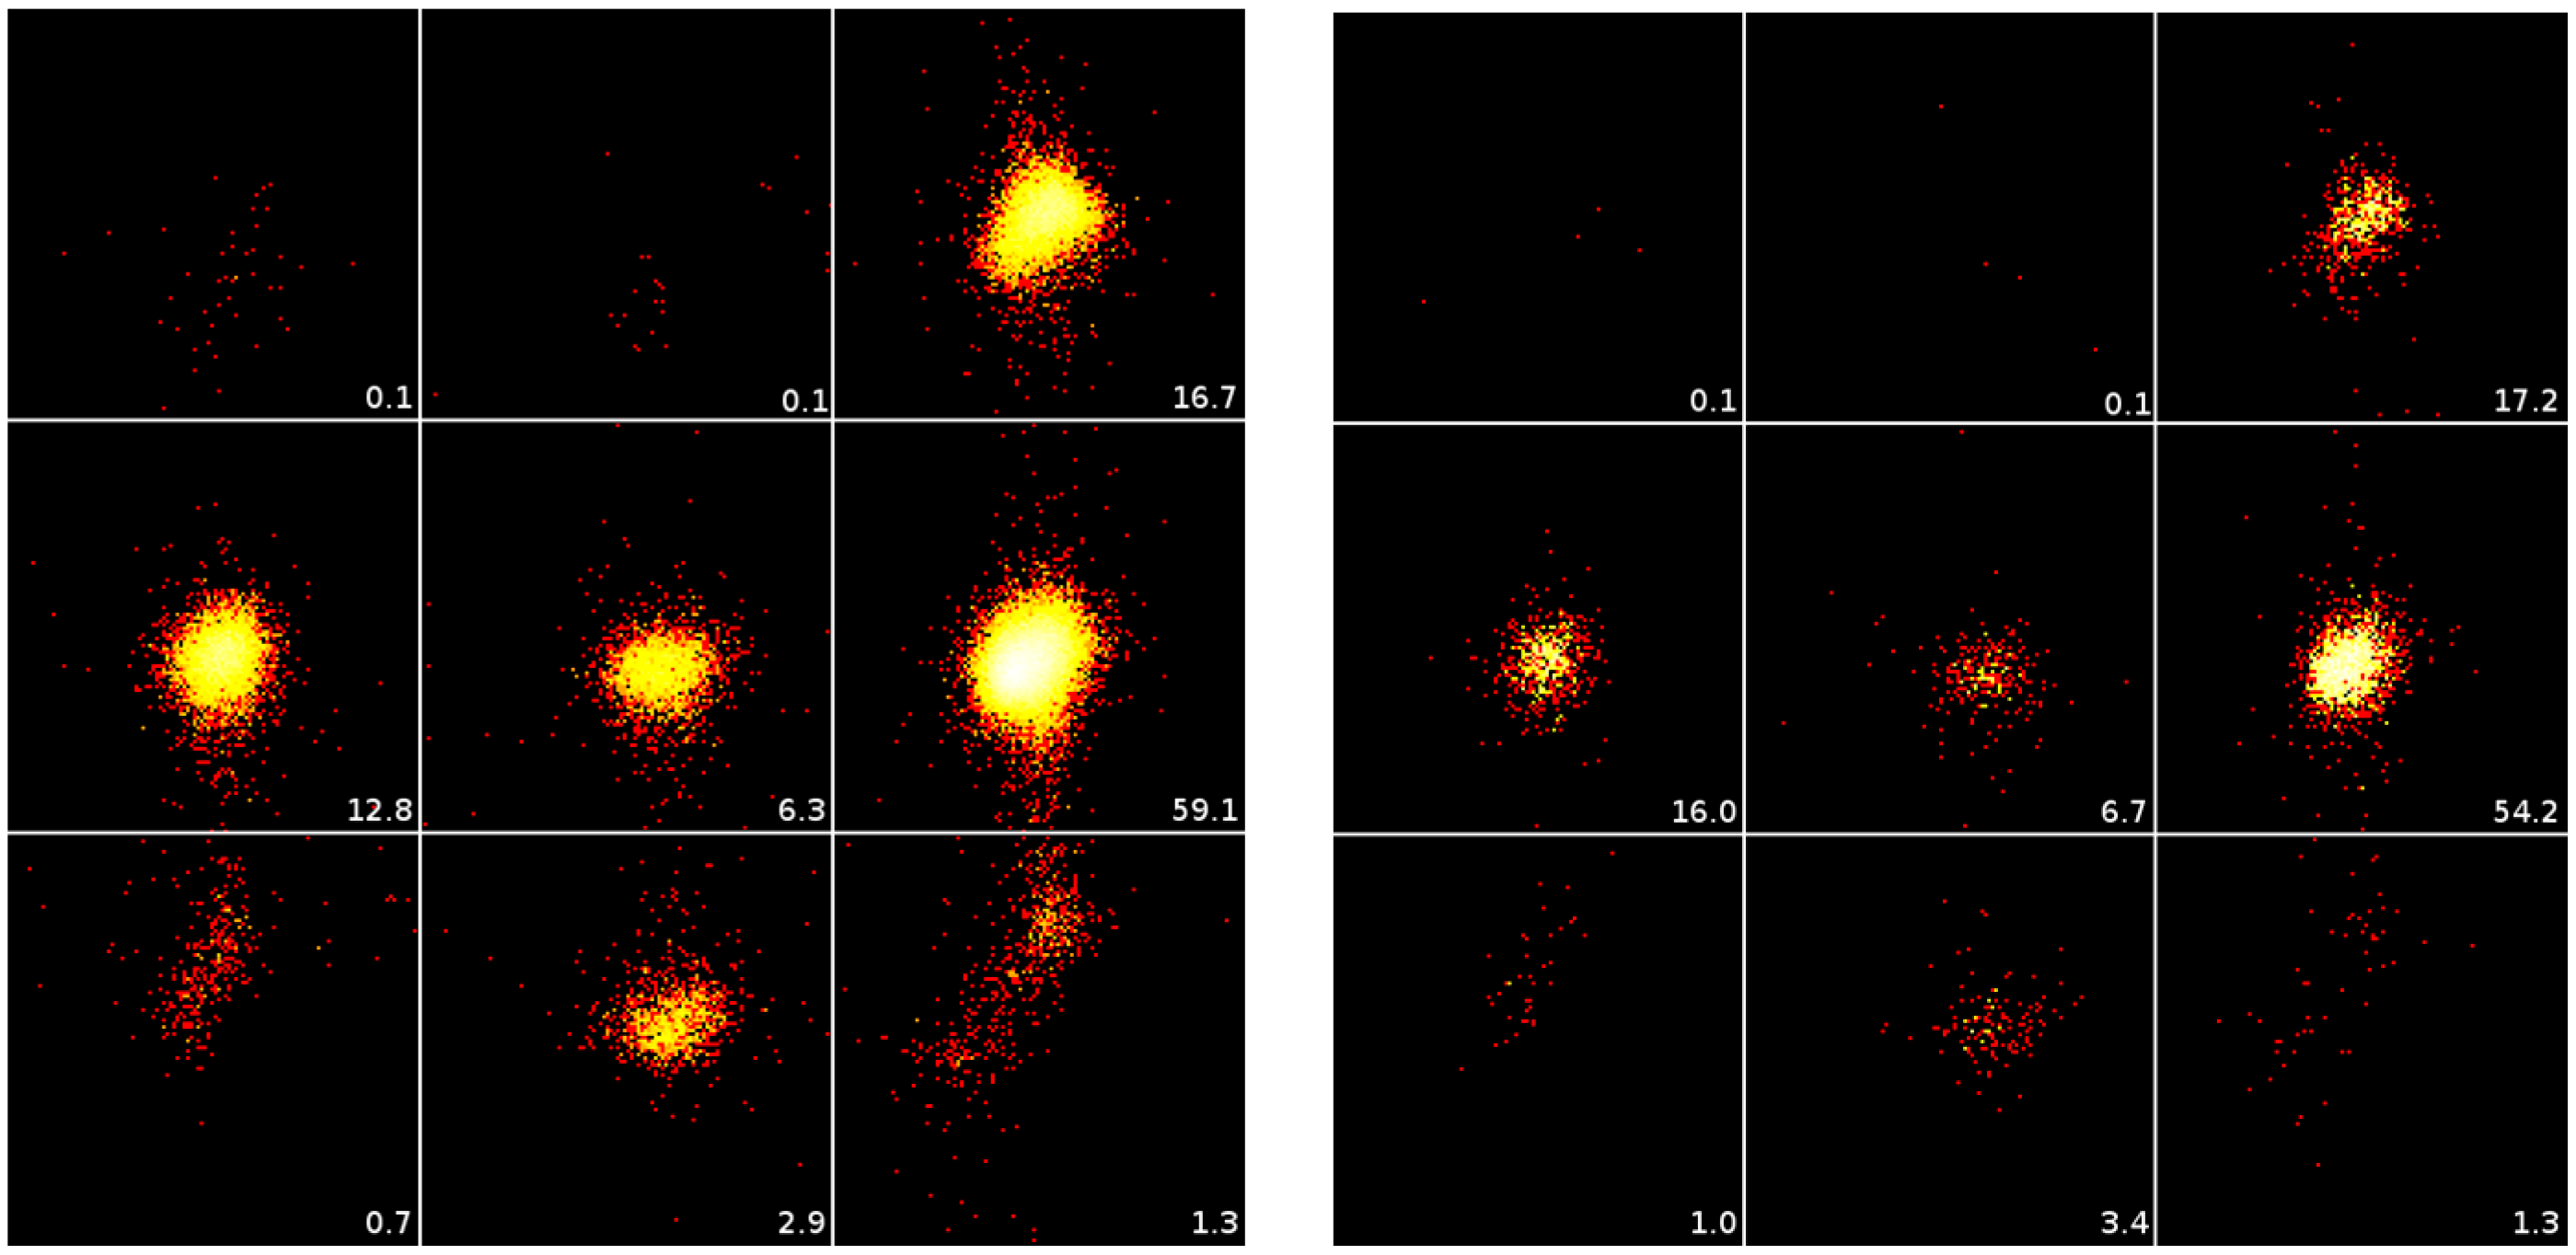
Pairs in which either the template residue or the model residue is a Gly, Ala, or Pro are not included in this study because these three residue types have no (meaningful) χ1 torsion angles.
The predicted numbers of residues in subsets such as “Conserved with Symmetry contacts”, or “Mutated, NoSMC, Wrong” are calculated by multiplying the total number of residue positions with the chances observed for the applicable selectors Conserved, Mutated, SMC, NoSMC, Correct, and/or Wrong.
All pairs of structures and models, and all alignments are available at the associated website: http://swift.cmbi.ru.nl/gv/Dipali/. This web site also holds, as a service to researchers actively working on improving or validating homology modeling software or homology models, several lists of representative protein structures with their sequence, secondary structure, and symmetry contact status indicated, and gives access to lists for all PDB files of residues that make symmetry contacts. The web pages also hold lists that might be useful for bioinformaticians interested in studying the relation between (symmetry) contacts and rotamericity.
All data shown in the introduction are original work, except Figure 4 that was copied with permission from Joosten et al. [41].

3. Results

The influence of crystal packing contacts on the rotameric state of surface-located residues was determined by comparing homology models with the corresponding real structures. The numbers of wrongly modeled and correctly modeled residues were counted as function of the residue conservation and the presence of symmetry contacts in either the template or the real structure (or both). The rationale is that the old WHAT IF modeling module puts great emphasis on the rotamericity of side chains [28,29], and, upon placing side chains does not know about symmetry contacts and thus should model all residues with a similar chance of success. If crystal contacts do not have an influence on the rotamericity, WHAT IF should model residues that do and residues that do not make crystal contacts in either the template or the model (or both) on average similarly well.
79 pairs of structures were selected that could be modeled bi-directionally. This article does not deal with the quality of homology modeling, so neither were any attempts made to evaluate the overall model quality, nor to improve it with YASARA’s homology model optimizer or any similar method [49,50,51]. These 2 × 79 structures were not present in WHAT IF’s database from which it extracts the backbone dependent rotamers. These 2 × 79 structures all were used once as the template, and once as the target structure that should be modeled so that a total of 158 models were available for evaluation.
26,423 residues were compared between the real structures and the corresponding homology models. 111 residues were not considered as they had a (partially) missing side chain in one of the two structures. All analyses thus are based on 26,312 residues. Table 2 shows how these residues are spread over the classes all α, all β, α/β, and α + β which in an indirect way describes how well the four main SCOP [44,45] classes are represented in the dataset. 15,399 of these 26,312 residues are conserved between the structure pairs.
158 homology modeling experiments were performed and analyzed. In each case the real structure that had to be modeled was known so that we can study many characteristics that might influence the correctness of rotamers in the homology models. We studied the correctness of the rotameric states of residues that are either conserved or differ between template and model as function of the presence or absence of symmetry contacts (in either the template or the real structure). Table 3 show the number of residues subdivided in the six categories.
Table 3 shows, for example, that the WHAT IF models have 78.6% of all 26,312 residues in the correct rotameric state. This now includes the conserved and the mutated residues. We counted the residues modeled Wrong and modeled Correct in a series of subclasses (as function of having a symmetry contact or not, or being conserved or mutated). The so-called null-model assumes that all these factors are totally independent. If making symmetry contacts or being conserved or not would have no influence on the chance that the residue gets modeled correct, then we would expect 26,312 × 0.58525 × 0.26501 × 0.78538 = 3205 residues to be conserved and making a symmetry contact in the template, and having the χ1 in the model and the template within 45 degrees. The corresponding preference parameter is then the logarithm of the quotient of the observed and the predicted residue count, which for the above example would become ln(2933/3205) = −0.09. This preference is a combination of the facts that conserved residues are much less likely to make symmetry contacts than non-conserved residues and that conserved residues are more likely to have a correct χ1.
Table 4(A) summarizes the main results. This table shows that if the residue in either the template or in the real structure (or in both) makes symmetry contacts, then there is a preference for the wrong rotamer while the absence of symmetry contacts leads to a preference for the correct rotamer. It is not easy to read this from Table 4(A) and therefore we show in the Table 4(B–D) what the counts look like if the modeling, the symmetry contact, or the residue conservation are removed as sub-category.
It is difficult to consider accessibility, symmetry contacts, and conservation as independent because residues in the core of the protein are more conserved than residues at the surface, and core residues cannot make crystal contacts. We therefore did all calculations several times with different exclusion criteria. The detailed results are available from the associated website (http://swift.cmbi.ru.nl/gv/Dipali/). Excluding all buried residues, or excluding all residues that are buried and those that are marginally surface accessible does change all numbers mentioned in Table 4 a little bit, but it does not change any of the conclusions because all positive preferences remain positive, and vice versa.
In Table 4(B) the Correct/Wrong status of modeling is not taken into account. This table shows that conserved residues have a small preference for not being in symmetry contacts, which makes sense as the conserved residues tend to be away from the part of the surface that is sufficiently accessible for crystal packing contacts. The converse is then obviously true for the mutated residues; these tend to be more often located at the surface than in the core, and thus have a bigger chance of making a symmetry contact in the crystal. In Table 4(C) the Symmetry/No Symmetry status is taken out as sub-category. This table reveals that conserved residues in the model tend to have an almost two times higher preference to have the same χ1 as in the template than mutated residues. Still, many conserved residues have different rotamers in homologous structures. In Table 4(D) Conservation/ Mutation is taken out so that the rotamers between model and template are determined only as a function of the symmetry contact status. This table makes clear that symmetry contacts tend to favor a rotamer difference between the model and the template.
We have also determined the percentage of correctly modeled residues per residue type as function of the SMC/NoSMC status. More than 95% of Tyr, Trp, Phe, Cys, and His are modeled correctly (which is obvious as these residues prefers to be in the core or in the active site) while Ser is modeled in the wrong rotameric state more than any other residue type, independent of its SMC state. Lys, Asn, and Arg are more prone to make crystal contacts while Ile, Val, Cys, and Phe, which are hydrophobic in nature and thus are more often present in the protein interior, are less prone to crystal contacts. These statistics, though, are beyond the scope of this article.
We were challenged by one of the anonymous referees to expand this study to include all PDB files. For this purpose, the PDB_CATALOG (that is freely available at http://www.cmbi.ru.nl/pdb_catalog/) was produced. This web server asks the user for a PDB identifier and it will then align and annotate all PDB chains that share greater than 90% sequence identity with the user’s input file. Unfortunately, PDB files contain too many exceptions that still are hard to detect automatically with today’s software. Problems we ran into are missing ions that should be there and artifactual ions that were added to aid crystallization, loops built next to the real density, chains consisting of nearly only D amino acids, parts of ligands that have the name of amino acids, and dozens more. PDB_REDO and the PDBREPORT database are attempts to solve or at least annotate all these problems, but for the present article that will not help. The PDB_CATALOG, though, is freely available and will probably be useful for a series of other studies.

4. Discussion

In the field of secondary structure prediction we observe that even methods that use only the secondary structure propensity for α-helix and β-strand of each residue type and that do not take anything else into account can achieve prediction accuracies that are higher than fifty percent [52,53]. Such simple methods can work because the aforementioned 1-4 and 1-5 repulsive forces between backbone and side chain atoms work in two directions. Not only does the backbone conformation influence what will be the energetically most favorable side chain conformation, but the side chain and its conformation equally much influence what is the preferred backbone conformation. These interactions between the side chain and the local backbone dominate the choice for side chain rotamers, especially their χ1 angles. Random processes such as packing contacts and contacts with ligands, ions, etc., will modify the rotamer choice.
Everybody in macromolecular crystallography one day or another has the painful realization that most crystals are thermodynamically only marginally stable. There is hardly any net energy involved in growing crystals and thus not in the sum of all crystal packing contacts. Consequently, the total numbers of residues in the energetically most favorable rotamer and in less favorable rotamers must roughly be the same in the free protein and in the crystallized protein. Upon crystallization roughly equally many residues move from a favorable to a non-favorable rotamer as vice versa. When we look at rotamer distributions we indeed see hardly any differences when comparing residues that make symmetry contacts with residues that do not make crystal contacts. This can create the wrong idea that, for example, symmetry contacts have no influence on rotamers.
Measuring rotameric differences directly by looking either at (nearly) identical molecules crystallized in different space groups, or by looking at multiple copies of sequence identical proteins that are asymmetrically packed in the same asymmetric unit in the crystal fail for different reasons. The indirect rotamer comparison using homology modeling, however, shows that individual residue rotameric states often are influenced by crystal packing contacts, but as these contacts tend to randomly influence these rotameric states, the overall distributions stay the same.
When analyzing the quality of placing side chains in homology models, though, we should take into account whether that residue is involved in crystal packing contacts in either the template, or the model, or both. As we have presently no good way to determine which is the best rotamer in cases where crystal packing is involved, it seems best to determine the quality only for cases where no crystal packing is involved. The jurors of the CASP homology modeling section do this, but only for crystal contacts observed in the structure to be predicted. Researchers working on improvement of homology modeling techniques should thus do this too, and not only for residues making crystal packing contacts in the model, but also for residues making contacts in the template(s) used in the modeling process. Further, if a residue not involved in a crystal contact is in contact with a residue that is involved in crystal contacts then the crystal packing artifacts can potentially propagate. If, for example, an algorithm is used that is based on the dead-end elimination theorem [54] then one might perhaps decide to change the order of decisions or to treat dead ends differently if residues are involved that make crystal packing contacts. To aid developers of homology modeling software we made available a series of web servers that provide symmetry contact information for macromolecules (see Figure 5). These symmetry computation facilities are also available [55] as web services (http://wiws.cmbi.ru.nl/help/ and http://wiws.cmbi.ru.nl/wsdl/) so that they can be used directly in third-party software.

Author Contributions

Dipali Singh did most of the modelling and rotamer counting work. Karen R. M. Berntsen produced all data on isoleucine. Coos Baakman provided technical support at the level of web-services, internet access, etc. Tapobrata Lahiri supervised Dipali Singh. Gert Vriend did the programming in WHAT IF and supervised Dipali Singh. Dipali Singh and Gert Vriend wrote the article.

Conflicts of Interest

The authors declare no conflict of interest.

List of Abbreviations

PDBProtein Data Bank
CASPCritical Assessment of protein Structure Prediction
3DThree-Dimensional
SCOPStructural Classification of Proteins
SMCSymmetry Contact
NoSMCNo Symmetry Contact

References

  1. Moult, J.; Pedersen, J.T.; Judson, R.; Fidelis, K. A large-scale experiment to assess protein structure prediction methods. Proteins 1995, 23, ii–v. [Google Scholar] [CrossRef] [PubMed]
  2. Moult, J.; Hubbard, T.; Bryant, S.H.; Fidelis, K.; Pedersen, J.T. Critical assessment of methods of protein structure prediction (CASP): Round II. Proteins 1997, 37, 2–6. [Google Scholar] [CrossRef]
  3. Moult, J.; Hubbard, T.; Fidelis, K.; Pedersen, J.T. Critical assessment of methods of protein structure prediction (CASP): Round III. Proteins 1999, 3, 2–6. [Google Scholar] [CrossRef]
  4. Moult, J.; Fidelis, K.; Zemla, A.; Hubbard, T. Critical assessment of methods of protein structure prediction (CASP): Round IV. Proteins 2001, 5, 2–7. [Google Scholar] [CrossRef] [PubMed]
  5. Moult, J.; Fidelis, K.; Zemla, A.; Hubbard, T. Critical assessment of methods of protein structure prediction (CASP): Round V. Proteins 2003, 53, 334–339. [Google Scholar] [CrossRef] [PubMed]
  6. Moult, J.; Fidelis, K.; Rost, B.; Hubbard, T.; Tramontano, A. Critical assessment of methods of protein structure prediction (CASP): Round VI. Proteins 2005, 61, 3–7. [Google Scholar] [CrossRef] [PubMed]
  7. Moult, J.; Fidelis, K.; Kryshtafovych, A.; Rost, B.; Hubbard, T.; Tramontano, A. Critical assessment of methods of protein structure prediction—Round VII. Proteins 2007, 69, 3–9. [Google Scholar] [CrossRef] [PubMed]
  8. Moult, J.; Fidelis, K.; Kryshtafovych, A.; Rost, B.; Tramontano, A. Critical assessment of methods of protein structure prediction—Round VIII. Proteins 2009, 77, 1–4. [Google Scholar] [CrossRef] [PubMed]
  9. Moult, J.; Fidelis, K.; Kryshtafovych, A.; Tramontano, A. Critical assessment of methods of protein structure prediction—Round IX. Proteins 2011, 79, 1–5. [Google Scholar] [CrossRef] [PubMed]
  10. Zemla, A.; Venclovas, C.; Moult, J.; Fidelis, K. Processing and analysis of CASP3 protein structure predictions. Proteins 1999, 3, 22–29. [Google Scholar] [CrossRef]
  11. Venclovas, C.; Zemla, A.; Fidelis, K.; Moult, J. Criteria for evaluating protein structures derived from comparative modeling. Proteins 1997, 1, 7–13. [Google Scholar] [CrossRef]
  12. Mosimann, S.; Meleshko, R.; James, M.N. A critical assessment of comparative molecular modeling of tertiary structures of proteins. Proteins 1995, 23, 301–317. [Google Scholar] [CrossRef] [PubMed]
  13. Siew, N.; Elofsson, A.; Rychlewski, L.; Fischer, D. MaxSub: An automated measure for the assessment of protein structure prediction quality. Bioinformatics 2000, 16, 776–785. [Google Scholar] [CrossRef] [PubMed]
  14. Zhang, Y.; Skolnick, J. Scoring function for automated assessment of protein structure template quality. Proteins 2004, 57, 702–710. [Google Scholar] [CrossRef] [PubMed]
  15. Ortiz, A.R.; Strauss, C.E.; Olmea, O. MAMMOTH (matching molecular models obtained from theory): An automated method for model comparison. Protein Sci. 2002, 11, 2606–2621. [Google Scholar] [CrossRef] [PubMed]
  16. Kryshtafovych, A.; Milostan, M.; Szajkowski, L.; Daniluk, P.; Fidelis, K. CASP6 data processing and automatic evaluation at the protein structure prediction center. Proteins 2005, 61, 19–23. [Google Scholar] [CrossRef] [PubMed]
  17. Cozzetto, D.; Kryshtafovych, A.; Fidelis, K.; Moult, J.; Rost, B.; Tramontano, A. Evaluation of template-based models in CASP8 with standard measures. Proteins 2009, 77, 18–28. [Google Scholar] [CrossRef] [PubMed]
  18. Olechnovic, K.; Kulberkyte, E.; Venclovas, C. CAD-score: A new contact area difference-based function for evaluation of protein structural models. Proteins 2013, 81, 149–162. [Google Scholar] [CrossRef] [PubMed]
  19. Zemla, A.; Venclovas, C.; Moult, J.; Fidelis, K. Processing and evaluations of predictions in CASP4. Proteins 2001, 5, 13–21. [Google Scholar] [CrossRef] [PubMed]
  20. Boltzmann Distribution. Available online: https://en.wikipedia.org/wiki/Boltzmann_distribution (accessed on 1 November 2017).
  21. McGregor, M.J.; Islam, S.A.; Sternberg, M.J. Analysis of the relationship between side chain conformation and secondary structure in globular proteins. J. Mol. Biol. 1987, 198, 295–310. [Google Scholar] [CrossRef]
  22. Chakrabarti, P.; Pal, D. Main-chain conformation features at different conformations of the side-chains in proteins. Protein Eng. 1998, 11, 631–647. [Google Scholar] [CrossRef] [PubMed]
  23. Janin, J.; Wodak, S.; Levitt, M.; Maigret, B. Conformation of amino acid side chains in proteins. J. Mol. Biol. 1978, 125, 357–386. [Google Scholar] [CrossRef]
  24. Benedetti, E.; Morelli, G.; Nemethy, G.; Scheraga, H.A. Statistical and energetic analysis of side-chain conformations in oligopeptides. Int. J. Peptide Protein Res. 1983, 22, 1–15. [Google Scholar] [CrossRef]
  25. Ramachandran, G.N.; Ramakrishnan, C.; Sasisekharan, V. Stereochemistry of polypeptide chain configurations. J. Mol. Biol. 1963, 7, 95–99. [Google Scholar] [CrossRef]
  26. Dunbrack, R.L., Jr.; Karplus, M. Conformational analysis of the backbone-dependent rotamer preferences of protein sidechains. Nat. Struct. Mol. Biol. 1994, 1, 334–340. [Google Scholar] [CrossRef]
  27. Jones, T.A.; Thirup, S. Using known substructures in protein model building and crystallography. EMBO J. 1986, 5, 819–822. [Google Scholar] [PubMed]
  28. De Filippis, V.; Sander, C.; Vriend, G. Predicting local structural changes that result from point mutations. Protein Eng. 1994, 7, 1203–1208. [Google Scholar] [CrossRef] [PubMed]
  29. Chinea, G.; Padron, G.; Hooft, R.W.W.; Sander, C.; Vriend, G. The use of position-specific rotamers in model building by homology. Proteins 1995, 23, 415–421. [Google Scholar] [CrossRef] [PubMed]
  30. Dunbrack, R.L., Jr.; Karplus, M. Backbone-dependent rotamer library for proteins. Application to side-chain prediction. J. Mol. Biol. 1993, 230, 543–574. [Google Scholar] [CrossRef] [PubMed]
  31. Hilbert, M.; Böhm, G.; Jaenicke, R. Structural relationships of homologous proteins as a fundamental principle in homology modeling. Proteins Struct. Funct. Bioinform. 1993, 17, 138–151. [Google Scholar] [CrossRef] [PubMed]
  32. Chothia, C.; Lesk, A.M. The relation between the divergence of sequence and structure in proteins. EMBO 1986, 5, 823–826. [Google Scholar]
  33. Rodriguez, R.; Chinea, G.; Lopez, N.; Pons, T.; Vriend, G. Homology modeling, model and software evaluation: Three related resources. Bioinformatics 1998, 14, 523–528. [Google Scholar] [CrossRef] [PubMed]
  34. Marti-Renom, M.A.; Stuart, A.C.; Fiser, A.; Sanchez, R.; Melo, F.; Sali, A. Comparative protein structure modelling of genes and genomes. Annu. Rev. Biophys. Biomol. Struct. 2000, 29, 291–325. [Google Scholar] [CrossRef] [PubMed]
  35. Vásquez, M. Modeling side-chain conformation. Curr. Opin. Struct. Biol. 1996, 6, 217–221. [Google Scholar] [CrossRef]
  36. Wilson, C.; Gregoret, L.M.; Agard, D.A. Modeling Side-chain Conformation for Homologous Proteins Using an Energy-based Rotamer Search. J. Mol. Biol. 1993, 229, 996–1006. [Google Scholar] [CrossRef] [PubMed]
  37. Chung, S.Y.; Subbiah, S. How similar must a template protein be for homology modeling by side-chain packing methods? Pac. Symp. Biocomput. 1996, 126–141. [Google Scholar]
  38. Dunbrack, R.L., Jr. Rotamer libraries in the 21st century. Curr. Opin. Struct. Biol. 2002, 12, 431–440. [Google Scholar] [CrossRef]
  39. Sali, A.; Blundell, T.L. Comparative protein modelling by satisfaction of spatial restraints. J. Mol. Biol. 1993, 234, 779–815. [Google Scholar] [CrossRef] [PubMed]
  40. Schmidt, M.W.; Baldridge, K.K.; Boatz, J.A.; Elbert, S.T.; Gordon, M.S.; Jensen, J.H.; Koseki, S.; Matsunaga, N.; Nguyen, K.A.; Su, S.J.; et al. General Atomic and Molecular Electronic Structure System. J. Comput. Chem. 1993, 14, 1347–1363. [Google Scholar] [CrossRef]
  41. Joosten, R.P.; Chinea, G.; Kleywegt, G.J.; Vriend, G. Validation of protein structure models. In Comprehensive Medicinal Chemistry II; Taylor, J., Triggle, D., Eds.; Elsevier: Oxford, UK, 2007; Volume 3, pp. 507–530. [Google Scholar]
  42. Berntsen, K.R.M.; Vriend, G. Anomalies in the refinement of isoleucine. Acta Crystallogr. D 2014, 70, 1037–1049. [Google Scholar] [CrossRef] [PubMed]
  43. Bower, M.J.; Cohen, F.; Dunbrack, R.L. Prediction of protein side-chain rotamers from a backbone-dependent rotamer library: A new homology modeling tool. J. Mol. Biol. 1997, 267, 1268–1282. [Google Scholar] [CrossRef] [PubMed]
  44. Murzin, A.G.; Brenner, S.E.; Hubbard, T.; Chothia, C. SCOP: A structural classification of proteins database for the investigation of sequences and structures. J. Mol. Biol. 1995, 247, 536–540. [Google Scholar] [CrossRef]
  45. Conte, L.L.; Ailey, B.; Hubbard, T.; Brenner, S.E.; Murzin, A.G.; Chothia, C. SCOP: A structural classification of proteins database. Nucleic Acids Res. 2000, 28, 257–259. [Google Scholar] [CrossRef] [PubMed]
  46. Vriend, G.; Sander, C. Detection of common three-dimentional substructures in protein. Proteins 1991, 11, 52–58. [Google Scholar] [CrossRef] [PubMed]
  47. Vriend, G. WHAT IF: A molecular modelling and drug design program. J. Mol. Graph. 1990, 8, 52–56. [Google Scholar] [CrossRef]
  48. Krieger, E.; Vriend, G. YASARA View—Molecular graphics for all devices—From smartphones to workstations. Bioinformatics 2014, 30, 2981–2982. [Google Scholar] [CrossRef] [PubMed]
  49. Krieger, E.; Koraimann, G.; Vriend, G. Increasing the precision of comparative models with YASARA NOVA—A self-parameterizing force field. Proteins 2002, 47, 393–402. [Google Scholar] [CrossRef] [PubMed]
  50. Lindorff-Larsen, K.; Piana, S.; Palmo, K.; Maragakis, P.; Klepeis, J.L.; Dror, R.O.; Shaw, D.E. Improved side-chain torsion potentilas for the Amber ff99SB protein force field. Proteins 2012, 78, 1950–1958. [Google Scholar]
  51. Scouras, A.D.; Daggett, V. The Dynameomics rotamer library: Amino acid side chain conformations and dynamics from comprehensive molecular dynamics simulations in water. Protein Sci. 2011, 20, 341–352. [Google Scholar] [CrossRef] [PubMed]
  52. Chou, P.Y.; Fasman, G.D. Prediction of the protein conformation. Biochemistry 1974, 13, 222–245. [Google Scholar] [CrossRef] [PubMed]
  53. Chou, P.Y.; Fasman, G.D. Conformational parameters for amino acids in helical, beta-sheet and random coil regions calculated from proteins. Biochemistry 1974, 13, 211–222. [Google Scholar] [CrossRef] [PubMed]
  54. Desmet, J.; de Maeyer, M.; Hazes, B.; Lasters, I. The dead-end elimination theorem and its use in protein side-chain positioning. Nature 1992, 356, 539–542. [Google Scholar] [CrossRef] [PubMed]
  55. Hekkelman, M.L.; Beek, T.A.T.; Pettifer, S.R.; Thorne, D.; Attwood, T.K.; Vriend, G. WIWS: A protein structure bioinformatics Web service collection. Nucleic Acids Res. 2010, 38, W719–W723. [Google Scholar] [CrossRef] [PubMed]
Figure 1. Frequency distribution of valine in a strand as function of the torsion angle χ1. The red line represents actual frequencies observed in a subset of PDB files solved by crystallography at 1.8 Å resolution or better (with an R-factor of 0.18 or better) that was culled at 90% sequence identity. 26,028 valines contributed to the red line. The black line represents the negated exponential of the energy as calculated with Gamess-US [40] using the 6-31g** basis set and the DFT b3lip energy model. Vertical scales are arbitrary. The small differences in the locations of the maxima of the g+ and g− peaks are caused by the fact that the experimentally observed valines are found in-between other residues so that also 1-5 repulsive forces act on the Cγ atoms while the predicted distribution is calculated for an isolated valine in vacuum.
Symmetry 10 00025 g001
Figure 2. χ1 frequency plots for residues with or without symmetry contacts (S+ or S−, respectively) and with various solvent accessibilities. Residues are called buried when their total accessible molecular surface area is less than 0.25 square Ångstrøm, accessible when this area is larger than 10.0 square Ångstrøm, and otherwise intermediate. The abscissas run from 0° to 360°.
Symmetry 10 00025 g002
Figure 3. The number of contacts made by pairs of loops related by non-crystallographic symmetry (i.e., in the same asymmetric unit). Two residues are called in contact when at least one pair of atoms has less than 0.35 Ångstrøm space between their Van de Waals’ radii. The number of contacts made by the one loop is listed on the first axis, the number of contacts made by the other loop on second one. The vertical axis represents the number of times an event with those numbers of counts are observed in a dataset of nearly 2500 protein structures selected to have no pairwise similarity greater than 30%. Only pairs of loops are counted that share less than 33% identical contacts, which explains the enrichment along the first two axes. The strong enrichment along diagonal of the first two axes has hitherto remained unexplained, but it causes difficulties when trying to study the effect of symmetry packing in the most direct way by comparing the same protein solved in different space groups, or in different multimeric complexes. Loops that are involved in crystal packing often prefer a certain number of contacts and easily adjust their backbone conformation to achieve those contacts. Backbone modifications, however, make it impossible to study side chain conformations as the backbone conformation (as is illustrated, for example, in Figure 2) is the largest determinant for the side chain rotamer choice. Figure copied with permission from ref [41].
Symmetry 10 00025 g003
Figure 4. χ1-χ2 distribution of isoleucine. Left: isoleucines that do not make a symmetry contact. Right: isoleucines involved in crystal packing contacts. Both plots are subdivided in nine sections of 120 × 120 degrees. χ1,χ2 = 0,0 is in the bottom left corner and χ1,χ2 = 360,360 in the top right, so the most populated square is for χ1 = 300+/−60° and χ2 = 180+/−60° or in other words the gauche- rotamer with χ2 around 180°. The white numbers indicate the percentage of all isoleucines of the whole 3 × 3 sections observed in that section.
Symmetry 10 00025 g004
Figure 5. The WHAT IF web-servers at http://swift.cmbi.ru.nl/ provide a series of options to analyze and/or visualize symmetry contacts in PDB files. These servers can deal with either 4-letter identifiers of proteins present in the PDB or actual coordinate files in PDB format.
Symmetry 10 00025 g005
Table 1. Percentage of surface exposed residues that make a symmetry contact in PDB files as function of the residue type. About 11,000 PDB files were selected that all were solved by X-ray at better than 2.5 Å resolution and that contained exactly two covalently identical (normally NCS related) molecules in the asymmetric unit. A subset of this list lied at the basis of Figure 3. Residues are called surface exposed if their solvent accessible molecular surface is >10 Å [2] (accessible surface areas are calculated in the absence of symmetry contacting molecules). Two atoms are called “in contact” if the distance between their Van der Waals surfaces is less than 1.4 Å (which is half the diameter of a water molecule). This table merely indicates that symmetry contacts are common.
ResidueX-Contact %
Arg27.1
Lys24.3
Gln24.1
Glu22.9
Asn20.8
Pro20.2
His20.0
Asp19.0
Thr17.3
Ser16.7
Tyr16.6
Trp16.0
Met14.3
Gly13.6
Phe12.4
Ala12.2
Leu11.5
Val10.1
Ile9.8
Cys6.4
Table 2. Distribution of the residues over the four main SCOP classes. The 2 × 79 proteins were placed in one these four classes and their residues were counted and added-up per class.
Total = 26,312
αβα/βα + β
5503807175375201
Table 3. Number of residues and percentage of the 26,312 residues in each of the six categories. The last digit in the percentages is not significant, but is left in so that calculations, when repeated, produce minimal rounding errors.
CategoryNumberPercentage
Conserved15,39958.5
Mutated10,91341.4
SMC697326.5
NoSMC19,33973.4
Correct20,66578.5
Wrong564721.4
Table 4. Observed and predicted number of correctly and wrongly modeled side chains as function of residue conservation and symmetry contact. The right-hand column lists the preference parameters P = ln (fobserved/fpredicted) (A); As A, but wrong and correctly modeled residues taken together (B); As A, but with the symmetry status taken out (C); As A, but with the conservation taken out (D).
A(Sub-)CategoryObservedPredictedPreference
ConservedSMCCorrect29333205−0.09
Wrong536876−0.49
NoSMCCorrect11,1088889+0.22
Wrong8222429−1.08
MutatedSMCCorrect20562271−0.10
Wrong1448621+0.85
NoSMCCorrect45686299−0.32
Wrong28411721+0.50
BWithout Modeling ObservedPredictedPreference
ConservedSMC 34694081−0.16
NoSMC 11,93011,318+0.05
MutatedSMC 35042892+0.19
NoSMC 74098021−0.08
C Without SymmetryObservedPredictedPreference
Conserved Correct14,04112,094+0.15
Wrong13583305−0.89
Mutated Correct66248571−0.26
Wrong42892342+0.60
D Without ConservationObservedPredictedPreference
SMC Correct49895476−0.09
Wrong19841497+0.28
NoSMC Correct15,67615,189+0.03
Wrong36634150−0.12

