Abstract
Important information about the state dynamics of the brain during anesthesia is unraveled by Electroencephalogram (EEG) approaches. Patterns that are observed through EEG related to neural circuit mechanism under different molecular targets dependent anesthetics have recently attracted much attention. Propofol, a Gamma-amino butyric acid, is known with evidently increasing alpha oscillation. Desflurane shares the same receptor action and should be similar to propofol. To explore their dynamics, EEG under routine surgery level anesthetic depth is analyzed using multitaper spectral method from two groups: propofol (n = 28) and desflurane (n = 23). The time-varying spectrum comparison was undertaken to characterize their properties. Results show that both of the agents are dominated by slow and alpha waves. Especially, for increased alpha band feature, propofol unconsciousness shows maximum power at about 10 Hz (mean ± SD; frequency: 10.2 ± 1.4 Hz; peak power, −14.0 ± 1.6 dB), while it is approximate about 8 Hz (mean ± SD; frequency: 8.3 ± 1.3 Hz; peak power, −13.8 ± 1.6 dB) for desflurane with significantly lower frequency-resolved spectra for this band. In addition, the mean power of propofol is much higher from alpha to gamma band, including slow oscillation than that of desflurane. The patterns might give us an EEG biomarker for specific anesthetic. This study suggests that both of the anesthetics exhibit similar spectral dynamics, which could provide insight into some common neural circuit mechanism. However, differences between them also indicate their uniqueness where relevant.
1. Introduction
General anesthesia has been widely recognized as standard procedure in modern medical surgeries for thousands of patients every day [1,2]. This kind of anesthetic-induced and reversible unconsciousness state is known to be manipulated by anesthesiologists, bringing many benefits to humans, undoubtedly. Surprisingly, even with increasingly rich knowledge about anesthetic molecular pharmacology and clinical behavior, the underlying neural interaction circuit mechanisms for patient’s consciousness is still far from being fully understood [3]. In practice, experienced anesthesiologists observe the vital signals of the patient (e.g., heart rate, breathing, blood pressure, sweating, etc.) to control the doses delivery of anesthetics [4]. The reliance on skill and attention of the anesthesiologist poses a risk to guarantee the anesthesia safety and evokes some adverse challenges like emergence delirium [5], cognitive dysfunction [6] and postoperative mortality [7,8]. Therefore, a comprehensive understanding of the complex interactions of neurons that occur on temporal scales under different categories of drugs could provide a bridge for integrative processes that are more directly linked to the state of consciousness. Consequently, this would contribute much to anesthetic administration to reach better clinical control and patient experience. Normally, there is a disruption between the neural communications during loss of consciousness (LOC). Anesthetics alter the oscillations that are produced by the brain during normal information processing [9,10].
Electroencephalogram (EEG), as measured from electrical potential in cortex, is now growing to be employed to relate drug-specific oscillations to clinically desired states [1]. Part of the reason might be that the general anesthesia is induced by anesthetics acting on the spinal cord, stem, and cortex in brain [11,12]. EEG patterns might provide useful relevant inspiration [13]. It is known that central nervous relies on the spike or action potential transmission and reception by neurons to process the brain information [14]. Subcortical regions, such as the thalamus, produce much smaller potentials that are more difficult to detect. However, scalp EEG patterns reflect the states of both cortical and subcortical structures because cortical and subcortical structures are richly interconnected [15]. EEG is the most pervasively noninvasive signal that reflects the brain communication and states. These neurophysiological studies in adults have led to the idea of using the EEG and its spectrogram as an alternative to using EEG-derived indices to monitor the brain states of adults receiving general anesthesia or sedation circumstance [4,16]. As for the spectral analysis method of nonlinear and nonstationary signals, except the traditional periodogram, there are some newly developed ones, like empirical mode decompositions (EMD) [17], which is computed through the iterative extraction of intrinsic mode function and followed by Hilbert transform to compute the spectrum. In addition, multicomponent amplitude modulation-frequency modulation (AM–FM) representation is based on extraction of the iterated application of the Hilbert transform derived Gabor signal [18], and then experiences the exact computation of the amplitude and associated phase. It has been frequently applied to simulated synthetic signal and practical speech data in comparison with the state of the art methods [18], and electromyography (EMG) [19], which is used to evaluate muscle fatigue, and even mystery curves [20] or EEG, and so forth. Problems with these EEG-based indices exist although with the simplicity and early successes in reducing the amount of anesthetic agents administered. In practice, these indices can vary substantially from clinical assessments of consciousness [21]. For example, two main indices derived from EEG are the Bispectral index (BIS) (Aspect Medical Systems, Newton, MA, USA) [22] and Entropy family (GE Healthcare, Helsinki, Finland) [23] have been used as index of depth of anesthesia somehow although with some deficiencies in certain and show limited efficacy. Besides, it is not sufficient to assess the anesthesia status form autonomic and motor responses alone (i.e., verbal or stimuli response), since these responses may reflect spinal and brainstem actions, rather than specific cortical processing of nociceptive stimuli, which is a prerequisite for the experience of pain. Therefore, EEG recordings obtained during routine clinical care, and relate neurophysiological findings to the behavioral state encountered and putative neural circuit mechanisms. It has been found that this approach is effective for providing substantial insights into the mechanisms of anesthetic action [21,24].
Anesthetic agents mainly rely on enhancing the activity of inhibitory cells or suppress the activity of excitatory cells. Gamma-amino butyric acid (GABA) and N-methyl-d-aspartate (NMDA) are the two common receptors that anesthetic acts on [1,25]. Among them, GABA dependent anesthetics are mostly applied practically. Propofol, one of the mostly widely administrated intravenous drugs, primarily acts on GABA receptors to enhance inhibition [25,26]. Due to GABAergic inhibitory interneurons widely distribution throughout the cortex, thalamus, brainstem, and spinal cord, propofol induces changes rapidly and precisely in arousal at multiple sites [26]. Therefore, it is adopted as both an induction agent for the sedation and maintenance one of general anesthesia. By contrast, desflurane serves as one of commonly used inhaled anesthetics clinically. It can solely maintain all of the required behavioral and physiological characteristics of general anesthesia without adjunct. It owns advantage of faster onset and offset of anesthesia as compared with older inhaled anesthetics like halothane and isoflurane [27]. It also appears to exert a more rapid recovery because of its pharmacological properties. Desflurane is thought to be GABA agonist as well. Unconsciousness under propofol is characterized in the electroencephalogram by alpha (8 to 12 Hz) oscillations that are coherent across the frontal cortex, delta (1 to 4 Hz) oscillations [1,15,28]. Intuitively, it arouses interests in EEG dynamics comparisons between them. Their features should behave similarly in some aspects, and it is also worthwhile to find something that varies between them.
To explore the unknown underlying properties, an observational study is performed to record intraoperative prefrontal electroencephalogram in patients undergoing general anesthesia with desflurane and propofol separately. The features for these two anesthetics during anesthesia are characterized using time-varying spectral method.
2. Materials and Methods
2.1. Ethical Statement
All of the studies were approved by the Research Ethics Committee, National Taiwan University Hospital, Taiwan and written informed consent was also obtained from patients (No. 201302078RINC). All the other efforts were made to keep the hospital surgeries running regularly.
2.2. Patients and Surgeries
Patients that were involved in this study were recruited from NTUH. Ineligible participants were excluded if they were under 22 years old, diagnosed with a neurological or cardiovascular disorder, under the local anesthesia, instead of a general one or a history of obstructive sleep apnea and problems with anesthesia. According to the criteria, there were 28 patients for propofol group and 23 patients for desflurane. Their demographics, such as height, weight, age, and gender are acquired, which are detailed in Table 1, respectively. The surgery lasts from 30 min to 4 h regularly. It is widely classified into three conditions: awake, maintenance (i.e., LoC), and recovery. Patients need to keep limosis for at least 8 h ahead of operations. Then, each patient received the appropriate volume of anesthetic agents to start. Unconsciousness is commonly induced by intravenous propofol, together with other adjunct analgesia drug like fentanyl or muscle relaxant medicine like nimbex. For maintenance, desflurane together with air and oxygen are employed by covering a mask for one group, while propofol is used for the other one. General anesthesia was performed safely by monitoring the physiological signals, like electrocardiography (ECG), photoplethysmography (PPG), EEG and also the intermittent vital signs of blood pressure (BP), heart rate (HR), pulse rate (PR), pulse oximeter oxygen saturation (SpO2), etc. If any observation signal changes irregularly, doctors will intervene and manipulate the procedure appropriately.

Table 1.
Demography of involved patients.
2.3. Data Recording
All of the patients achieve level 0 to conduct the surgery the MOAA/S in Table 2. Patients’ physiological status is monitored by MP60 anesthetic machine (Philips, Andover, MA, USA). Sensors such pulse oximetry, ECG sensor, and blood pressure cuff are set up when patients are awake. The vital signs (Heart Rate, SpO2, Pulse Rate, and Blood Pressure) play an important role in anesthesiologists’ assessment of DoA along with medical decisions in clinical practice. Auditory stimuli and verbal response were conducted to verify fully anesthetized during the study as well. For EEG recording, conductive paste is used to optimize contact between the frontal scalp skin and EEG sensor BIS™ Quatro Sensor (Aspect Medical Systems, Newton, MA, USA) with low impedance under 5k ohm. EEG sensor is connected to MP60, as well through BIS module. Raw EEG continuous waveform data, including the routine signals mentioned above, were recorded onto a laptop via serial port RS-232 using the collection software developed by Borland C++ Builder 6 developing environment kit (Borland Company, Austin, TX, USA). The sampling rate of EEG and PPG continuous waveform is 128 Hz. The intermittent vital signs, such as BIS, HR, PR, BP, and SPO2 are recorded every 5 s.

Table 2.
Modified Observer’s Assessment of Alertness/Sedation Scale.
2.4. EEG Data Preprocessing
All of the clinical administration information and physiological data were well sorted, including converting data format, labeling the event timing, etc. EEG data segments were selected using information from the electronic anesthesia record to guarantee the correct representative epochs for unconscious states. The anesthetized state was assessed by MOAA/S standard (i.e., level 0 seen Table 2). First, 2-min EEG segments were selected from all the subjects during the awake, eyes-closed baseline (Eye closure could facilitate the purity of EEG). Then, for desflurane and propofol unconsciousness period during the surgery, data segments were selected in the middle of the surgery procedure, thus assuring the fully anesthetized state. Normally, the timing is more than 10 min after the onset of unconsciousness. Once the patients begin response at level 1 or 2, epoch would be chosen afterwards as the recovery stage. All the cases data were then visually inspected to abandon the specific segments of contamination triggered by EOG, EMG, and line noise and body or head movement during surgery. Then, z-score normalization was applied to all of the data epochs.
2.5. Spectral Analysis
Power spectrum quantifies the energy distribution over frequency within a signal. The time-varying spectrum is termed as spectrogram. For pattern recognition, segmentation of different stages of anesthesia was undertaken previously. The spectrograms using Thomson’s multitaper method was computed and implemented using Chronux toolbox (http://chronux.org) [29]. The spectral analysis parameters were: window length T = 2 s with 0.1 s window step, time-bandwidth product TW = 2, number of tapers K = 3, and spectral resolution 2W of 2 Hz. Group-median outcome across subjects of the selected patient’s in each group (propofol and desflurane) was taken for time frequency fluctuation plotting. Group-averaged spectra were computed by taking the mean power of individual spectrograms at each frequency across the entire epoch and then the median (IQR) power across frequency was computed for each group. In addition, the absolute band power is calculated, as shown in Table 3, which is used to make comparisons.

Table 3.
Definition of frequency bands [26].
2.6. Statistical Analysis
Statistical analysis performed using MATLAB (MathWorks R2014b). To assess the statistical significance for the difference in power at each frequency, the 95% confidence intervals for the estimated power spectra were calculated using the Bootstrap method (2000 times) testing for differences. To account for the underlying spectral resolution of the spectral estimates, differences would be treated as significant only if they are present over a frequency band larger than the spectral resolution (2W) for contiguous frequencies. The absolute power of different frequency bands across groups during loss of consciousness is compared; therefore, independent student t-test was used to check the significance. Figure 1 shows analysis protocol for the two groups.
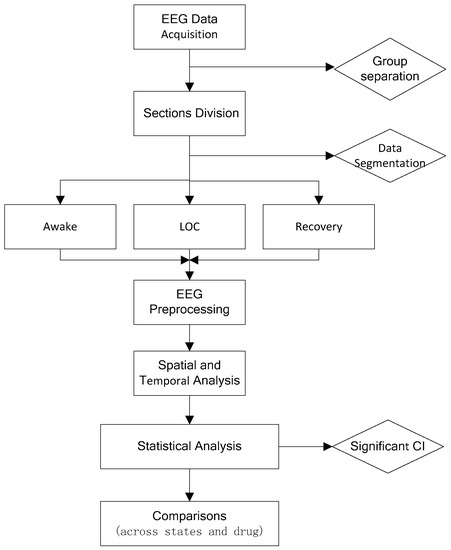
Figure 1.
Study design procedure. LoC: loss of consciousness; CI: confidence interval.
3. Result
3.1. Propofol Power Spectral Comparisons across Brain States
To characterize the signature of EEG induced by propofol, the differences in the spectrogram are observed. When compared with baseline state, the spectrogram during unconsciousness exhibited evident slow and alpha bands dominance (Figure 2A,B), which is consistent with [9,30]. Then, power across most frequencies between 0 and 40 Hz. Slow, delta, and theta power remained relatively unchanged across every frequency point between two states in statistics (Figure 2C). There were no clear associations with them. However, EEG power behaves an alpha oscillation peak (mean ± SD; peak frequency, 10.2 ± 1.4 Hz; peak power, −14.0 ± 1.6 dB). EEG power is significantly larger for alpha and low beta during unconsciousness (Figure 2D: 8 Hz to 21 Hz), whereas being significantly lower across the gamma band (Figure 2D: 35.4 Hz to 40 Hz). This finding was slightly different when comparing the unconscious state to recovery (see Figure 3). The recovery shows a similar pattern like unconscious state with relatively lower power strength across the frequency band. This may result from the anesthetic level, which means that agent concentration is still high, which keeps the anesthetic effect. Furthermore, the mean absolute band power is also calculated as shown in Table 4. It shows the power fluctuation as a band ranges. It can be seen that alpha band power has a significant increase.
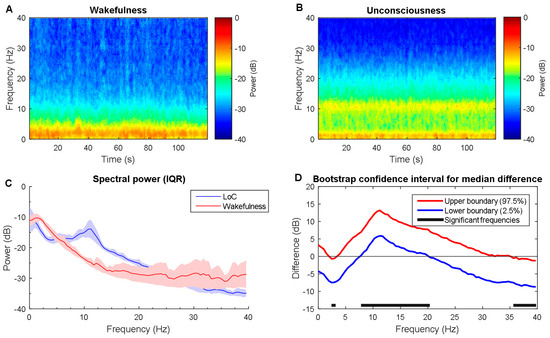
Figure 2.
Time-frequency dynamics between wakefulness and unconsciousness for propofol. (A,B) wakefulness and unconsciousness spectrograms; (C) Group-averaged power spectra (solid line, median; shaded area, 25th–75th percentile IQR); (D) The upper (red) and lower (blue) represent the bootstrapped 95% confidence interval bounds for the difference between spectra shown in panel C. Solid horizonal black line indicates significant frequency range. LoC: loss of consciousness.
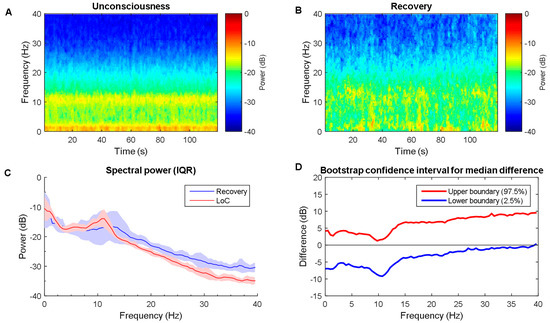
Figure 3.
Time-frequency dynamics between unconsciousness and recovery for propofol group. (A,B) LoC and recovery spectrograms; (C) Group-averaged power spectra (solid line, median; shaded area, 25th–75th percentile IQR). They show similar EEG power distribution during the LoC state and recovery; and, (D) The upper (red) and lower (blue) represent the bootstrapped 95% confidence interval bounds for the difference between spectra shown in panel C. There is no significant during whole frequency range. It might indicate the residual propofol effect. LoC: loss of consciousness.

Table 4.
Mean band power for propofol. Power shown in dB after z-score.
3.2. Desflurane Power Spectral Comparisons across Brain States
The power spectra differences between wakefulness and unconsciousness state for propofol cohort are calculated. By contrast, the spectrogram during unconsciousness shows slightly higher power from delta, theta to alpha from the median spectrogram (Figure 4A,B), while the slow, beta, and gamma band exhibit lower power. This can be also verified in power spectra IQR plot visually (Figure 4C). Bootstrap mean value statistics over frequency presents significant higher alpha and lower gamma power during unconsciousness 8 Hz to 21 Hz (Figure 4D). For gamma band, this is similar for comparison between unconsciousness and recovery states, which makes sense. For low frequency band ranges, there is no clear distinction (see in Figure 5). This may be part of the residual anesthetic effect. The mean absolute band power was also provided in Table 5. The power distribution shows significant difference between the two states.
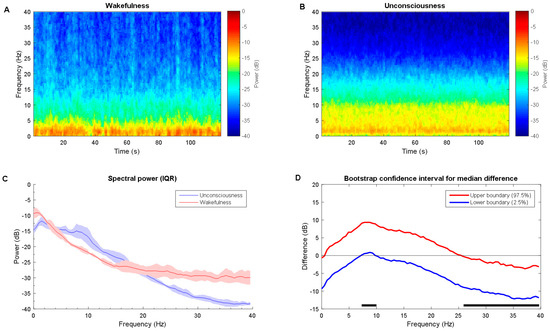
Figure 4.
Time-frequency dynamics between wakefulness and unconsciousness for desflurane. (A,B) wakefulness and unconsciousness spectrograms; (C) Group-averaged power spectra (solid line, median; shaded area, 25th–75th percentile IQR); and, (D) The upper (red) and lower (blue) represent the bootstrapped 95% confidence interval bounds for the difference between spectra shown in panel C. Solid horizonal black line indicates significant frequency range. LoC: loss of consciousness.
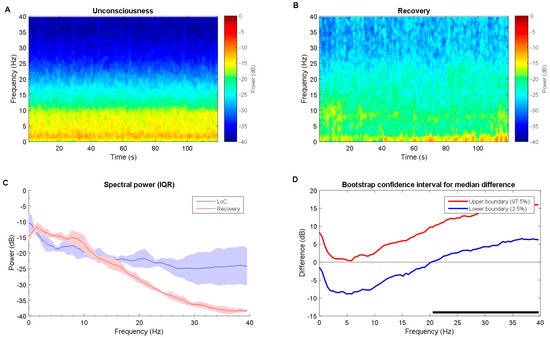
Figure 5.
Time-frequency dynamics between unconsciousness and recovery for desflurane group. (A,B) LoC and recovery spectrograms; (C) Group-averaged power spectra (solid line, median; shaded area, 25th–75th percentile IQR). They show similar EEG power distribution during the LoC state and recovery; and, (D) The upper (red) and lower (blue) represent the bootstrapped 95% confidence interval bounds for the difference between spectra shown in panel C. The high beta and gamma ranges show LoC state power is significantly higher than recovery state. The recovery state looks very similar to awake state in Figure 4. Solid horizonal black line indicates significant frequency range. LoC: loss of consciousness.

Table 5.
Mean band power for desflurane. Power shown in dB after z-score.
3.3. Propofol versus Desflurane Spectral Dynamics Analysis under Anesthesia
Through observation, there are rough similarities and differences in the spectrograms between the desflurane and propofol groups (Figure 6A,B). Both were similarly characterized by large alpha band power. However, propofol elicited significantly higher power across alpha band (10 to 12 Hz) high power from alpha up to gamma band (Figure 6C). There is no significant different between power across frequency, except a small range in the alpha band. Furthermore, the band power difference is also compared. Independent student t-test show that all of the bands power presents significant different (Figure 7). For slow alpha beta and gamma bands, propofol group has stronger mean absolute power, while delta and theta bands do oppositely. Furthermore, it has been demonstrated that there is one representative for perioperative operative spectral dynamic in shown in Figure 8 and Figure 9. Briefly, they present similar time and spectral distribution, which is consistent with what has been analyzed even with some perturbation though.
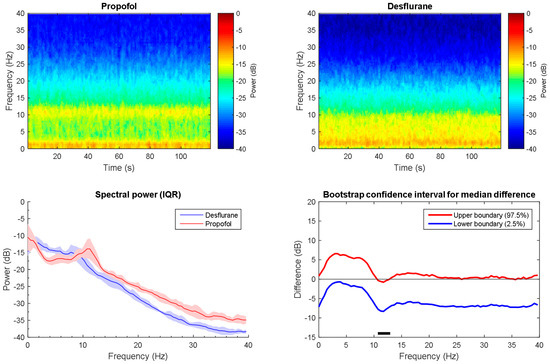
Figure 6.
Time-frequency dynamics between propofol and desflurane induced anesthesia. (A,B) wakefulness and unconsciousness spectrograms; (C) Group-averaged power spectra (solid line, median; shaded area, 25th–75th percentile IQR). They show similar EEG power distribution during the awake state and LoC; (D) The upper (red) and lower (blue) represent the bootstrapped 95% confidence interval bounds for the difference between spectra shown in panel C. Significant difference frequency with alpha band is observed. Solid horizonal black line indicates significant frequency range. LoC: loss of consciousness.
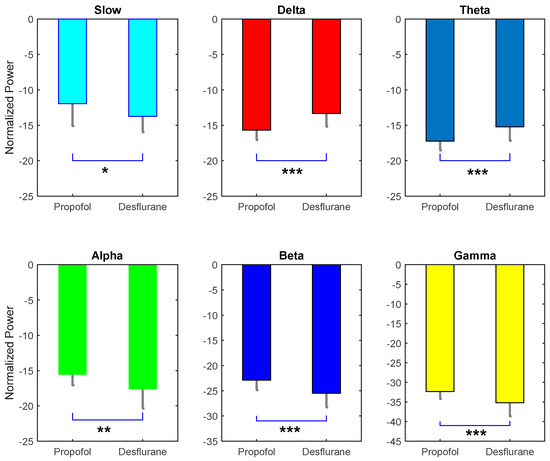
Figure 7.
Absolute mean power comparison between six frequency bands. It is evident that each pair is significant. Except delta and theta, all power in propofol group is higher than desflurane. Power shown in dB after z-score * p < 0.05; ** p < 0.01; *** p < 0.005.
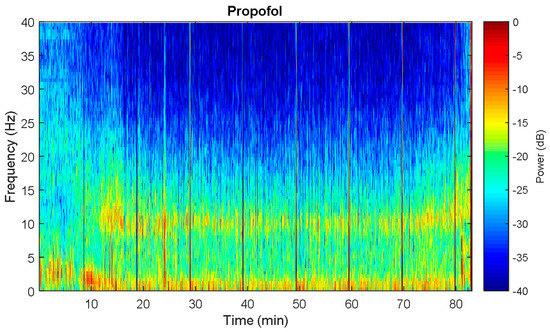
Figure 8.
Spectral dynamics from One representative of propofol patient. It is very evident that the unconsciousness is featured by alpha and slow dominance. Vertical sharp line denotes some noise perturbation.
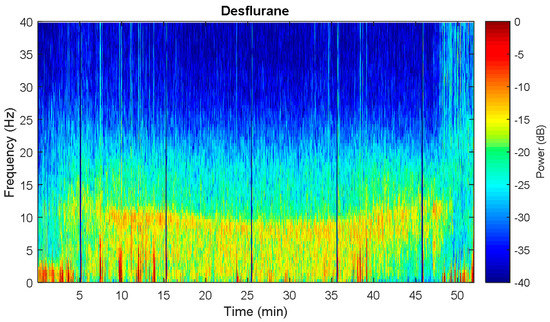
Figure 9.
Spectral dynamics from Oone representative of desflurane patient. The anesthetized state is characterized by slow to alpha wave dominance, especially for alpha significant increase. Vertical sharp line denotes some noise perturbation.
4. Discussion
EEG dynamics has aroused much attention for anesthesia study. This analysis study of frontal EEG data provides some insights to correlates between EEG dynamics and anesthesia status under two common anesthetics. The signature of EEG induced by propofol and desflurane generally appears similar. This has not been reported together for comparison purposes previously.
These EEG dynamics similarities between them are in line with the findings that GABAergic neural circuit mechanisms behave [3,26,31]. This implies that highly structured thalamocortical oscillations that communicate with cortical information processing, as well as slow oscillations in cortical activity [9,32], which are responsible for this phenomenon. This suggests that the EEG time frequency varying characteristic might function as signatures of general anesthesia–induced loss of consciousness.
As to the difference between propofol and desflurane during the loss of consciousness, it is noted that the power induced by propofol is slightly higher than desflurane except approximate delta-theta band. Slow wave has been treated as a mechanism principle for unconsciousness during sleep and anesthesia in common [9,33]. Frontal alpha EEG activity is proposed to alter something that is related to consciousness through blocking communication within frontal thalamo-cortical circuits from a wide to a narrow frequency band [10,15]. Results of this work explain that propofol induce a deeper anesthetic state than desflurane to some extent. This could also be verified by the comparison difference between unconsciousness with recovery state within each anesthetic agent. It means, for propofol, that the EEG signature during recovery still resembles that during unconsciousness, whereas the desflurane group is much more similar to the wakefulness.
However, these drugs are GABAergic dependent category. Those NMDA type might vary according to their different neural function mechanism, such as nitrous oxide, ketamine [34]. Some related works have been proposed [26,34,35]. It is worthwhile digging into the difference and comparison to pursue some new explanation and EEG signatures related with them. In recent years, EEG related anesthetic study has focused on connectivity analysis: coherent oscillations, connectivity, and network analysis [30,36,37]. Among them, alpha band anteriorization transition process, which is associated with propofol-induced unconsciousness and surgical levels of sevoflurane anesthesia [30], is one of the most profound outcomes and perhaps is used as a marker for anesthesia depth. This is grossly consistent with our findings. Also, functional characteristics (i.e., phase-phase coupling, phase–frequency coupling) of the EEG signatures between different frequency pairs can be further related to the level of consciousness [9]. These characteristics can provide a new window into the differences between both awake state and unarousable states of unresponsiveness.
There are some limitations for this study. Our observations only focus on the regular surgery anesthetic level variability of patients’ EEG in clinical settings. This naturally poses a doubt about the more detailed information with the time resolved spectral fluctuations [26,38]. Therefore, data specifications might need to be set precisely according to future study requirements, such as agent concentration level, anesthetic depth, aging effect, etc. Besides, co-administration of other drugs during the operation may result in some bias for the EEG characteristics exploration. This makes it hard for us to pursue detailed outcome and conclusion as well. Furthermore, multichannel analysis becomes popular more recently [26,37,38], which would enable spatial and source analysis of EEG features. For example, propofol was found with the anteriorization of alpha power [38,39]. It should be further studied in prospective high-density EEG investigations, such as connectivity and brain network study. Thus, it promotes better understanding of the neural circuit mechanisms of these oscillations.
5. Conclusions
In this article, it has been demonstrated that variation in the properties of slow oscillations and alpha oscillations across different states induced by desflurane and propofol. It details EEG signatures that could be monitored and displayed in real-time mode, thus being interpreted by anesthesiologists perhaps to provide clinical operation guidance for future. In addition, given the rich knowledge of the molecular pharmacology and neural circuits properties that are associated with these drugs, the current outcome might provide a potential shared mechanism for GABAergic drugs at clinically relevant doses. In the future, it is hoped that neurophysiological principles and brain network connectivity will be integrated together to build an anesthetic-dosing dependent models and guidelines for anesthesia-induced states of altered consciousness and neural circuit activity.
Acknowledgments
This research was supported by the two centers of Innovation Center for Biomedical and Healthcare Technology, and Innovation Center for Big Data and Digital Convergence, Yuan Ze University, Taiwan. Additional funding come from National Natural Science Foundation of China (Grant Numbers: 51475342, 51675389) and Wuhan University of Technology international exchange program (Grant Number: 2015-JL-012). The funders had no role in study design, data collection and analysis, decision to publish, or preparation of the manuscript.
Author Contributions
Shou-Zen Fan and Jiann-Shing Shieh conceived and designed the experiments; Li Ma and Shou-Zen Fan performed the experiments and analyzed the data; Shou-Zen Fan contributed reagents/materials/analysis tools; Quan Liu and Li Ma wrote the paper; Quan Liu, Maysam F. Abbod and Jiann-Shing Shieh evaluated and supervised the study.
Conflicts of Interest
The authors declare no conflict of interest.
References
- Brown, E.N.; Lydic, R.; Schiff, N.D. General anesthesia, sleep, and coma. N. Engl. J. Med. 2010, 363, 2638–2650. [Google Scholar] [CrossRef] [PubMed]
- Hutt, A.; Hudetz, A.G. General anesthesia: From theory to experiments. Front. Syst. Neurosci. 2015, 9, 105. [Google Scholar] [CrossRef] [PubMed]
- Pal, D.; Silverstein, B.H.; Lee, H.; Mashour, G.A. Neural correlates of wakefulness, sleep, and general anesthesiaan experimental study in rat. Anesthesiology 2016, 125, 929–942. [Google Scholar] [CrossRef] [PubMed]
- Liu, Q.; Ma, L.; Chiu, R.-C.; Fan, S.-Z.; Abbod, M.F.; Shieh, J.-S. Hrv-derived data similarity and distribution index based on ensemble neural network for measuring depth of anaesthesia. PeerJ 2017, 5, e4067. [Google Scholar] [PubMed]
- Lepouse, C.; Lautner, C.; Liu, L.; Gomis, P.; Leon, A. Emergence delirium in adults in the post-anaesthesia care unit. Br. J. Anaesth. 2006, 96, 747–753. [Google Scholar] [CrossRef] [PubMed]
- Saczynski, J.S.; Marcantonio, E.R.; Quach, L.; Fong, T.G.; Gross, A.; Inouye, S.K.; Jones, R.N. Cognitive trajectories after postoperative delirium. N. Engl. J. Med. 2012, 367, 30–39. [Google Scholar] [CrossRef] [PubMed]
- Arbous, M.S.; Meursing, A.E.; van Kleef, J.W.; de Lange, J.J.; Spoormans, H.H.; Touw, P.; Werner, F.M.; Grobbee, D.E. Impact of anesthesia management characteristics on severe morbidity and mortality. Anesthesiology 2005, 102, 257–268. [Google Scholar] [CrossRef] [PubMed]
- Bainbridge, D.; Martin, J.; Arango, M.; Cheng, D.; Evidence-based Peri-operative Clinical Outcomes Research (EPiCOR) Group. Perioperative and anaesthetic-related mortality in developed and developing countries: A systematic review and meta-analysis. Lancet 2012, 380, 1075–1081. [Google Scholar] [CrossRef]
- Purdon, P.L.; Pierce, E.T.; Mukamel, E.A.; Prerau, M.J.; Walsh, J.L.; Wong, K.F.K.; Salazar-Gomez, A.F.; Harrell, P.G.; Sampson, A.L.; Cimenser, A. Electroencephalogram signatures of loss and recovery of consciousness from propofol. Proc. Natl. Acad. Sci. USA 2013, 110, E1142–E1151. [Google Scholar] [CrossRef] [PubMed]
- Supp, G.G.; Siegel, M.; Hipp, J.F.; Engel, A.K. Cortical hypersynchrony predicts breakdown of sensory processing during loss of consciousness. Curr. Biol. 2011, 21, 1988–1993. [Google Scholar] [CrossRef] [PubMed]
- Brown, E.N.; Purdon, P.L.; Van Dort, C.J. General anesthesia and altered states of arousal: A systems neuroscience analysis. Annu. Rev. Neurosci. 2011, 34, 601–628. [Google Scholar] [CrossRef] [PubMed]
- Ching, S.; Brown, E.N. Modeling the dynamical effects of anesthesia on brain circuits. Curr. Opin. Neurobiol. 2014, 25, 116–122. [Google Scholar] [CrossRef] [PubMed]
- Niedermeyer, E.; da Silva, F.L. Electroencephalography: Basic Principles, Clinical Applications, and Related Fields; Lippincott Williams & Wilkins: Philadelphia, PA, USA, 2005. [Google Scholar]
- Kandel, E.R.; Schwartz, J.H.; Jessell, T.M.; Siegelbaum, S.A.; Hudspeth, A.J. Principles of Neural Science; McGraw-Hill: New York, NY, USA, 2000; Volume 4. [Google Scholar]
- Ching, S.; Cimenser, A.; Purdon, P.L.; Brown, E.N.; Kopell, N.J. Thalamocortical model for a propofol-induced α-rhythm associated with loss of consciousness. Proc. Natl. Acad. Sci. USA 2010, 107, 22665–22670. [Google Scholar] [CrossRef] [PubMed]
- Avidan, M.S.; Zhang, L.; Burnside, B.A.; Finkel, K.J.; Searleman, A.C.; Selvidge, J.A.; Saager, L.; Turner, M.S.; Rao, S.; Bottros, M. Anesthesia awareness and the bispectral index. N. Engl. J. Med. 2008, 358, 1097–1108. [Google Scholar] [CrossRef] [PubMed]
- Huang, N.E.; Shen, Z.; Long, S.R.; Wu, M.C.; Shih, H.H.; Zheng, Q.; Yen, N.-C.; Tung, C.C.; Liu, H.H. The Empirical Mode Decomposition and the Hilbert Spectrum for Nonlinear and Non-Stationary Time Series Analysis. Proc. R. Soc. Lond. A 1998, 454, 903–995. [Google Scholar] [CrossRef]
- Gianfelici, F.; Biagetti, G.; Crippa, P.; Turchetti, C. Multicomponent am–fm representations: An asymptotically exact approach. IEEE Trans. Audio Speech Lang. Process. 2007, 15, 823–837. [Google Scholar] [CrossRef]
- Biagetti, G.; Crippa, P.; Curzi, A.; Orcioni, S.; Turchetti, C. Analysis of the emg signal during cyclic movements using multicomponent am–fm decomposition. IEEE J. Biomed. Health Inform. 2015, 19, 1672–1681. [Google Scholar] [CrossRef] [PubMed]
- Pei, S.-C.; Chang, K.-W. The mystery curve: A signal processing point of view [lecture notes]. IEEE Signal Process. Mag. 2017, 34, 158–163. [Google Scholar] [CrossRef]
- Cornelissen, L.; Kim, S.-E.; Purdon, P.L.; Brown, E.N.; Berde, C.B. Age-dependent electroencephalogram (EEG) patterns during sevoflurane general anesthesia in infants. eLife 2015, 4, e06513. [Google Scholar] [CrossRef] [PubMed]
- Rosow, C.; Manberg, P.J. Bispectral index monitoring. Anesthesiol. Clin. N. Am. 2001, 19, 947–966. [Google Scholar] [CrossRef]
- Viertiö-Oja, H.; Maja, V.; Särkelä, M.; Talja, P.; Tenkanen, N.; Tolvanen-Laakso, H.; Paloheimo, M.; Vakkuri, A.; Yli-Hankala, A.; Meriläinen, P. Description of the entropy™ algorithm as applied in the datex-ohmeda s/5™ entropy module. Acta Anaesthesiol. Scand. 2004, 48, 154–161. [Google Scholar] [CrossRef] [PubMed]
- Pavone, K.J.; Akeju, O.; Sampson, A.L.; Ling, K.; Purdon, P.L.; Brown, E.N. Nitrous oxide-induced slow and delta oscillations. Clin. Neurophys. 2016, 127, 556–564. [Google Scholar] [CrossRef] [PubMed]
- Uhrig, L.; Dehaene, S.; Jarraya, B. Cerebral Mechanisms of General Anesthesia. Ann. Fr. Anesth. Reanim. 2014, 33, 72–82. [Google Scholar] [CrossRef] [PubMed]
- Purdon, P.L.; Sampson, A.; Pavone, K.J.; Brown, E.N. Clinical electroencephalography for anesthesiologistspart I: Background and basic signatures. J. Am. Soc. Anesthesiol. 2015, 123, 937–960. [Google Scholar] [CrossRef] [PubMed]
- Kaur, A.; Jain, A.K.; Sehgal, R.; Sood, J. Hemodynamics and early recovery characteristics of desflurane versus sevoflurane in bariatric surgery. J. Anaesthesiol. Clin. Pharmacol. 2013, 29, 36. [Google Scholar] [CrossRef] [PubMed]
- Feshchenko, V.A.; Veselis, R.A.; Reinsel, R.A. Propofol-induced alpha rhythm. Neuropsychobiology 2004, 50, 257–266. [Google Scholar] [CrossRef] [PubMed]
- Bokil, H.; Andrews, P.; Kulkarni, J.E.; Mehta, S.; Mitra, P.P. Chronux: A platform for analyzing neural signals. J. Neurosci. Methods 2010, 192, 146–151. [Google Scholar] [CrossRef] [PubMed]
- Akeju, O.; Westover, M.B.; Pavone, K.J.; Sampson, A.L.; Hartnack, K.E.; Brown, E.N.; Purdon, P.L. Effects of sevoflurane and propofol on frontal electroencephalogram power and coherence. J. Am. Soc. Anesthesiol. 2014, 121, 990–998. [Google Scholar] [CrossRef] [PubMed]
- Akeju, O.; Pavone, K.J.; Westover, M.B.; Vazquez, R.; Prerau, M.J.; Harrell, P.G.; Hartnack, K.E.; Rhee, J.; Sampson, A.L.; Habeeb, K. A comparison of propofol-and dexmedetomidine-induced electroencephalogram dynamics using spectral and coherence analysis. J. Am. Soc. Anesthesiol. 2014, 121, 978–989. [Google Scholar] [CrossRef] [PubMed]
- Neske, G.T. The slow oscillation in cortical and thalamic networks: Mechanisms and functions. Front. Neural Circ. 2016, 9, 88. [Google Scholar] [CrossRef] [PubMed]
- Franks, N.P. General anaesthesia: From molecular targets to neuronal pathways of sleep and arousal. Nat. Rev. Neurosci. 2008, 9, 370–386. [Google Scholar] [CrossRef] [PubMed]
- Akeju, O.; Song, A.H.; Hamilos, A.E.; Pavone, K.J.; Flores, F.J.; Brown, E.N.; Purdon, P.L. Electroencephalogram signatures of ketamine anesthesia-induced unconsciousness. Clin. Neurophysiol. 2016, 127, 2414–2422. [Google Scholar] [CrossRef] [PubMed]
- Poorun, R.; Hartley, C.; Goksan, S.; Worley, A.; Boyd, S.; Cornelissen, L.; Berde, C.; Rogers, R.; Ali, T.; Slater, R. Electroencephalography during general anaesthesia differs between term-born and premature-born children. Clin. Neurophysiol. 2016, 127, 1216–1222. [Google Scholar] [CrossRef] [PubMed]
- Chennu, S.; O’Connor, S.; Adapa, R.; Menon, D.K.; Bekinschtein, T.A. Brain connectivity dissociates responsiveness from drug exposure during propofol-induced transitions of consciousness. PLoS Comput. Biol. 2016, 12, e1004669. [Google Scholar] [CrossRef] [PubMed]
- Akeju, O.; Kim, S.-E.; Vazquez, R.; Rhee, J.; Pavone, K.J.; Hobbs, L.E.; Purdon, P.L.; Brown, E.N. Spatiotemporal dynamics of dexmedetomidine-induced electroencephalogram oscillations. PLoS ONE 2016, 11, e0163431. [Google Scholar] [CrossRef] [PubMed]
- Blain-Moraes, S.; Tarnal, V.; Vanini, G.; Bel-Behar, T.; Janke, E.; Picton, P.; Golmirzaie, G.; Palanca, B.J.; Avidan, M.S.; Kelz, M.B. Network efficiency and posterior alpha patterns are markers of recovery from general anesthesia: A high-density electroencephalography study in healthy volunteers. Front. Hum. Neurosci. 2017, 11, 328. [Google Scholar] [CrossRef] [PubMed]
- Murphy, M.; Bruno, M.-A.; Riedner, B.A.; Boveroux, P.; Noirhomme, Q.; Landsness, E.C.; Brichant, J.-F.; Phillips, C.; Massimini, M.; Laureys, S. Propofol anesthesia and sleep: A high-density EEG study. Sleep 2011, 34, 283–291. [Google Scholar] [CrossRef] [PubMed]
© 2018 by the authors. Licensee MDPI, Basel, Switzerland. This article is an open access article distributed under the terms and conditions of the Creative Commons Attribution (CC BY) license (http://creativecommons.org/licenses/by/4.0/).