1. Introduction
Land economic density (LED) refers to the economic return generated per unit of land area, which serves as a primary manifestation of how economic development exerts influence on land use systems. It reflects not only the economic benefits and intensity of land use, but also plays a crucial role in addressing the tension between limited land supply and sustained economic growth [
1]. The Rural Revitalization Plan (2024–2027) issued by the Chinese government explicitly emphasizes optimizing rural functional zoning and spatial layouts [
2], setting quantitative targets such as increasing the proportion of efficient agricultural land use to over 80% and promoting industrial land intensification above 70% in key development zones. These policy priorities highlight that innovating land development and utilization models, and enhancing land use efficiency have become critical pathways for shifting socioeconomic development from rapid growth toward high-quality development [
3]. However, existing research has predominantly focused on city and county scales, while systematic studies at the township level remain inadequate [
4], posing challenges to provide comprehensive support for optimizing the “production–living–ecological” space and the overall territorial spatial layout.
In recent years, scholars have undertaken extensive research on LED, with particular emphasis on indicator systems and methodological approaches [
5,
6]. Regarding indicator systems, some studies measure LED using land or built-up area [
7], while others rely on gross domestic product or non-agricultural value added to capture economic performance [
8,
9]. Methodologically, researchers have employed measures such as the coefficient of variation, Theil index, and relative growth rate to reveal disparities and development dynamics [
10,
11,
12]. In addition, exploratory spatial data analysis and global or local Moran’s I statistics have been widely employed to identify spatial patterns and correlations [
13,
14]. Collectively, these approaches indicate a clear shift toward data-driven research, emphasizing the integration of spatial statistics and quantitative analysis in understanding land use efficiency. However, due to long-standing data limitations at the township level, quantitative spatial econometric analyses remain relatively scarce [
15,
16]. More recently, the availability of resources such as the County Statistical Yearbook (Township Volume) in China has facilitated the use of models including geographically weighted regression (GWR), spatial lag model, and spatial error model, signaling a growing trend toward quantitative analysis. Overall, while existing research has enriched indicators and methods, systematic investigation at the township scale remains insufficient, underscoring the necessity of further exploration in this field.
Anyang city, located at the junction of Henan, Shanxi, and Hebei provinces, is a key regional center within the Central Plains Urban Agglomeration [
17]. Owing to its strategic position as a hub linking North and Central China, the city is characterized by diverse resource endowments and pronounced urban–rural inequality. At the same time, it faces multiple challenges including industrial restructuring, rural revitalization, and resource–environmental constraints [
18,
19]. These features make Anyang city representative, making it an ideal case for investigating township-scale LED pattern. On this basis, this study focuses on township units in Anyang, treating LED as a key variable for evaluating land use efficiency and structural optimization. By analyzing spatial variability and evolutionary patterns of LED, the study aims to precisely identify township-level land use conditions, thereby offering a scientific basis for the formulation of township-scale land development strategies in Anyang, as well as providing practical references for new-urbanization spatial optimization.
3. Results
3.1. Spatial Pattern Evolution of LED
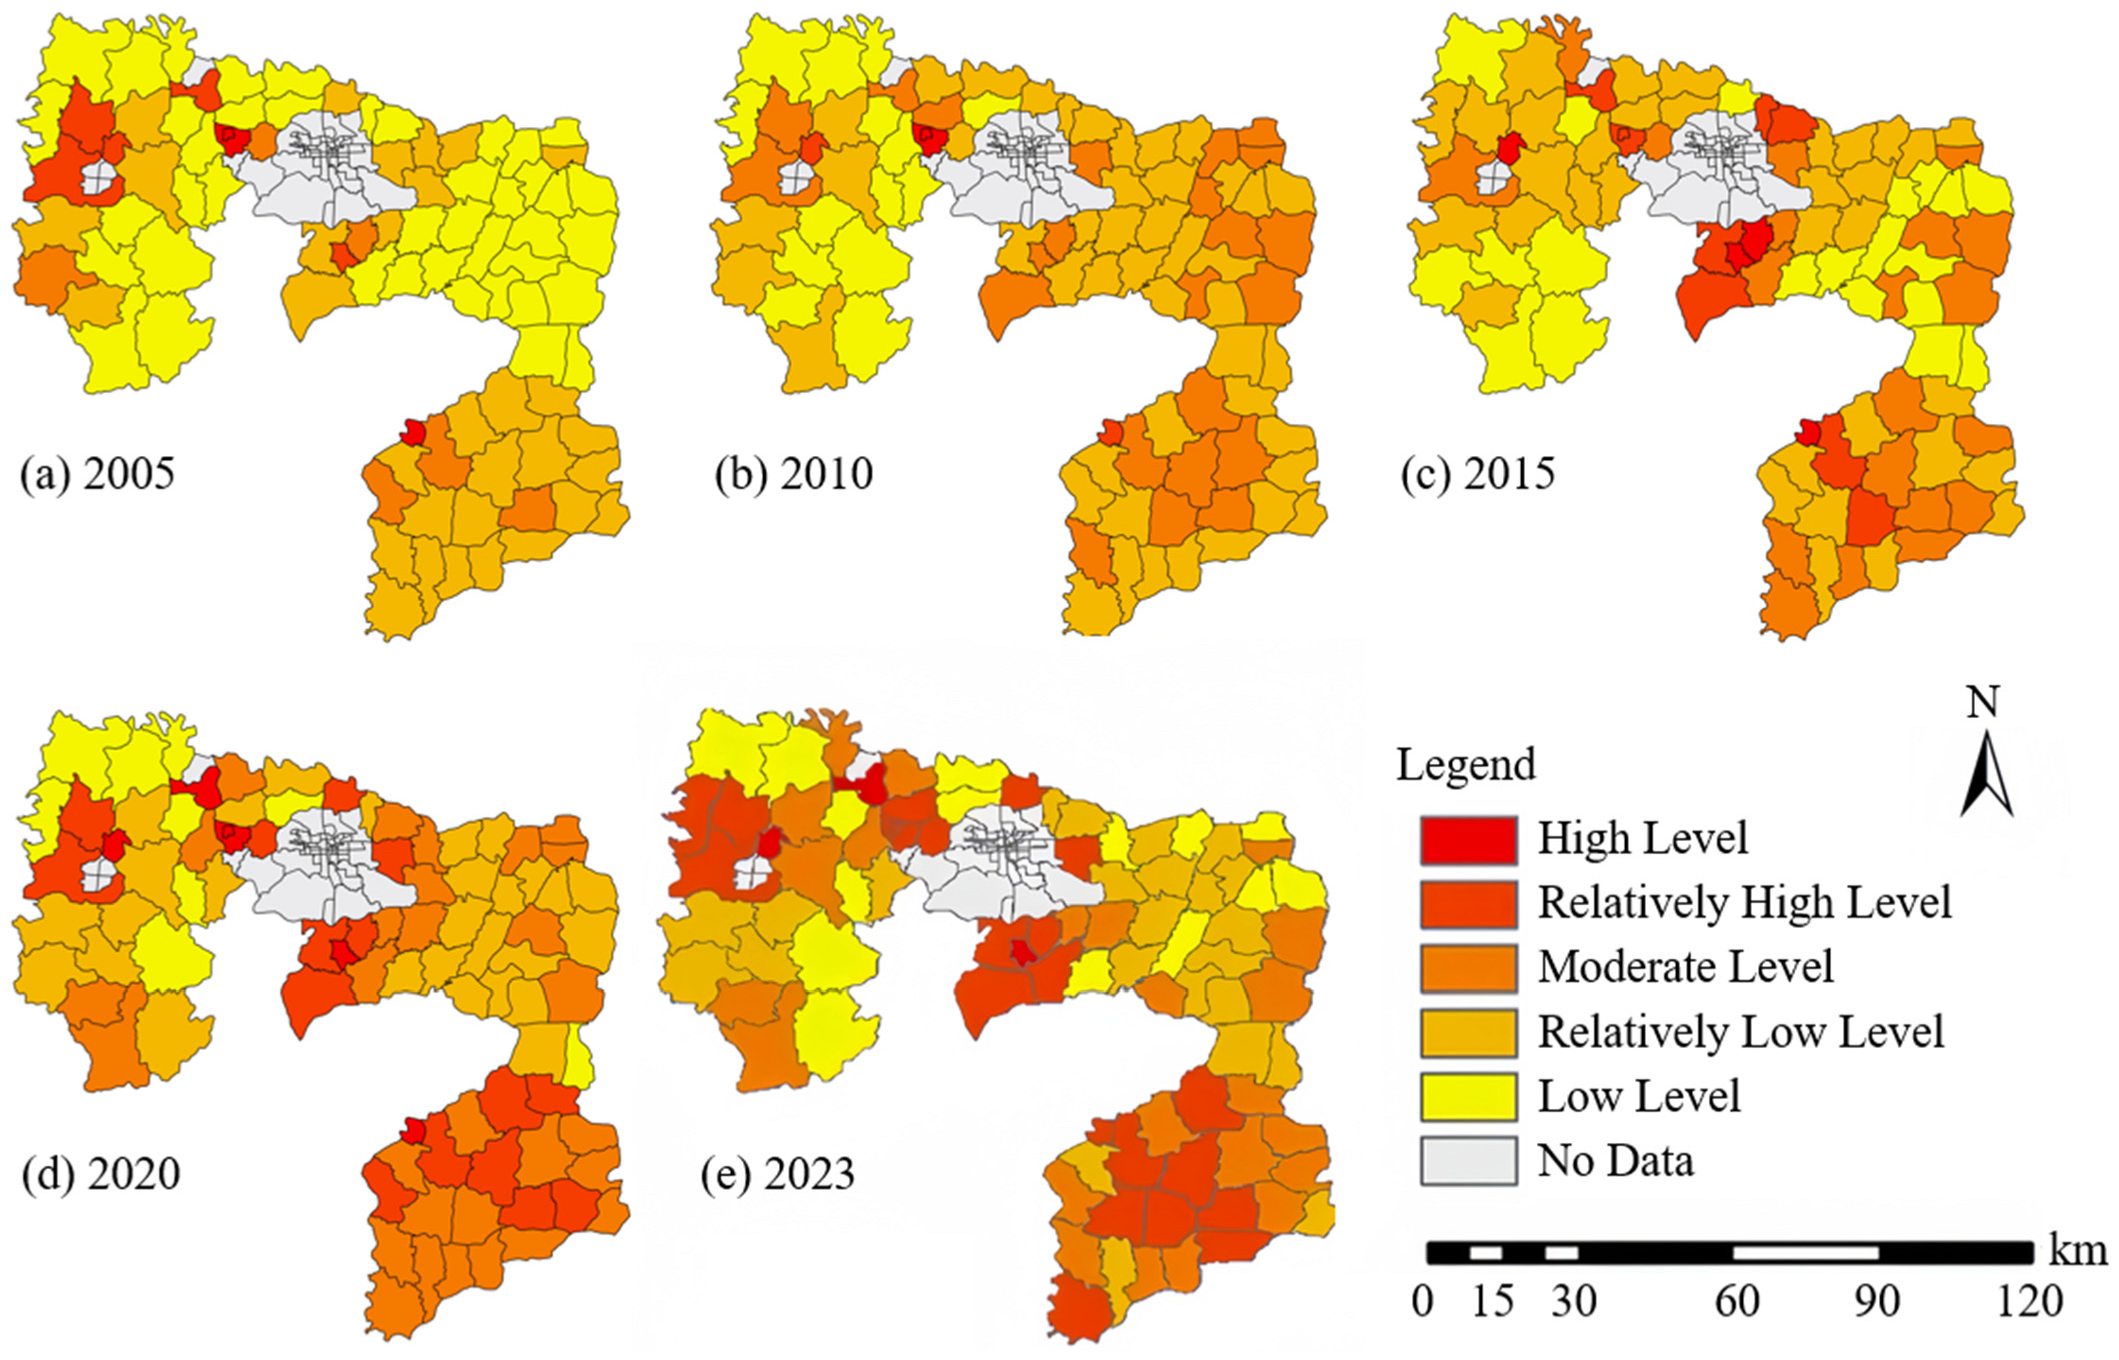
Based on the natural breakpoint classification method, the LED evaluation results at township scale were visualized and categorized into five levels: high, relatively high, medium, relatively low, and low (
Figure 2). From the perspective of the overall pattern, high-level areas of LED exhibit two distinct clustering characteristics: a ring-shaped cluster centered on major urban built-up areas, and an industrial cluster concentrated in Huaxian County in the southeast. Medium-level areas are largely distributed around the high-level areas, demonstrating a clear spatial spillover effect. In contrast, low-level areas are mainly concentrated in the Taihang Mountains in the northwest and along the provincial border in the northeast, forming a continuous low-value belt.
From the perspective of spatiotemporal evolution, the township LED development in Anyang city can be divided into two stages: a spatial expansion stage (2005–2015) and a quality enhancement stage (2015–2023). During the spatial expansion stage, high-level areas expanded rapidly from isolated clusters around the urban periphery to contiguous agglomerations covering both the central urban districts of Anyang and the urban area of Linzhou county, while towns such as Chengguan and Laodian township in Huaxian county also achieved notable breakthroughs. Medium-level areas increased substantially in counties such as Neihuang and Huaxian counties, while low-level areas decreased significantly, leading to an overall improvement at the regional level. A high-value ring emerged around central Anyang urban area, while multiple breakthroughs occurred in Linzhou and Huaxian counties, with six townships including Wangu, Baidaokou, and Liugu, experiencing substantial upward shifts. At the same time, low-level areas further contracted to the mountainous regions in the northwest and southwest, as well as the eastern periphery. However, between 2020 and 2023, several townships in Neihuang County experienced relative declines, indicating a slower pace of development compared to the regional average level.
The Markov transition matrix demonstrates that LED in Anyang maintained a relatively high degree of stability between 2005 and 2023 (
Table 2). Low-level areas exhibit the highest probability of persistence, indicating long-term stagnation and limited upward mobility. High-level areas also show strong stability, reflecting the consolidation of advantages in core urban districts and key development zones. In contrast, middle-level areas display greater mobility, particularly at the lower-middle level, which shows potential for both upward transition and downward regression. Relatively high-level areas exhibit bidirectional shifts, suggesting that their trajectories are more sensitive to industrial upgrading and locational conditions.
The Markov transition matrices illustrate the stability and dynamics of LED level changes across different periods. Between 2005 and 2010, the majority of townships remained in their original categories, particularly at the low and high ends of the spectrum, reflecting strong stability (
Figure 3). From 2010 to 2015, transitions became more pronounced, especially from Level 2 to Level 3, indicating upward mobility in LED development during the expansion stage. The period from 2015 to 2020 exhibits the most balanced structure, with significant probabilities of persistence but also notable transitions across adjacent levels, consistent with the quality enhancement phase. In the most recent period, 2020 to 2023, the transition matrix shows increased upward shifts from lower to higher levels, but also some reversals, particularly within intermediate categories, suggesting differentiation in development momentum across townships. Overall, the results highlight both the resilience of high-level areas and the mobility of middle-level areas, quantifying the spatial stability of LED evolution while revealing areas of potential vulnerability.
In order to clarify the mechanisms behind movements within the intermediate strata, we examine Level 2 and Level 3 townships with respect to the local drivers revealed by the GWR. Townships that moved up from Level 2 generally coincide with stronger local effects of industrial upgrading (a rising secondary–tertiary share), together with visible support from public investment and producer-service development, and they are spatially concentrated along the main development axes and around designated poles. By contrast, cases in which Level 3 townships declined are typically characterized by weaker market access and transport connectivity, compounded by demographic aging or land use fragmentation, and they are more frequent in peripheral or structurally segmented areas. Importantly, townships that remained in Level 2 or Level 3 tend to exhibit a narrow dispersion of driver coefficients, indicating bottleneck-type constraints rather than broad deficiencies. Taken together, these patterns show that the intermediate categories are the most responsive to changes in accessibility, industrial structure, and targeted fiscal support, which explains their higher mobility within the LED hierarchy and provides a coherent basis for subsequent optimization of spatial arrangements.
3.2. Spatial Correlation of LED at Township Scale
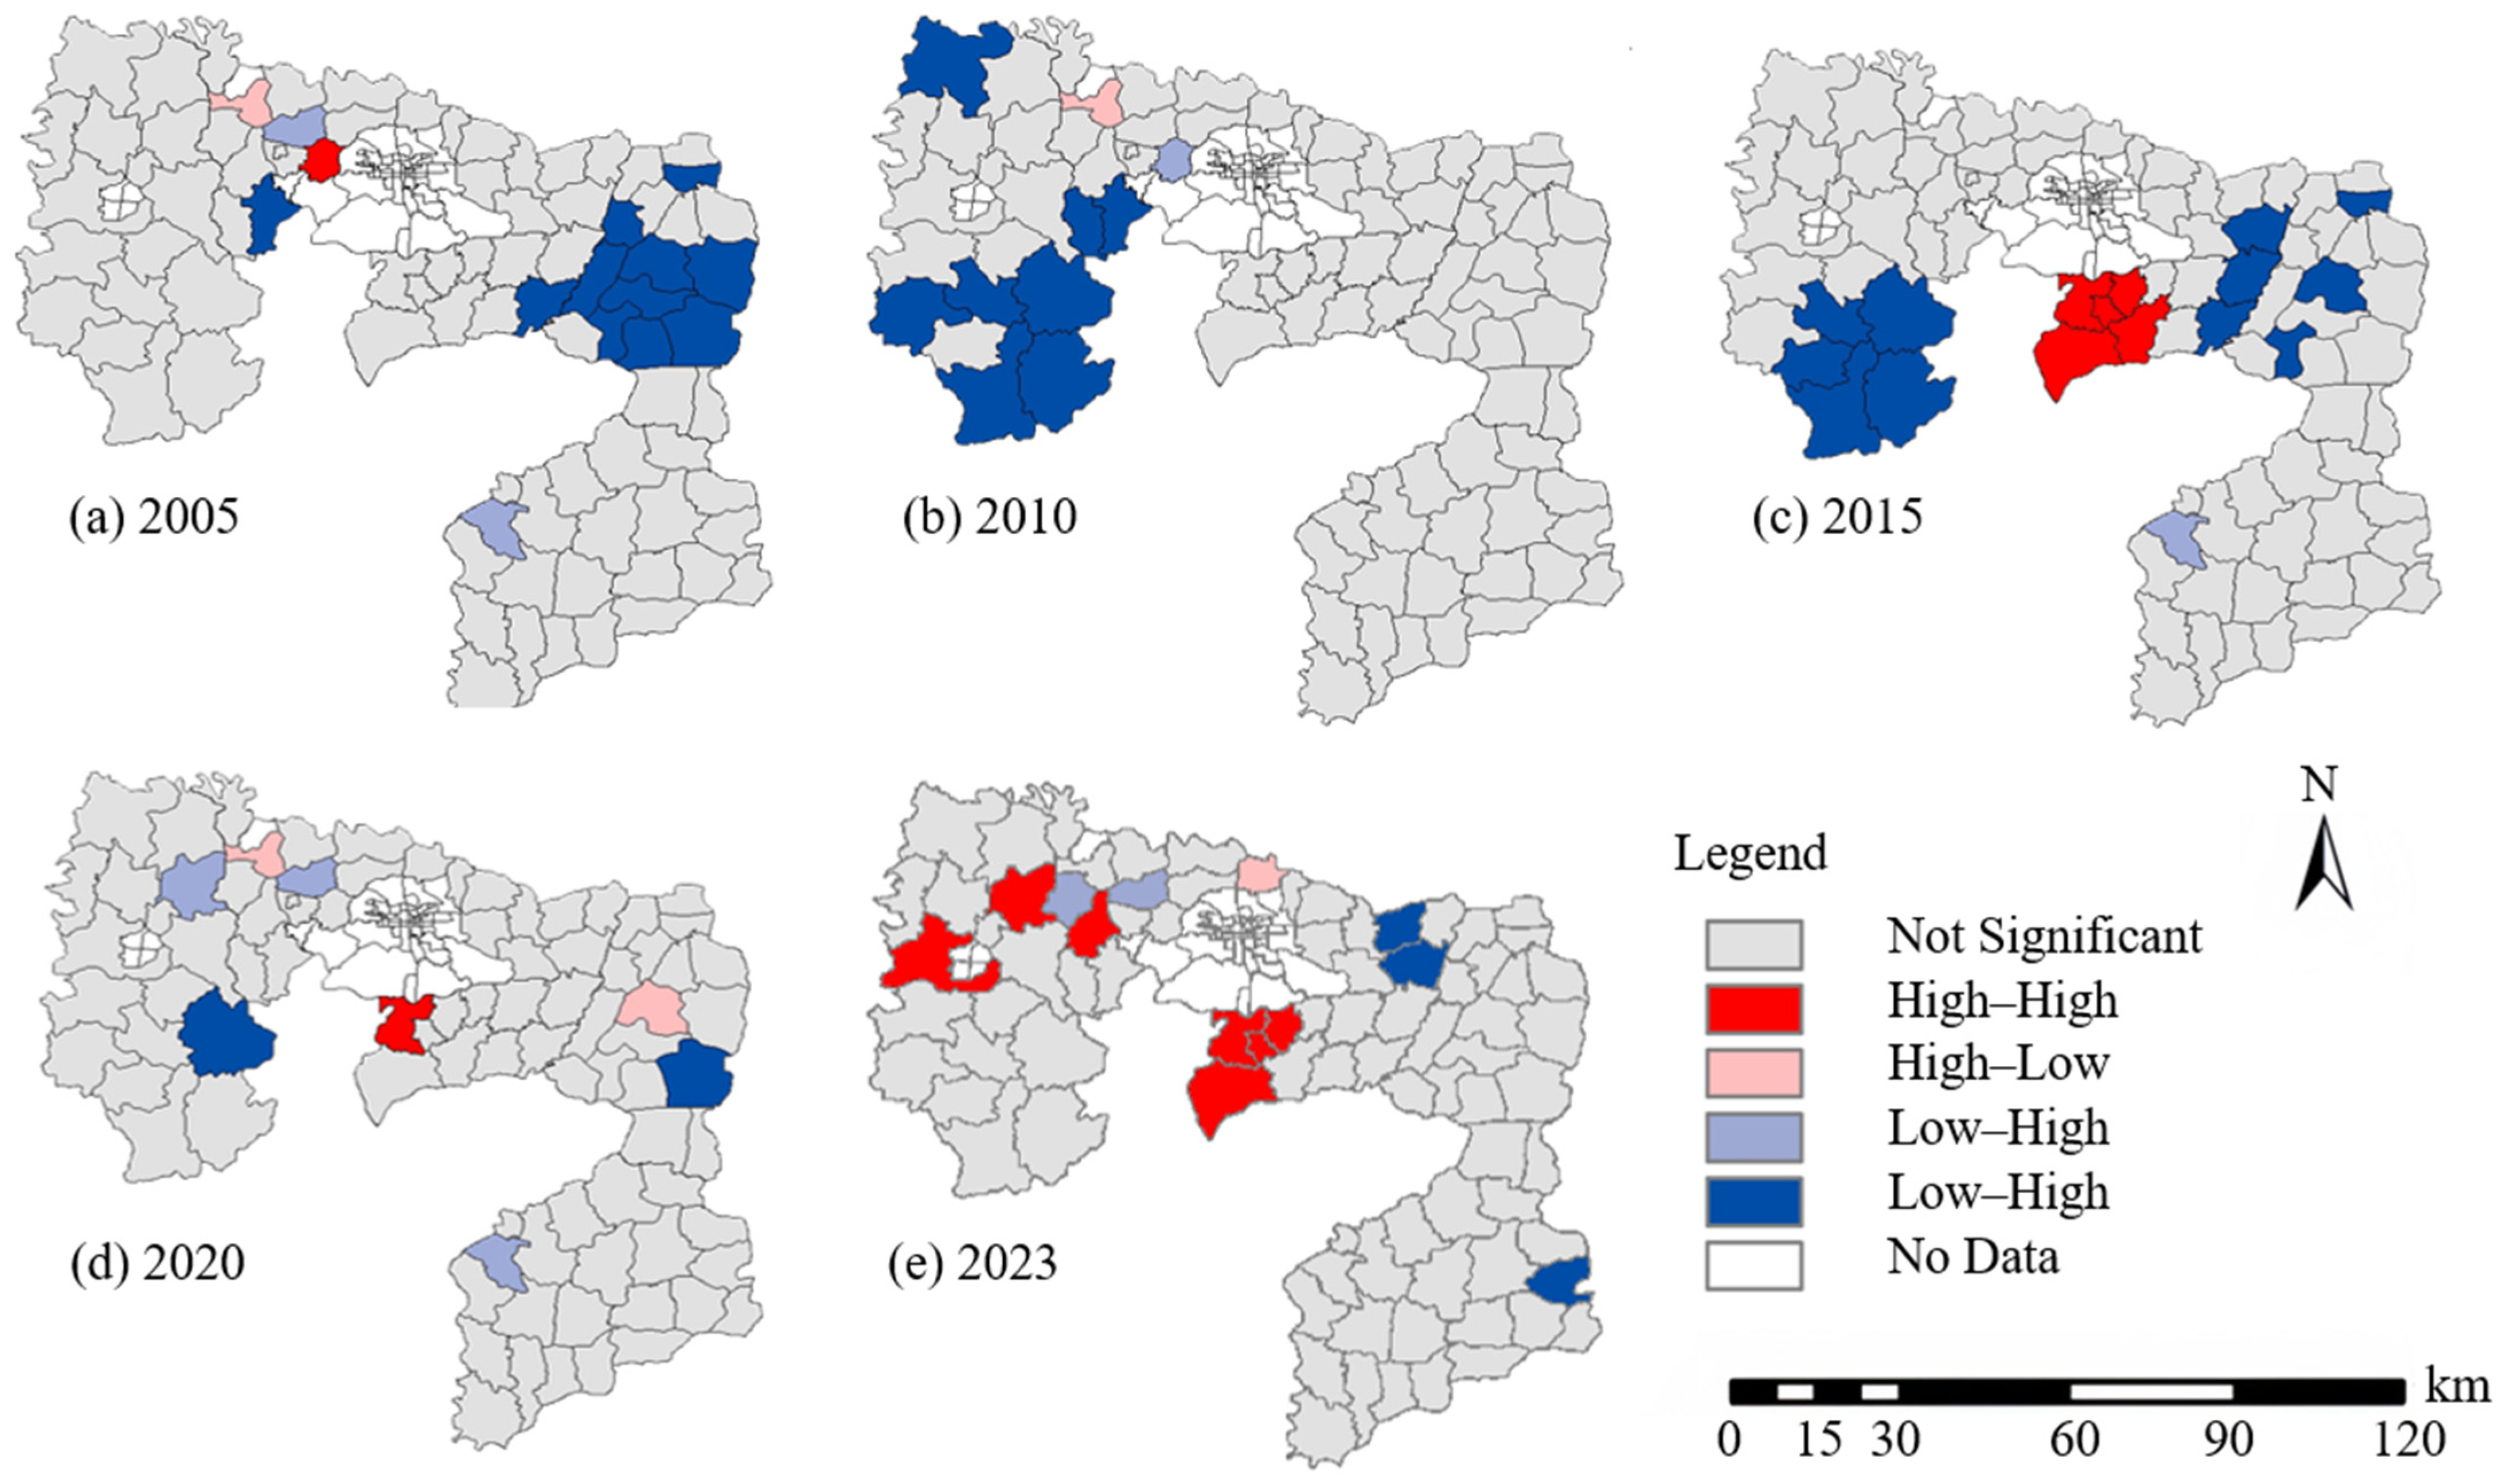
Based on the exploratory spatial data analysis method, this study employed GeoDa 1.20 software to conduct a global spatial autocorrelation analysis of township-level LED in Anyang (
Figure 4). Furthermore, a local spatial autocorrelation analysis was performed to gain deeper insights into the spatial dynamics of regional economic development within Anyang (
Figure 5).
From the perspective of spatial evolution, significant high–high clusters (HH areas) consistently appeared adjacent to urban districts, with small internal variability and strong spatial homogeneity, together forming regional economic highlands with surrounding townships. Their trajectory of change can be summarized as follows: emerging in Qugou Town in western Anyang in 2005, weakening in 2010 without a distinct HH cluster, expanding into a contiguous distribution south of the urban area in 2015, shrinking to Hanzhuang Town in Tangyin County in 2020, and reappearing south of the urban core in 2023, accompanied by newly emerging HH clusters in Huanghua Town, Heshun Town, and Xujia’gou Township of Linzhou.
Significant low–low clusters (LL areas) exhibited clear stage characteristics. Between 2005 and 2015, contiguous low-value zones formed in the southwest and east, reflecting lagging development, a lack of endogenous momentum, and inefficient land use. Since 2015, under the influence of coordinated development policies, the LL areas contracted markedly. By 2023, only three isolated points remained in Lücun Town, Xincun Town, and Dazhai Town, indicating a significant improvement in regional balance.
Significant high–low clusters (HL areas) and low–high clusters (LH areas) were scattered. HL areas were confined to Tongye Town between 2005 and 2010, expanded to include Dongzhuang Town in 2020, and shifted to Baizhuang Town in 2023. These zones were limited in scope and exhibited weak polarization effects, functioning as high-value enclaves with minimal spillover influence. LH areas, in contrast, appeared sporadically in the northwest and southeast, reflecting localized underperformance due to weak infrastructure and insufficient growth drivers, and were not significantly influenced by spillover effects from adjacent high-value areas.
Overall, from 2005 to 2023, township LED increased substantially, though spatial disparities persisted. Weak positive spatial correlation only appeared in 2015 and 2023, with limited clustering effects. Therefore, strengthening the radiative and spillover role of central urban districts and high-value areas is essential to improving land use efficiency in surrounding townships and enhancing the city’s overall regional competitiveness.
3.3. Spatiotemporal Distribution Characteristics of LED
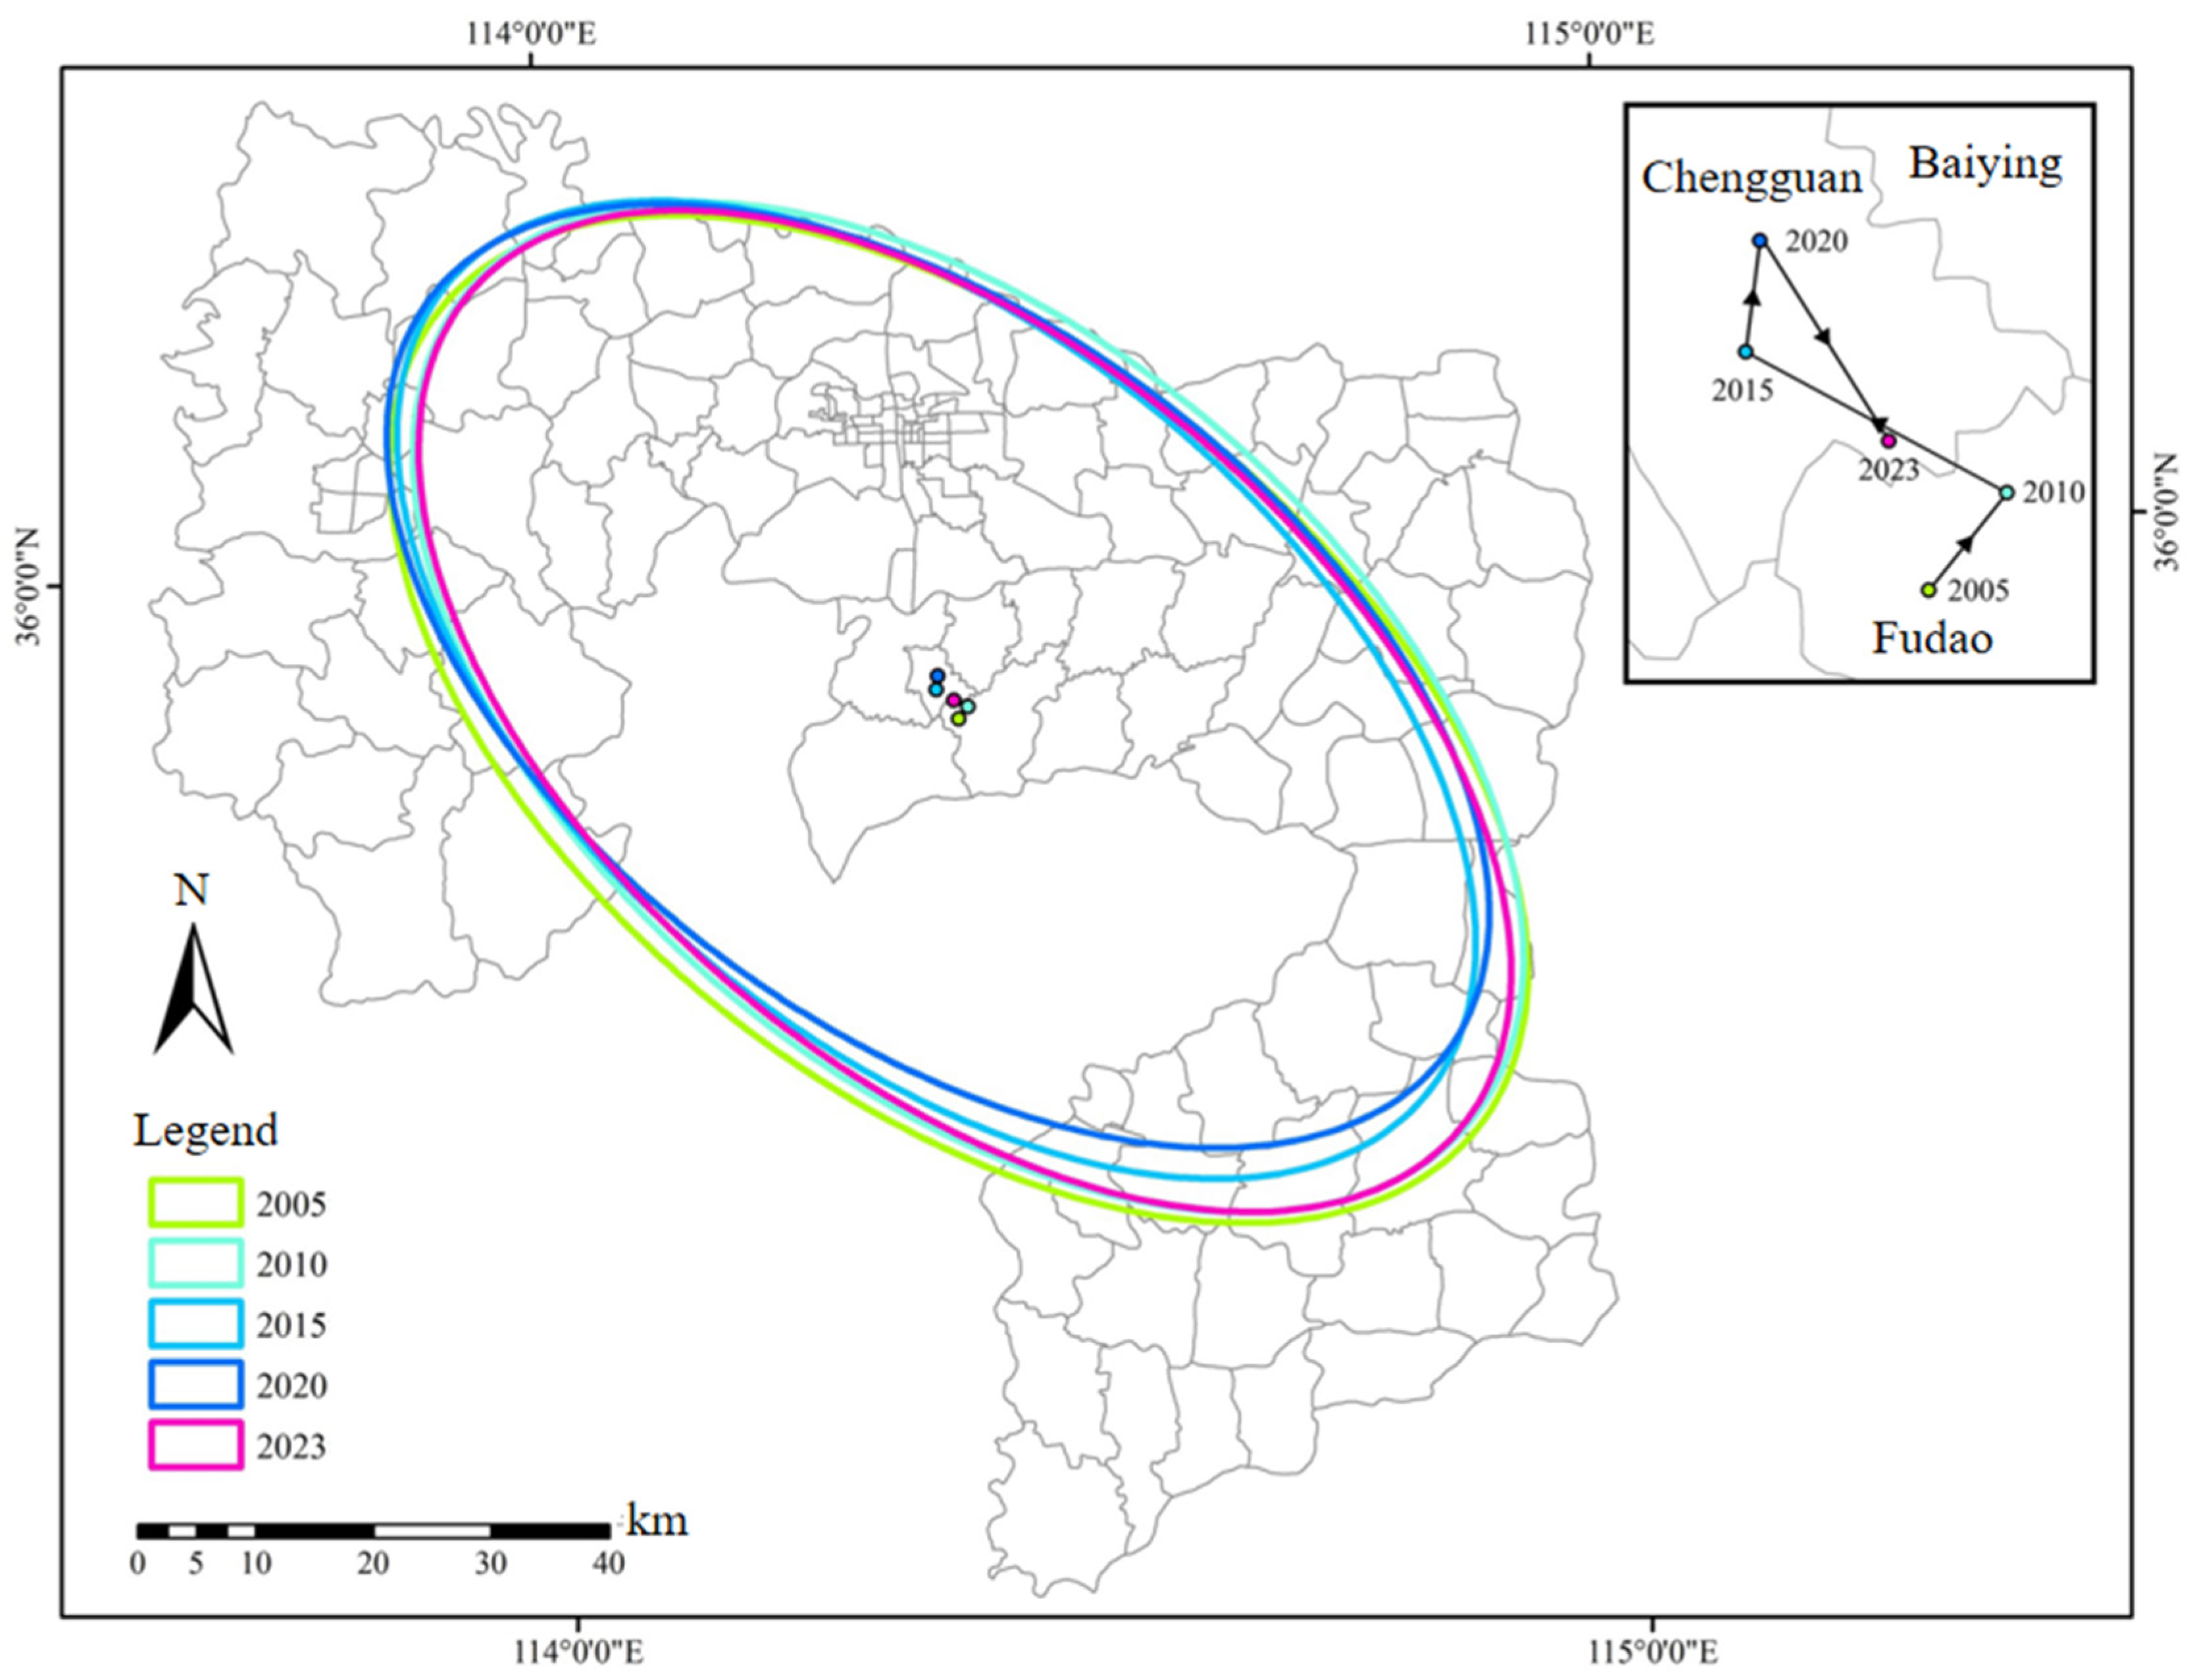
To illustrate the spatial evolution of LED in Anyang city, we apply the Standard Deviational Ellipse (SDE) method to quantitatively characterize its spatial distribution. By calculating key parameters such as the centroid coordinates, rotation angle, and the standard deviations of the major and minor axes (
Table 3), the SDE method precisely identifies the spatiotemporal trajectory of the economic density centroid (
Figure 6), thereby providing valuable insights into the spatial heterogeneity of regional development.
From the perspective of the overall ellipse pattern, the major axis of the standard deviational ellipse follows a northwest–southeast orientation, with the rotation angle θ increasing from 128.238° in 2005 to 130.349° in 2023. This indicates that between 2005 and 2023, township-level LED in Anyang consistently exhibited a northwest–southeast spatial configuration, which is consistent with the overall distribution of high-value areas described above. The flatness ratio increased from 0.432 to 0.445, suggesting an intensified polarization in spatial distribution, driven by the rapid rise in LED in the townships of Linzhou and Huaxian counties.
In terms of the ellipse centroid, the trajectory first shifted rapidly toward the northwest and then swung back toward the southeast, with the centroid located in Fudao and Chengguan towns in Tangyin County in the northern part of central Anyang. This reflects that from 2005 to 2015, the central and western regions of Anyang experienced faster growth in LED than the eastern regions, corroborating the rapid economic growth of Linzhou during this period. Since 2015, however, the northwestward shift slowed significantly, and after 2020 the centroid began to move southeastward. This reversal was mainly driven by the transformation and innovation of traditional industries in Huaxian county. On the one hand, it improved land productivity through agricultural modernization and industrialization, and on the other hand, it fostered emerging leading industries such as new energy materials and equipment manufacturing, thereby restructuring the regional industrial system.
3.4. Influencing Factors of Township LED Pattern
This study constructed an index system covering five dimensions—economic development foundation, industrial structure optimization, locational advantages, government support, and natural conditions—to quantitatively analyze the influencing factors of township LED. Data were mainly obtained from the China County Statistical Yearbook (Township Volume), the Anyang Statistical Yearbook, and township government work reports. To ensure the scientific rigor and reliability of the results, both ordinary least squares and geographically weighted regression models were employed for comparative analysis in order to capture both overall effects and spatial heterogeneity of the influencing factors.
OLS regression was used to examine the relationships between township LED and the selected explanatory variables. Upon further examination, it was found that the significance levels of the variables differed. Specifically, economic development status and industrial structure optimization showed strong positive effects, while government support intensity was only weakly significant, and locational advantage and natural conditions were not statistically significant at the global level. Nevertheless, these variables were retained in the model due to their theoretical importance and their localized explanatory effects revealed by the GWR results. In addition, all variance inflation factor (VIF) values were below 7.5, indicating no severe multicollinearity among the explanatory variables (
Table 4).
The selected indicators were fitted using both the OLS and GWR models, and the results showed that the overall fit of the OLS model was inferior to that of the GWR model (
Table 5). This indicated that the GWR model was more effective in capturing the spatial heterogeneity of the data and demonstrated superior fitting performance. Based on this comparison, the GWR model was subsequently applied to further explore the spatial heterogeneity of influencing factors, with the spatial distribution patterns and local variations of the regression coefficients (
Figure 7).
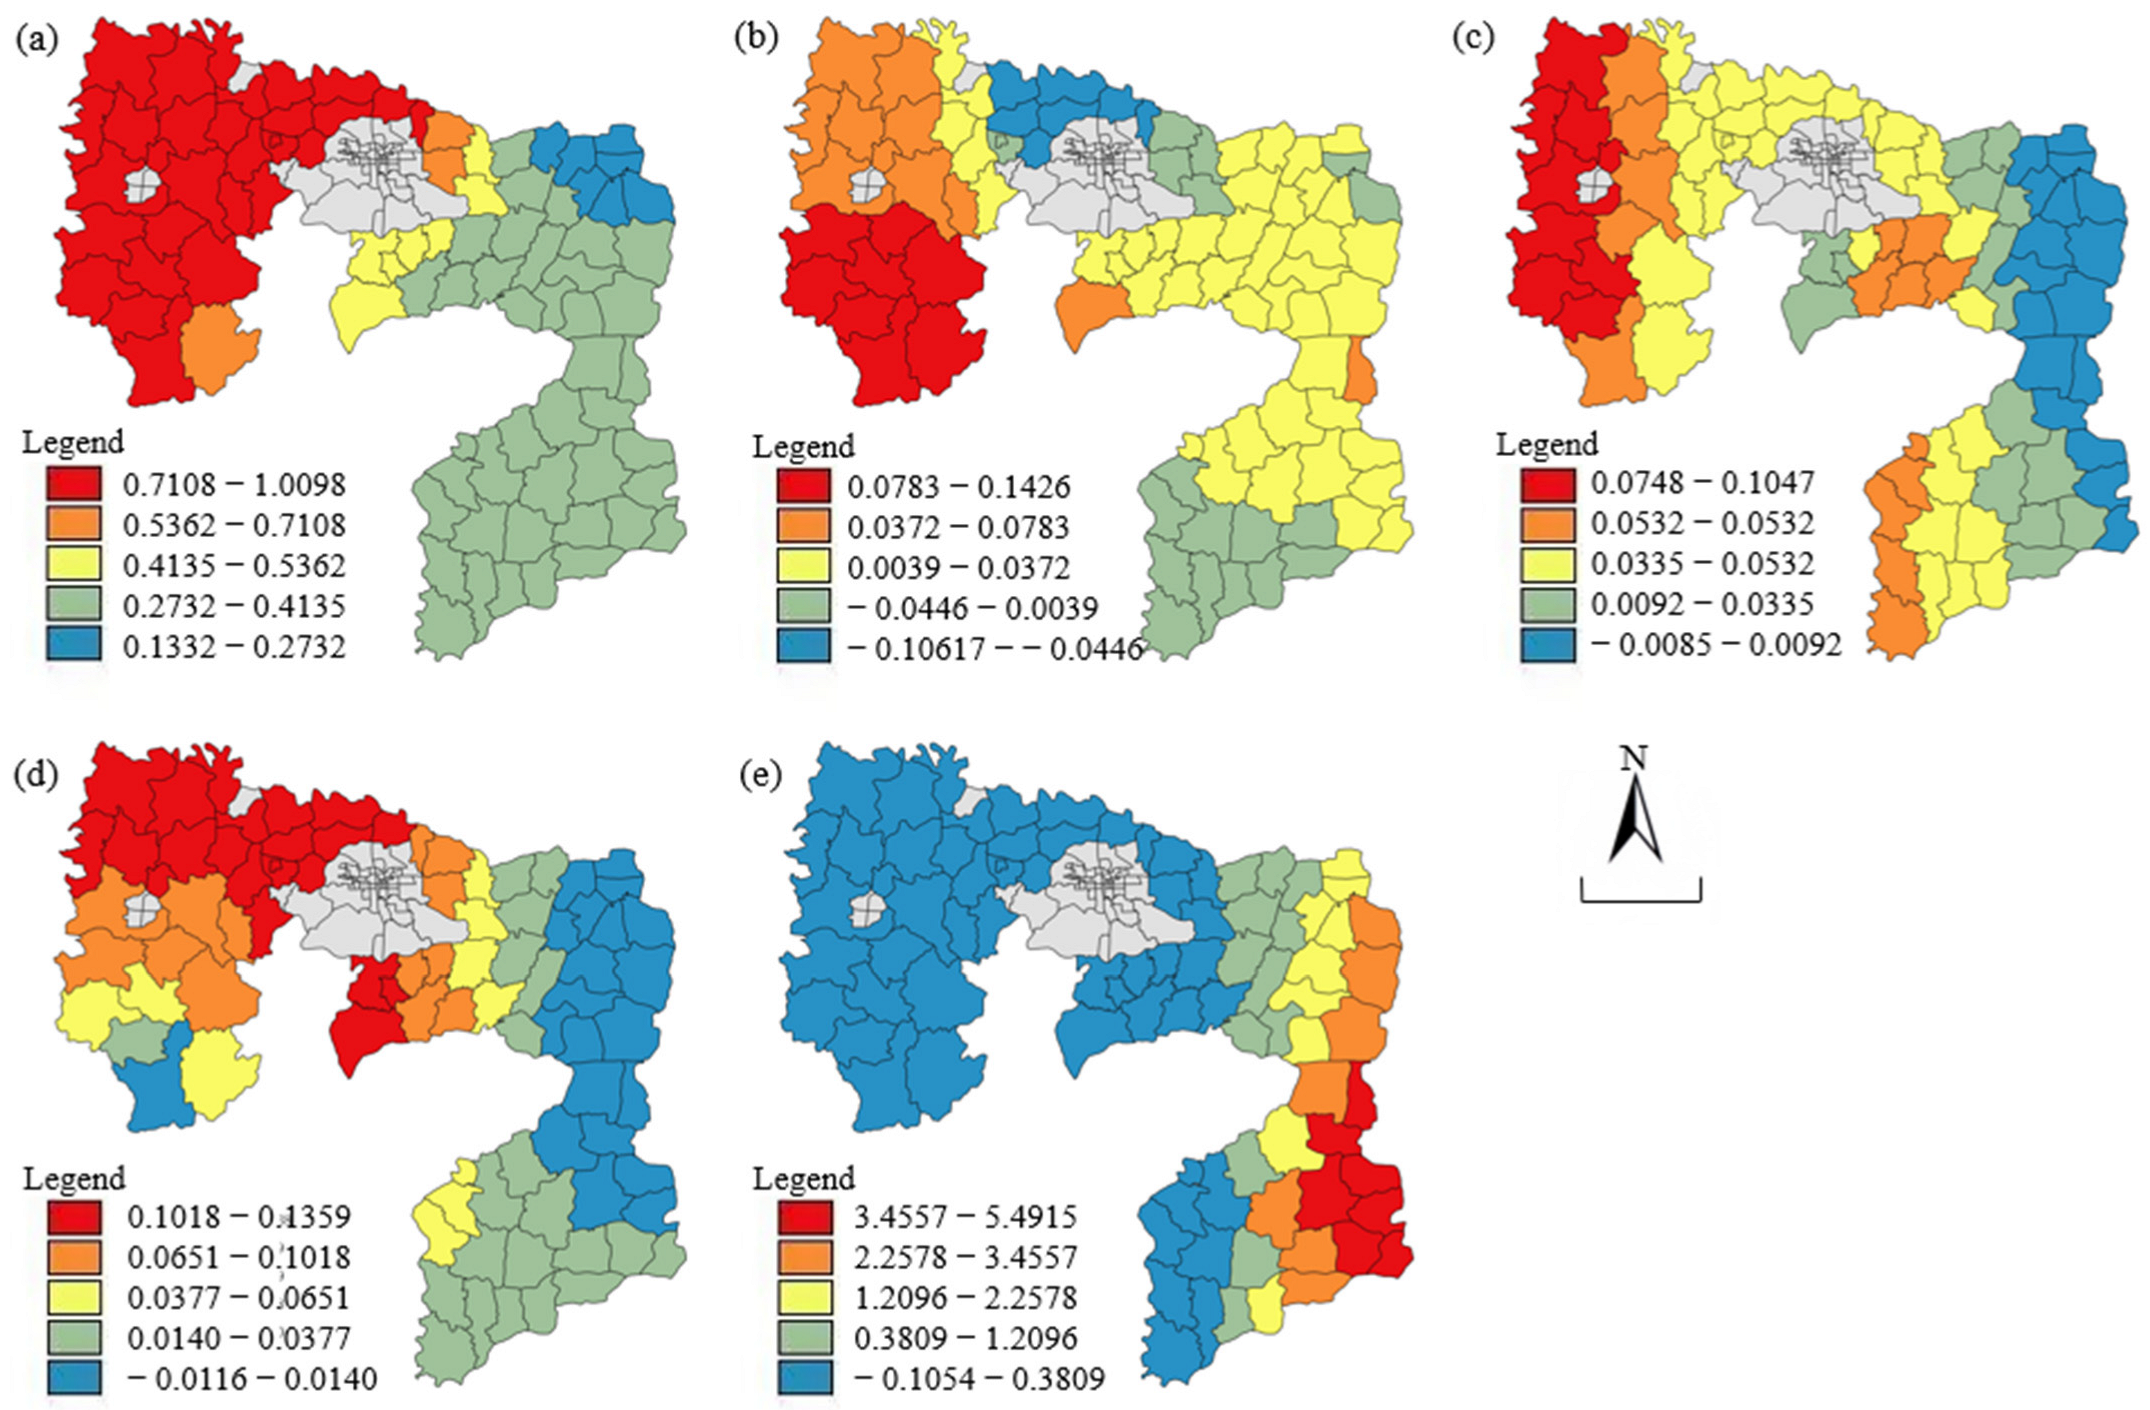
Overall, the influencing factors of township LED in Anyang city exhibited pronounced spatial heterogeneity. The economic development foundation exerted a consistently positive effect across the region, serving as the core driving force for improving LED. Industrial structure optimization and locational advantages were more prominent in the western areas, reflecting the role of industrial upgrading and improved transportation in enhancing land use efficiency. Government support showed a gradient increasing from northwest to southeast, highlighting the critical role of policy guidance in promoting efficient land resource utilization. Natural conditions displayed a “higher in the east, lower in the west” pattern, indicating that terrain remained an important constraint on LED levels. The weak explanatory power of locational advantages and natural conditions may be attributed to the relatively homogeneous terrain and the gradual improvement of transportation infrastructure across Anyang. With ongoing investments in rural roads and public services, the constraints of mountainous terrain and peripheral location have been partially alleviated, leading to a reduced spatial differentiation effect compared with socioeconomic and policy-related factors.
3.5. Spatial Zoning Optimization Scheme Based on LED Pattern
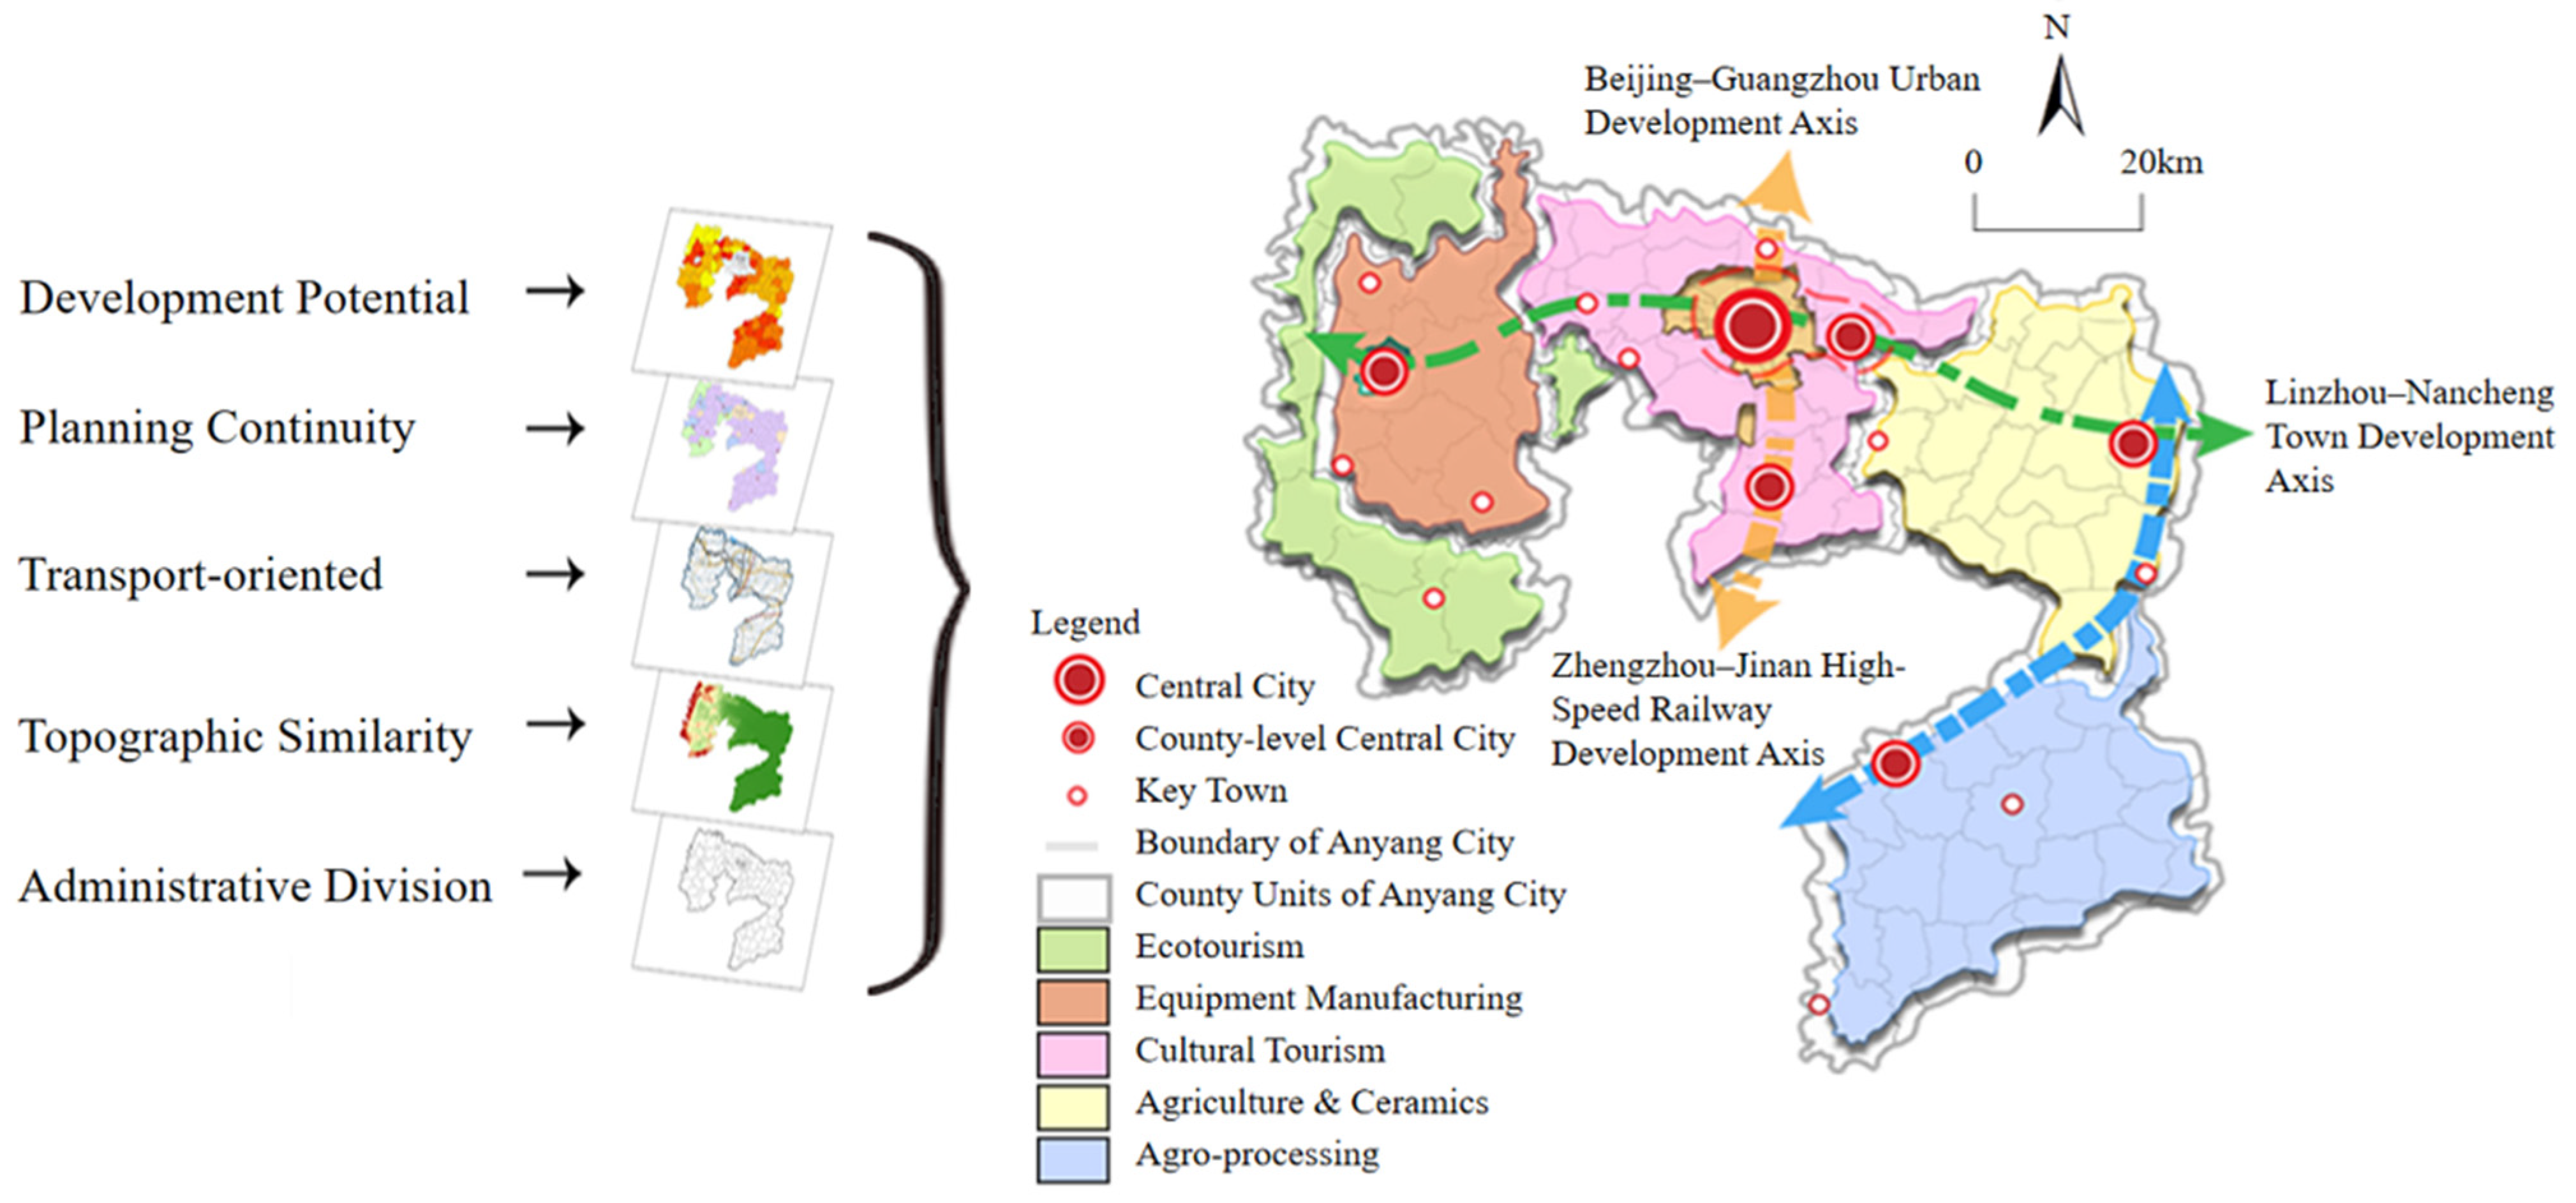
Drawing on the LED evaluation results, the analysis of influencing factors, and the current situation, this study aligned with a multi-level “point–line–area” spatial framework to propose an optimized spatial organization pattern for Anyang City as “One Core–Four Poles, Three Axes–Five Zones.” The proposal comprehensively considered regional economic development, existing plans, transportation conditions, topography, and administrative divisions, with the aim of advancing high-quality township development.
Following the principle of development potential, a basic spatial configuration was established. Areas adjacent to the central city and those in the southeast were designated as high-potential zones, the northeast and west as medium-potential zones, and the eastern and western peripheries as low-potential zones, which were characterized by topographic constraints, economic foundations, and distance from the urban core. The proposed “One Core–Four Poles, Three Axes–Five Zones” spatial optimization framework was developed based on the empirical findings of LED evolution, spatial correlation, and regression analysis, ensuring that the planning recommendations are closely grounded in quantitative evidence.
In line with the principles of planning alignment, the functional zoning was optimized. The central urban districts of Anyang, together with the counties of Tangyin, Linzhou, and Neihuang, were designated as comprehensive-type townships due to their higher economic levels, faster industrial development, and political–cultural functions. Yaocun, Hejian, and Shuiye counties, where secondary industry was rapidly expanding, were classified as industrial-type townships. Resource-rich and suitable areas in the east were designated as tourism service-oriented townships. Guided by transportation corridors and topographic differentiation, regional coordination was promoted. The Beijing–Guangzhou development axis and the Zhengzhou–Jinan high-speed rail economic belt were leveraged to form two major growth axes. The western hilly–mountainous belt, with favorable ecological conditions, was delineated as an environmental protection and ecotourism zone, while the eastern plain, with substantial farmland potential, was positioned as a specialized agricultural production zone.
Finally, with administrative boundaries defining implementation edges, five zones were formed: (1) an Environmental Protection and Eco-tourism Zone, (2) a High-end Equipment Manufacturing Industrial Cluster, (3) a Peri-urban Industry and Cultural–Historical Tourism Zone, (4) a Specialized Agriculture and Green Ceramics Production Zone, and (5) an Agro-product Deep Processing Zone (
Figure 8).
Based on the above analysis, a spatial optimization framework of “One Core–Four Poles, Three Axes–Five Zones” was proposed to guide township-level development in Anyang. The “One Core–Four Poles” structure identifies Baibi Town as the central core, supported by Linzhou and the county seats of Tangyin, Huaxian, and Neihuang as secondary poles, forming the main nodes of regional growth. The “Three Axes–Five Zones” system establishes development linkages through the Linzhou–Nanlecheng, Beijing–Guangzhou, and Zhengzhou–Jinan axes, connecting the core city with county and township centers. The five functional zones are organized according to local resource endowments, integrating industrial clustering, eco-tourism, and agricultural specialization to promote coordinated urban–rural development. These strategies are consistent with global and national frameworks: they contribute to SDG 8 (Decent Work and Economic Growth), SDG 9 (Industry, Innovation and Infrastructure), and SDG 11 (Sustainable Cities and Communities) by enhancing land use efficiency and regional inclusiveness, while also aligning with China’s territorial spatial planning framework, which emphasizes ecological protection, resource optimization, and sustainable spatial governance.
4. Discussion
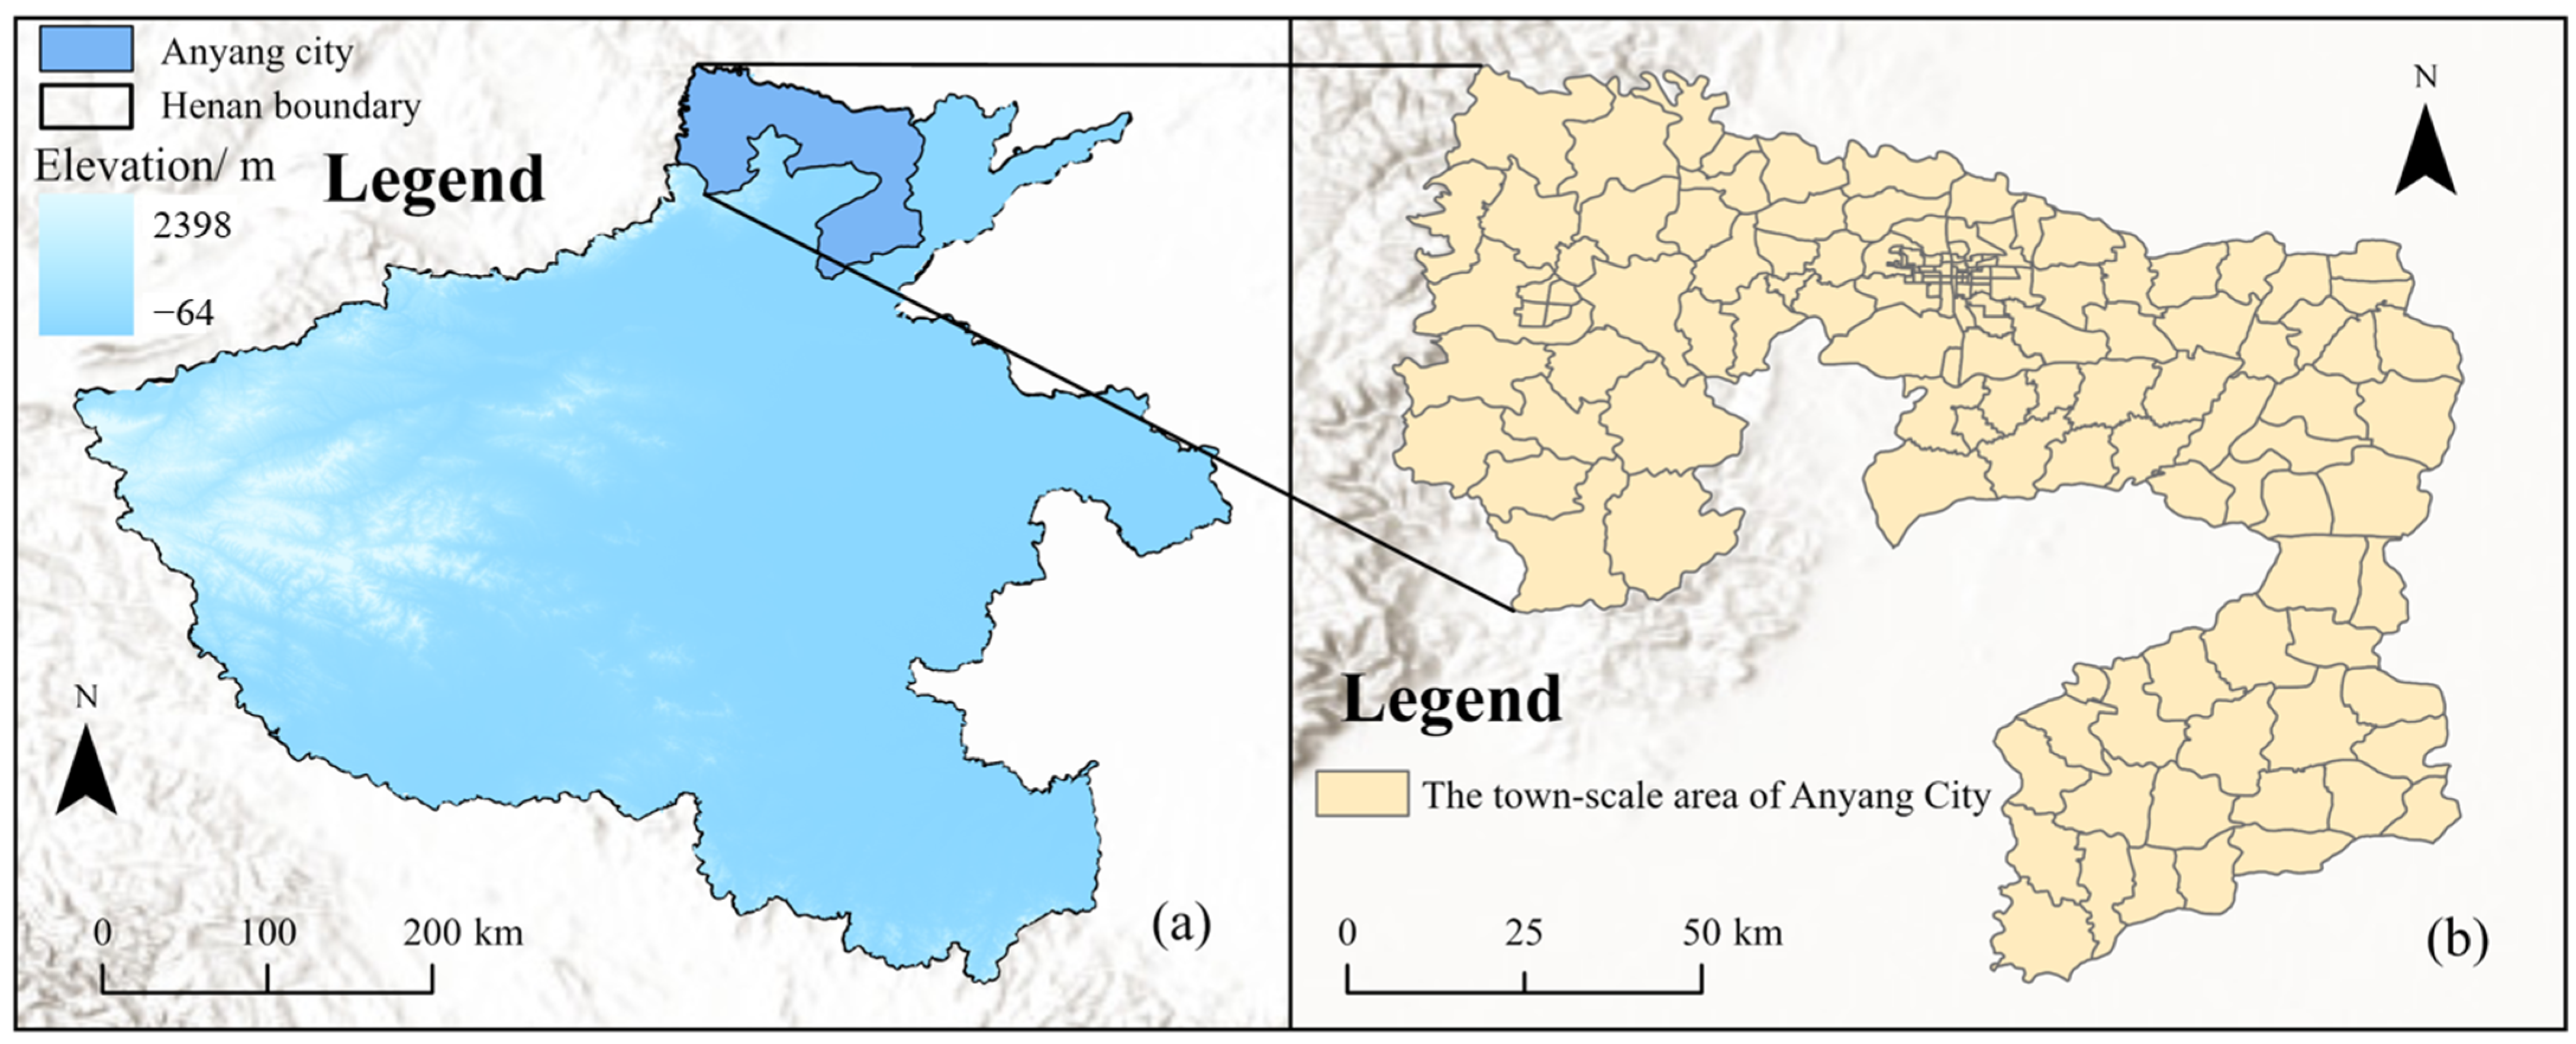
This study adopts 86 township-level units as the basic analytical scale to investigate the spatiotemporal evolution of LED in Anyang. Compared with the conventional city- or county-level approaches [
37,
38], the township scale enables a more detailed portrayal of spatial heterogeneity in the interaction between land use and economic development. Although data acquisition and processing at this fine scale require considerable effort due to difficulties in accessibility and accuracy, the township perspective provides unique insights into intra-regional disparities and localized development mechanisms. Sub-districts were excluded from the analysis because their high level of urbanization and distinct functional orientation make their statistical indicators less comparable to those of predominantly rural townships. Including them could have introduced structural bias by amplifying the influence of urbanized areas, thereby obscuring spatial disparities across semi-urban and rural regions. This exclusion ensures a more consistent analytical framework at the township level, although it may limit the direct applicability of the findings to regions with more complex administrative hierarchies where sub-districts play a central role. The results not only reveal the internal differentiation of land economic density within Anyang but also demonstrate the methodological feasibility and academic value of advancing research to the township level.
Regarding the connotation and assessment of LED, existing studies have mostly relied on a single indicator, such as GDP or the area of construction land, to reflect the output efficiency of land resources. Such approaches, however, fail to capture improvements in the quality of economic development and social well-being [
39]. To address this limitation, this study incorporated four dimensions—economic scale, industrial structure, agricultural modernization, and social security—into its indicator system, aligning with the requirements of high-quality development in the new era. This multidimensional approach not only breaks through the traditional limitation of prioritizing quantity over quality but also reveals the comprehensive performance of LED in achieving multiple objectives, including economic efficiency, industrial upgrading, and social welfare. As a key indicator of regional economic development and land use efficiency, LED is shaped by both regional economic strength and land development intensity. Exploring its underlying influencing factors and mechanisms therefore holds great theoretical and practical significance, and can provide evidence to support the optimization of territorial spatial development patterns.
This study adopts the township as the basic research unit, which allows for a more detailed and fine-grained analysis of LED patterns and the identification of local development disparities that might be overlooked in coarser-scale analyses. The township-level perspective enhances the interpretability of spatial differences and provides more targeted implications for local planning and policy formulation. However, this approach also entails certain limitations. The relatively small spatial scale makes it difficult to fully capture large-scale spatial heterogeneity across broader geomorphic and socioeconomic contexts, such as the coexistence of plains, hills, and mountainous areas within a single city. Moreover, acquiring consistent and comparable township-level data across large regions remains challenging due to variations in statistical standards, data accessibility, and temporal coverage. Consequently, while the township-scale analysis yields valuable localized insights, its findings should be interpreted with caution when extrapolating to larger spatial scales or cross-regional comparisons.
From a research perspective, future work should strengthen multi-scale and cross-regional comparative analyses to uncover the spatial differentiation and scale effects of LED. Expanding investigations across multiple spatial levels, such as villages, townships, counties, municipalities, and broader regions, would provide clearer insights. This approach can help reveal how the determinants and spatial patterns of LED vary across different scales [
40]. Comparative studies across different types of cities, both within the national context and in specific urban agglomerations such as the Central Plains, could further test the transferability of township-scale findings and contribute to building a more generalizable theoretical framework.
From an application perspective, future studies should move beyond descriptive evaluation and introduce practical classification systems, such as distinguishing “high-value, low-value, upgrading, and lagging areas,” to support more targeted policy formulation. Linking such classification with national spatial planning and rural revitalization strategies would enhance the precision and operability of territorial spatial governance. Moreover, integrating dynamic monitoring systems and policy simulation models could provide decision-makers with forward-looking tools to allocate land resources more rationally, balance urban–rural development, and promote long-term sustainability.
5. Conclusions
This study, grounded in the concept of LED, established a multidimensional evaluation index system at township scale, using 86 townships in Anyang as research units. Drawing on five phases of data from 2005 to 2023 and combining spatial analysis methods with GIS visualization techniques, the study systematically assessed the spatiotemporal evolution and driving mechanisms of LED and proposed a differentiated spatial optimization strategy. The main conclusions are as follows:
(1) LED in Anyang shows significant spatial differentiation and a continuous upward trend. High-value areas cluster around the peri-urban ring and the two cores of Linzhou and Huaxian, driven by construction industries and modern agriculture, while low-value areas persist in the northwestern and northeastern peripheries, constrained by topography and weak economic foundations. From 2005 to 2023, overall density improved markedly, but regional imbalances remained: high-value areas expanded and strengthened, low-value areas contracted yet stayed structurally stable, and some townships achieved upward transitions, reflecting the joint effects of path dependence and policy guidance.
(2) Spatial autocorrelation analysis suggests a generally weak overall correlation but the presence of distinct local clustering patterns. HH clusters appear to have expanded from isolated points into a more multi-centered distribution, which may indicate a gradual enhancement of the central city’s radiative influence. LL clusters have become more scattered, possibly reflecting some effects of coordinated development initiatives. In contrast, HL clusters tend to emerge as localized high-value enclaves with limited spatial diffusion, whereas LH clusters may reflect areas of relative stagnation associated with weaker infrastructure and slower growth dynamics.
(3) Standard deviational ellipse analysis shows a persistent northwest–southeast orientation of LED, with the centroid following a “northwest shift–southeast return”. The initial northwestward movement was driven by the rapid growth of secondary industries in Linzhou, while the subsequent southeastward return was spurred by agricultural industrialization and emerging industrial clusters in Huaxian, underscoring the pivotal role of industrial policies in reshaping spatial patterns.
(4) Regression results demonstrate that economic foundation, industrial structure optimization, and government support are the primary driving forces, whereas natural conditions and local advantages play a limited role, highlighting the predominance of human-driven factors. Accordingly, a “One Core–Four Poles, Three Axes–Five Zones” optimization framework is proposed: strengthening the leading role of the central city, fostering four secondary growth poles, constructing three major development axes along transportation corridors, and delineating five functional zones. This framework aims to achieve differentiated development, enhance regional coordination, and improve overall land use efficiency and competitiveness.
