Abstract
Peatlands are the most efficient terrestrial ecosystems for long-term carbon (C) storage. In Ireland, approximately 84% of raised bogs are degraded, contributing an estimated emission of 1.9 Mt C year−1, nearly one-third of which originates from domestic peat extraction sites. Rewetting aims to reduce C emissions and restore sequestration capacity; however, immediate post-restoration effects remain poorly quantified. We investigated the short-term impact of rewetting on C fluxes over a 3-year period at a former domestic peat extraction site. CO2 and CH4 fluxes were measured across rewetted and adjacent unrestored areas with matched ecotopes (vegetation communities). Results show that rewetting led to substantial reductions in C emissions across all ecotopes. Compared to unrestored areas, the Sub-marginal and Facebank ecotopes had lower average annual C emissions by 0.88 and 0.74 t C ha−1, respectively. In the cutover bog, rewetting reduced emissions in Eriophorum and Molinia ecotopes by 2.17 and 0.59 t C ha−1 year−1, respectively. This study demonstrates that rewetting led to immediate carbon reduction, and can deliver immediate climate mitigation benefits. Expanding restoration to include undesignated domestic extraction bogs offers a cost-effective strategy to reduce emissions from degraded peatlands in the near term.
1. Introduction
Generally, natural peatlands function as carbon dioxide (CO2) sinks while emitting small amounts of methane (CH4), thus acting as net carbon (C) sinks [1,2], and store substantial amounts of C [3,4]. As long as peatlands remain undisturbed and water-saturated, they act as a net C sink or small source. However, peatlands are under continuous threat from both anthropogenic and climatic pressures [5,6]. Drainage lowers the water table, accelerating aerobic decomposition and resulting in CO2 emissions, while CH4 fluxes from peat become negligible [7,8,9,10]. However, drained peatlands lose CH4 from drains [11,12,13] along with fluvial C losses, such as dissolved organic carbon (DOC) [12,14]. Overall, drained peatlands are large net C sources [15,16,17].
Rewetting and restoration of drained peatlands aim to re-establish near-natural conditions, support carbon and water regulation, and reinstate ecological functions such as biodiversity enhancement [7,8,15,18]. The extent of rewetting interventions in degraded bogs varies and involves a range of approaches, including drain blocking, cell bunding, tree removal and Sphagnum spp. transfer [6,12,19]. Carbon dynamics after rewetting are influenced by several interacting factors, which include historical and present land use, time since rewetting, nutrient levels and the composition of the vegetation [1,20]. Consequently, the magnitude of these effects may vary considerably between sites [10]. For example, rewetting former peat extraction sites has been shown to significantly reduce CO2 emissions from both bare peat surfaces [21] and vegetated areas [22,23,24]. In some instances, rewetting has resulted in the re-establishment of a CO2 sink [16,17], yet this outcome is not universal [10,25]. In addition, it has been demonstrated that rewetting often results in increased CH4 emissions [3,26,27]. Given the uncertainty surrounding the timescale for restoring the carbon sink function after rewetting, the immediate reduction in carbon emissions may be a more critical outcome of the restoration of the site. To assess the overall climate impact of these fluxes, the global warming potential (GWP) metric can be used to express CO2 and CH4 emissions in a common unit of CO2-equivalents. Although the GWP metric may not accurately represent continuous fluxes in ecosystems [28], it remains a commonly used approach.
Peatlands are increasingly recognised as critical ecosystems under international frameworks, such as the UNFCCC and the Convention on Biological Diversity, where their restoration is identified as a cost-effective climate mitigation measure [3].
At the EU level, this priority is reflected in the LULUCF Regulation, the Common Agricultural Policy (CAP) reform, and most recently, the binding Nature Restoration Law (NRL) [29], which aims to advance climate neutrality, water security, and biodiversity conservation.
Nationally, Ireland has reinforced these commitments through legislation, such as the Climate Action and Low Carbon Development Act, and initiatives that include the Peatland Climate Action Scheme [30]. Despite this recognition, the condition of Ireland’s peatlands remains poor [31], with significant greenhouse gas (GHG) emissions [32]. This implementation gap appears to result from insufficient policy coherence, short-term funding, and poor integration of societal aspects into restoration planning, rather than from a lack of evidence [33].
In Ireland, over 90% of wetlands have been lost [34], with raised bogs among the most affected ecosystems. Approximately 84% of raised bogs have been degraded [10], and as a result, no Irish raised bog remains completely intact, with less than 1% of the original extent considered ‘active’ (i.e., capable of peat formation) [35].
Ireland’s peatlands emit around 1.9 Mt of C per year [36], largely due to extensive degradation through drainage and peat extraction. A significant proportion of this disturbance is associated with domestic peat extraction, which is now the second largest land use on Irish peatlands after grassland [37], accounting for more than one-third of total emissions [36]. Given its large contribution to peatland GHG emissions, reducing emissions from domestic peat extraction represents an important climate mitigation goal.
Most studies on Irish peatlands have focused on GHG emissions after an ‘extended’ period of rewetting/restoration [20,23], with relatively few examining the immediate effects of rewetting efforts [17].
This study addresses this gap by quantifying GHG emissions immediately after the rewetting of a former raised bog in the Irish midlands. We measured CO2 and CH4 fluxes from rewetted areas under different historical land uses: high bog (drained but never extracted) and cutover bog (domestic peat extraction). These were compared with emissions from adjacent unrestored sites to assess reductions in GHG emissions and to evaluate the effectiveness of different restoration techniques.
2. Materials and Methods
2.1. Site Description
Cloncrow Bog (Lat. 53°23′30.5″ N; Long. 7°24′03.3″ W) is a nationally designated raised bog located near Tyrellspass, Co. Westmeath, Ireland (Figure 1a). This bog was selected as it is representative of degraded Irish raised bogs, comprising a typical high bog area and adjacent cutover margins.
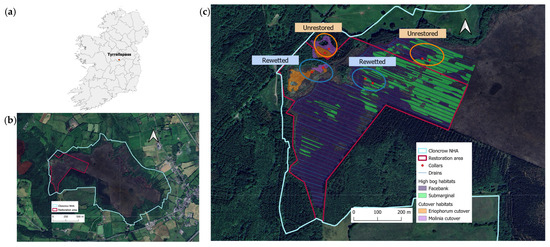
Figure 1.
Location of the study site in Ireland (a), map of designated Natural Heritage Area (NHA) Cloncrow Bog showing restoration (b), and map of the research design (c). Monitored ecotopes on the high bog were Sub-marginal and Facebank, and Eriophorum (MS2) and Molinia (MS3) on the cutover bog. The location of greenhouse gas (GHG) monitoring plots with three collars is indicated by filled red dots. Orange circles represent unrestored areas, and blue circles represent rewetted areas.
The entire designated area covers ca. 230 ha (Figure 1b, light outline); however, this study focused only on its western degraded section (Figure 1b, red outline). The study site comprises 26 ha of degraded high bog and 7 ha of cutover bog. The rewetting programme in the research site of the bog was completed in October 2020, while the adjacent private land remained unrestored [38]. This allowed investigation of two distinct areas: a rewetted site and an adjacent unrestored area.
The high bog at the research site was intensively ditched in the early 1990s but never developed for peat extraction. Significant degradation is evident, resulting from the drainage network, the impact of domestic peat cutting around the margins, and the encroachment of scattered conifers from the adjacent plantation. Prior to restoration, the high bog contained approximately 28 km of deep (up to 1.7 m) parallel drains located approximately 15 m apart [39]. Restoration works in the high bog included the installation of over 900 peat dams, generally placed at every 10 cm drop in elevation (Figure 2). The average thickness of the peat on the high bog is 4.7 m (Table 1).
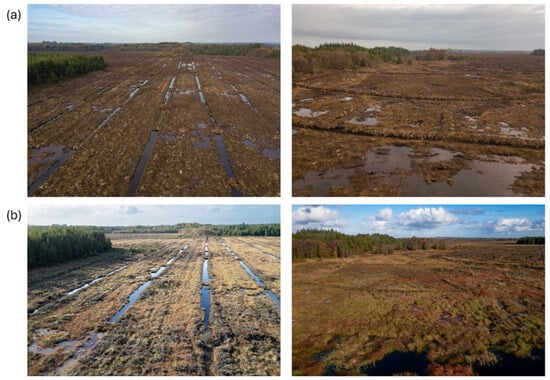
Figure 2.
High bog on the left panel and cutover bog on the right panel (a) immediately after (October 2020) and (b) four years after rewetting (October 2024). Photos: Kevin Collins.

Table 1.
Site description, meteorological data and characteristics for the Cloncrow Bog site. Air temperature and precipitation data (1991–2020) from the Met Éireann Mullingar meteorology station (Lat. 53°32′14″ N; Long. 07°21′44″ W). Soil characteristics acknowledged from MSc thesis “Restoration of the Carbon Storage Capacity of Peatlands” by Hannah Klee, UCD, Dublin, 2022. Vegetation information is taken from ref. [39].
The cutover bog at the study site experienced domestic peat extraction activity in the past, with no evident drains. The area was abandoned around the 1980s and has since naturally regenerated into a wet cutover bog as it received substantial water input from drains that originated in the adjacent high bog. The cutover bog was selected to pilot advanced restoration techniques by creating ca. 865 m of bunding (peat barriers) to keep the water within the area (Figure 2). The average peat depth within the cutover study site is 2.9 m (Table 1).
2.2. Vegetation
A habitat mapping survey of the research site was carried out by ecologists from the National Parks and Wildlife Service (NPWS) prior to the restoration in September 2020 and was repeated three years post-restoration, in November 2023 [39]. The surveys employed ecotope-based classification for both high bogs [35] and cutover bogs [40]. Ecotopes represent distinct vegetation communities characterised by similar hydrology and microtopography, all of which influence C dynamics [41]. As they are commonly used for monitoring raised bogs in Ireland, they also facilitate comparison of equivalent ecotopes across different Irish bogs.
In addition to ecotope mapping, species percentage cover within each collar was conducted on the same days in 2020 and 2023, except in the rewetted cutover area, where the survey was carried out in March 2021 after collar installation. Typically, ecotopes on raised bogs are characterised by concentric zonation, which ranges from the wettest conditions at the centre to progressively drier zones towards the margins. However, as this study was conducted only in a section rather than the entire peatland site, this pattern was not present. The presence of large drainage features in the study site altered the site hydrology, which facilitated the development of ecotopes, such as Facebank along the drains rather than on the margins of the bog, and wetter ecotopes, such as Sub-marginal between the drains.
The dominant ecotopes in the research area were Sub-marginal and Facebank (Figure 3a), covering 27.6% and 45.2% of the site in 2020, respectively [39]. The Sub-marginal ecotope is a transitional zone between the marginal and central parts of a raised bog, characterised by mixed wet and dry vegetation with a discontinuous Sphagnum spp. cover. Facebank was defined as being dominated by Calluna spp. on well-drained peat soil (Table A4 in Appendix D).
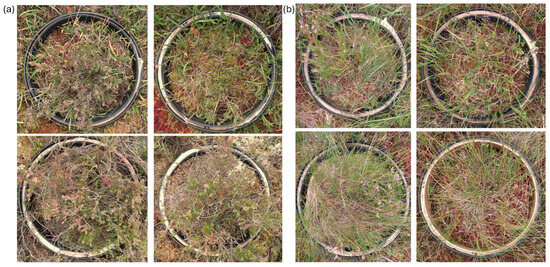
Figure 3.
Monitored ecotopes on high bog (a): top row Sub-marginal ecotopes, bottom row Facebank ecotopes and on cutover bog (b) ecotopes: top row Molinia (MS3), bottom row Eriophorum (MS2). Left panel unrestored, right panel rewetted. Photo: Elena Aitova, August 2021.
In the cutover bog, ecotopes formed a mosaic landscape, and two of the dominant ecotopes were selected for monitoring (Figure 3b). Both ecotopes were from the ‘Moderate Sphagnum’ group (<40%) [39,40]. An Eriophorum ecotope (MS2) was characterised by the abundance of Eriophorum vaginatum (>33%), and the Molinia ecotope (MS3) was defined by the dominance of Molinia spp. [40]. These ecotopes accounted for 22.4% and 14.1% of the cutover bog in 2020, respectively [39].
2.3. Environmental Monitoring
To assess environmental variables at the site at a high temporal resolution, we installed a data loggers (CR300, Campbell Scientific, Shepshed, UK) in the high bog and recorded air temperature (107 Temperature Probe, Campbell Scientific, UK), rainfall (ARG314 tipping bucket rain gauge, Campbell Scientific, UK), incoming solar radiation (CS301, Campbell Scientific, UK) and soil temperature at 5 cm (107 Temperature Probe, Campbell Scientific, UK) at 15 min intervals. Incoming solar radiation (W/m2) was converted to photosynthetic photon flux density (PPFD, µmol m−2 s−1) and the sensor was calibrated to a sensor used inside the chamber [42].
Water table levels (WTL) were recorded every 15 mins by a pressure transducer (CS451, Campbell Scientific, UK) and Water Level Loggers (HOBO MX2001, Tempcon Instrumentation, Ford, UK) in dipwells (4 cm diameter, 3 m long perforated plastic pipes) inserted into each monitoring plot (group of three collars). In addition, we manually measured water table levels in each dipwell once per day, on the same day as GHG measurements. Meteorological and environmental field data were collected following the completion of restoration works, covering the period from November 2020 to October 2023. We also installed wooden boardwalks in each GHG monitoring plot to reduce the pressure on the peat and to prevent damage to vegetation cover during the measurements.
2.4. CO2 and CH4 Monitoring
To assess the impact of rewetting, we selected monitoring plots in the same ecotope in both rewetted (R) and unrestored (UR) areas. GHG measurement collars were positioned to represent the ecological variability within each ecotope. A trade-off was to be found between (1) obtaining detailed temporal data on a limited number of vegetation types and (2) collecting broader but less intensive data across multiple ecotopes. We used three replicate collars per ecotope, a number commonly employed in peatland gas flux studies [21,38], to capture representative spatial variability while ensuring feasibility for long-term, high-frequency monitoring.
On the high bog, 12 round collars (three in each monitoring plot)were installed under both unrestored and rewetted treatments in the dominant ecotopes: Sub- and Facebank. Collars were made from robust plastic pipes (40 cm diameter, Wavin) that were permanently installed 30 cm deep into the ground at least one month before the start of GHG measurements [17]. The undersoil part of the collars had 15 mm holes at approximately 30° intervals to allow for lateral water flow. The collars had a rubber channel on the top to provide a suitable seal with the chamber. On the cutover bog, 12 round collars were established under both unrestored and rewetted treatments in the two dominant ecotopes: Eriophorum and Molinia as described above.
CO2 and CH4 fluxes were measured between March 2021 and September 2023, following the completion of equipment setup and measurement training. Fluxes were measured using the closed static chamber method at fortnightly intervals (summer) and monthly intervals (winter). The technique has been widely used in Ireland and internationally [21,43,44]. The chamber was constructed of clear Perspex (30 cm × 30 cm × 39 cm) and equipped with a fan to ensure mixing of the headspace air. Solar radiation was recorded from a sensor (S-LIB-M003, HOBO Tempcon, UK) located in the chamber and converted to photosynthetic photon flux density (PPFD, µmol m−2 s−1) [42].
CO2 and CH4 measurements were collected simultaneously and recorded at one-second intervals for a period of 60–180 s using an LGR-ICOS Microportable Greenhouse Gas Analyser (Los Gatos Research, ABB Group, Enviro Technology Services, Stroud, UK). On each measurement day, 6–24 collars were sampled between sunrise and late afternoon, ensuring that unrestored and rewetted collars from the same ecotope were measured on the same day. The measurement sequence across ecotopes was randomised to minimise temporal bias.
During the growing season (April–October), flux measurements were conducted under a range of light levels: (1) natural light, (2) reduced light using a partial shroud to permit the variation in incoming PPFD, and (3) complete darkness by covering the chamber with an opaque cover. Between measurements, the chamber was ventilated until CO2 and CH4 concentrations returned to ambient levels. During the winter months (November–March), flux measurements were taken under natural light and full darkness. CO2 flux measured under natural light and a partial shroud represents net ecosystem exchange (NEE), while CO2 flux measured in darkness represents ecosystem respiration (Reco).
Although CH4 flux was recorded under all three light conditions, only measurements taken under natural light were used in this study, based on suggestions that opaque-chamber (dark) methods may underestimate emissions and thus bias flux estimates [45]. For each flux measurement, soil temperature at 5 cm depth was recorded at each collar and the WTL in a dipwell adjacent to each ecotope.
2.5. Flux Calculation
We calculated CO2 and CH4 fluxes from the slope of the linear increase or decrease in flux concentration over time with respect to the chamber volume, collar area, and air temperature [46]. A flux measurement was considered valid if the coefficient of determination (r2) was at least 0.90. Exceptions in flux acceptance criteria and precision assessment were applied for low fluxes, following the methodology described by previous studies [47]. In these cases, we visually inspected the flux data and excluded any fluxes showing clear nonlinearity caused by issues such as chamber leakage, fan malfunction, or ebullition from the analysis.
For this study, a positive sign convention indicates a net loss of C from the peatland, and a negative value indicates C uptake by the peatland. Gross primary production (GPP) was derived by subtracting Reco from NEE [46]. Care was taken to ensure that the air temperature within the chamber and PPFD were constant during each measurement.
2.6. CO2 Flux Modelling
Statistical and physiological response models were constructed and parameterised for each ecotope (Appendix A and Table A1 in Appendix B) [10,17,48]. Model performance was assessed based on statistically significant model parameters (p < 0.05), the lowest possible standard error of the model parameters and the greatest possible adjusted r2 value [49]. Uncertainty in reconstructed annual Reco and GPP was calculated by summing up the maximum and minimum standard errors associated with each of the model parameters [47].
In constructing the models, we tested the relationships between Reco, GPP, or CH4 and various independent environmental variables measured alongside flux data and included only those variables that enhanced the model’s explanatory power. Models were deemed acceptable if their residuals were evenly distributed around zero. GPP was modelled in relation to PPFD using a Michaelis–Menten-type equation, which captures the saturating response of photosynthesis to light [50] and incorporates peat temperature and/or water table levels ((a) in Appendix A). The Reco models are derived from the Arrhenius equation [51] and are nonlinear, depending on soil temperature and water table levels ((b) in Appendix A).
2.7. Annual Carbon Balances and GWP
Hourly fluxes were estimated for each ecotope using an hourly time series of (1) soil temperature at 5 cm depth, (2) PPFD measurements from the weather station, and (3) WTL. Annual NEE (t C ha−1 year−1) for each ecotope was determined by integrating the hourly modelled GPP (negative fluxes) and Reco (positive fluxes). No significant relationships were found between CH4 fluxes and any measured environmental parameters. As fluxes exhibited pronounced temporal variability, annual CH4 emissions (t C ha−1 year−1) were estimated by linear interpolation between measurement dates. Carbon (C) balance (t C ha−1 year−1) was calculated based on the combined CO2 and CH4 fluxes over each 12-month period.
The global warming potential (GWP; t CO2-eq ha−1 year−1) was derived by converting annual emissions for each gas (t C ha−1 year −1) to CO2 (t CO2 ha−1 year−1) and CH4 (t CH4 ha−1 year−1) using factors of 3.667 and 1.334, respectively, and applying 100-year horizon GWP values of 1 for CO2 and 27.2 for CH4 [52]. Negative values indicate a net cooling effect, while positive values indicate net warming.
2.8. Statistical Analysis
Statistical analysis was performed using R 4.3.3 (R Core Team, 2024). p values < 0.05 were considered statistically significant. All data were tested for normality using the Shapiro–Wilk test. Where the data were not normally distributed, non-parametric tests such as the Wilcoxon signed-rank and Linear Mixed Model non-parametric tests were used.
Standard errors of estimates are shown in parentheses for all fluxes Reco, GPP, and NEE and one standard deviation is shown for CH4, WT level, and peat temperature. As NEE is not directly modelled, uncertainty in the annual NEE estimate was calculated following the law of error propagation as the square root of the sum of the squared standard errors of GPP and Reco.
3. Results
3.1. Weather
Inter- and intra-annual variability was observed over the 3-year monitoring period post-rewetting. A distinct seasonal pattern in air temperatures was evident and similar for all years of the study (Figure 4). The lowest air temperature (−7.4 °C) was recorded in January 2021, while the highest air temperature (31.1 °C) was observed in July 2022. Average annual air temperatures at Cloncrow Bog for each 12-month period were 9.8, 10.3 and 10.4 °C, with the last two years considerably higher (c. 11%) than the long-term average of 9.3 °C (1991–2020) at the weather station at Mullingar located c. 18 km NE from the study site.
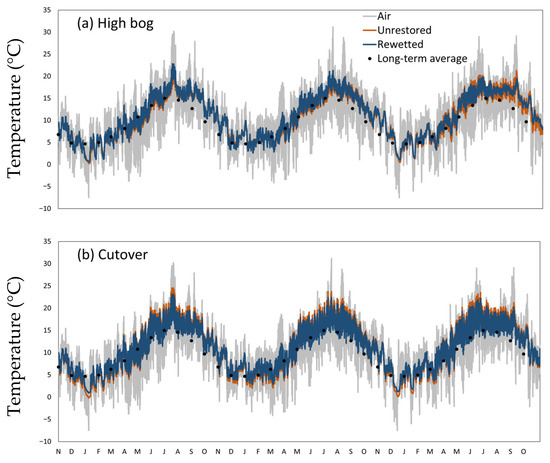
Figure 4.
Hourly air and soil temperatures (°C) at (a) high bog and (b) cutover bog for the duration of the study. Dark circles indicate monthly 30-year average air temperature (1991–2020; www.met.ie).
Annual rainfall for each 12-month period was 961 mm, 967 mm and 1127 mm, respectively. Precipitation during the first two years was similar to the long-term average of 986 mm (1991–2020). In year 3, rainfall was 14% higher than the long-term average, as July, August and September received 75% more rainfall than the 30-year average for the same months.
Soil temperature showed strong seasonality in both unrestored and rewetted areas (Figure 4). The soil temperatures were significantly different between unrestored and rewetted sites for the Sub-marginal and Facebank ecotopes (Table A2a in Appendix C). No statistically significant differences in peat temperature were observed between unrestored and rewetted areas in the cutover bog ecotopes (Table A2a in Appendix C). The results of the Linear Mixed Model indicated that there was no statistical difference in soil temperature between years at either ecotope (p > 0.05). The minimum and maximum values in soil temperature were always observed in the unrestored ecotopes in winter and summer, respectively, and daily variability was always more pronounced in the unrestored ecotopes.
3.2. Hydrological Parameters
Both rewetted and unrestored areas displayed strong seasonal variability and were subject to considerable fluctuations throughout the study period (Figure 5). The mean annual WTL at all rewetted areas was above −11 cm of the peat surface throughout the study period. In the unrestored areas, the mean annual WTL remained within 25 cm below the peat surface over the 3-year monitoring period. The WTL was significantly different (Wilcoxon signed-rank, p < 0.001) between rewetted and unrestored treatments for all ecotopes.
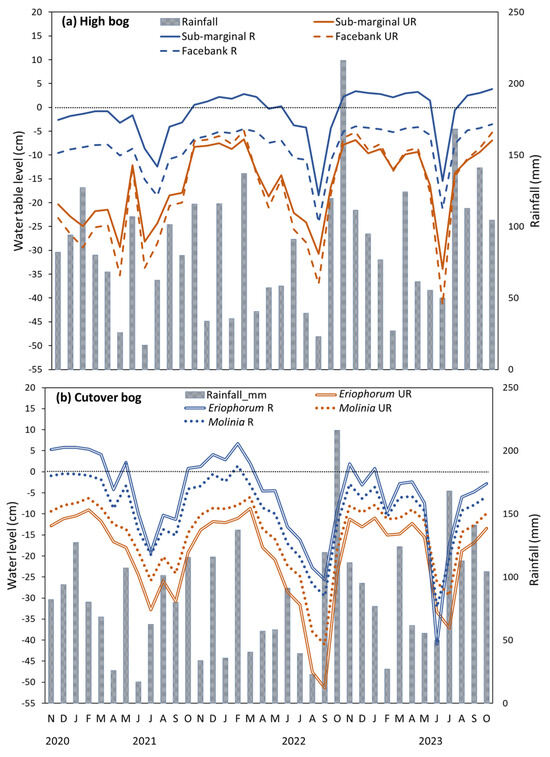
Figure 5.
Mean monthly water table (cm) in the high bog and cutover bog restored (R) and unrestored (UR). The surface is represented at 0 cm (black dotted line).
Results from the Linear Mixed Model indicated statistically significant differences in water level between year 1 and year 3 at all ecotopes (p < 0.001), with the exception of the unrestored cutover area, where no significant change was observed (p = 0.47 for Eriophorum and p = 0.46 for Molinia ecotopes).
3.3. Vegetation Profile
Within the collars, all ecotopes, with the exception of the Facebank (<1% cover in the rewetted, none in the unrestored), supported Sphagnum spp. cover. In the remaining rewetted ecotopes, three years after rewetting, Sphagnum cover within the collars increased by 48–62%, compared to a maximum of 27% in unrestored ecotopes (Table 2). As a result, average Sphagnum cover in the rewetted collars exceeded 80%.
Table 2.
Mean Sphagnum cover change (%) within the collars before (2020) and after the rewetting (2023). Data is presented as the mean of three collars within each ecotope.
The total extent of monitored ecotopes at the study site changed in the three years after rewetting (see ref. [39]). In the high bog, the Sub-marginal ecotope decreased slightly (<1% or 0.06 ha), while the Facebank ecotope declined by 35% (4 ha). In the cutover bog, the Eriophorum ecotope decreased by 39% (0.3 ha), whereas the Molinia ecotope increased by 11% (0.06 ha).
3.4. Carbon Dioxide Fluxes
The GPP models were strongly dependent on PPFD and either WTL, soil temperature at 5 cm depth or the Day of the Year (DOY) with r2 = 0.55–0.68 ((a) in Appendix A). The Reco models performed well (r2 = 0.58–0.71) and were strongly dependent on soil temperature at 5 cm depth and WTL ((b) in Appendix A).
The results showed a clear contrast in CO2 dynamics between the high bog and cutover bog sites. The magnitude of the monthly mean values of GPP and Reco was greater in the cutover ecotopes compared to those in the high bog (Figure 6). The Wilcoxon signed-rank test confirmed significant differences in Reco, GPP and NEE between rewetted and unrestored treatments across all ecotopes on both bog types (Table A2b in Appendix C). NEE showed a strong relationship with mean annual WTL for all ecotopes apart from Molinia and rewetted Sub-marginal (Appendix E).
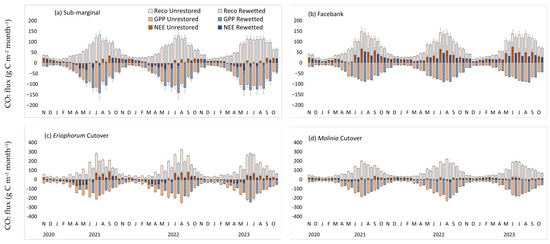
Figure 6.
Monthly mean modelled net ecosystem exchange (NEE), gross photosynthesis (GPP) and ecosystem respiration (Reco) in g C m−2 year−1 ± standard error in the high bog (top panel) and cutover bog (bottom panel). Positive values indicate a loss of C to the atmosphere; negative values indicate uptake by the peatland.
In the high bog, the Sub-marginal ecotope was a CO2 sink in the rewetted area and a CO2 source in the unrestored area (Table 3). In this ecotope, GPP was typically greater in the rewetted area during the summer months (Figure 6). For the first two years, the rewetted area was a CO2 sink from March to July, and this extended to August in year 3 (Figure 6). Following a small net CO2 loss in year 1, the rewetted Sub-marginal ecotope transitioned to a net CO2 sink in the next two years (Table 3). The unrestored ecotope remained a CO2 source across all three years, although emissions decreased (Table 3).
Table 3.
Mean water table level (WTL, cm), soil temperature at 5 cm depth (T5cm), ecosystem respiration (Reco), gross photosynthesis production (GPP), net ecosystem exchange (NEE) and methane fluxes (CH4) for each ecotope during the 3 years of study. Positive values indicate a loss of carbon (C) to the atmosphere; negative values indicate uptake by the peatland. R = rewetted, UR = unrestored. Standard errors of estimates are shown in parentheses for Reco, GPP and NEE, and one standard deviation is shown in parentheses for CH4 fluxes, WTL and soil temperature at 5 cm depth (T5cm). All carbon values are presented in g C m−2 year−1.
In contrast to the Sub-marginal ecotope, the rewetted Facebank ecotope did not transition to a CO2 sink. Both rewetted and unrestored Facebank continued to act as net CO2 sources throughout the study, with this ecotope exhibiting the highest CO2 emissions of all ecotopes in the study. During the winter period, Reco and GPP in the Facebank ecotope exhibited similar values. In the summer months, the rewetted Facebank ecotope demonstrated lower Reco and greater GPP when compared to the unrestored ecotope (Figure 6). Mean annual NEE progressively increased over the monitoring period in both the unrestored and rewetted areas (Table 3). Nevertheless, rewetting still resulted in reduced CO2 emissions relative to the unrestored condition, although the magnitude of this reduction in the Facebank ecotope was smaller compared to the Sub-marginal (Table 3).
In the cutover bog, the unrestored Eriophorum ecotope functioned as a persistent CO2 source throughout the study, while the rewetted area acted as a net CO2 sink, showing the strongest treatment effect of all ecotopes (Table 3). The rewetted Eriophorum ecotope exhibited lower GPP and Reco compared to the unrestored, especially in year 1 and year 2 (Figure 6), and showed the highest annual CO2 uptake in year 1, declining in year 3 (Table 3).
Both unrestored and rewetted Molinia ecotopes functioned as a CO2 source throughout the study. The CO2 emissions in the rewetted ecotope were lower than those in the unrestored area (Table 3). However, this reduction in CO2 emissions due to rewetting was smaller in magnitude than that observed in the other monitored ecotopes. The rewetted Molinia followed the same trend as the Eriophorum ecotope: lower GPP and Reco in the rewetted ecotope compared to the unrestored in the first two years (Figure 6).
3.5. Methane Fluxes
In the high bog, measured CH4 fluxes were consistently and significantly lower (LMM, Estimate = −2.86 ± 0.15 SE, t = −19.16, p < 0.001) than those measured in the cutover bog. In addition, several CH4 flux spikes were observed in year 1 in the cutover bog (Figure 7). The highest fluxes were recorded from the cutover ecotopes that contained Eriophorum spp. (E. vaginatum and E. angustifolium), which emitted greater CH4 in comparison to the high bog ecotopes where Eriophorum spp. were only sparsely present (Table 3).
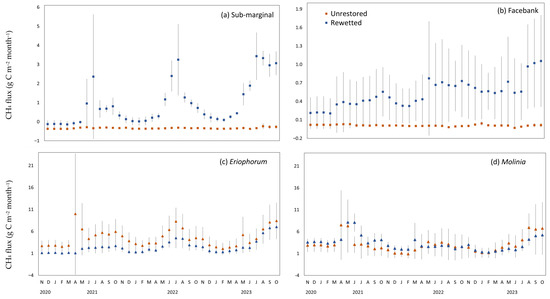
Figure 7.
Measured monthly means of methane (CH4) fluxes (g C m−2 month−1) in the four ecotopes in the high bog (two top panels) and the cutover bog (bottom panel). Blue color represents rewetted, while orange represents unrestored. Error bars represent standard deviation (three collars for each plot). Note that y-axis scales differ to accommodate variation in flux magnitude among ecotopes.
In the high bog, monthly mean CH4 fluxes were significantly higher in all the rewetted ecotopes compared to the unrestored (Table A2b in Appendix C). All CH4 fluxes from the rewetted area in the high bog followed a seasonal trend (Figure 7), with the lower emissions seen in winter (0.2 to 0.6 g C m−2 month−1) and becoming larger during the summer (0.35 to 3.8 g C m−2 month−1). Measured CH4 fluxes remained consistently low in both ecotopes in the unrestored areas (Figure 7). The unrestored Facebank ecotope exhibited the lowest CH4 fluxes of all four ecotopes and occasionally acted as a small CH4 sink, with a maximum uptake of −0.12 mg CH4 m−2 h−1
All cutover bog ecotopes in both unrestored and rewetted areas were the highest emitters of CH4 fluxes in this study. Still, significantly lower monthly CH4 fluxes (Table A2b in Appendix C) were observed in the rewetted Eriophorum ecotope compared to unrestored (Table 3). Measured CH4 fluxes from the unrestored Eriophorum ecotope remained relatively stable over the monitoring period (Table 3).
In the Molinia ecotope, CH4 fluxes peaked in year 1 for both treatments, driven by several spikes recorded between April and June 2021. Monthly CH4 fluxes did not differ significantly between treatments (Table A2b in Appendix C), with similar 3-year averages observed in the unrestored and rewetted ecotopes, respectively (Figure 7, Table 3). Both rewetted and unrestored cutover ecotopes acted as CH4 sources and exhibited seasonal variations, being generally lowest in winter (0.9 to 3.8 g C m−2 month−1) and peaked during the summer months (1.8 to 8.3 g C m−2 month−1) (Figure 7).
3.6. Carbon Balance and GWP
Over the 3-year post-rewetting period, the C balances were consistently lower in rewetted areas than in the unrestored areas across all ecotopes (Table 4). The Sub-marginal ecotope functioned as a net C sink only in year 2, while the rewetted Eriophorum ecotope was a net C sink in the first two years (Table 3). Over the study period, only the Eriophorum ecotope remained a consistent net C sink, while the other ecotopes acted as a C source.
Table 4.
Three-year annual average net ecosystem exchange (NEE), methane (CH4), average carbon (C) balance in t C ha−1 year−1 and Global Warming Potential (GWP) in t CO2-eq ha−1 year−1 for each ecotope from November 2020 to October 2023 for unrestored (UR) and rewetted (R) areas. Positive values indicate a net loss of C to the atmosphere, while negative values indicate C uptake by the peatland.
The greatest avoided emissions were observed in the rewetted Eriophorum ecotope, where rewetting resulted in emission reductions of 2.17 t C ha−1 year−1 (3-year average) (Table 4).
All ecotopes had an average positive GWP, with the lowest in the unrestored Sub-marginal ecotope and the highest occurring in the unrestored Eriophorum ecotope (Table 4). In the high bog, CH4 emissions represented the majority of the total GWP in the rewetted Sub-marginal ecotope (105%), while other ecotopes contributed less than 20%. In the cutover bog, CH4 emissions dominated the total GWP in both ecotopes, accounting for 73–78% in the unrestored and 85–117% in the rewetted areas.
4. Discussion
4.1. Ecohydrological Regime
The significantly higher WTL in rewetted areas of the high bog and cutover bog compared to the unrestored areas (Figure 5 and Table 3) indicates that both restoration techniques (i.e., drain blocking on the high bog and cell bunding on the cutover bog) were effective in reversing the effects of historical drainage, bringing WTL closer to those found in natural peatlands [17,53,54]. If a degraded peatland is left unrestored, the WTL is generally unable to rise sufficiently or effectively on its own [55], as reflected in the absence of any significant water level response in the unrestored cutover areas. Corresponding to increased WTL, Sphagnum cover increased across all ecotopes after the rewetting (with the exception of the Facebank ecotope), which would suggest that vegetation trajectories are proceeding toward typical raised bog assemblages [10].
The rewetted Sub-marginal ecotope maintained a WTL at or near the surface for over 90% of the monitoring period, a key hydrological threshold to support peat-forming vegetation [56]. The increase in Sphagnum cover was primarily driven by S. papillosum (Table A3a in Appendix D). The rewetted Sub-marginal supported the most Sphagnum-rich communities, including S. capillifolium subsp. rubellum, S. papillosum, S. tenellum, S. magellanicum, and S. subnitens (Table A3a in Appendix D). This stable, elevated WTL and the dominance of Sphagnum species (Table 2) suggest a transition towards a Sub-central ecotope within three years of rewetting.
The rewetted Facebank ecotope is adjacent to large drains and showed clear hydrological improvement but no evidence of Sphagnum spp. recovery during the post-rewetting period (Table 2). Here, rewetting led to a decline in Calluna vulgaris and an increase in bare peat cover compared with the unrestored area (Table A3a in Appendix D). This likely reflects surface instability and vegetation loss following a rapid rise in the WTL. Enhanced interventions such as surface re-profiling and/or Sphagnum spp. reintroduction may be required to accelerate recovery [57,58]. Surface re-profiling involves the physical reconfiguration of the peatland surface by ground smoothing or topsoil removals to enhance water retention and promote Sphagnum establishment [58, 59, 60]. Continued monitoring is essential to assess when bare peat areas begin to recover.
In the cutover bog, rewetting resulted in significantly higher water tables compared to the unrestored areas. The gradual WTL decline observed in the rewetted Eriophorum ecotope (Table 3) may indicate stabilisation towards a more balanced hydrological regime. Located adjacent to the bund, this area experienced initial water accumulation following restoration, which diminished as conditions normalised. The temporal fluctuations in WTL in the rewetted Molinia ecotope (Figure 5 and Table 3) are likely to highlight the sensitivity of cutover bog to inter-annual climate variability. Nonetheless, the relatively high WTL suggests that rewetting can buffer short-term climatic variation, even if full hydrological stability may require more time [61].
The increase in Sphagnum cover in cutover bog was almost entirely attributable to S. capillifolium in both rewetted ecotopes (Table A3b in Appendix D), whereas the same species declined in the unrestored areas. This increase led to the shift from ‘Moderate’ to ‘High’ Sphagnum cover groups in monitored plots (Table 2). In the Eriophorum ecotope, rewetting led to an overall increase in Sphagnum cover, mainly driven by a 69% rise in S. capillifolium despite a 17% decline in S. papillosum, while in the unrestored area, total Sphagnum cover showed a slight decrease. In the Molinia ecotope, rewetting led to a greater decline in M. caerulea cover (15%) compared with the smaller reduction observed in the unrestored area (2.5%).
The variability in ecohydrological conditions between high bog and cutover bog, and between ecotopes, highlights that historical degradation and microtopography continue to influence ecohydrological outcomes of restoration. Long-term monitoring is therefore required to assess site trajectories under changing climatic conditions and to evaluate the progress of ecological recovery [7,62,63].
4.2. GHG Dynamics
Rewetting had a significant impact on CO2 emissions (Table 3 and Figure 6), although the effect of rewetting differed between the high bog and cutover bog. The elevated WTL in the rewetted areas resulted in less CO2 emissions across all ecotopes in both areas. GPP and Reco showed strong seasonal patterns, peaking during summer. In rewetted Sub-marginal and Eriophorum ecotopes, higher GPP relative to Reco suggests improved photosynthetic capacity after rewetting (Figure 6).
Three years following restoration, the rewetted Sub-marginal ecotope transitioned to a net CO2 sink, and the resulting annual average NEE is consistent with previously reported NEE values for this ecotope type (Table 5). Notably, year 3 experienced elevated air temperatures (Figure 4) and a drier early summer, with May and June 20% and 23% drier, respectively, than the long-term average. These conditions may have contributed to the observed increased Reco and consequently lower NEE during that period (Table 3), highlighting the vulnerability of peatland C dynamics to inter-annual climate variability [64]. As the rewetted Sub-marginal ecotope transitioned towards a more Sub-central ecotope, measured CH4 fluxes resembled those typically associated with that ecotope (Table 5) [3,48]. These indicators point to a shift towards a peat-accumulating Active Raised Bog (ARB) habitat [35]. In contrast, if left unrestored, the Sub-marginal ecotope in our study emitted notably more CO2, exceeding values reported in earlier Irish studies for the same ecotope (Table 5). Although these estimates are subject to considerable uncertainty, they are still within the wider range for drained peat extraction sites in Ireland and the UK [65].
The rewetted Facebank ecotope remained the CO2 source. This aligns with findings from other studies, where highly degraded sites, e.g., those lacking Sphagnum spp. recovery, continued to emit elevated levels of CO2 for several years post-rewetting [10,66,67]. The annual CH4 fluxes recorded in the rewetted Facebank ecotope were comparable to those reported for similar ecotopes in Irish raised bogs (Table 5). The unrestored Facebank ecotopes were the largest sources of CO2 in this study, with emissions approximately 70% higher than those previously reported for similar ecotopes on Irish raised bogs, although the estimation of Reco is associated with considerable uncertainty (Table 5, Figure 6). Nevertheless, these values fall within the uncertainty range associated with Tier 1 emission factors for drained temperate peatlands [68].
Across all ecotopes, the greatest reduction in CO2 emissions after rewetting was observed in the Eriophorum ecotope. This ecotope, under rewetted conditions, functioned as a net CO2 sink with annual fluxes aligning with the Tier 2 emission factor for rewetted, nutrient-poor cutover peatlands in Ireland [36].
In contrast, under drier conditions in the unrestored area, the Eriophorum ecotope remained a substantial source of CO2, exhibiting some of the highest emissions reported for Eriophorum-dominated vegetation in Irish peatlands (Table 5), in line with the deeper water tables observed at this site. This contrast highlights the strong climate mitigation potential of rewetting for Eriophorum ecotopes and suggests it is particularly responsive to hydrological restoration [21,43,55]. Measured CH4 emissions in Eriophorum ecotopes declined after rewetting, which challenges a common concern that restoration comes at the expense of increased CH4 emissions and would suggest that restoration can deliver climate mitigation benefits across both CO2 and CH4 emissions. This strengthens the case for rewetting as a viable strategy for net GHG reduction, particularly when it supports stable hydrological conditions around –10 cm (Table 3). Importantly, E. vaginatum may facilitate Sphagnum recolonisation under stable water table conditions, acting as a ‘nurse’ species (Table 2) [21], which may help stabilise CH4 dynamics over time [26,69].
The unrestored Molinia ecotope also showed one of the highest CO2 emissions among Irish cutover peatlands (Table 5), although still lower than those observed in comparable vegetation reported for rewetted, previously forested blanket bog [70]. However, the continued CO2 losses from the rewetted ecotopes suggest that more enhanced interventions may be required than hydrological restoration alone to halt carbon emissions in the short term, particularly in areas that might have experienced prolonged or severe degradation [6,57,71]. The Molinia ecotopes showed no significant difference in CH4 emissions between rewetted and unrestored conditions. This implies that rewetting alone may not influence CH4 fluxes and that other factors, such as vegetation composition, soil properties and historical land use management, may influence emissions [72, 73, 74].
It is important to note that CH4 fluxes in both cutover ecotopes were high, regardless of treatment (Table 5), and were occasionally punctuated by large emission spikes, possibly due to ebullition events. These episodic events contributed to high variability and pronounced uncertainty in the flux estimates (Figure 7).
Our findings demonstrate that the rapid and positive C response to rewetting could happen in both high bog and cutover bog, as evidenced by Sub-marginal and Eriophorum ecotopes. This is particularly relevant given that these ecotopes are common across degraded raised bogs and cutover margins in Ireland.
Although both Facebank and Molinia ecotopes remained net sources of CO2 following rewetting, they exhibited substantial reductions in emissions relative to their unrestored counterparts (Table 3). This highlights the potential of rewetting efforts as an effective climate mitigation strategy, primarily through the reduction of CO2 emissions via raised water tables and the suppression of aerobic soil respiration [75]. Overall, the evidence supports a more optimistic view of rewetting: it can reduce CO2 emissions without inevitably elevating CH4 fluxes, especially in the areas where Sphagnum regeneration is possible.
Table 5.
Average annual Net Ecosystem Exchange (NEE) and methane (CH4) emission factors for various ecotopes in nutrient-poor Irish peatland sites under natural (N), unrestored (UR), drained (D) and rewetted (R) conditions. Positive values indicate a loss of carbon (C) to the atmosphere; negative values indicate uptake by the peatland. WTL is water table level below the ground surface in cm.
4.3. Carbon Balance and GWP
Across all ecotopes, rewetting consistently lowered combined CO2 and CH4 emissions relative to unrestored areas (Table 4), mainly due to reductions in CO2 fluxes.
Both high bog ecotopes in this study continued to be C sources, although the emissions were substantially reduced. Over the course of the study, the Sub-marginal ecotope is approximately carbon neutral, while the Facebank ecotope remained a large C source (Table 4). The rewetted Sub-marginal ecotope exhibited a higher GWP than the unrestored site, primarily due to increased CH4 emissions associated with the elevated WTL following rewetting. However, as Sphagnum cover continues to expand (Table 2), CH4 emissions are expected to decrease over time [43].
For the cutover ecotopes, the rewetted area showed a rapid response to rewetting in terms of NEE, CH4 and resulting GWP, although the responses of both ecotopes varied. The Molinia ecotope remained a C source, while the Eriophorum ecotope transformed into a small sink (Table 4). Both rewetted ecotopes had lower GWP than unrestored ones, mainly due to reduced CO2 emissions.
It should be noted that emissions from open water were not quantified in this study. Similarly, off-site emissions from fluvial losses were not assessed due to logistical and financial constraints; however, they may represent a substantial component of the C balance [7,23,82].
Even in degraded areas where the C sink function was not re-established, such as the Facebank and Molinia ecotopes in this study, restoration remains preferable, as leaving peatlands unrestored results in persistently high GHG emissions and ongoing ecological decline [15,27]. Restoring C sequestration can take decades [6,83], yet most studies monitor peatland C dynamics for only a few years [69,74], limiting understanding of long-term recovery trajectories.
4.4. Rewetting Benefits for Peatland Protection
In Irish raised bogs, high bogs are frequently situated adjacent to cutover areas, a landscape configuration that reflects the historical practice of domestic peat extraction, which was typically concentrated along the bog margins [31]. High bogs are frequently affected by anthropogenic drainage through the construction of open drains, which substantially lower the water table and disrupt the peatland hydrological function [62,69]. In this situation, relatively modest rewetting interventions, such as drain blocking, can be effective in restoring hydrological regimes [13,17]. The presence of the typical peat vegetation in the less disturbed areas of a peatland site [60], in combination with recovered hydrological conditions, can have a profound effect on re-establishing typical peat plant communities in the restored areas [17,60].
By contrast, cutover bogs undergo more intensive impact, involving substantial peat removal and loss of both peat depth and critical vegetation structures required for ecosystem resilience [6,19,48]. These disturbances result in significant hydrological degradation and biodiversity loss, with more active restoration interventions necessary to set peatlands on the recovery trajectories [16]. Evidence from our study suggests that effective, site-specific restoration measures can lead to greater reductions in C emissions, offering strong climate mitigation potential (Table 4). Moreover, the restoration of cutover areas, which are typically situated along the margins of raised bogs, may provide additional ecosystem benefits by acting as hydrological buffers that support the water balance of adjacent high bog remnants. Following the successful bunding on the cutover at Cloncrow Bog, similar restoration works have been implemented, and more are planned at other peatland sites (W. Crowley, pers. comm.).
The cost-efficiency of peatland restoration is widely recognised, particularly through the avoidance of large-scale greenhouse gas (GHG) emissions [15,16,84,85]. However, effective rewetting depends on robust and coherent policy and governance frameworks across multiple levels. At the EU level, instruments such as the Habitats Directive, the Water Framework Directive, the Biodiversity Strategy for 2030, and the Nature Restoration Law all mandate or support peatland restoration [3]. Recent analyses emphasise the need for long-term monitoring, inclusive governance, and transdisciplinary research to ensure ecologically effective and socially legitimate outcomes [33,84]. However, implementation at the national level remains inconsistent.
Restoration efforts in Ireland are currently focused on designated sites, such as Special Areas of Conservation (SACs), while rehabilitation primarily targets the industrial cutaway bogs managed by Bord na Móna. However, most domestic peat extraction sites (both active and abandoned) are outside of these networks, and, as a result, lack legal protection and are excluded from national restoration programmes. Strengthening the legal status of peatlands is therefore essential to ensure their protection and to scale up rewetting initiatives [7,86].
Expanding rewetting interventions to include currently unprotected or undesignated domestic extraction bogs could deliver immediate and significant climate benefits [36,87]. Doing so not only aligns with EU legal obligations but also represents a cost-effective and scientifically sound strategy for national emissions reduction.
5. Conclusions
This study demonstrates that peatland rewetting does not require decades to achieve measurable outcomes and could deliver immediate climate mitigation benefits, with net carbon emission reductions ranging from 0.59 to 2.17 t C ha−1 year−1 across ecotopes. Our results confirm that the immediate and substantial benefit of rewetting peatlands lies primarily in the reduction in emissions rather than in transforming them into C sinks [21,22,24].
Effectiveness of restoration techniques varies across ecotopes; when less degraded Sub-marginal and Eriophorum ecotopes turn them into C sinks, while more degraded ecotopes such as Facebank and Molinia remain C sources. Despite this, consistent reductions were observed across ecotopes. The results of this work have wider relevance for informing peatland restoration practices and contributing to improvements in the derivation of Ireland’s country-specific emission factors, thereby leading to more accurate national GHG accounting for peatlands.
Author Contributions
Conceptualization, T.R.M., F.R.-W. and E.A.; methodology, T.R.M., F.R.-W., D.W. and E.A.; software, E.A.; formal analysis, E.A., F.R.-W. and D.W.; investigation, T.R.M., F.R.-W. and E.A.; resources, T.R.M. and F.R.-W.; data curation, E.A. and W.C.; writing—original draft preparation, E.A.; writing—review and editing, T.R.M., F.R.-W., D.W., E.A. and W.C.; visualisation, E.A.; supervision, T.R.M. and F.R.-W.; project administration, T.R.M.; funding acquisition, T.R.M. All authors have read and agreed to the published version of the manuscript.
Funding
This research was funded by the Care-Peat project 2019–2023 (INTERREG VB NWE 808).
Data Availability Statement
The original data presented and analysed in this study is openly available in Zenodo: https://doi.org/10.5281/zenodo.17449067.
Acknowledgments
We would like to acknowledge the National Parks and Wildlife Service (NPWS) for their cooperation, planning, and involvement in the restoration works. Of particular note, Fernado Fernandez, Shane Regan and Maurice Eakin provided substantial support and advice throughout the project. The authors also wish to thank the anonymous reviewers for their constructive feedback and valuable input during the review process.
Conflicts of Interest
David Wilson was employed by Earthy Matters Environmental Consultants, and Willie Crowley was employed by Wetland Surveys Ireland during this research. The other authors declare that they have no commercial or financial ties that could be viewed as a potential conflict of interest.
Appendix A
- (a)
- Gross Primary Production (GPP)
- (b)
- Ecosystem respiration (Reco)
Appendix B
Model Parameters
Table A1.
Carbon model parameters. Standard error of the estimate shown in parentheses. SBM = Sub-marginal ecotope, FB = Facebank ecotope, MC = Molinia ecotope, EC = Eriophorum ecotope.
Appendix C
Statistical Results
Table A2.
(a) Statistical results of Wilcoxon signed-rank tests comparing unrestored and rewetted treatments for water table level (WTL, cm) and peat temperature (PT, C°) at 5 cm depth across ecotopes. (b) Statistical results of the Wilcoxon signed-rank test of CO2 and CH4 fluxes between unrestored and rewetted ecotopes. NEE = net ecosystem exchange, Reco = ecosystem respiration, GPP = gross primary production. S = Sub-marginal ecotope, F = Facebank ecotope, M = Molinia ecotope, E = Eriophorum ecotope, R = rewetted, UR = unrestored.
Appendix D
Vegetation Cover
Table A3.
(a) Mean vegetation cover change (%) within the collars before (2020) and after the rewetting (2023) for the high bog for unrestored (UR) and rewetted (R) areas. Data is presented as the mean of three collars within each ecotope. Orange cells represent reduced cover, and green cells represent increased cover. (b) Mean vegetation cover change (%) within the collars before (2020) and after the rewetting (2023) for the cutover bog for unrestored (UR) and rewetted (R) areas. Data is presented as the mean of three collars within each ecotope. Orange cells represent reduced cover, and green cells represent increased cover.
Table A4.
Characteristics of ecotopes ranging from more degraded to more natural, taken from Table 2.2 [35]. Facebank, Marginal and Sub-marginal ecotopes are classified as degraded raised bog (DRB), while Central and Sub-central ecotopes are classified as active raised bog (ARB).
Appendix E

Figure A1.
Relationship between mean annual Net Ecosystem Exchange (NEE) in g C m−2 year−1 and mean annual water table level (WTL, cm) for each ecotope.

References
- Helfter, C.; Campbell, C.; Dinsmore, K.J.; Drewer, J.; Coyle, M.; Anderson, M.; Skiba, U.; Nemitz, E.; Billett, M.F.; Sutton, M.A. Drivers of Long-Term Variability in CO2 Net Ecosystem Exchange in a Temperate Peatland. Biogeosciences 2015, 12, 1799–1811. [Google Scholar] [CrossRef]
- McVeigh, P.; Sottocornola, M.; Foley, N.; Leahy, P.; Kiely, G. Meteorological and Functional Response Partitioning to Explain Interannual Variability of CO2 Exchange at an Irish Atlantic Blanket Bog. Agric. For. Meteorol. 2014, 194, 8–19. [Google Scholar] [CrossRef]
- Renou-Wilson, F.; Byrne, K.A.; Flynn, R.; Premrov, A.; Riondato, E.; Saunders, M.; Walz, K.; Wilson, D. Peatland Properties Influencing Greenhouse Gas Emissions and Removal (AUGER Project); Johnstown Castle, Co.: Wexford, Ireland, 2022. [Google Scholar]
- Yu, Z.; Loisel, J.; Brosseau, D.P.; Beilman, D.W.; Hunt, S.J. Global Peatland Dynamics since the Last Glacial Maximum. Geophys. Res. Lett. 2010, 37. [Google Scholar] [CrossRef]
- Leifeld, J.; Menichetti, L. The Underappreciated Potential of Peatlands in Global Climate Change Mitigation Strategies. Nat. Commun. 2018, 9, 1071. [Google Scholar] [CrossRef] [PubMed]
- Loisel, J.; Gallego-Sala, A. Ecological Resilience of Restored Peatlands to Climate Change. Commun. Earth Environ. 2022, 3, 208. [Google Scholar] [CrossRef]
- Minasny, B.; Adetsu, D.V.; Aitkenhead, M.; Artz, R.R.E.; Baggaley, N.; Barthelmes, A.; Beucher, A.; Caron, J.; Conchedda, G.; Connolly, J.; et al. Mapping and Monitoring Peatland Conditions from Global to Field Scale. Biogeochemistry 2024, 167, 383–425. [Google Scholar] [CrossRef]
- Stachowicz, M.; Lyngstad, A.; Osuch, P.; Grygoruk, M. Hydrological Response to Rewetting of Drained Peatlands—A Case Study of Three Raised Bogs in Norway. Land 2025, 14, 142. [Google Scholar] [CrossRef]
- Rankin, T.; Strachan, I.B.; Strack, M. Carbon Dioxide and Methane Exchange at a Post-Extraction, Unrestored Peatland. Ecol. Eng. 2018, 122, 241–251. [Google Scholar] [CrossRef]
- Renou-Wilson, F.; Moser, G.; Fallon, D.; Farrell, C.A.; Müller, C.; Wilson, D. Rewetting Degraded Peatlands for Climate and Biodiversity Benefits: Results from Two Raised Bogs. Ecol. Eng. 2019, 127, 547–560. [Google Scholar] [CrossRef]
- Drösler, M.; Verchot, L.; Freibauer, A.; Pan, G.; Evans, C.D.; Bourbonniere, R.A.; Alm, J.P.; Page, S.; Agus, F.; Hergoualc’h, K.; et al. Chapter 2: Drained Inland Organic Soils. In 2013 Supplement to the 2006 IPCC Guidelines for National Greenhouse Gas Inventories: Wetlands; Hiraishi, T., Krug, T., Tanabe, K., Srivastava, N., Baasansuren, J., Fukuda, M., Troxler, T.G., Eds.; Intergovernmental Panel on Climate Change: Geneva, Switzerland, 2014. [Google Scholar]
- Evans, C.D.; Renou-Wilson, F.; Strack, M. The Role of Waterborne Carbon in the Greenhouse Gas Balance of Drained and Re-Wetted Peatlands. Aquat. Sci. 2016, 78, 573–590. [Google Scholar] [CrossRef]
- Peacock, M.; Audet, J.; Bastviken, D.; Cook, S.; Evans, C.D.; Grinham, A.; Holgerson, M.A.; Högbom, L.; Pickard, A.E.; Zieliński, P.; et al. Small Artificial Waterbodies Are Widespread and Persistent Emitters of Methane and Carbon Dioxide. Glob. Change Biol. 2021, 27, 5109–5123. [Google Scholar] [CrossRef]
- Barry, C.D.; Renou-Wilson, F.; Wilson, D.; Müller, C.; Foy, R.H. Magnitude, Form and Bioavailability of Fluvial Carbon Exports from Irish Organic Soils under Pasture. Aquat. Sci. 2016, 78, 541–560. [Google Scholar] [CrossRef][Green Version]
- Günther, A.; Barthelmes, A.; Huth, V.; Joosten, H.; Jurasinski, G.; Koebsch, F.; Couwenberg, J. Prompt Rewetting of Drained Peatlands Reduces Climate Warming despite Methane Emissions. Nat. Commun. 2020, 11, 1644. [Google Scholar] [CrossRef] [PubMed]
- Strack, M.; Davidson, S.J.; Hirano, T.; Dunn, C. The Potential of Peatlands as Nature-Based Climate Solutions. Curr. Clim. Change Rep. 2022, 8, 71–82. [Google Scholar] [CrossRef]
- Wilson, D.; Mackin, F.; Tuovinen, J.-P.; Moser, G.; Farrell, C.; Renou-Wilson, F. Carbon and Climate Implications of Rewetting a Raised Bog in Ireland. Glob. Change Biol. 2022, 28, 6349–6365. [Google Scholar] [CrossRef]
- Tanneberger, F.; Wichtmann, W. Carbon Credits From Peatland Rewetting–Climate–Biodiversity–Land Use; Schweizerbart Science Publishers: Stuttgart, Germany, 2011. [Google Scholar]
- Mackin, F.; Barr, A.; Rath, P.; Eakin, M.; Ryan, J.; Jeffrey, R.; Fernandez Valverde, F. Best Practice in Raised Bog Restoration in Ireland; Irish Wildlife Manuals, No. 99; National Parks and Wildlife Service, Department of Culture, Heritage and the Gaeltacht: Dublin, Ireland, 2017.
- Wilson, D.; Blain, D.; Couwenberg, J.; Evans, C.D.; Murdiyarso, D.; Page, S.E.; Renou-Wilson, F.; Rieley, J.O.; Sirin, A.; Strack, M.; et al. Greenhouse Gas Emission Factors Associated with Rewetting of Organic Soils. Mires Peat 2016, 17, 04. [Google Scholar] [CrossRef]
- Wilson, D.; Farrell, C.A.; Fallon, D.; Moser, G.; Müller, C.; Renou-Wilson, F. Multiyear Greenhouse Gas Balances at a Rewetted Temperate Peatland. Glob. Change Biol. 2016, 22, 4080–4095. [Google Scholar] [CrossRef]
- Järveoja, J.; Peichl, M.; Maddison, M.; Soosaar, K.; Vellak, K.; Karofeld, E.; Teemusk, A.; Mander, Ü. Impact of Water Table Level on Annual Carbon and Greenhouse Gas Balances of a Restored Peat Extraction Area. Biogeosciences 2016, 13, 2637–2651. [Google Scholar] [CrossRef]
- Regan, S.; Swenson, M.; O’connor, M.; Gill, L. Ecohydrology, Greenhouse Gas Dynamics and Restoration Guidelines for Degraded Raised Bogs; Environmental Protection Agency: Johnstown Castle, Co.: Wexford, Ireland, 2020.
- Strack, M.; Zuback, Y.C.A. Annual Carbon Balance of a Peatland 10 Yr Following Restoration. Biogeosciences 2013, 10, 2885–2896. [Google Scholar] [CrossRef]
- Wilson, D.; Tuittila, E.-S.; Alm, J.; Laine, J.; Farrell, E.P.; Byrne, K.A. Carbon Dioxide Dynamics of a Restored Maritime Peatland. Ecoscience 2007, 14, 71–80. [Google Scholar] [CrossRef]
- Cooper, M.D.A.; Christopher, D.E.; Zielinski, P.; Levy, P.E.; Gray, A.; Peacock, M.; Norris, D.; Fenner, N.; Freeman, C. Infilled Ditches Are Hotspots of Landscape Methane Flux Following Peatland Re-Wetting. Ecosystems 2014, 17, 1227–1241. [Google Scholar] [CrossRef]
- Tanneberger, F.; Abel, S.; Couwenberg, J.; Dahms, T.; Gaudig, G.; Günther, A.; Kreyling, J.; Peters, J.; Pongratz, J.; Joosten, H. Towards Net Zero CO2 in 2050: An Emission Reduction Pathway for Organic Soils in Germany. Mires Peat 2021, 27, 17. [Google Scholar] [CrossRef]
- Cain, M.; Lynch, J.; Allen, M.R.; Fuglestvedt, J.S.; Frame, D.J.; Macey, A.H. Improved Calculation of Warming-Equivalent Emissions for Short-Lived Climate Pollutants. Npj Clim. Atmospheric Sci. 2019, 2, 29. [Google Scholar] [CrossRef] [PubMed]
- EU Regulation-EU-2024/1991-EN-EUR-Lex. Available online: https://eur-lex.europa.eu/eli/reg/2024/1991/oj/eng (accessed on 20 April 2025).
- Government of Ireland Climate Action and Low Carbon Development (Amendment) Bill 2021. Available online: https://gov.ie/en/department-of-climate-energy-and-the-environment/publications/climate-action-and-low-carbon-development-amendment-bill-2021/ (accessed on 20 July 2025).
- National Parks and Wildlife Service, Department of Arts, Heritage and the Gaeltacht. NPWS National Raised Bog SAC Management Plan 2017–2022; National Parks and Wildlife Service, Department of Arts, Heritage and the Gaeltacht: Dublin, Ireland, 2017.
- Gilet, L.; Habib, W.; Aitova, E.; Byrne, K.A.; Farrell, C.A.; Fenton, O.; Flynn, R.; O’Leary, D.; Morley, T.R.; Tuohy, P.; et al. Peatland Use and Peat Soil Land Cover Types in Ireland: Implications for the Calculation of GHG Emissions in the Context of Climate Action. Land Use Policy 2025, 159, 107792. [Google Scholar] [CrossRef]
- Flood, K.; Wilson, D.; Renou-Wilson, F. Evidence Synthesis and Knowledge Integration for Sustainable Peatland Management. Land 2025, 14, 1397. [Google Scholar] [CrossRef]
- Fluet-Chouinard, E.; Stocker, B.D.; Zhang, Z.; Malhotra, A.; Melton, J.R.; Poulter, B.; Kaplan, J.O.; Goldewijk, K.K.; Siebert, S.; Minayeva, T.; et al. Extensive Global Wetland Loss over the Past Three Centuries. Nature 2023, 614, 281–286. [Google Scholar] [CrossRef]
- Fernandez, F.; Connolly, K.; Crowley, W.; Denyer, J.; Duff, K. Smith Raised Bog Monitoring and Assessment Survey 2013. In Irish Wildlife Manuals; National Parks and Wildlife Service, Department of Arts, Heritage and Gaeltacht: Dublin, Ireland, 2014. [Google Scholar]
- Aitova, E.; Morley, T.; Wilson, D.; Renou-Wilson, F. A Review of Greenhouse Gas Emissions and Removals from Irish Peatlands. Mires Peat 2023, 29, 4. [Google Scholar] [CrossRef]
- Habib, W.; Ingle, R.; Saunders, M.; Connolly, J. Quantifying Peatland Land Use and CO2 Emissions in Irish Raised Bogs: Mapping Insights Using Sentinel-2 Data and Google Earth Engine. Sci. Rep. 2024, 14, 1171. [Google Scholar] [CrossRef] [PubMed]
- Care-Peat Care-Peat-Carbon Loss Reduction from Peatlands: An Integrated Approach. Available online: https://vb.nweurope.eu/projects/project-search/care-peat-carbon-loss-reduction-from-peatlands-an-integrated-approach/ (accessed on 3 May 2025).
- Crowley, W.; Crushell, P.; O’Sullivan, J.; Smith, G.F.; Vanmechelen, A. An Assessment of the Impacts of Restoration Works on the Vegetation of the High Bog and Cutover at Cloncrow Bog NHA In County Westmeath: An Internal Technical Report to the National Parks and Wildlife Service; Unpublished Report; Department of Housing, Local Government and Heritage: Dublin, Ireland, 2023.
- Smith, G.F.; Crowley, W. The Habitats of Cutover Raised Bog. In Irish Wildlife Manuals; National Parks and Wildlife Service, Department of Housing, Local Government and Heritage: Dublin, Ireland, 2020. [Google Scholar]
- Schouten, M.G.C. Conservation and Restoration of Raised Bogs: Geological, Hydrological and Ecological Studies; The Government Stationary Office: Dublin, Ireland, 2002; p. 219. ISBN 978-0-7557-1559-6.
- Reis, M.G.D.; Ribeiro, A. Conversion Factors and General Equations Applied in Agricultural and Forest Meteorology. Agrometeoros 2020, 27, 2. [Google Scholar] [CrossRef]
- Karjalainen, S.K.; Anttila, J.; Maanavilja, L.; Hamedianfar, A.; Laine, A.M. Carbon Dioxide and Methane Gas Exchange Following Sphagnum Moss Harvesting in Boreal Peatland. J. Environ. Manag. 2025, 373, 123357. [Google Scholar] [CrossRef]
- Strack, M.; Keith, A.M.; Xu, B. Growing Season Carbon Dioxide and Methane Exchange at a Restored Peatland on the Western Boreal Plain. Ecol. Eng. 2014, 64, 231–239. [Google Scholar] [CrossRef]
- Barry, S.; Byrne, K.A.; Crawford, K.; Clancy, M.A.; O’Doherty, C.; Heagney, G.; Kelly, H.; McCorry, M.; Mealy, H.; Mollahan, B.; et al. Comparing Light and Dark Chamber Measurements of CH4 Fluxes in Drained and Rewetted Raised Bogs of Ireland. Wetl. Ecol. Manag. 2025, 33, 81. [Google Scholar] [CrossRef]
- Alm, J.; Shurpali, N.J.; Tuittila, E.-S.; Laurila, T.; Maljanen, M.; Saarnio, S.; Minkkinen, K. Methods for Determining Emission Factors for the Use of Peat and Peatlands—Flux Measurements and Modelling. Boreal Environ. Res. 2007, 12, 85–100. [Google Scholar]
- Renou-Wilson, F.; Barry, C.; Müller, C.; Wilson, D. The Impacts of Drainage, Nutrient Status and Management Practice on the Full Carbon Balance of Grasslands on Organic Soils in a Maritime Temperate Zone. Biogeosciences 2014, 11, 4361–4379. [Google Scholar] [CrossRef]
- Swenson, M.M.; Regan, S.; Bremmers, D.T.H.; Lawless, J.; Saunders, M.; Gill, L.W. Carbon Balance of a Restored and Cutover Raised Bog: Implications for Restoration and Comparison to Global Trends. Biogeosciences 2019, 16, 713–731. [Google Scholar] [CrossRef]
- Laine, A.; Riutta, T.; Juutinen, S.; Väliranta, M.; Tuittila, E.-S. Acknowledging the Spatial Heterogeneity in Modelling/Reconstructing Carbon Dioxide Exchange in a Northern Aapa Mire. Ecol. Model. 2009, 220, 2646–2655. [Google Scholar] [CrossRef]
- Tuittila, E.-S.; Komulainen, V.-M.; Vasander, H.; Laine, J. Restored Cut-Away Peatland as a Sink for Atmospheric CO2. Oecologia 1999, 120, 563–574. [Google Scholar] [CrossRef]
- Lloyd, J.; Taylor, J.A. On the Temperature Dependence of Soil Respiration. Funct. Ecol. 1994, 8, 315–323. [Google Scholar] [CrossRef]
- IPCC. Climate Change 2021: The Physical Science Basis—Working Group I Contribution to the Sixth Assessment Report of the Intergovernmental Panel on Climate Change; Masson-Delmotte, V., Zhai, P., Pirani, A., Connors, S.L., Péan, C., Berger, S., Caud, N., Chen, Y., Goldfarb, L., Gomis, M.I., et al., Eds.; Cambridge University Press: Cambridge, UK; New York, NY, USA, 2021; p. 2391. [Google Scholar] [CrossRef]
- Koehler, A.K.; Sottocornola, M.; Kiely, G. How Strong Is the Current Carbon Sequestration of an Atlantic Blanket Bog? Glob. Change Biol. 2011, 17, 309–319. [Google Scholar] [CrossRef]
- Nilsson, M.; Sagerfors, J.; Buffam, I.; Laudon, H.; Eriksson, T.; Grelle, A.; Klemedtsson, L.; Weslien, P.; Lindroth, A. Contemporary Carbon Accumulation in a Boreal Oligotrophic Minerogenic Mire–a Significant Sink after Accounting for All C-Fluxes. Glob. Change Biol. 2008, 14, 2317–2332. [Google Scholar] [CrossRef]
- Price, J.S.; Heathwaite, A.L.; Baird, A.J. Hydrological Processes in Abandoned and Restored Peatlands: An Overview of Management Approaches. Wetl. Ecol. Manag. 2003, 11, 65–83. [Google Scholar] [CrossRef]
- Robroek, B.J.M.; Limpens, J.; Breeuwer, A.; Schouten, M.G.C. Effects of Water Level and Temperature on Performance of Four Sphagnum Mosses. Plant Ecol. 2007, 190, 97–107. [Google Scholar] [CrossRef]
- Allan, J.M.; Guêné-Nanchen, M.; Rochefort, L.; Douglas, D.J.T.; Axmacher, J.C. Meta-analysis Reveals That Enhanced Practices Accelerate Vegetation Recovery during Peatland Restoration. Restor. Ecol. 2024, 32, e14015. [Google Scholar] [CrossRef]
- Rowland, J.A.; Bracey, C.; Moore, J.L.; Cook, C.N.; Bragge, P.; Walsh, J.C. Effectiveness of Conservation Interventions Globally for Degraded Peatlands in Cool-Climate Regions. Biol. Conserv. 2021, 263, 109327. [Google Scholar] [CrossRef]
- Artz, R.R.E.; Coyle, M.; Donaldson-Selby, G.; Morrison, R. Net Carbon Dioxide Emissions from an Eroding Atlantic Blanket Bog. Biogeochemistry 2022, 159, 233–250. [Google Scholar] [CrossRef]
- Crowley, W.; Smith, G.F.; Mackin, F.; Regan, S.; Valverde, F.F.; Eakin, M. Recovery of the Vegetation of a Cutover Raised Bog in Ireland Following Rewetting Measures. Biol. Environ. Proc. R. Ir. Acad. 2021, 121B, 95–121. [Google Scholar] [CrossRef]
- Ritson, J.P.; Lees, K.J.; Hill, J.; Gallego-Sala, A.; Bebber, D.P. Climate Change Impacts on Blanket Peatland in Great Britain. J. Appl. Ecol. 2025, 62, 701–714. [Google Scholar] [CrossRef]
- Ahmad, S.; Liu, H.; Günther, A.; Couwenberg, J.; Lennartz, B. Long-Term Rewetting of Degraded Peatlands Restores Hydrological Buffer Function. Sci. Total Environ. 2020, 749, 141571. [Google Scholar] [CrossRef]
- Pierce, H.; Fenton, O.; Daly, E.; Shnel, A.; O’Leary, D.; Healy, M.G.; Tuohy, P. Assessing Localised Rainfall and Water Table Depth Relationships in Agricultural Grassland Peat Soils. Sci. Total Environ. 2025, 994, 180074. [Google Scholar] [CrossRef] [PubMed]
- Wu, J.; Roulet, N.T. Climate Change Reduces the Capacity of Northern Peatlands to Absorb the Atmospheric Carbon Dioxide: The Different Responses of Bogs and Fens. Glob. Biogeochem. Cycles 2014, 28, 1005–1024. [Google Scholar] [CrossRef]
- Wilson, D.; Dixon, S.D.; Artz, R.R.E.; Smith, T.E.L.; Evans, C.D.; Owen, H.J.F.; Archer, E.; Renou-Wilson, F. Derivation of Greenhouse Gas Emission Factors for Peatlands Managed for Extraction in the Republic of Ireland and the United Kingdom. Biogeosciences 2015, 12, 5291–5308. [Google Scholar] [CrossRef]
- Nugent, K.A.; Strachan, I.B.; Strack, M.; Roulet, N.T.; Rochefort, L. Multi-Year Net Ecosystem Carbon Balance of a Restored Peatland Reveals a Return to Carbon Sink. Glob. Change Biol. 2018, 24, 5751–5768. [Google Scholar] [CrossRef] [PubMed]
- Strack, M.; Cagampan, J.; Hassanpour Fard, G. Controls on Plot-Scale Growing Season CO2 and CH4 Fluxes in Restored Peatlands: Do They Differ from Unrestored and Natural Sites? Mires Peat 2016, 17, 1–18. [Google Scholar] [CrossRef]
- IPCC. 2013 Supplement to the 2006 IPCC Guidelines for National Greenhouse Gas Inventories: Wetlands: Methodological Guidance on Lands with Wet and Drained Soils, and Constructed Wetlands for Wastewater Treatment; IPCC, Intergovernmental Panel on Climate Change: Geneva, Switzerland, 2014. [Google Scholar]
- Evans, C.D.; Peacock, M.; Baird, A.J.; Artz, R.R.E.; Burden, A.; Callaghan, N.; Chapman, P.J.; Cooper, H.M.; Coyle, M.; Craig, E.; et al. Overriding Water Table Control on Managed Peatland Greenhouse Gas Emissions. Nature 2021, 593, 548–552. [Google Scholar] [CrossRef]
- Rigney, C.; Wilson, D.; Renou-Wilson, F.; Müller, C.; Moser, G.; Byrne, K.A. Greenhouse Gas Emissions from Two Rewetted Peatlands Previously Managed for Forestry. Mires Peat 2018, 21, 24. [Google Scholar] [CrossRef]
- Anderson, R.; Peace, A. Ten-Year Results of a Comparison of Methods for Restoring Afforested Blanket Bog. Mires Peat 2017, 19, 6. [Google Scholar] [CrossRef]
- Couwenberg, J.; Thiele, A.; Tanneberger, F.; Augustin, J.; Bärisch, S.; Dubovik, D.; Liashchynskaya, N.; Michaelis, D.; Minke, M.; Skuratovich, A.; et al. Assessing Greenhouse Gas Emissions from Peatlands Using Vegetation as a Proxy. Hydrobiologia 2011, 674, 67–89. [Google Scholar] [CrossRef]
- Huth, V.; Günther, A.; Bartel, A.; Hofer, B.; Jacobs, O.; Jantz, N.; Meister, M.; Rosinski, E.; Urich, T.; Weil, M.; et al. Topsoil Removal Reduced In-Situ Methane Emissions in a Temperate Rewetted Bog Grassland by a Hundredfold. Sci. Total Environ. 2020, 721, 137763. [Google Scholar] [CrossRef]
- Tiemeyer, B.; Freibauer, A.; Borraz, E.A.; Augustin, J.; Bechtold, M.; Beetz, S.; Beyer, C.; Ebli, M.; Eickenscheidt, T.; Fiedler, S.; et al. A New Methodology for Organic Soils in National Greenhouse Gas Inventories: Data Synthesis, Derivation and Application. Ecol. Indic. 2020, 109, 105838. [Google Scholar] [CrossRef]
- Rydin, H.; Jeglum, J.K. The Biology of Peatlands. In Biology of Habitats Series, 2nd ed.; Oxford University Press: Oxford, UK, 2013; ISBN 978-0-19-960300-8. [Google Scholar]
- Wilson, D. Death by a Thousand Cuts: Small-Scale Peat Extraction and the Irish Peatland Carbon Store. In Proceedings of the 13th International Peat Congress: After Wise Use—The Future of Peatlands, Tullamore, Ireland, 8–13 June 2008; pp. 700–704. [Google Scholar]
- Renou-Wilson, F.; Bolger, T.; Bullock, C.; Convery, F.; Curry, J.; Ward, S.; Wilson, D.; Müller, C. Bogland: Sustainable Management of Peatlands in Ireland; Environmental Protection Agency: Johnstown Castle, Co.: Wexford, Ireland, 2011.
- Renou-Wilson, F.; Müller, C.; Moser, G.; Wilson, D. To Graze or Not to Graze? Four Years Greenhouse Gas Balances and Vegetation Composition from a Drained and a Rewetted Organic Soil under Grassland. Agric. Ecosyst. Environ. 2016, 222, 156–170. [Google Scholar] [CrossRef]
- Laine, A.; Sottocornola, M.; Kiely, G.; Byrne, K.A.; Wilson, D.; Tuittila, E.S. Estimating Net Ecosystem Exchange in a Patterned Ecosystem: Example from Blanket Bog. Agric. For. Meteorol. 2006, 138, 231–243. [Google Scholar] [CrossRef]
- Laine, A.; Wilson, D.; Kiely, G.; Byrne, K.A. Methane Flux Dynamics in an Irish Lowland Blanket Bog. Plant Soil 2007, 299, 181–193. [Google Scholar] [CrossRef]
- Sottocornola, M.; Kiely, G. Hydro-Meteorological Controls on the CO2 Exchange Variation in an Irish Blanket Bog. Agric. For. Meteorol. 2010, 150, 287–297. [Google Scholar] [CrossRef]
- Evans, C.; Artz, R.; Burden, A.; Clilverd, H.; Freeman, B.; Heinemeyer, A.; Lindsay, R.; Morrison, R.; Potts, J.; Reed, M.; et al. Aligning the Peatland Code with the UK Peatland Inventory; Department for Environment, Food & Rural Affairs: London, UK, 2023.
- Kreyling, J.; Tanneberger, F.; Jansen, F.; van der Linden, S.; Aggenbach, C.; Blüml, V.; Couwenberg, J.; Emsens, W.-J.; Joosten, H.; Klimkowska, A.; et al. Rewetting Does Not Return Drained Fen Peatlands to Their Old Selves. Nat. Commun. 2021, 12, 5693. [Google Scholar] [CrossRef]
- Wichmann, S.; Nordt, A. Unlocking the Potential of Peatlands and Paludiculture to Achieve Germany’s Climate Targets: Obstacles and Major Fields of Action. Front. Clim. 2024, 6, 1380625. [Google Scholar] [CrossRef]
- Horsburgh, N.; Tyler, A.; Mathieson, S.; Wackernagel, M.; Lin, D. Biocapacity and Cost-Effectiveness Benefits of Increased Peatland Restoration in Scotland. J. Environ. Manag. 2022, 306, 114486. [Google Scholar] [CrossRef] [PubMed]
- Renou-Wilson, F.; Wilson, D.; Rigney, C.; Byrne, K.A.; Farrell, C.; Müller, C. Research 236: Network Monitoring Rewetted and Restored Peatlands/Organic Soils for Climate and Biodiversity Benefits (NEROS); Report No. 236; Environmental Protection Agency (EPA): Dublin, Ireland, 2018; p. 55. Available online: https://www.epa.ie/publications/research/biodiversity/Research_Report_236.pdf (accessed on 5 November 2025).
- Habib, W.; Connolly, J. A National-Scale Assessment of Land Use Change in Peatlands between 1989 and 2020 Using Landsat Data and Google Earth Engine—A Case Study of Ireland. Reg. Environ. Change 2023, 23, 124. [Google Scholar] [CrossRef] [PubMed]


Disclaimer/Publisher’s Note: The statements, opinions and data contained in all publications are solely those of the individual author(s) and contributor(s) and not of MDPI and/or the editor(s). MDPI and/or the editor(s) disclaim responsibility for any injury to people or property resulting from any ideas, methods, instructions or products referred to in the content. |
© 2025 by the authors. Licensee MDPI, Basel, Switzerland. This article is an open access article distributed under the terms and conditions of the Creative Commons Attribution (CC BY) license (https://creativecommons.org/licenses/by/4.0/).