Land Cover Influences on LST in Two Proposed Smart Cities of India: Comparative Analysis Using Spectral Indices


Abstract
:1. Introduction
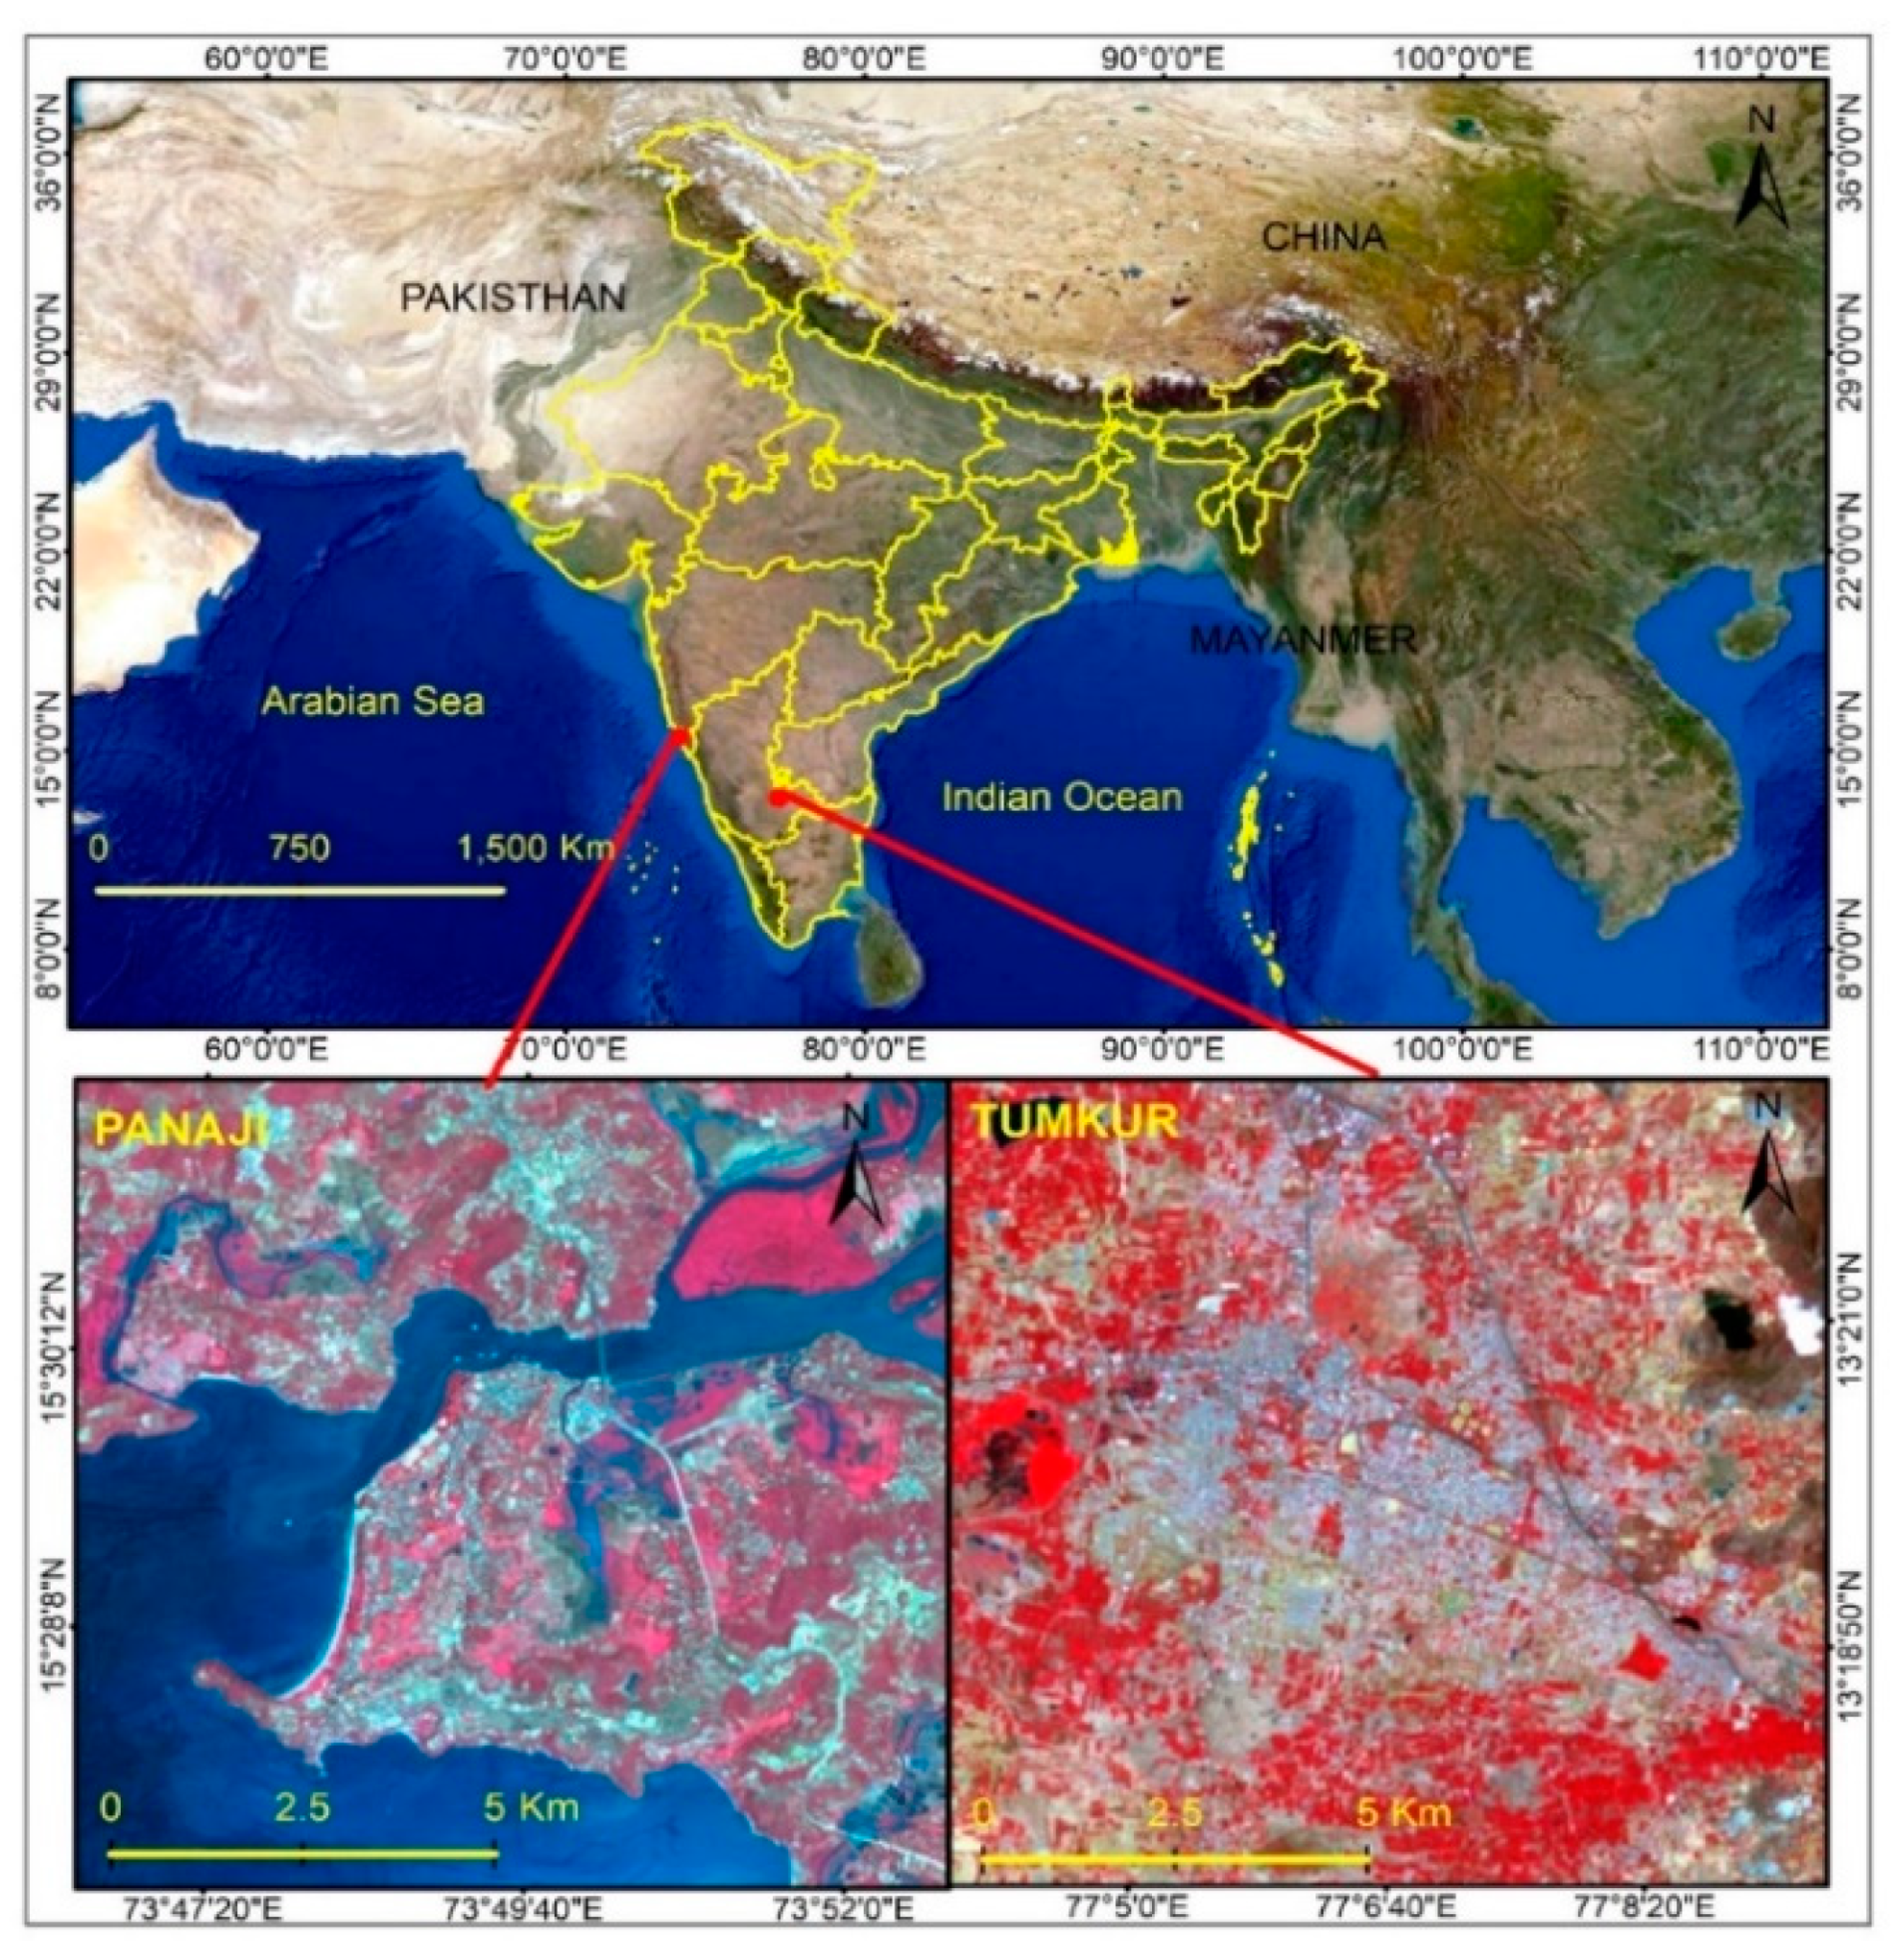
2. Study Area
3. Data and Methods
3.1. Satellite Data
3.2. Field Data
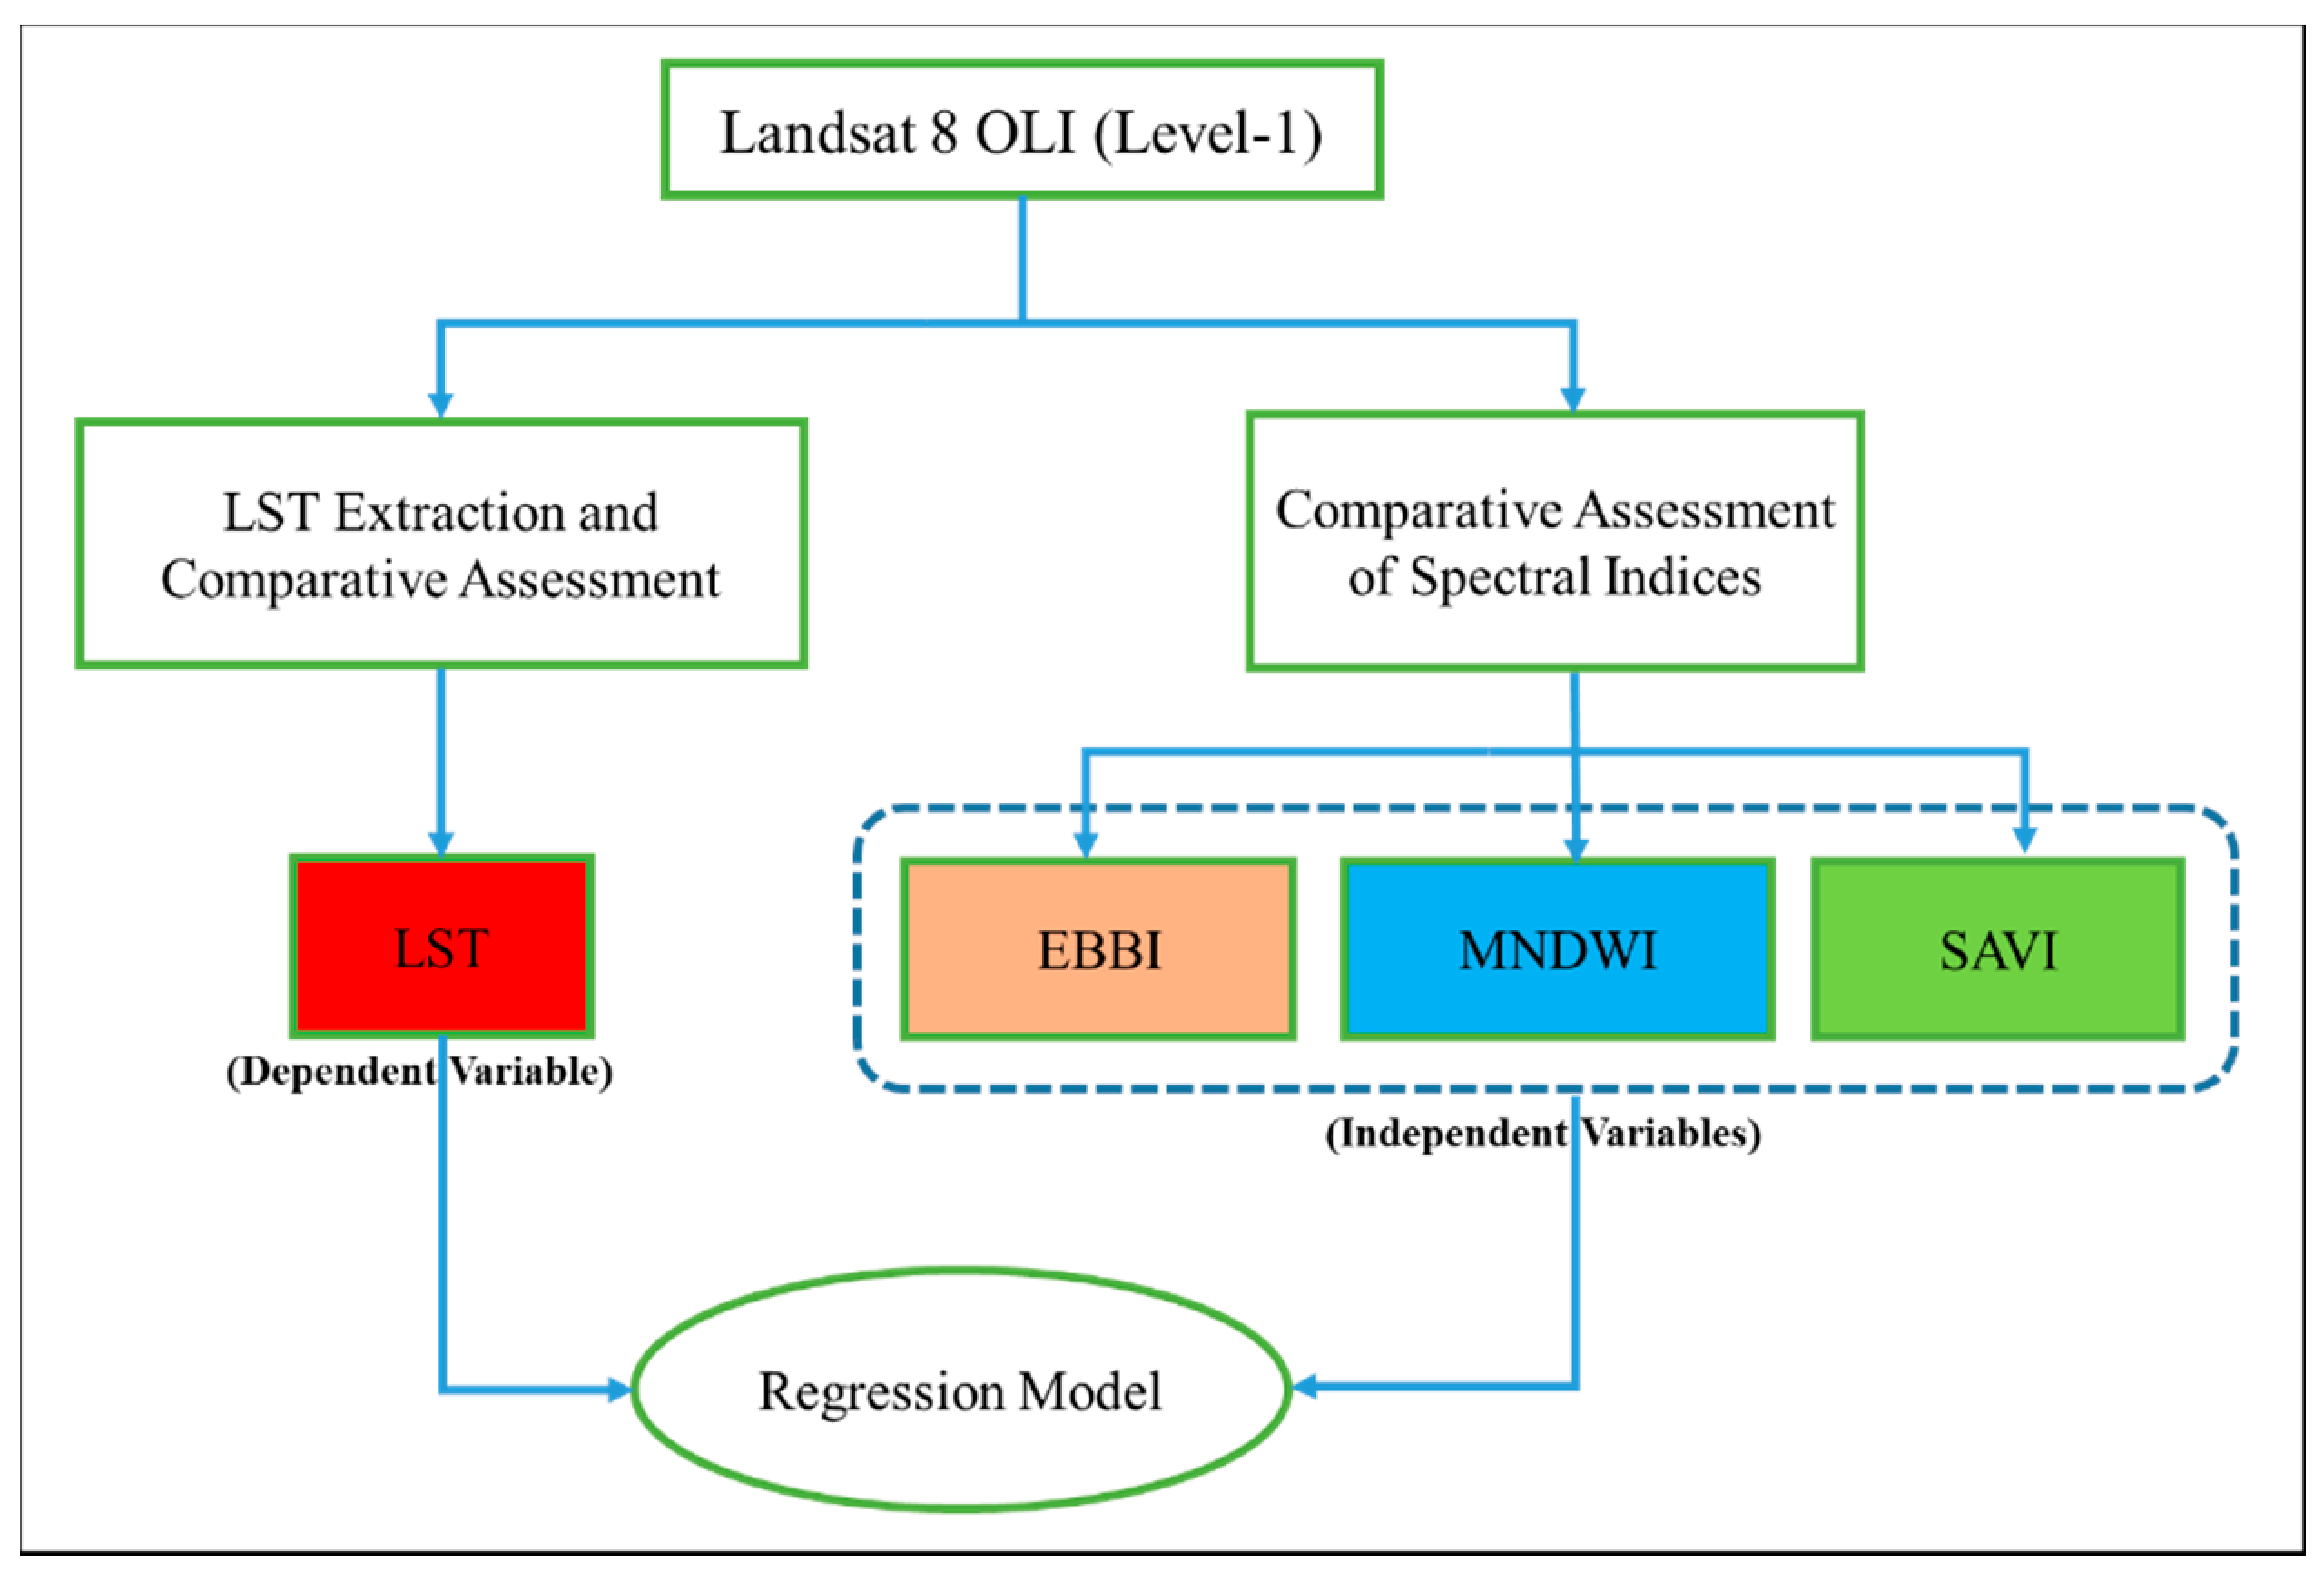
3.3. Methodology
3.3.1. Image Pre-Processing
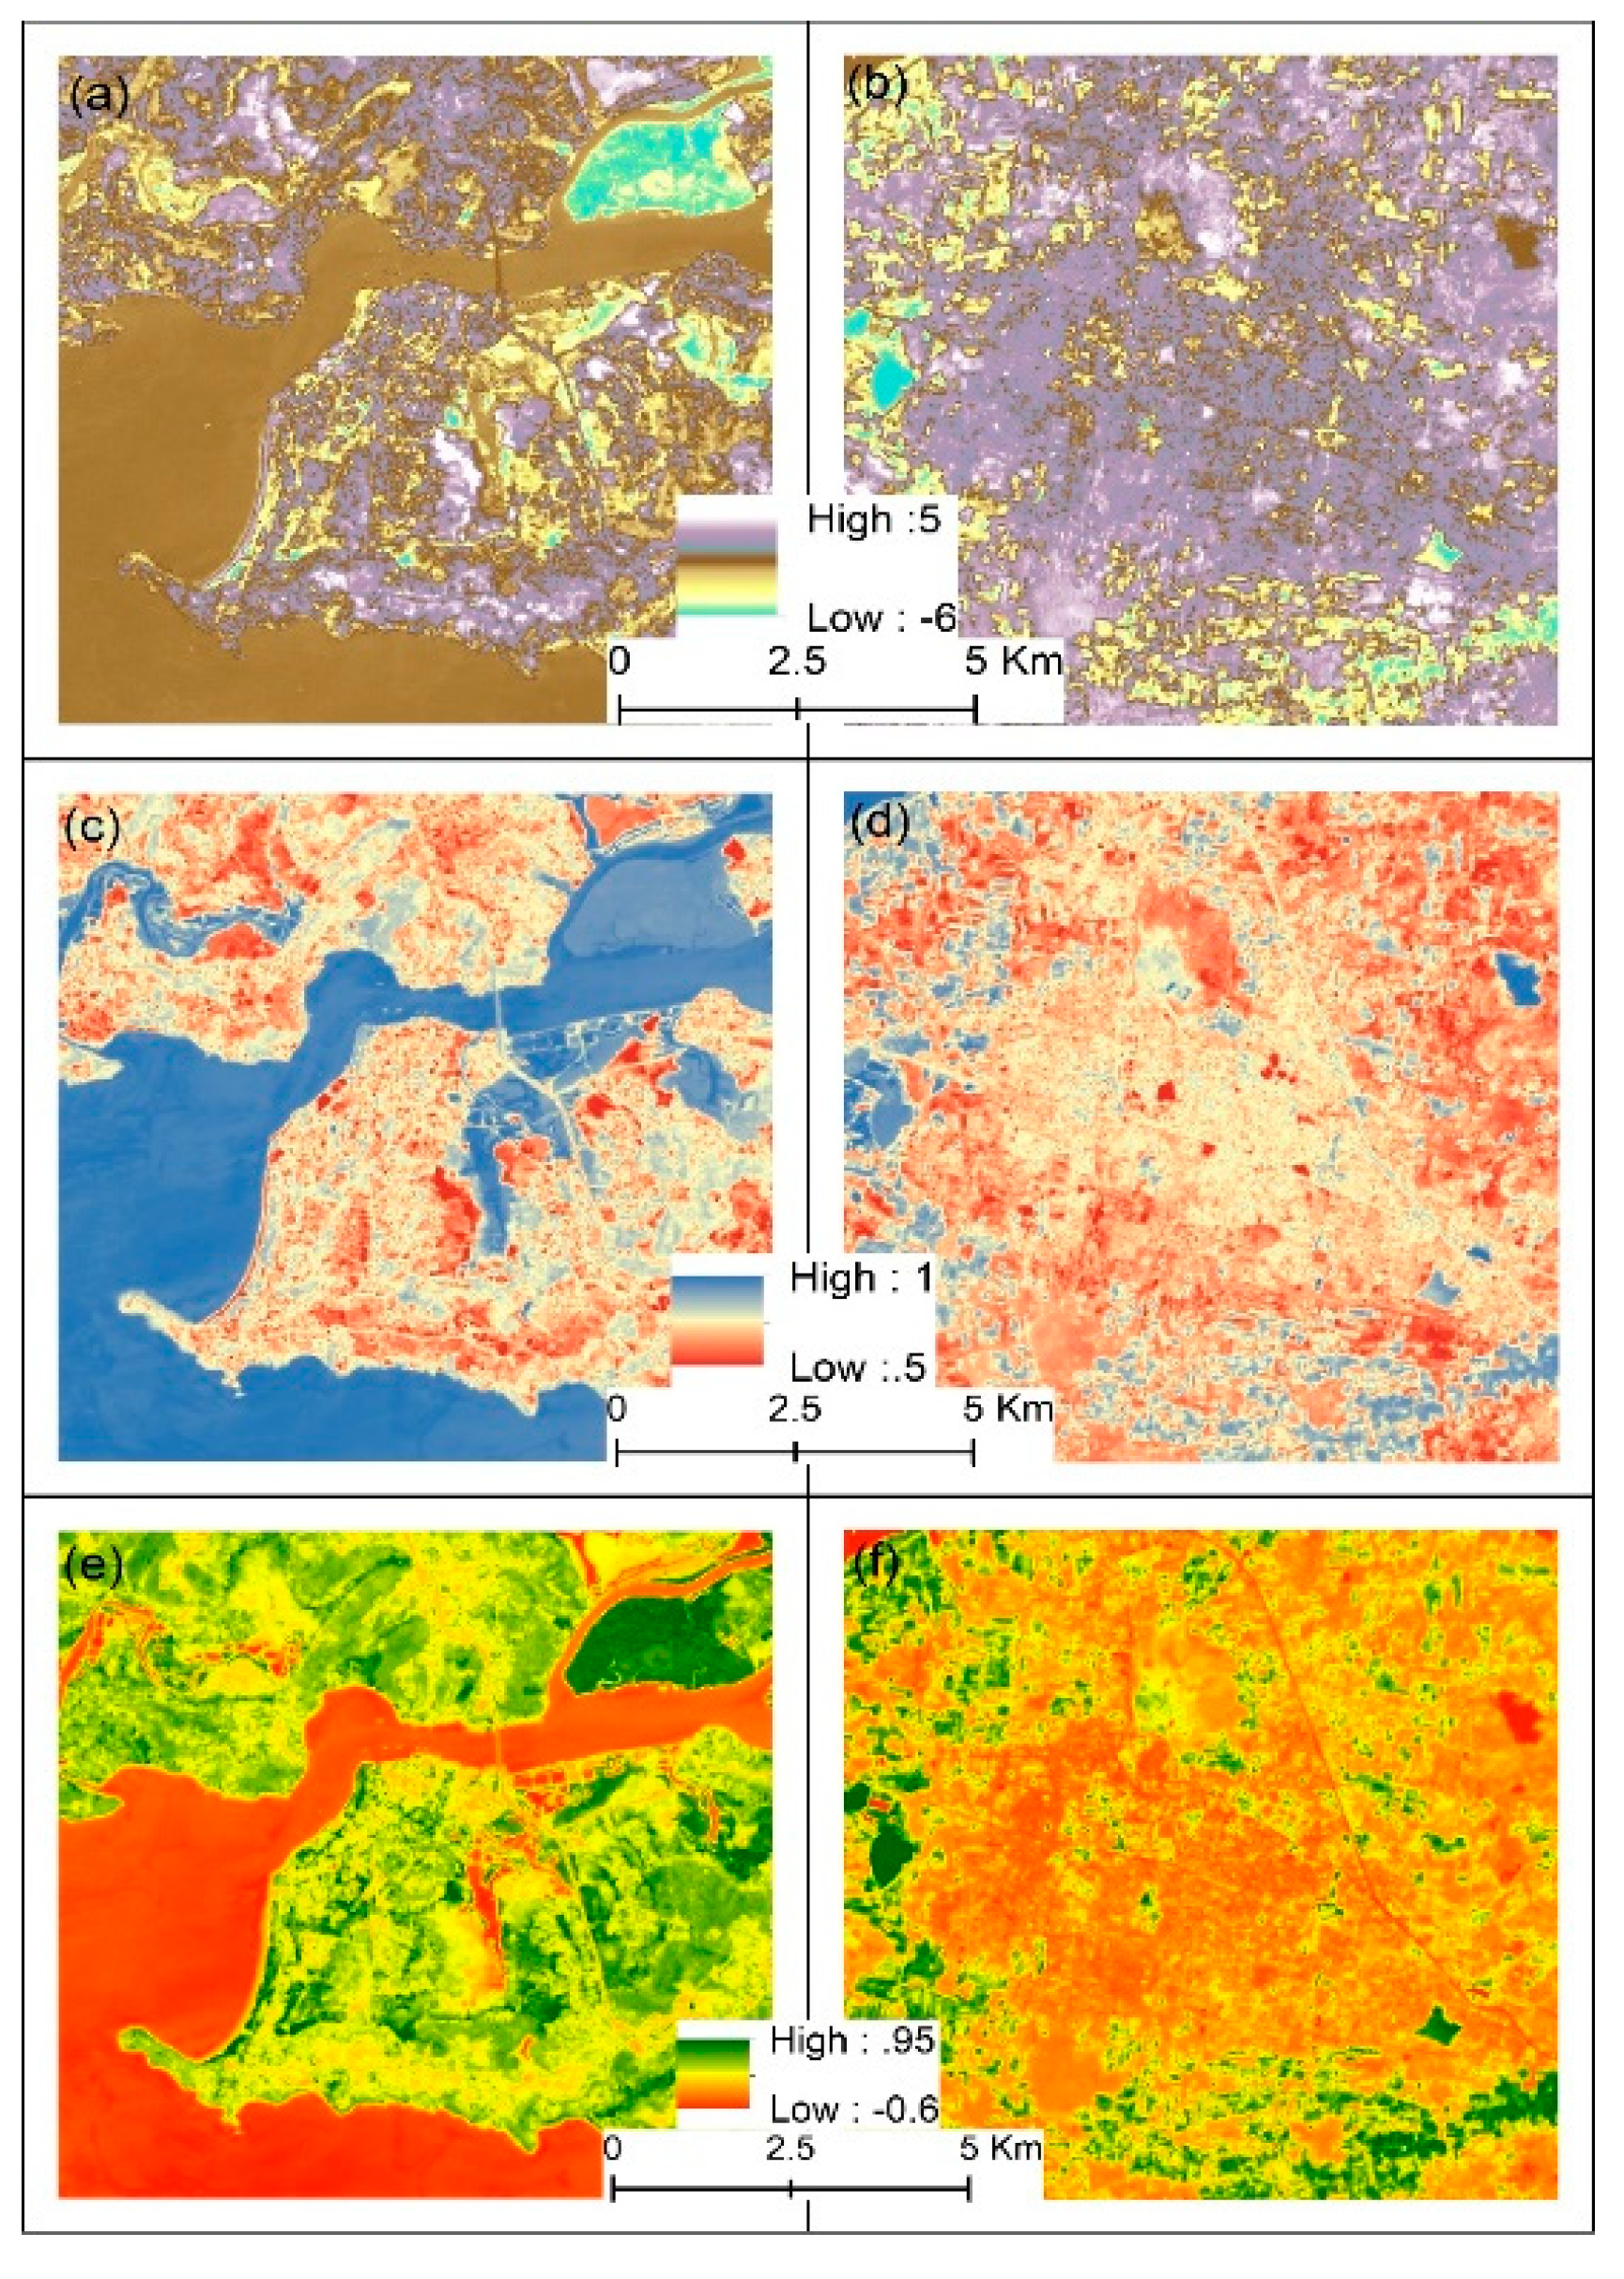
3.3.2. Enhanced Built-Up and Bareness Index (EBBI)
3.3.3. Modified Normalized Difference Water Index (MNDWI)
3.3.4. Soil Adjusted Vegetation Index (SAVI)
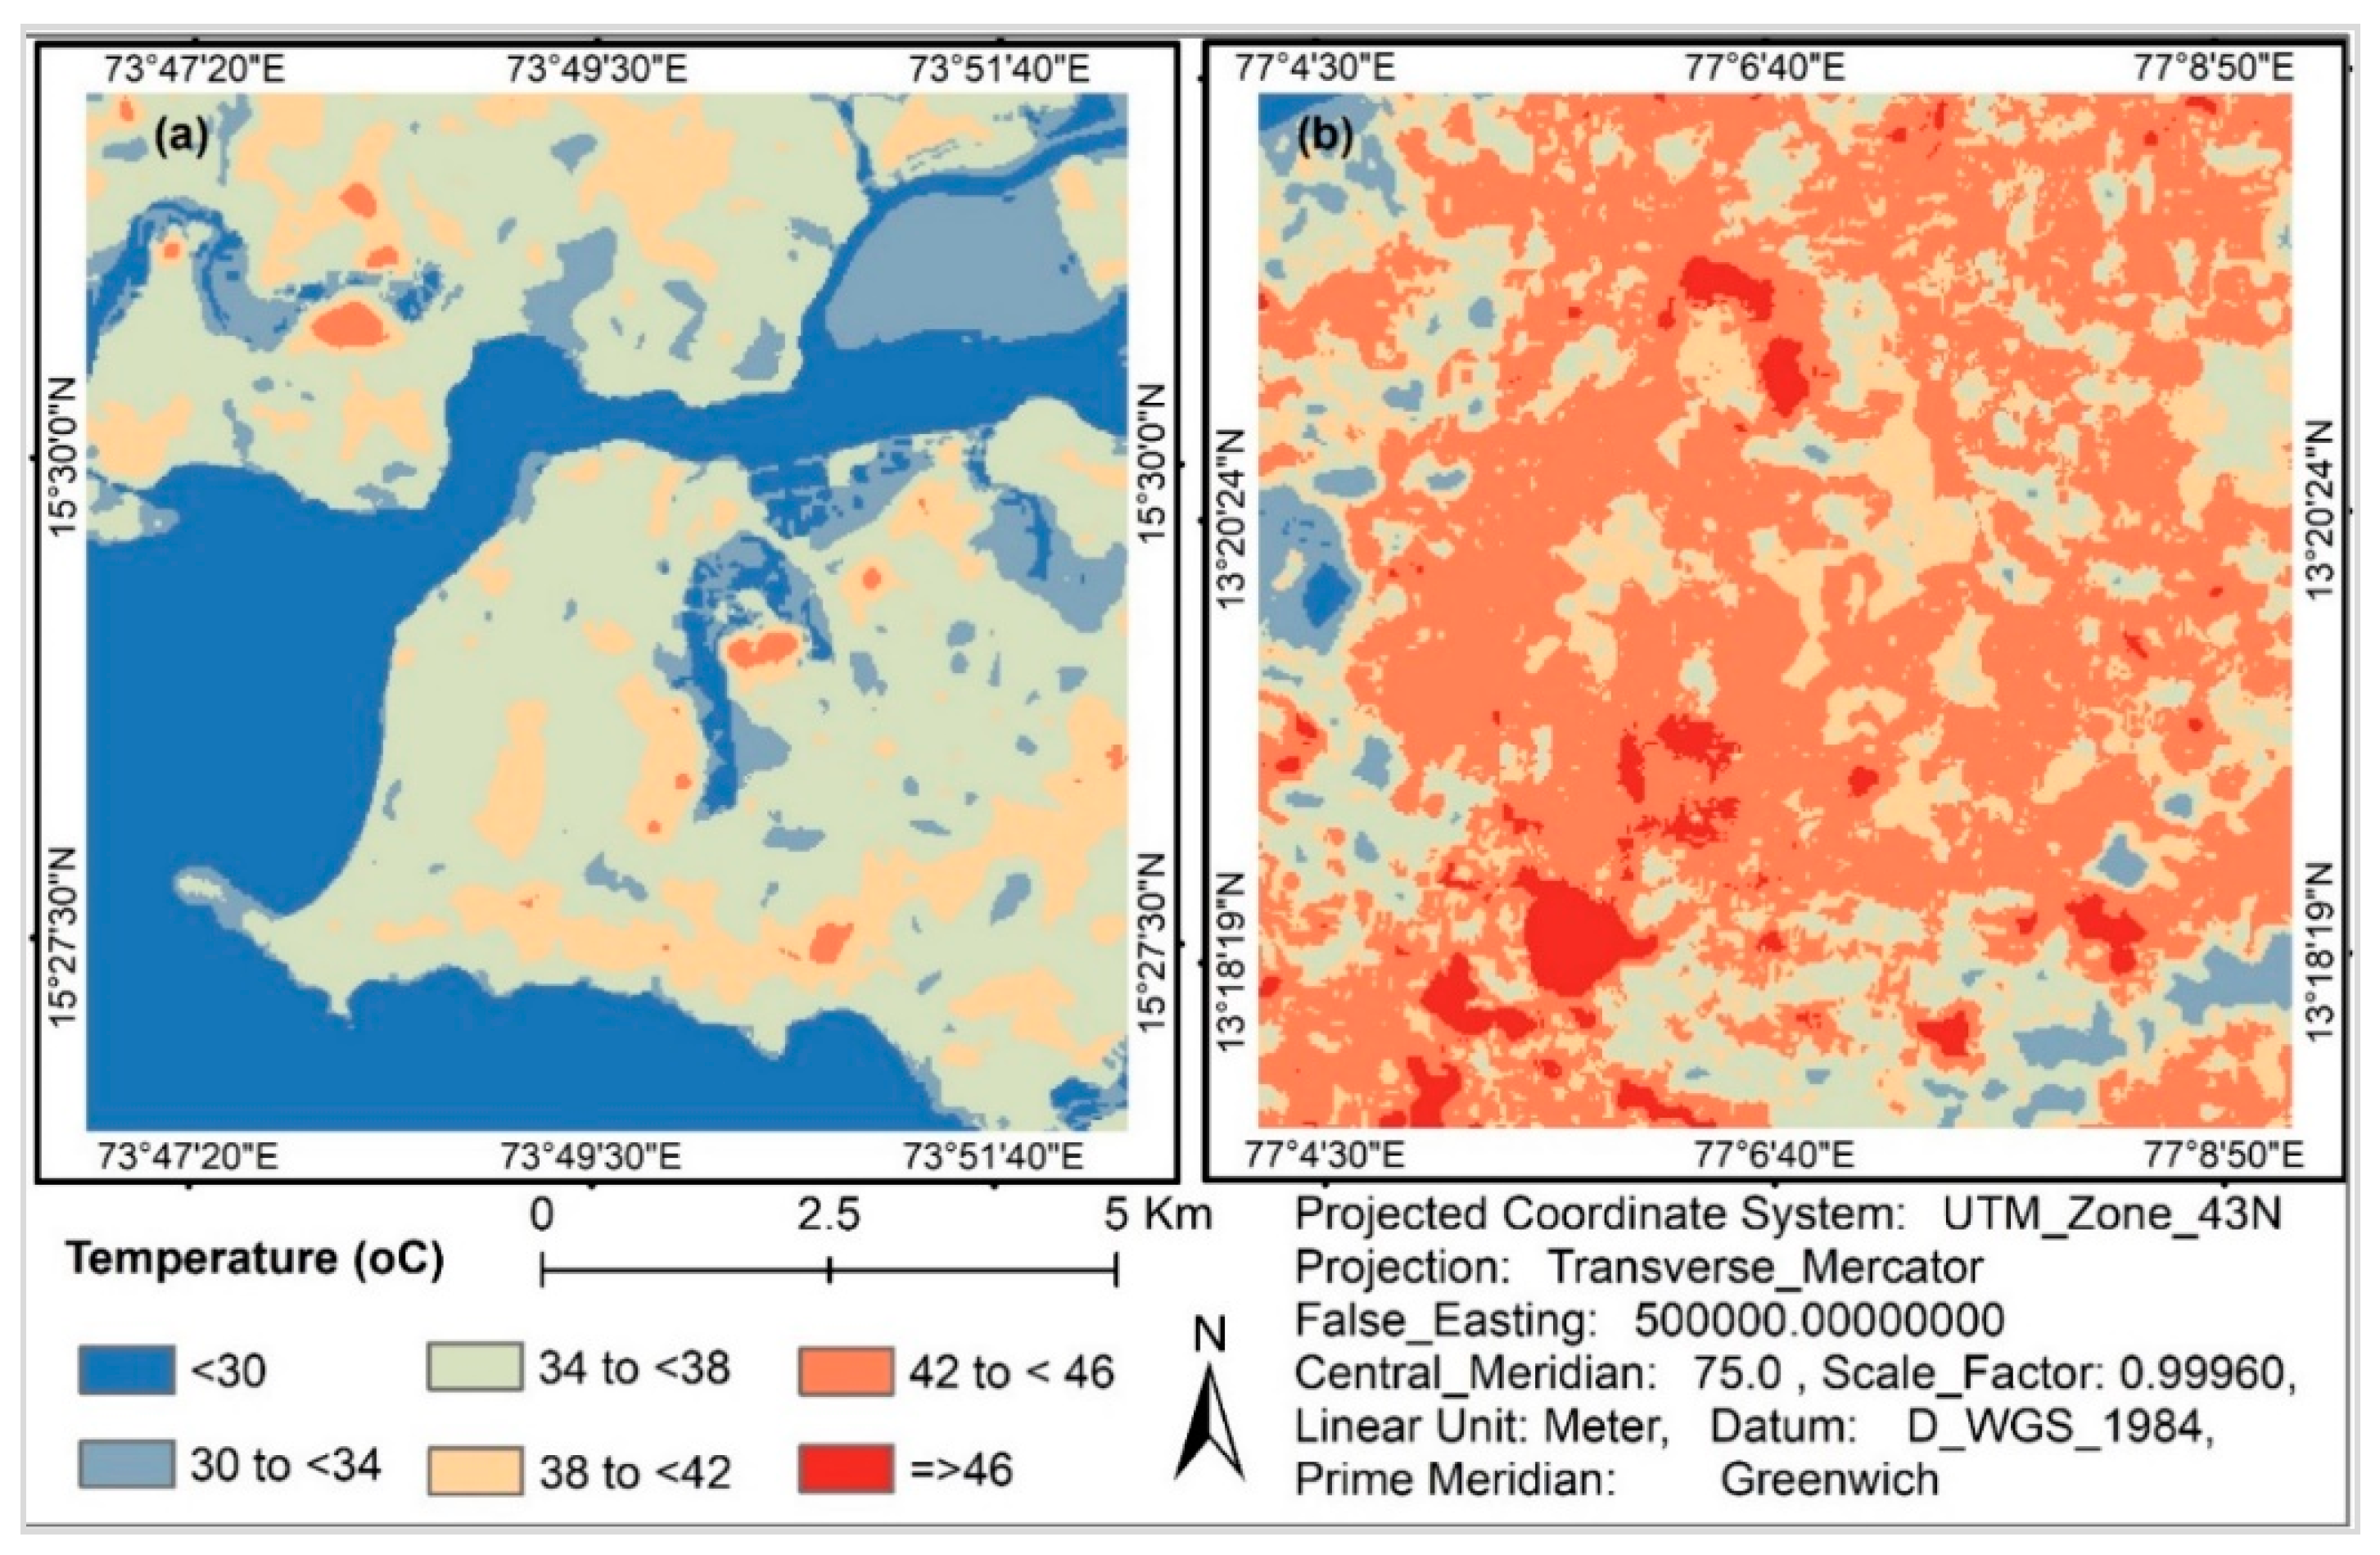
3.3.5. Land Surface Temperature (LST)
3.4. Statistical Analysis
4. Results
4.1. Comparative Analyses of Various Indices
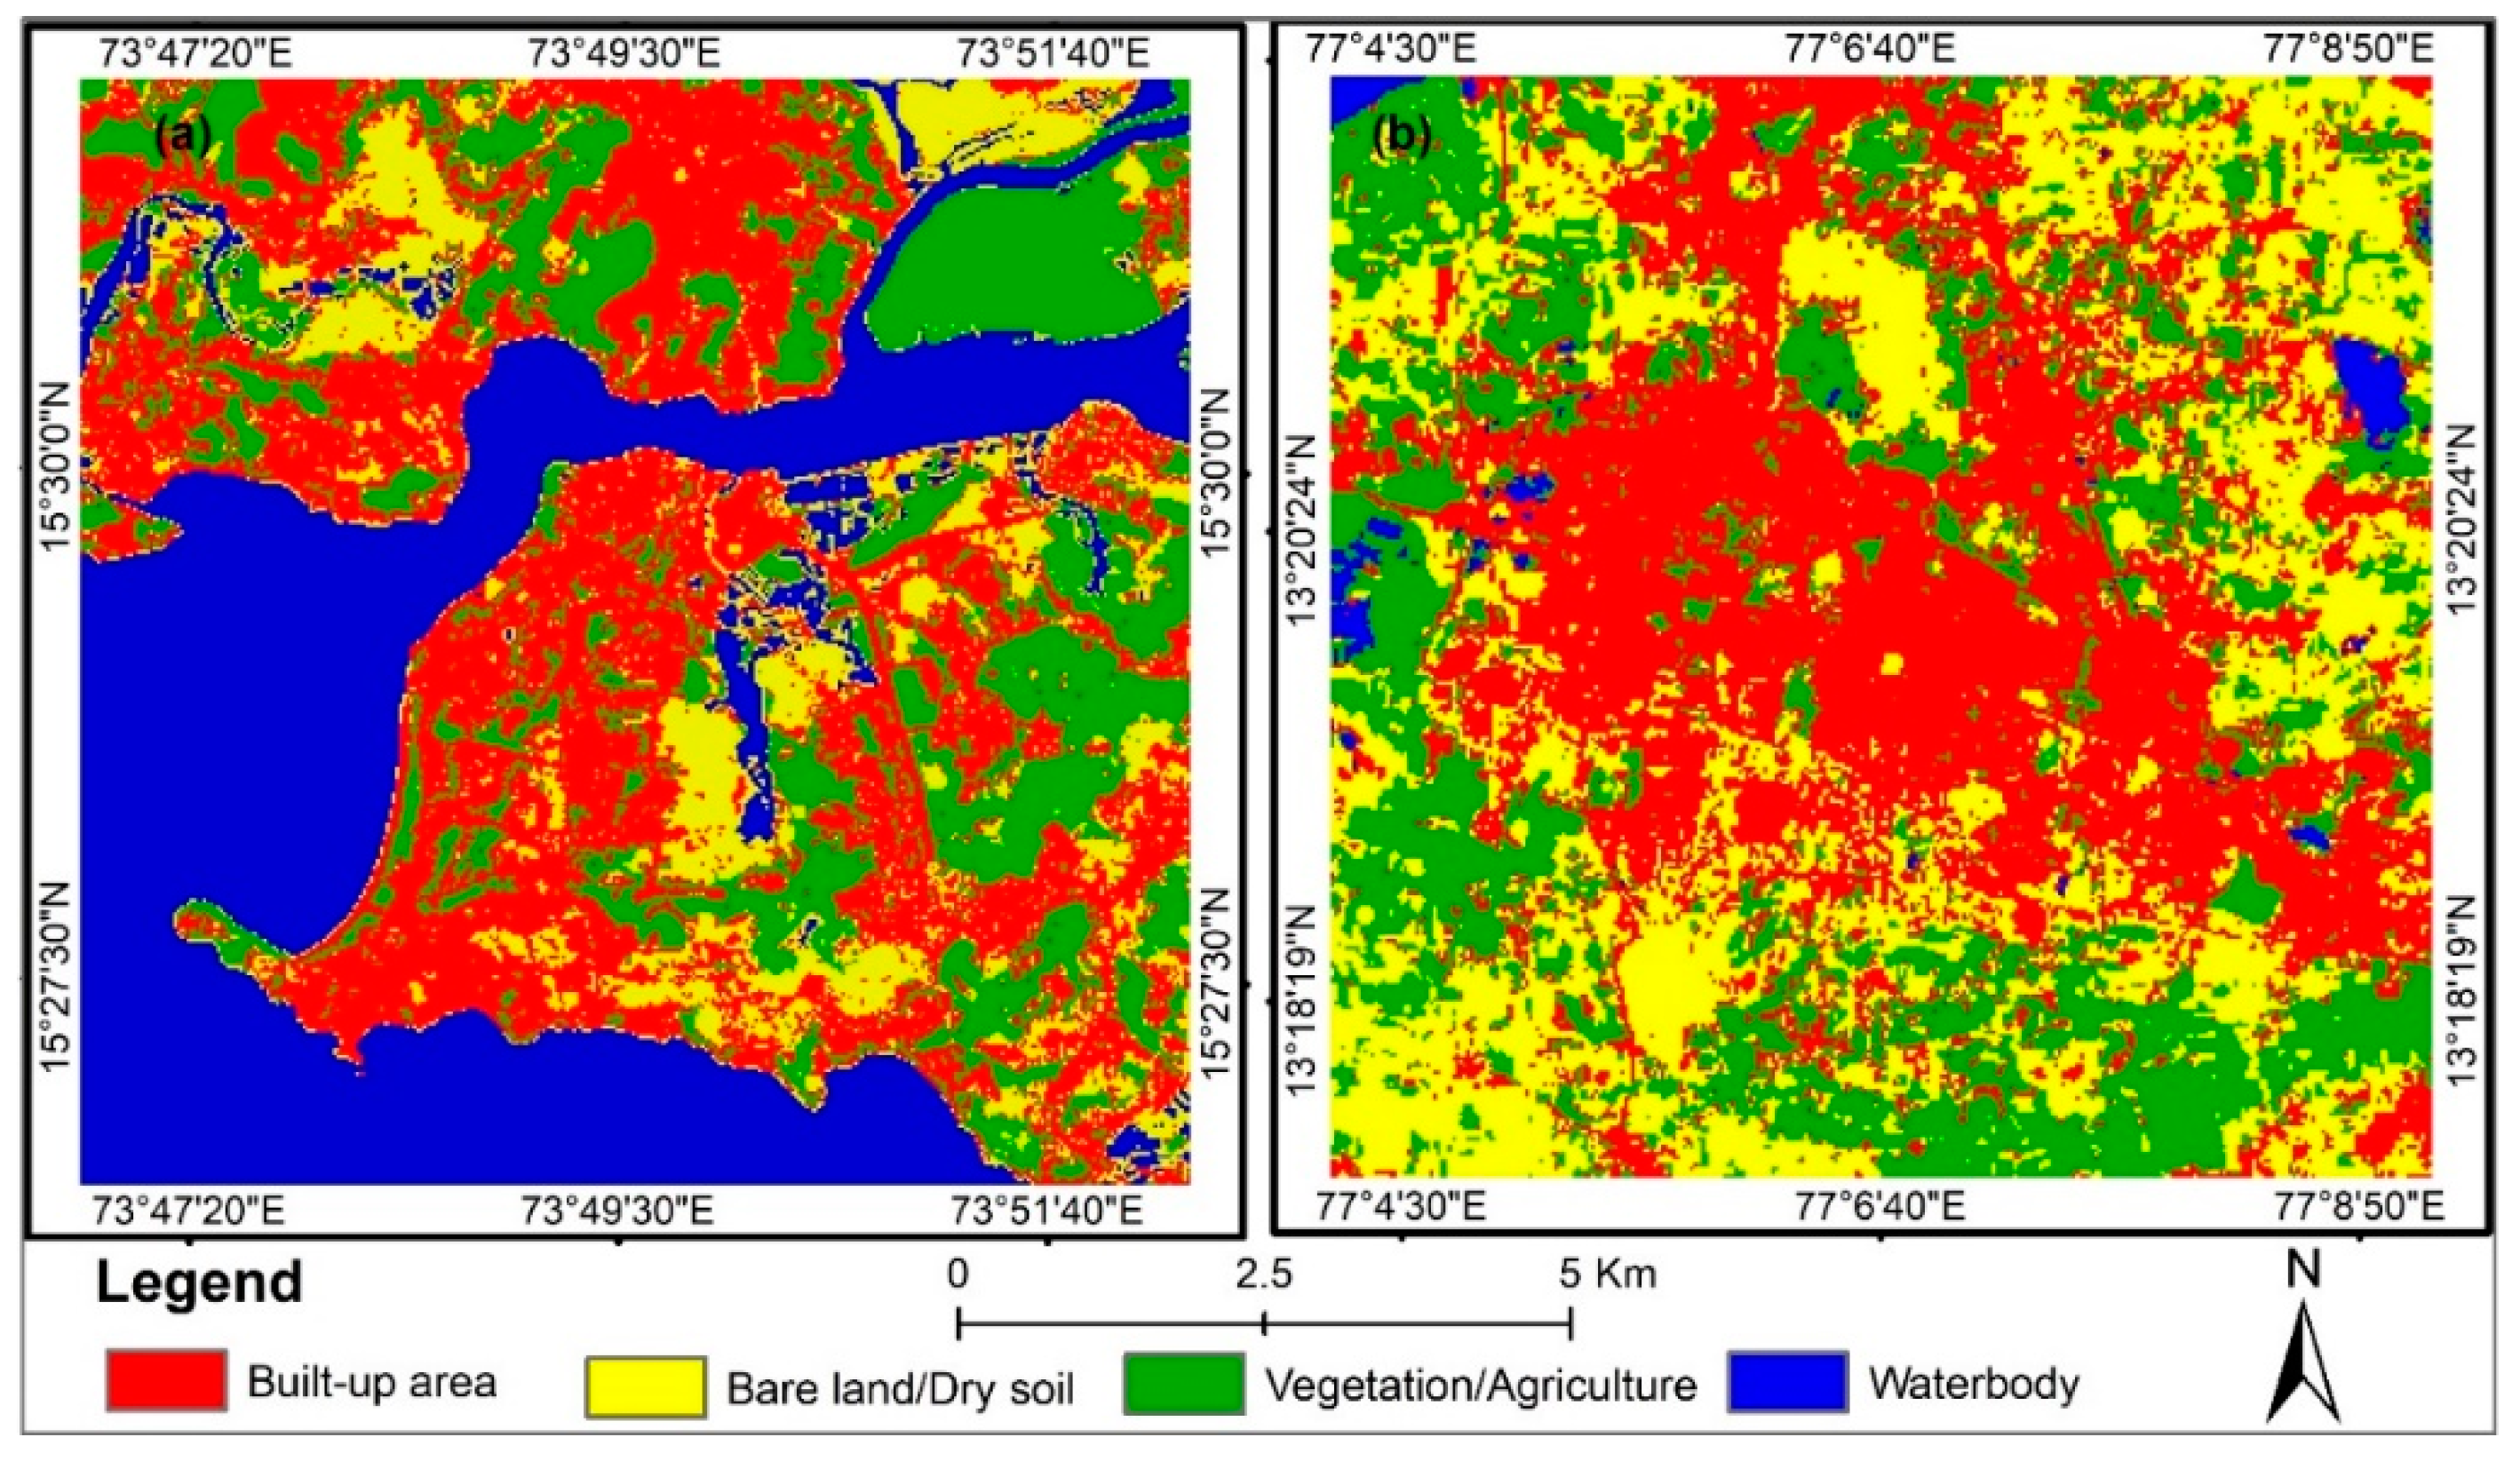
4.2. Land Use Land Cover (LULC)
4.3. Land Surface Temperature (LST)
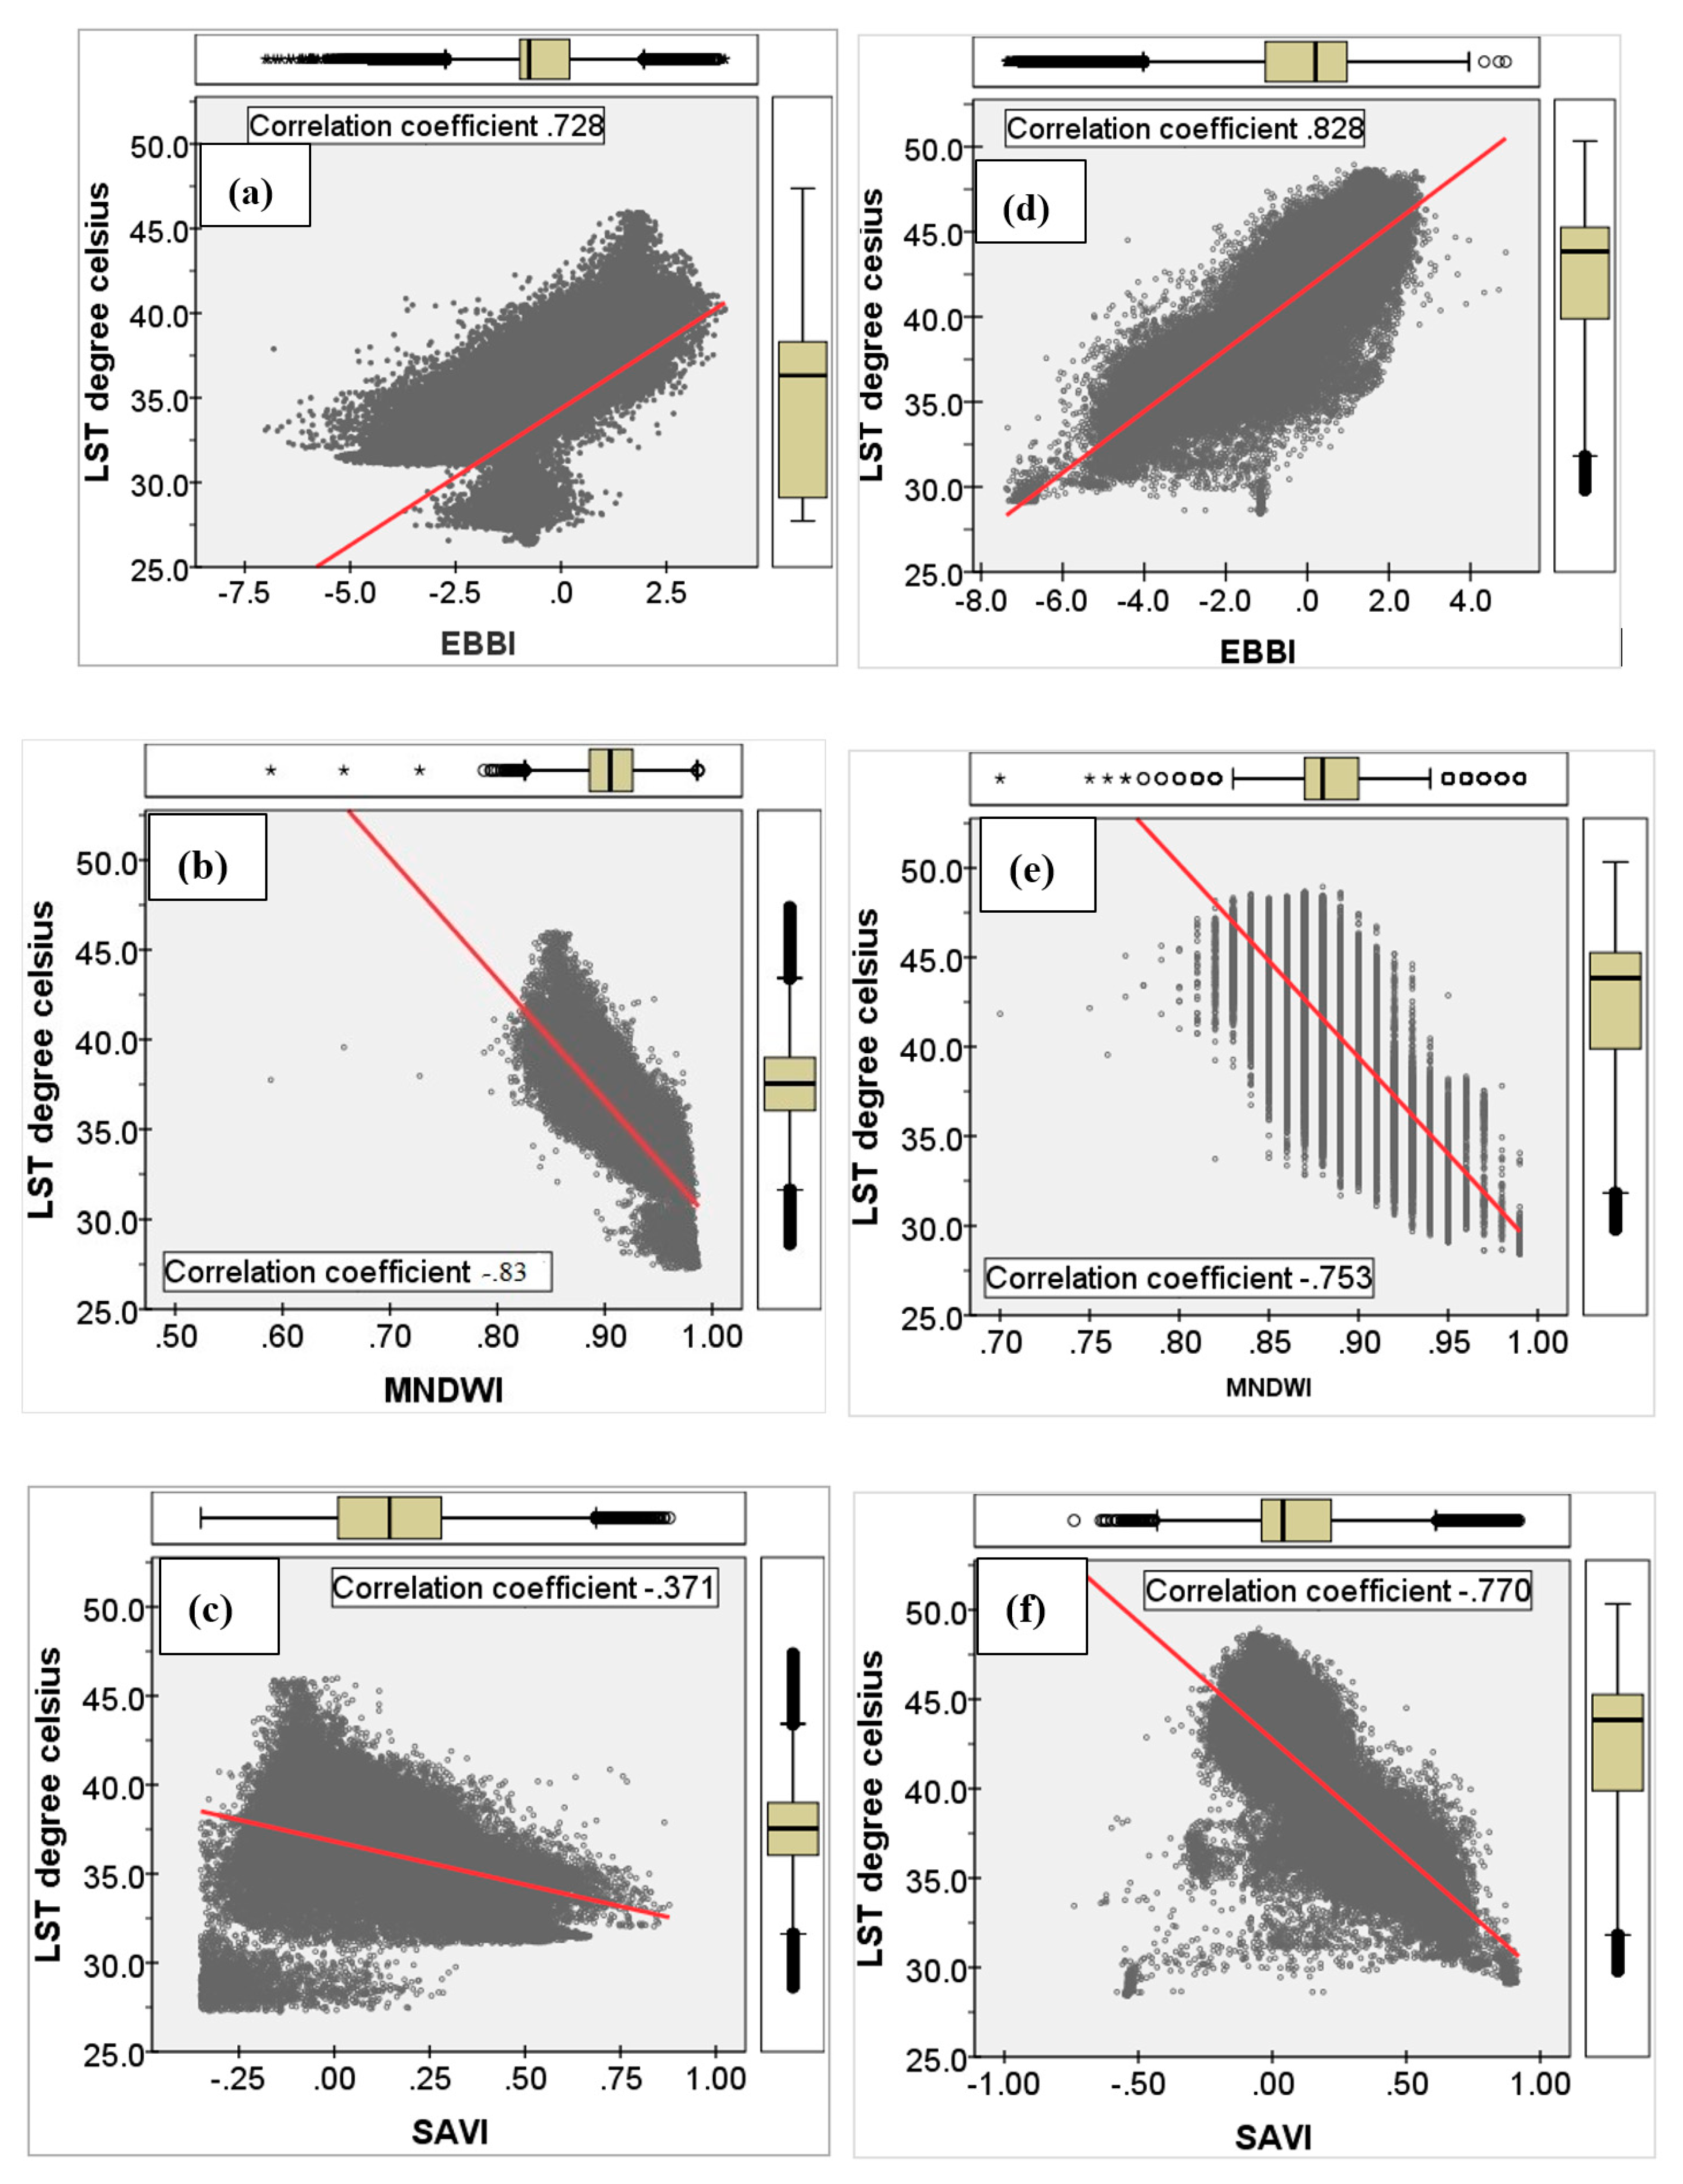
4.4. Relationship of LST and EBBI, MNDWI, and SAVI
4.5. Regression Model
5. Discussion
6. Conclusions
Author Contributions
Funding
Acknowledgments
Conflicts of Interest
Appendix A

| Built-Up Area | Bare Land | Water Body | Vegetation/Agriculture | Classification Overall | Producer’s Accuracy | |
|---|---|---|---|---|---|---|
| Built-up area | 20 | 3 | 0 | 0 | 23 | 86.95% |
| Bare land | 2 | 18 | 0 | 0 | 20 | 90.00% |
| Water body | 0 | 0 | 24 | 3 | 27 | 88.89% |
| Vegetation/agriculture | 0 | 0 | 2 | 23 | 25 | 92.00% |
| Overall Truth | 22 | 21 | 26 | 26 | 95 | |
| User’s accuracy | 90.90% | 86.72% | 90.30% | 88.46% | ||
| Overall Accuracy | 90.32% | |||||
| Kappa coefficient | 0.83 |
| Built-Up Area | Bare Land | Water Body | Vegetation/Agriculture | Classification Overall | Producer’s Accuracy | |
|---|---|---|---|---|---|---|
| Built-up area | 25 | 5 | 0 | 0 | 30 | 83.33% |
| Bare land | 4 | 23 | 0 | 0 | 27 | 85.18% |
| Water body | 0 | 0 | 27 | 5 | 32 | 84.37% |
| Vegetation/agriculture | 0 | 0 | 6 | 25 | 31 | 80.64% |
| Overall Truth | 29 | 28 | 33 | 30 | 120 | |
| User’s accuracy | 86.21% | 82.14% | 81.81% | 83.33% | ||
| Overall Accuracy | 83.33% | |||||
| Kappa coefficient | 0.778 |
References
- Koomen, E.; Rietveld, P.; Bação, F. The third dimension in urban geography: The urban-volume approach. Environ. Plan. B Plan. Des. 2009, 36, 1008–1025. [Google Scholar] [CrossRef] [Green Version]
- Estoque, R.; Murayama, Y.; Tadono, T.; Thapa, R. Measuring urban volume: Geospatial technique and application. Tsukuba Geoenviron. Sci. 2015, 11, 13–20. [Google Scholar]
- Wheeler, S. Planning for Sustainability; Routledge: Abington, UK, 2004; ISBN 0203300564. [Google Scholar]
- Hua, A.K.; Ping, O.W. The influence of land-use/land-cover changes on land surface temperature: A case study of Kuala Lumpur metropolitan city. Eur. J. Remote Sens. 2018, 51, 1049–1069. [Google Scholar] [CrossRef] [Green Version]
- Amiri, R.; Weng, Q.; Alimohammadi, A.; Alavipanah, S.K. Spatial–temporal dynamics of land surface temperature in relation to fractional vegetation cover and land use/cover in the Tabriz urban area, Iran. Remote Sens. Environ. 2009, 113, 2606–2617. [Google Scholar] [CrossRef]
- Rahman, M.; Avtar, R.; Yunus, A.P.; Dou, J.; Misra, P.; Takeuchi, W.; Sahu, N.; Kumar, P.; Johnson, B.; Dasgupta, R.; et al. Monitoring Effect of Spatial Growth on Land Surface Temperature in Dhaka. Remote Sens. 2020, 12, 1191. [Google Scholar] [CrossRef] [Green Version]
- Naserikia, M.; Asadi Shamsabadi, E.; Rafieian, M.; Filho, W. The Urban Heat Island in an Urban Context: A Case Study of Mashhad, Iran. Int. J. Environ. Res. Public Health 2019, 16, 313. [Google Scholar] [CrossRef] [PubMed] [Green Version]
- Tran, D.X.; Pla, F.; Latorre-Carmona, P.; Myint, S.W.; Caetano, M.; Kieu, H.V. Characterizing the relationship between land use land cover change and land surface temperature. ISPRS J. Photogramm. Remote Sens. 2017, 124, 119–132. [Google Scholar] [CrossRef] [Green Version]
- Liu, W.; Ji, C.; Zhong, J.; Jiang, X.; Zheng, Z. Temporal characteristics of the Beijing urban heat island. Theor. Appl. Climatol. 2007, 87, 213–221. [Google Scholar] [CrossRef]
- Xiao, R.; Ouyang, Z.-Y.; Zheng, H.; Li, W.-F.; Schienke, E.W.; Wang, X.-K. Spatial pattern of impervious surfaces and their impacts on land surface temperature in Beijing, China. J. Environ. Sci. 2007, 19, 250–256. [Google Scholar] [CrossRef]
- Xiao, R.; Weng, Q.; Ouyang, Z.; Li, W.; Schienke, E.W.; Zhang, Z. Land surface temperature variation and major factors in Beijing, China. Photogramm. Eng. Remote Sens. 2008, 74, 451–461. [Google Scholar] [CrossRef] [Green Version]
- Weng, Q.; Lu, D.; Schubring, J. Estimation of land surface temperature–vegetation abundance relationship for urban heat island studies. Remote Sens. Environ. 2004, 89, 467–483. [Google Scholar] [CrossRef]
- Yang, L.; Xian, G.; Klaver, J.; Deal, B. Urban Land-Cover Change Detection through Sub-Pixel Imperviousness Mapping Using Remotely Sensed Data. Photogramm. Eng. Remote Sens. 2003, 69, 1003–1010. [Google Scholar] [CrossRef]
- Rizwan, A.M.; Dennis, L.Y.; Chunho, L. A review on the generation, determination and mitigation of Urban Heat Island. J. Environ. Sci. 2008, 20, 120–128. [Google Scholar] [CrossRef]
- Plocoste, T.; Jacoby-Koaly, S.; Molinié, J.; Petit, R.H. Evidence of the effect of an urban heat island on air quality near a landfill. Urban Clim. 2014, 10, 745–757. [Google Scholar] [CrossRef]
- Alghannam, A.R.O.; Al-Qahtnai, M.R.A. Impact of vegetation cover on urban and rural areas of arid climates. Aust. J. Agric. Eng. 2012, 3, 1. [Google Scholar]
- Ng, E.; Chen, L.; Wang, Y.; Yuan, C. A study on the cooling effects of greening in a high-density city: An experience from Hong Kong. Build. Environ. 2012, 47, 256–271. [Google Scholar] [CrossRef]
- Grover, A.; Babu Singh, R. Analysis of Urban Heat Island (UHI) in Relation to Normalized Difference Vegetation Index (NDVI): A Comparative Study of Delhi and Mumbai. Environments 2015, 2, 125–138. [Google Scholar] [CrossRef] [Green Version]
- Avtar, R.; Tripathi, S.; Aggarwal, A.K. Assessment of Energy–Population–Urbanization Nexus with Changing Energy Industry Scenario in India. Land 2019, 8, 124. [Google Scholar] [CrossRef] [Green Version]
- Lilly Rose, A.; Devadas, M.D. Analysis of Land Surface Temperature and Land Use/Land Cover Types Using Remote Sensing Imagery-A Case in Chennai City, India. In Proceedings of the 7th International Conference on Urban Climate (ICUC-7), Yokohama, Japan, 29 June–3 July 2009; Volume 29. [Google Scholar]
- Weng, Q.; Liu, H.; Lu, D. Assessing the effects of land use and land cover patterns on thermal conditions using landscape metrics in city of Indianapolis, United States. Urban Ecosyst. 2007, 10, 203–219. [Google Scholar] [CrossRef]
- Sannigrahi, S.; Bhatt, S.; Rahmat, S.; Uniyal, B.; Banerjee, S.; Chakraborti, S.; Jha, S.; Lahiri, S.; Santra, K.; Bhatt, A. Analyzing the role of biophysical compositions in minimizing urban land surface temperature and urban heating. Urban Clim. 2018, 24, 803–819. [Google Scholar] [CrossRef]
- Sinha, S.; Pandey, P.C.; Sharma, L.K.; Nathawat, M.S.; Kumar, P.; Kanga, S. Remote estimation of land surface temperature for different LULC features of a moist deciduous tropical forest region. In Remote Sensing Applications in Environmental Research; Springer: Basel, Switzerland, 2014; pp. 57–68. [Google Scholar]
- Feizizadeh, B.; Blaschke, T. Examining urban heat island relations to land use and air pollution: Multiple endmember spectral mixture analysis for thermal remote sensing. IEEE J. Sel. Top. Appl. Earth Obs. Remote Sens. 2013, 6, 1749–1756. [Google Scholar] [CrossRef]
- USEPA Heat Island Impacts: Compromised Human Health and Comfort. Available online: https://www.epa.gov/heat-islands/heat-island-impacts (accessed on 6 June 2020).
- Yu, Z.; Guo, X.; Zeng, Y.; Koga, M.; Vejre, H. Variations in land surface temperature and cooling efficiency of green space in rapid urbanization: The case of Fuzhou city, China. Urban For. Urban Green. 2018, 29, 113–121. [Google Scholar] [CrossRef]
- Du, H.; Cai, W.; Xu, Y.; Wang, Z.; Wang, Y.; Cai, Y. Quantifying the cool island effects of urban green spaces using remote sensing Data. Urban For. Urban Green. 2017, 27, 24–31. [Google Scholar] [CrossRef]
- Imhoff, M.L.; Zhang, P.; Wolfe, R.E.; Bounoua, L. Remote sensing of the urban heat island effect across biomes in the continental USA. Remote Sens. Environ. 2010, 114, 504–513. [Google Scholar] [CrossRef] [Green Version]
- Nichol, J.E.; To, P.H. Temporal characteristics of thermal satellite images for urban heat stress and heat island mapping. ISPRS J. Photogramm. Remote Sens. 2012, 74, 153–162. [Google Scholar] [CrossRef]
- Weng, Q. A remote sensing? GIS evaluation of urban expansion and its impact on surface temperature in the Zhujiang Delta, China. Int. J. Remote Sens. 2001, 22, 1999–2014. [Google Scholar]
- Bonafoni, S.; Keeratikasikorn, C. Land Surface Temperature and Urban Density: Multiyear Modeling and Relationship Analysis Using MODIS and Landsat Data. Remote Sens. 2018, 10, 1471. [Google Scholar] [CrossRef] [Green Version]
- Avtar, R.; Kumar, P.; Oono, A.; Saraswat, C.; Dorji, S.; Hlaing, Z. Potential application of remote sensing in monitoring ecosystem services of forests, mangroves and urban areas. Geocarto Int. 2017, 32, 874–885. [Google Scholar] [CrossRef]
- Xu, H. Modification of normalised difference water index (NDWI) to enhance open water features in remotely sensed imagery. Int. J. Remote Sens. 2006, 27, 3025–3033. [Google Scholar] [CrossRef]
- As-syakur, A.; Adnyana, I.; Arthana, I.W.; Nuarsa, I.W. Enhanced Built-Up and Bareness Index (EBBI) for Mapping Built-Up and Bare Land in an Urban Area. Remote Sens. 2012, 4, 2957–2970. [Google Scholar] [CrossRef] [Green Version]
- Yengoh, G.T.; Dent, D.; Olsson, L.; Tengberg, A.E.; Tucker, C.J., III. Use of the Normalized Difference Vegetation Index (NDVI) to Assess Land Degradation at Multiple Scales: Current Status, Future Trends, and Practical Considerations; Springer: Berlin, Germany, 2015; ISBN 3319241125. [Google Scholar]
- Saini, V.; Arora, M.K.; Gupta, R.P. Relationship between surface temperature and SAVI using Landsat data in a coal mining area in India. In Proceedings of the Land Surface and Cryosphere Remote Sensing III, New Delhi, India, 4–7 April 2016; Volume 9877, p. 987711. [Google Scholar]
- Eswar, R.; Sekhar, M.; Bhattacharya, B.K. Disaggregation of LST over India: Comparative analysis of different vegetation indices. Int. J. Remote Sens. 2016, 37, 1035–1054. [Google Scholar] [CrossRef]
- McFeeters, S.K. The use of the Normalized Difference Water Index (NDWI) in the delineation of open water features. Int. J. Remote Sens. 1996, 17, 1425–1432. [Google Scholar] [CrossRef]
- Gascon, M.; Cirach, M.; Martínez, D.; Dadvand, P.; Valentín, A.; Plasència, A.; Nieuwenhuijsen, M.J. Normalized difference vegetation index (NDVI) as a marker of surrounding greenness in epidemiological studies: The case of Barcelona city. Urban For. Urban Green. 2016, 19, 88–94. [Google Scholar] [CrossRef]
- Gill, S.; Handley, J.F.; Ennos, R.; Pauleit, S. Adapting Cities for Climate Change: The Role of the Green Infrastructure. Built Environ. 2007, 33, 115–133. [Google Scholar] [CrossRef] [Green Version]
- Hulme, M.; Turnpenny, J.; Jenkins, G.J. Climate Change Scenarios for the United Kingdom: The UKCIP02 Briefing Report; Tyndall Centre for Climate Change Research, School of Environmental Sciences: Norwich, UK, 2002; ISBN 0-902170-65-1. [Google Scholar]
- Bowler, D.E.; Buyung-Ali, L.; Knight, T.M.; Pullin, A.S. Urban greening to cool towns and cities: A systematic review of the empirical evidence. Landsc. Urban Plan. 2010, 97, 147–155. [Google Scholar] [CrossRef]
- Georgi, J.N.; Dimitriou, D. The contribution of urban green spaces to the improvement of environment in cities: Case study of Chania, Greece. Build. Environ. 2010, 45, 1401–1414. [Google Scholar] [CrossRef] [Green Version]
- Hamada, S.; Ohta, T. Seasonal variations in the cooling effect of urban green areas on surrounding urban areas. Urban For. Urban Green. 2010, 9, 15–24. [Google Scholar] [CrossRef]
- Oliveira, S.; Andrade, H.; Vaz, T. The cooling effect of green spaces as a contribution to the mitigation of urban heat: A case study in Lisbon. Build. Environ. 2011, 46, 2186–2194. [Google Scholar] [CrossRef]
- Semrau, A. Introducing Cool Communities. Am. For. 1992, 98, 49–52. [Google Scholar]
- Rosenfeld, A.H.; Akbari, H.; Romm, J.J.; Pomerantz, M. Cool communities: Strategies for heat island mitigation and smog reduction. Energy Build. 1998, 28, 51–62. [Google Scholar] [CrossRef]
- Tumakuru Smart City. Available online: http://demo.oasisweb.in/smartcitytumakuru/NewTemplate/HomeNew.aspx#projects (accessed on 1 August 2020).
- Avtar, R.; Aggarwal, R.; Kharrazi, A.; Kumar, P.; Kurniawan, T.A. Utilizing geospatial information to implement SDGs and monitor their Progress. Environ. Monit. Assess. 2019, 192, 35. [Google Scholar] [CrossRef] [PubMed]
- Smart Cities Mission. Ministry of Urban Development; Smart Cities Mission: New Delhi, India, 2016. [Google Scholar]
- Ministry of Urban Development. Government of India SMART CITY MISSION. Available online: https://smartnet.niua.org/sites/default/files/resources/Panaji_SCP.pdf (accessed on 10 August 2020).
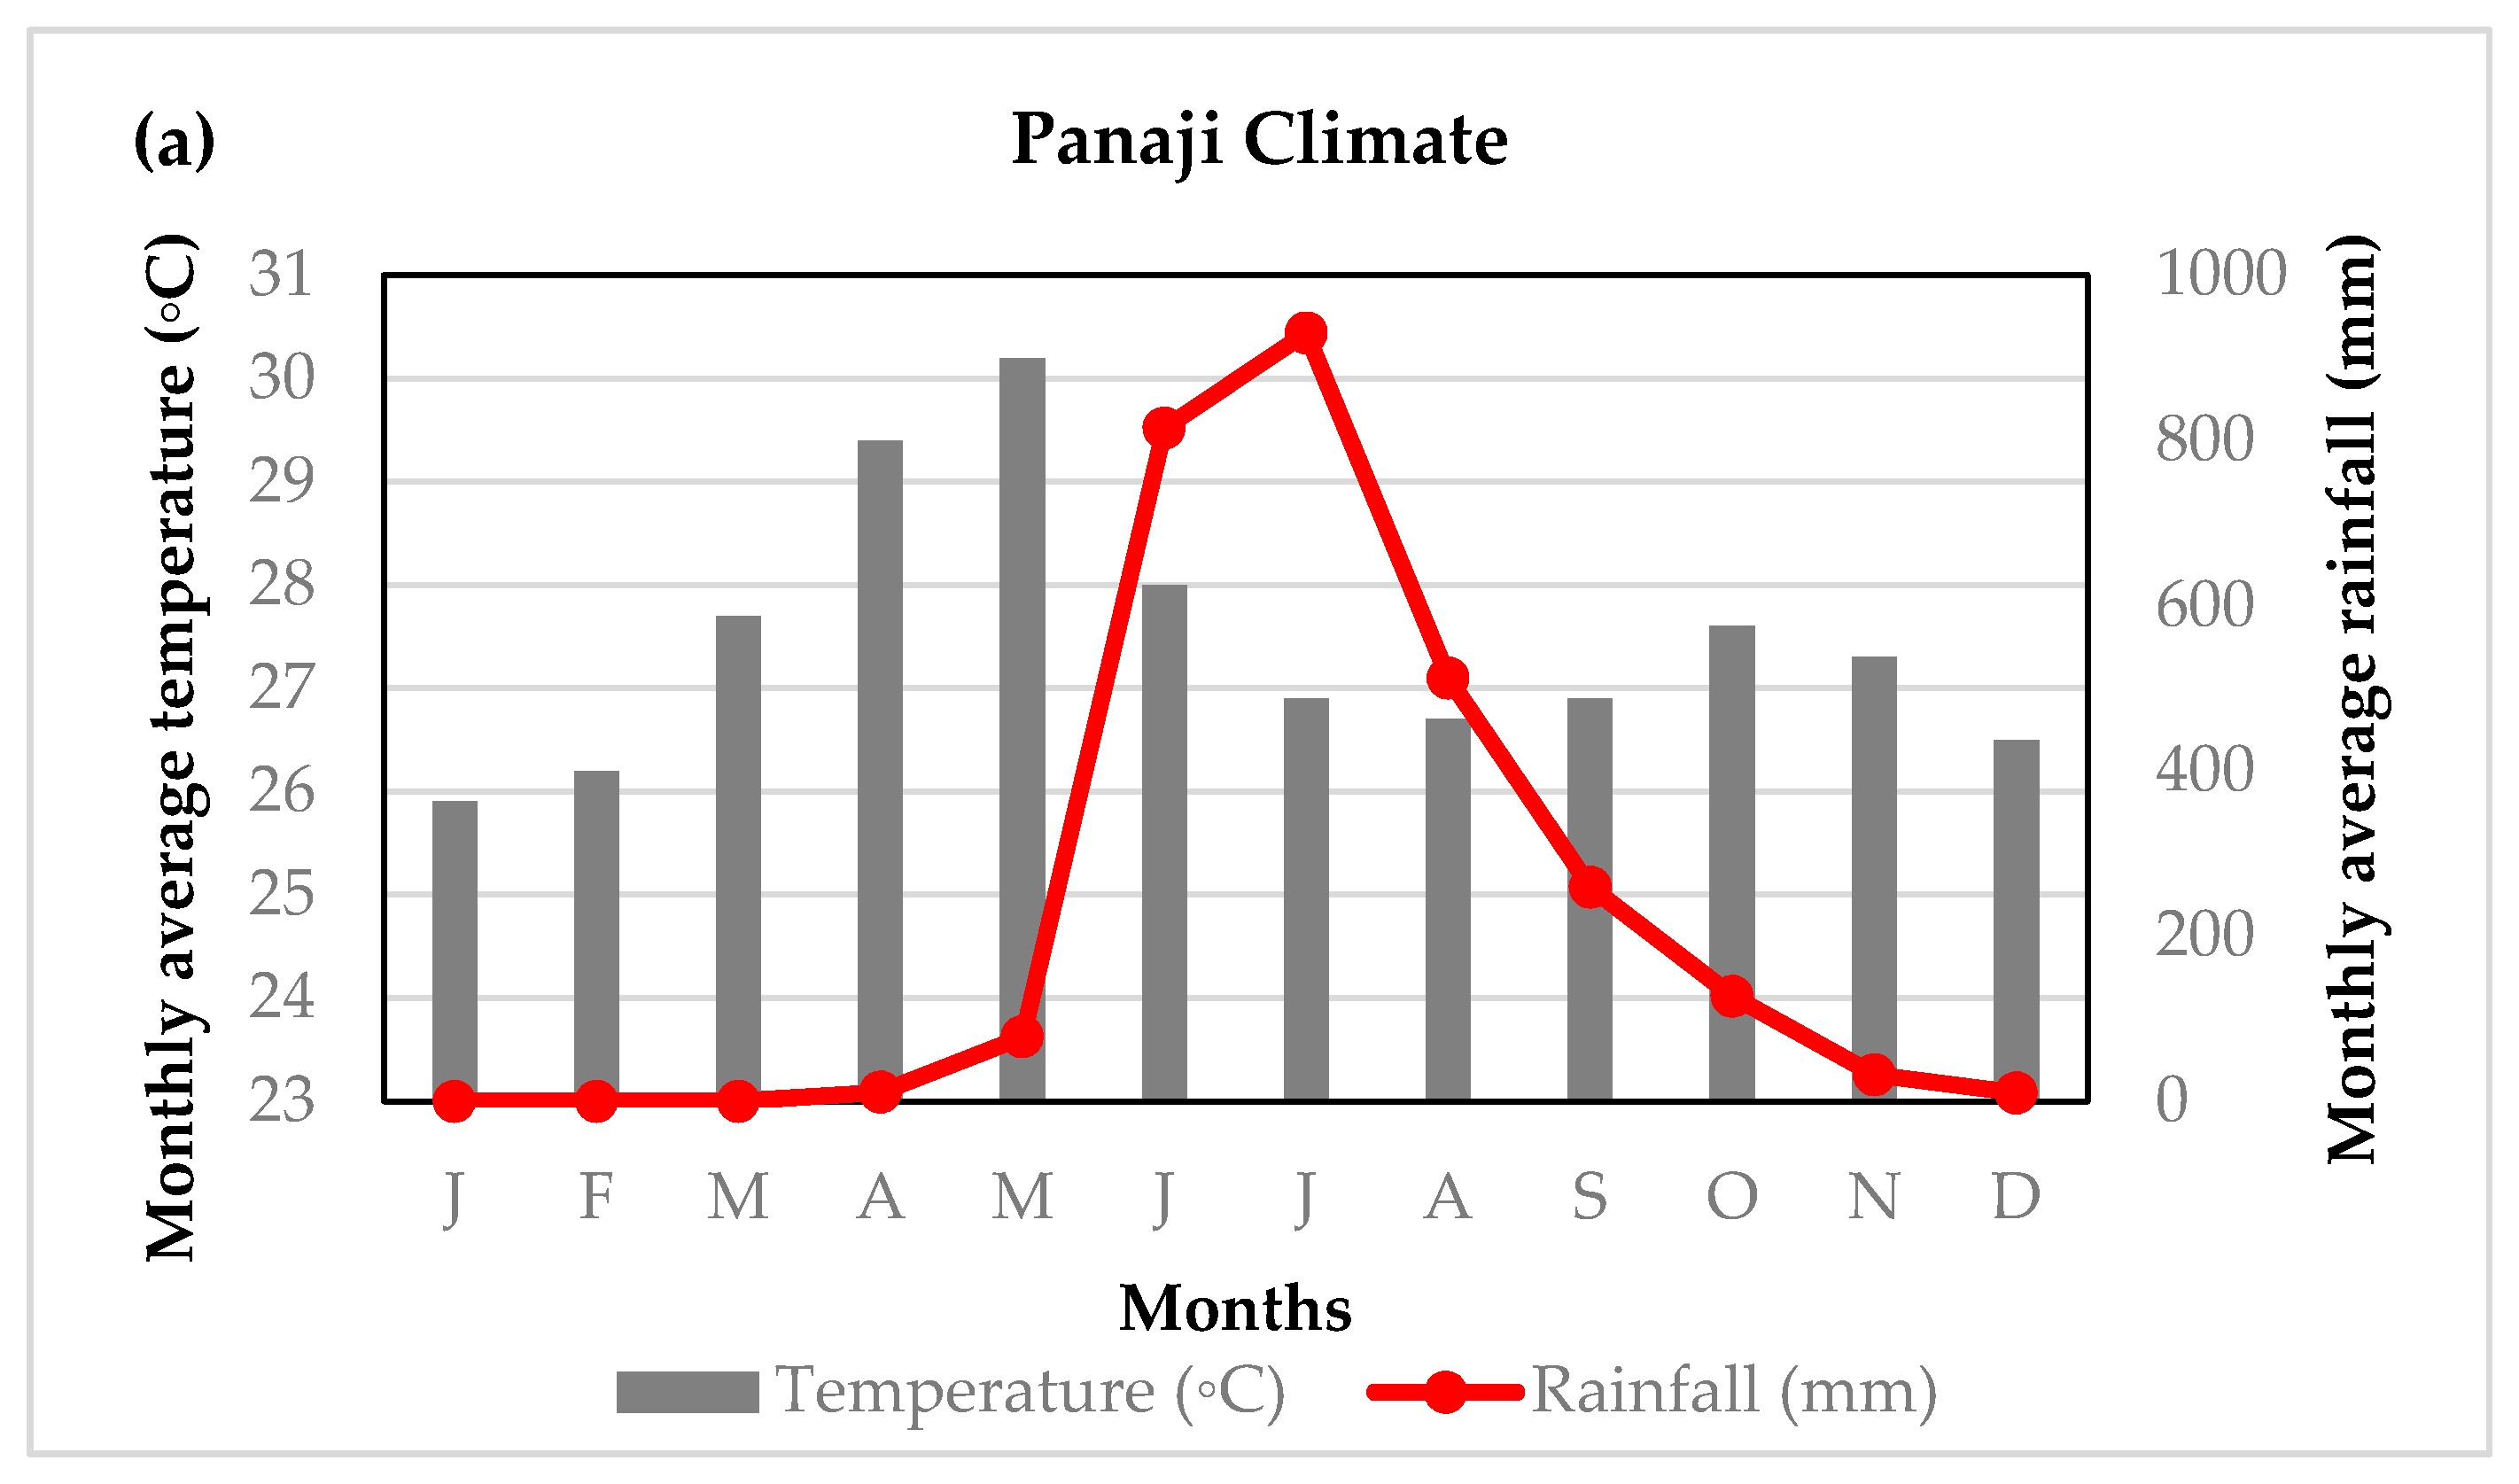
- Panaji Climate: Average Temperature, Weather By Month, Panaji Weather Averages. Available online: https://en.climate-data.org/asia/india/goa/panaji-6394/ (accessed on 22 August 2019).
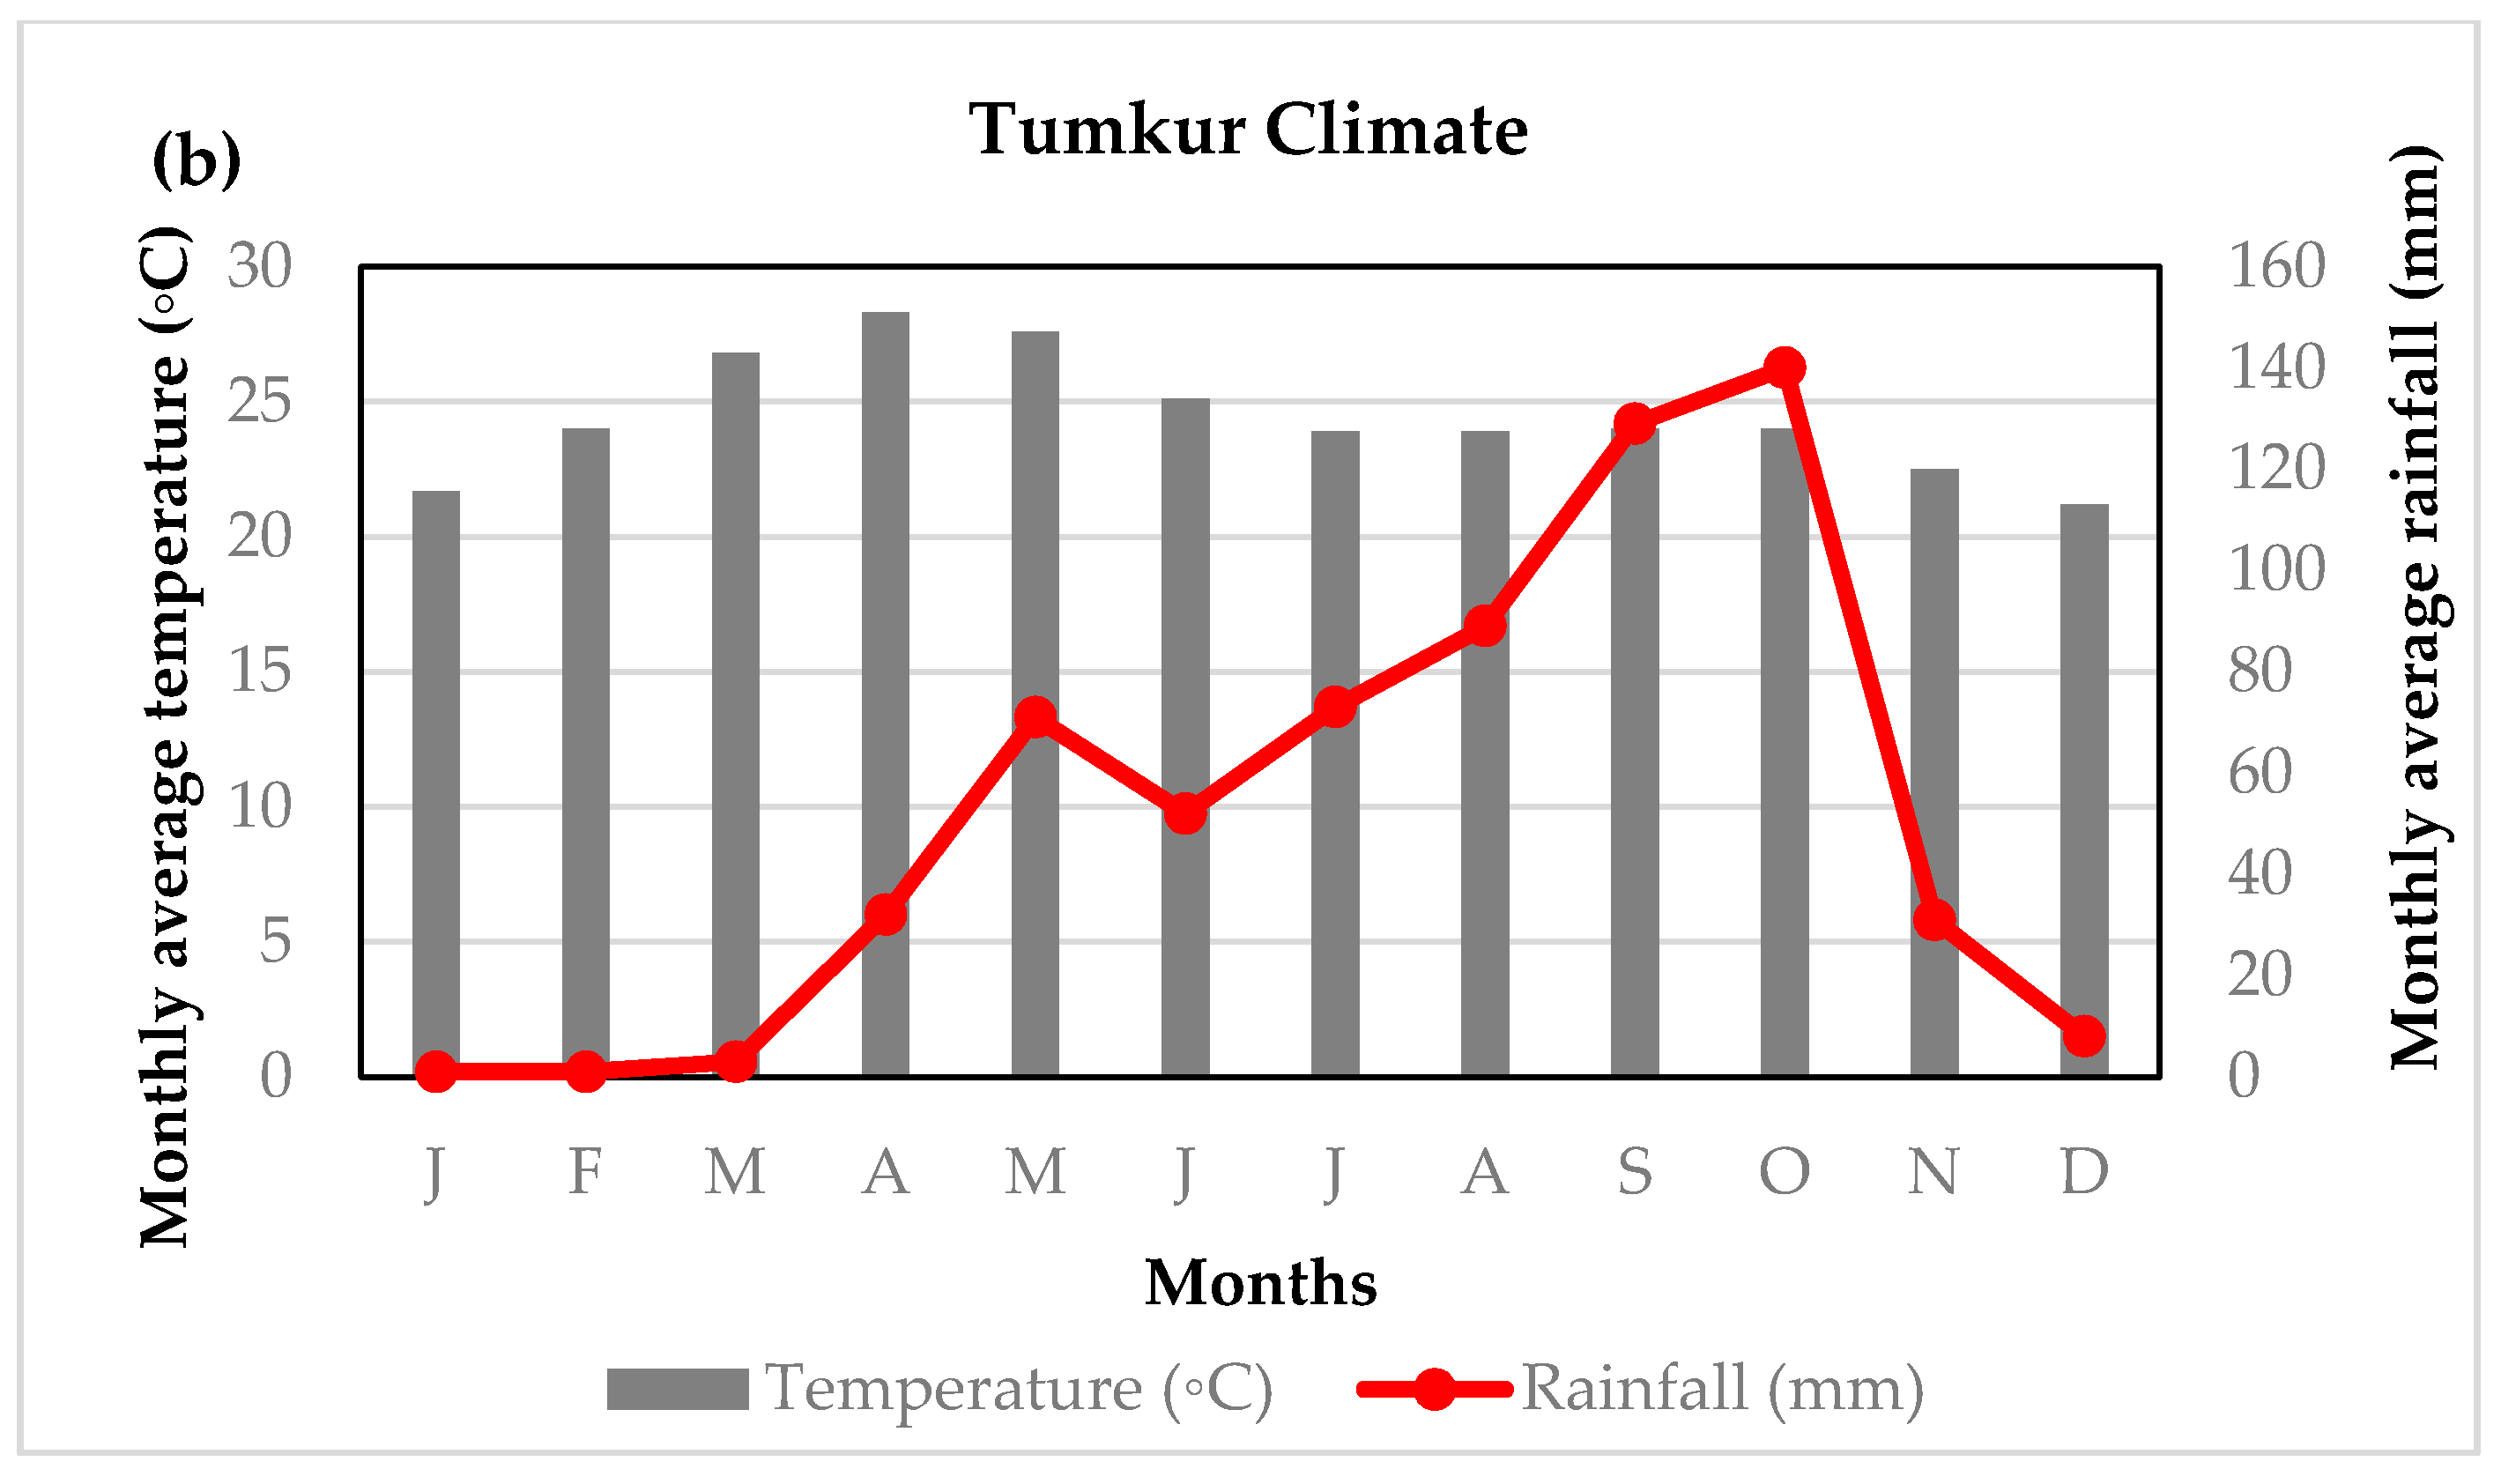
- Tumakuru Climate: Average Temperature, Weather by Month, Tumakuru Weather Averages. Available online: https://en.climate-data.org/asia/india/karnataka/tumakuru-47643/ (accessed on 12 September 2019).
- Corporation of the City of Panaji. CRISIL Risk and Infrastructure Solutions Limited Revised City Development Plan for Panaji, 2041. Available online: http://imaginepanaji.com/wp-content/uploads/2015/11/Revised-City-Development-Plan-for-Panaji-2041-2.pdf (accessed on 17 September 2019).
- Prakash, Y. Smart Cities Mission in India: An Empirical study on opportunities and Challenges. In Urbanization in India: Issues and Challenges; Avni Publications: Rajasthan, India, 2017; pp. 125–134. ISBN 978-93-82968-76-4. [Google Scholar]
- Myint, S.W.; Wentz, E.A.; Brazel, A.J.; Quattrochi, D.A. The impact of distinct anthropogenic and vegetation features on urban warming. Landsc. Ecol. 2013, 28, 959–978. [Google Scholar] [CrossRef] [Green Version]
- Zhang, Y.; Chen, L.; Wang, Y.; Chen, L.; Yao, F.; Wu, P.; Wang, B.; Li, Y.; Zhou, T.; Zhang, T. Research on the contribution of urban land surface moisture to the alleviation effect of urban land surface heat based on landsat 8 data. Remote Sens. 2015, 7, 10737–10762. [Google Scholar] [CrossRef] [Green Version]
- EarthExplorer. Available online: https://earthexplorer.usgs.gov/ (accessed on 10 August 2020).
- Sonka, M.; Hlavac, V.; Boyle, R. Image pre-processing. In Image Processing, Analysis and Machine Vision; Springer: Berlin, Germany, 1993; pp. 56–111. [Google Scholar]
- Zha, Y.; Gao, J.; Ni, S. Use of normalized difference built-up index in automatically mapping urban areas from TM imagery. Int. J. Remote Sens. 2003, 24, 583–594. [Google Scholar] [CrossRef]
- Bouzekri, S.; Lasbet, A.A.; Lachehab, A. A new spectral index for extraction of built-up area using Landsat-8 data. J. Indian Soc. Remote Sens. 2015, 43, 867–873. [Google Scholar] [CrossRef]
- He, C.; Shi, P.; Xie, D.; Zhao, Y. Improving the normalized difference built-up index to map urban built-up areas using a semiautomatic segmentation approach. Remote Sens. Lett. 2010, 1, 213–221. [Google Scholar] [CrossRef] [Green Version]
- Li, H.; Wang, C.; Zhong, C.; Su, A.; Xiong, C.; Wang, J.; Liu, J. Mapping Urban Bare Land Automatically from Landsat Imagery with a Simple Index. Remote Sens. 2017, 9, 249. [Google Scholar] [CrossRef] [Green Version]
- Huete, A.R. A soil-adjusted vegetation index (SAVI). Remote Sens. Environ. 1988, 25, 295–309. [Google Scholar] [CrossRef]
- Qi, J.; Chehbouni, A.; Huete, A.R.; Kerr, Y.H.; Sorooshian, S. A modified soil adjusted vegetation index. Remote Sens. Environ. 1994, 48, 119–126. [Google Scholar] [CrossRef]
- Tirta, I.M.; Anggraeni, D.; Pandutama, M. Online Statistical Modeling (Regression Analysis) for Independent Responses. J. Phys. Conf. Ser. 2017, 855, 12054. [Google Scholar] [CrossRef]
- Dobson, A.J. Introduction to Statistical Modelling; Springer: Berlin, Germany, 2013; ISBN 1489931740. [Google Scholar]
- Herold, M.; Gardner, M.E.; Roberts, D.A. Spectral resolution requirements for mapping urban areas. IEEE Trans. Geosci. Remote Sens. 2003, 41, 1907–1919. [Google Scholar] [CrossRef] [Green Version]
- Ahmed, B.; Hasan, R.; Maniruzzaman, K.M. Urban Morphological Change Analysis of Dhaka City, Bangladesh, Using Space Syntax. ISPRS Int. J. Geo-Inf. 2014, 3, 1412–1444. [Google Scholar] [CrossRef]
- Alam, M.J. Rapid urbanization and changing land values in mega cities: Implications for housing development projects in Dhaka, Bangladesh. Bdg. J. Glob. South 2018, 5, 1–19. [Google Scholar] [CrossRef] [Green Version]
- Biggs, J.; von Fumetti, S.; Kelly-Quinn, M. The importance of small waterbodies for biodiversity and ecosystem services: Implications for policy makers. Hydrobiologia 2016, 793, 3–39. [Google Scholar] [CrossRef]
- Jackson, T.J.; Chen, D.; Cosh, M.; Li, F.; Anderson, M.; Walthall, C.; Doriaswamy, P.; Hunt, E.R. Vegetation water content mapping using Landsat data derived normalized difference water index for corn and soybeans. Remote Sens. Environ. 2004, 92, 475–482. [Google Scholar] [CrossRef]
- Quattrochi, D.A.; Luvall, J.C. Thermal infrared remote sensing for analysis of landscape ecological processes: Methods and applications. Landsc. Ecol. 1999, 14, 577–598. [Google Scholar] [CrossRef]
- Mallick, J.; Kant, Y.; Bharath, B.D. Estimation of land surface temperature over Delhi using Landsat-7 ETM+. J. Ind. Geophys. Union 2008, 12, 131–140. [Google Scholar]
- Walawender, J.P.; Szymanowski, M.; Hajto, M.J.; Bokwa, A. Land Surface Temperature Patterns in the Urban Agglomeration of Krakow (Poland) Derived from Landsat-7/ETM+ Data. Pure Appl. Geophys. 2014, 171, 913–940. [Google Scholar] [CrossRef] [Green Version]
- Yuan, F.; Bauer, M.E. Comparison of impervious surface area and normalized difference vegetation index as indicators of surface urban heat island effects in Landsat imagery. Remote Sens. Environ. 2007, 106, 375–386. [Google Scholar] [CrossRef]
- Adams, M.P.; Smith, P.L. A systematic approach to model the influence of the type and density of vegetation cover on urban heat using remote sensing. Landsc. Urban Plan. 2014, 132, 47–54. [Google Scholar] [CrossRef]
- Rotem-Mindali, O.; Michael, Y.; Helman, D.; Lensky, I.M. The role of local land-use on the urban heat island effect of Tel Aviv as assessed from satellite remote sensing. Appl. Geogr. 2015, 56, 145–153. [Google Scholar] [CrossRef]
- Guo, G.; Wu, Z.; Xiao, R.; Chen, Y.; Liu, X.; Zhang, X. Impacts of urban biophysical composition on land surface temperature in urban heat island clusters. Landsc. Urban Plan. 2015, 135, 1–10. [Google Scholar] [CrossRef]
- Guo, G.; Zhou, X.; Wu, Z.; Xiao, R.; Chen, Y. Characterizing the impact of urban morphology heterogeneity on land surface temperature in Guangzhou, China. Environ. Model. Softw. 2016, 84, 427–439. [Google Scholar] [CrossRef]
- Guha, S.; Govil, H.; Gill, N.; Dey, A. Analytical study on the relationship between land surface temperature and land use/land cover indices. Ann. GIS 2020, 26, 201–216. [Google Scholar] [CrossRef]
- Sharma, P. Tumkur: A Smart City in the Making. Available online: https://www.siliconindia.com/news/general/Tumkur-A-Smart-City-in-the-Making-nid-206312-cid-1.html (accessed on 9 November 2019).
- Estoque, R.C.; Murayama, Y. Monitoring surface urban heat island formation in a tropical mountain city using Landsat data (1987–2015). ISPRS J. Photogramm. Remote Sens. 2017, 133, 18–29. [Google Scholar] [CrossRef]
- Zhang, X.; Estoque, R.C.; Murayama, Y. An urban heat island study in Nanchang City, China based on land surface temperature and social-ecological variables. Sustain. Cities Soc. 2017, 32, 557–568. [Google Scholar] [CrossRef]
- Estoque, R.C.; Murayama, Y.; Myint, S.W. Effects of landscape composition and pattern on land surface temperature: An urban heat island study in the megacities of Southeast Asia. Sci. Total Environ. 2017, 577, 349–359. [Google Scholar] [CrossRef]
- Thapa, R.; Murayama, Y. Urban mapping, accuracy, & image classification: A comparison of multiple approaches in Tsukuba City, Japan. Appl. Geogr. 2009, 29, 135–144. [Google Scholar] [CrossRef] [Green Version]
- Ramaiah, M.; Avtar, R. Urban Green Spaces and Their Need in Cities of Rapidly Urbanizing India: A Review. Urban Sci. 2019, 3, 94. [Google Scholar] [CrossRef] [Green Version]
- Rahman, M.M.; Rahman, M.M.; Momotaz, M. Environmental Quality Evaluation in Dhaka City Corporation (DCC)-Using Satellite Imagery. Proc. Inst. Civ. Eng. Urban Des. Plan. 2019, 172, 13–25. [Google Scholar] [CrossRef]
- Niemelä, J.; Saarela, S.-R.; Söderman, T.; Kopperoinen, L.; Yli-Pelkonen, V.; Väre, S.; Kotze, D.J. Using the ecosystem services approach for better planning and conservation of urban green spaces: A Finland case study. Biodivers. Conserv. 2010, 19, 3225–3243. [Google Scholar] [CrossRef]
- Li, X.; Zhou, W.; Ouyang, Z.; Xu, W.; Zheng, H. Spatial pattern of greenspace affects land surface temperature: Evidence from the heavily urbanized Beijing metropolitan area, China. Landsc. Ecol. 2012, 27, 887–898. [Google Scholar] [CrossRef]
- Tyrväinen, L.; Pauleit, S.; Seeland, K.; de Vries, S. Benefits and uses of urban forests and trees. In Urban Forests and Trees; Springer: Berlin, Germany, 2005; pp. 81–114. [Google Scholar]
- Kong, F.; Yin, H.; Nakagoshi, N. Using GIS and landscape metrics in the hedonic price modeling of the amenity value of urban green space: A case study in Jinan City, China. Landsc. Urban Plan. 2007, 79, 240–252. [Google Scholar] [CrossRef]
- Kong, F.; Yin, H.; Nakagoshi, N.; Zong, Y. Urban green space network development for biodiversity conservation: Identification based on graph theory and gravity modeling. Landsc. Urban Plan. 2010, 95, 16–27. [Google Scholar] [CrossRef]
- Cao, X.; Onishi, A.; Chen, J.; Imura, H. Quantifying the cool island intensity of urban parks using ASTER and IKONOS data. Landsc. Urban Plan. 2010, 96, 224–231. [Google Scholar] [CrossRef]


| Parameters | Panaji | Tumkur |
|---|---|---|
| City area (km2) | 21.60 | 48.60 |
| Geographic location | Coastal | Interior |
| Land scape | Heterogenous | Majorly plain |
| Population (2018 estimate) | 255,381 | 512,000 |
| City GDP (Billion US$) | 9.22 (2016) | 1.14 (2014) |
| Path/Tiles | Time | Acquisition Date | Cloud Coverage | Location |
|---|---|---|---|---|
| 144/51 | 11:10:20.54 AM | 14 April 2019 | 3% | Tumkur |
| 147/49 | 11:28:12.31 AM | 18 March 2019 | 1% | Panaji |
| LULC | Panaji Area in Km2 | Tumkur Area in Km2 | ||
|---|---|---|---|---|
| Built-up area | 31.65 | 32% | 40.01 | 41% |
| Bare land | 12.49 | 13% | 32.20 | 33% |
| Water bodies | 30.17 | 31% | 0.97 | 1% |
| Vegetation/agriculture | 23.78 | 24% | 24.4 | 25% |
© 2020 by the authors. Licensee MDPI, Basel, Switzerland. This article is an open access article distributed under the terms and conditions of the Creative Commons Attribution (CC BY) license (http://creativecommons.org/licenses/by/4.0/).
Share and Cite
Ramaiah, M.; Avtar, R.; Rahman, M.M. Land Cover Influences on LST in Two Proposed Smart Cities of India: Comparative Analysis Using Spectral Indices. Land 2020, 9, 292. https://doi.org/10.3390/land9090292
Ramaiah M, Avtar R, Rahman MM. Land Cover Influences on LST in Two Proposed Smart Cities of India: Comparative Analysis Using Spectral Indices. Land. 2020; 9(9):292. https://doi.org/10.3390/land9090292
Chicago/Turabian StyleRamaiah, Manish, Ram Avtar, and Md. Mustafizur Rahman. 2020. "Land Cover Influences on LST in Two Proposed Smart Cities of India: Comparative Analysis Using Spectral Indices" Land 9, no. 9: 292. https://doi.org/10.3390/land9090292