Mapping Landscape Potential for Supporting Green Infrastructure: The Case of a Watershed in Turkey


1
Urban Forestry Research in Action, Department of Forest Resources Management, British Columbia University, Vancouver, BC V6T 1Z4, Canada
2
Faculty of Agriculture, Department of Landscape Architecture, Aydın Adnan Menderes University, 09100 Aydın, Turkey
3
Faculty of Architecture, Department of Landscape Architecture, Çukurova University, 01330 Adana, Turkey
*
Author to whom correspondence should be addressed.
Land 2020, 9(8), 268; https://doi.org/10.3390/land9080268
Submission received: 27 July 2020
/
Revised: 5 August 2020
/
Accepted: 6 August 2020
/
Published: 11 August 2020
Abstract
:Green infrastructure (GI) is a strategic planning approach that can contribute to solutions for ecological, social, and environmental problems. GI also aims to conserve natural and semi-natural landscapes and enhance ecological networks. Within the scope of spatial planning, urban and rural landscape units can be integrated through GI planning. In this study, we propose a method to calculate the landscape potential and map GI in the lower Büyük Menderes River Basin, Turkey. We used landscape character assessment (LCA) to identify the landscape typology, which was one of the key steps for determining the landscape potential. Three thematic maps were produced and overlaid in ArcMap 10.7. A map showing the spatial distributions of 71 landscape types was created by means of LCA. Then, the landscape types were assessed according to defined criteria, and finally, GI of the study area was mapped. This study found that high-quality landscape types were located in the middle, northern, and eastern parts of the lower Büyük Menderes River Basin, rather than in the protected areas. Moreover, 68 of the 71 landscape types were present in the GI map. The findings show the necessity of including the landscape potential concept in conservation strategies. Thus, this paper provides a reference guideline for mapping GI as a contributor to nature conservation and spatial planning strategies.
1. Introduction
Green infrastructure (GI), which was introduced at the end of 1990s and developed as a planning approach for landscape and urban planning, is based on the concept of greenway landscapes [1,2]. Greenways are linear areas that protect and restore nature, connect outdoor areas, and act as corridors for wildlife transit. Based upon the concept of greenways, the “green corridor” approach, with almost the same meaning as greenways, was introduced [2]. The greenway, green belt, and green corridor concepts often used in urban and rural landscape planning are the basic parts of GI. GI includes protected natural areas (wetlands, nature reserves, wildlife habitats, etc.), semi-natural areas (national parks, water canals, wildlife corridors, etc.), other spaces (agricultural areas, private gardens, etc.), green spaces (parks, greenways, etc.), and landscape elements of these areas [3]. The GI network provides a link between ecosystems and landscape units [4,5]. The GI approach can be considered as an up-to-date approach in landscape architecture studies, and it demonstrates the relationship between open/green spaces within ecosystem services. The main objective of GI planning and development is to maintain ecologically healthy and vibrant cultural/natural landscapes while preserving natural resources in cities [6]. GI has become a key strategy for achieving sustainable development, and is now widely used by planners, researchers, and agencies [7]. According to diverse definitions [5,8,9,10,11], there is a clear emphasis on the importance of GI in promoting biodiversity and natural conservation.
GI strategies have been highlighted in different programs and directives of the EU, with the aim to integrate GI with policy in Europe [12]. The role of GI in the EU perspective is to promote spatial planning by defining multifunctional areas and by including habitat restoration options. Furthermore, GI makes connection in many fields such as land use plans and policies both at the urban and the landscape scale [13]. Landscape potential (LP) helps to find and define the relationship between natural and functional structures [14]. Pechanec et al. [14] also highlighted that, in some European countries, all considerations regarding the ecological optimization of land use and resources were based on LP. In theory, LP represents not only the availability of different landscape uses, but also the degree of land use. Therefore, LP is considered a notion that should be used in sustainable development. Sustainable use of natural and cultural LP has been associated with landscape conservation in some Turkish cases [15,16]. In these cases, LP was assessed as a top priority due to its contribution to ecosystems in terms of the integrity of the landscape.
The procedure of identifying landscapes starts with landscape atlases, regarded as instruments used for environmental assessments, which describe distinct landscape types and their dynamic structures to protect biodiversity and to develop related policies [17,18,19,20,21,22]. In this regard, the definition and classification of landscapes are important for identifying their quality and for determining conservation priorities. Different methods have been developed based on landscape ecology for the evaluation and classification of landscapes [23]. The analysis of the landscape structure is important in terms of explaining the relationships among the elements that form the landscape. The determination of the relationships among the landscape structures and functions plays an important role in predicting the possible impacts of planned activities on the ecosystem and in directing planning decisions in this direction [24]. To discover the role of landscapes and to understand the spatial composition of GI, landscape character assessment (LCA) provides an efficient approach [25]. According to the Landscape Institute position statement [26], LCA was employed for GI strategy in three cities (i.e., Derbyshire, Leicestershire, and Nottinghamshire) of the U.K. The strategy, which aimed to maintain, enhance, and extend networks of green spaces and natural elements in these three cities, recognized the need for LCA to underpin GI provision [26,27,28]. Uzun et al. [29] highlighted that each country ratifying European Landscape Convention (ELC) is responsible for identifying their landscapes. Since Turkey signed the Convention in 2000, LCA has gained much interest over recent years. Although there are some researches testing LCA with different targets such as understanding biophysical landscapes or observing visual landscapes, there is still the need to prepare a legal instrument that could afford the opportunity to manage and conserve Turkey’s habitats and biodiversity [30]. LCA studies mostly lead to land use decisions by describing the character and ecological value of landscapes. Various methods of landscape analysis such as landscape indices that quantify landscape patterns and ecological models that determine top-priority landscape patches have been developed recently [31,32]. However, there is still a need to understand the implication of landscape analysis in Turkey. Which one is the most suitable methodology applicable to Turkish landscapes? How can we integrate the results into the land use planning process? In response to these questions, Atik et al. [30] highlighted that current efforts on the implementation of ELC, i.e., identifying and assessing landscapes, would make contributions for the integration of landscape planning policies.
In this paper, we aimed to analyze landscape typology and determine LP for mapping GI in the case of the lower Büyük Menderes River Basin. Within the framework of GI planning, we also aimed to develop a sample methodology applicable at the basin scale using LCA. Determining the presence and distribution of the landscape character types of this area can help to inform land use decisions, with greater emphasis on, e.g., nature conservation. As an analysis tool, LCA is quite new to Turkey and there are a few studies using different thematic maps to define landscape types at the regional or the local scale. In this paper, the aim was to provide a reference guideline for nature conservation and spatial planning that can lead to land use decisions in the case of the Aegean Region of Turkey. To fulfill this goal, the acquisition or production of biodiversity data that cover the spatial distribution of priority habitats for landscape-level evaluation is required. The original aspect of this study is one of the criteria that were used for GI mapping. Among the criteria that have been taken into consideration so far in GI planning, there is a big gap in previous studies regarding “diversity of landscape”. For this reason, we aimed to develop a new potential landscape diversity formula. In this context, a methodological approach consisting of a combined use of landscape analyses was developed.
2. Materials and Methods
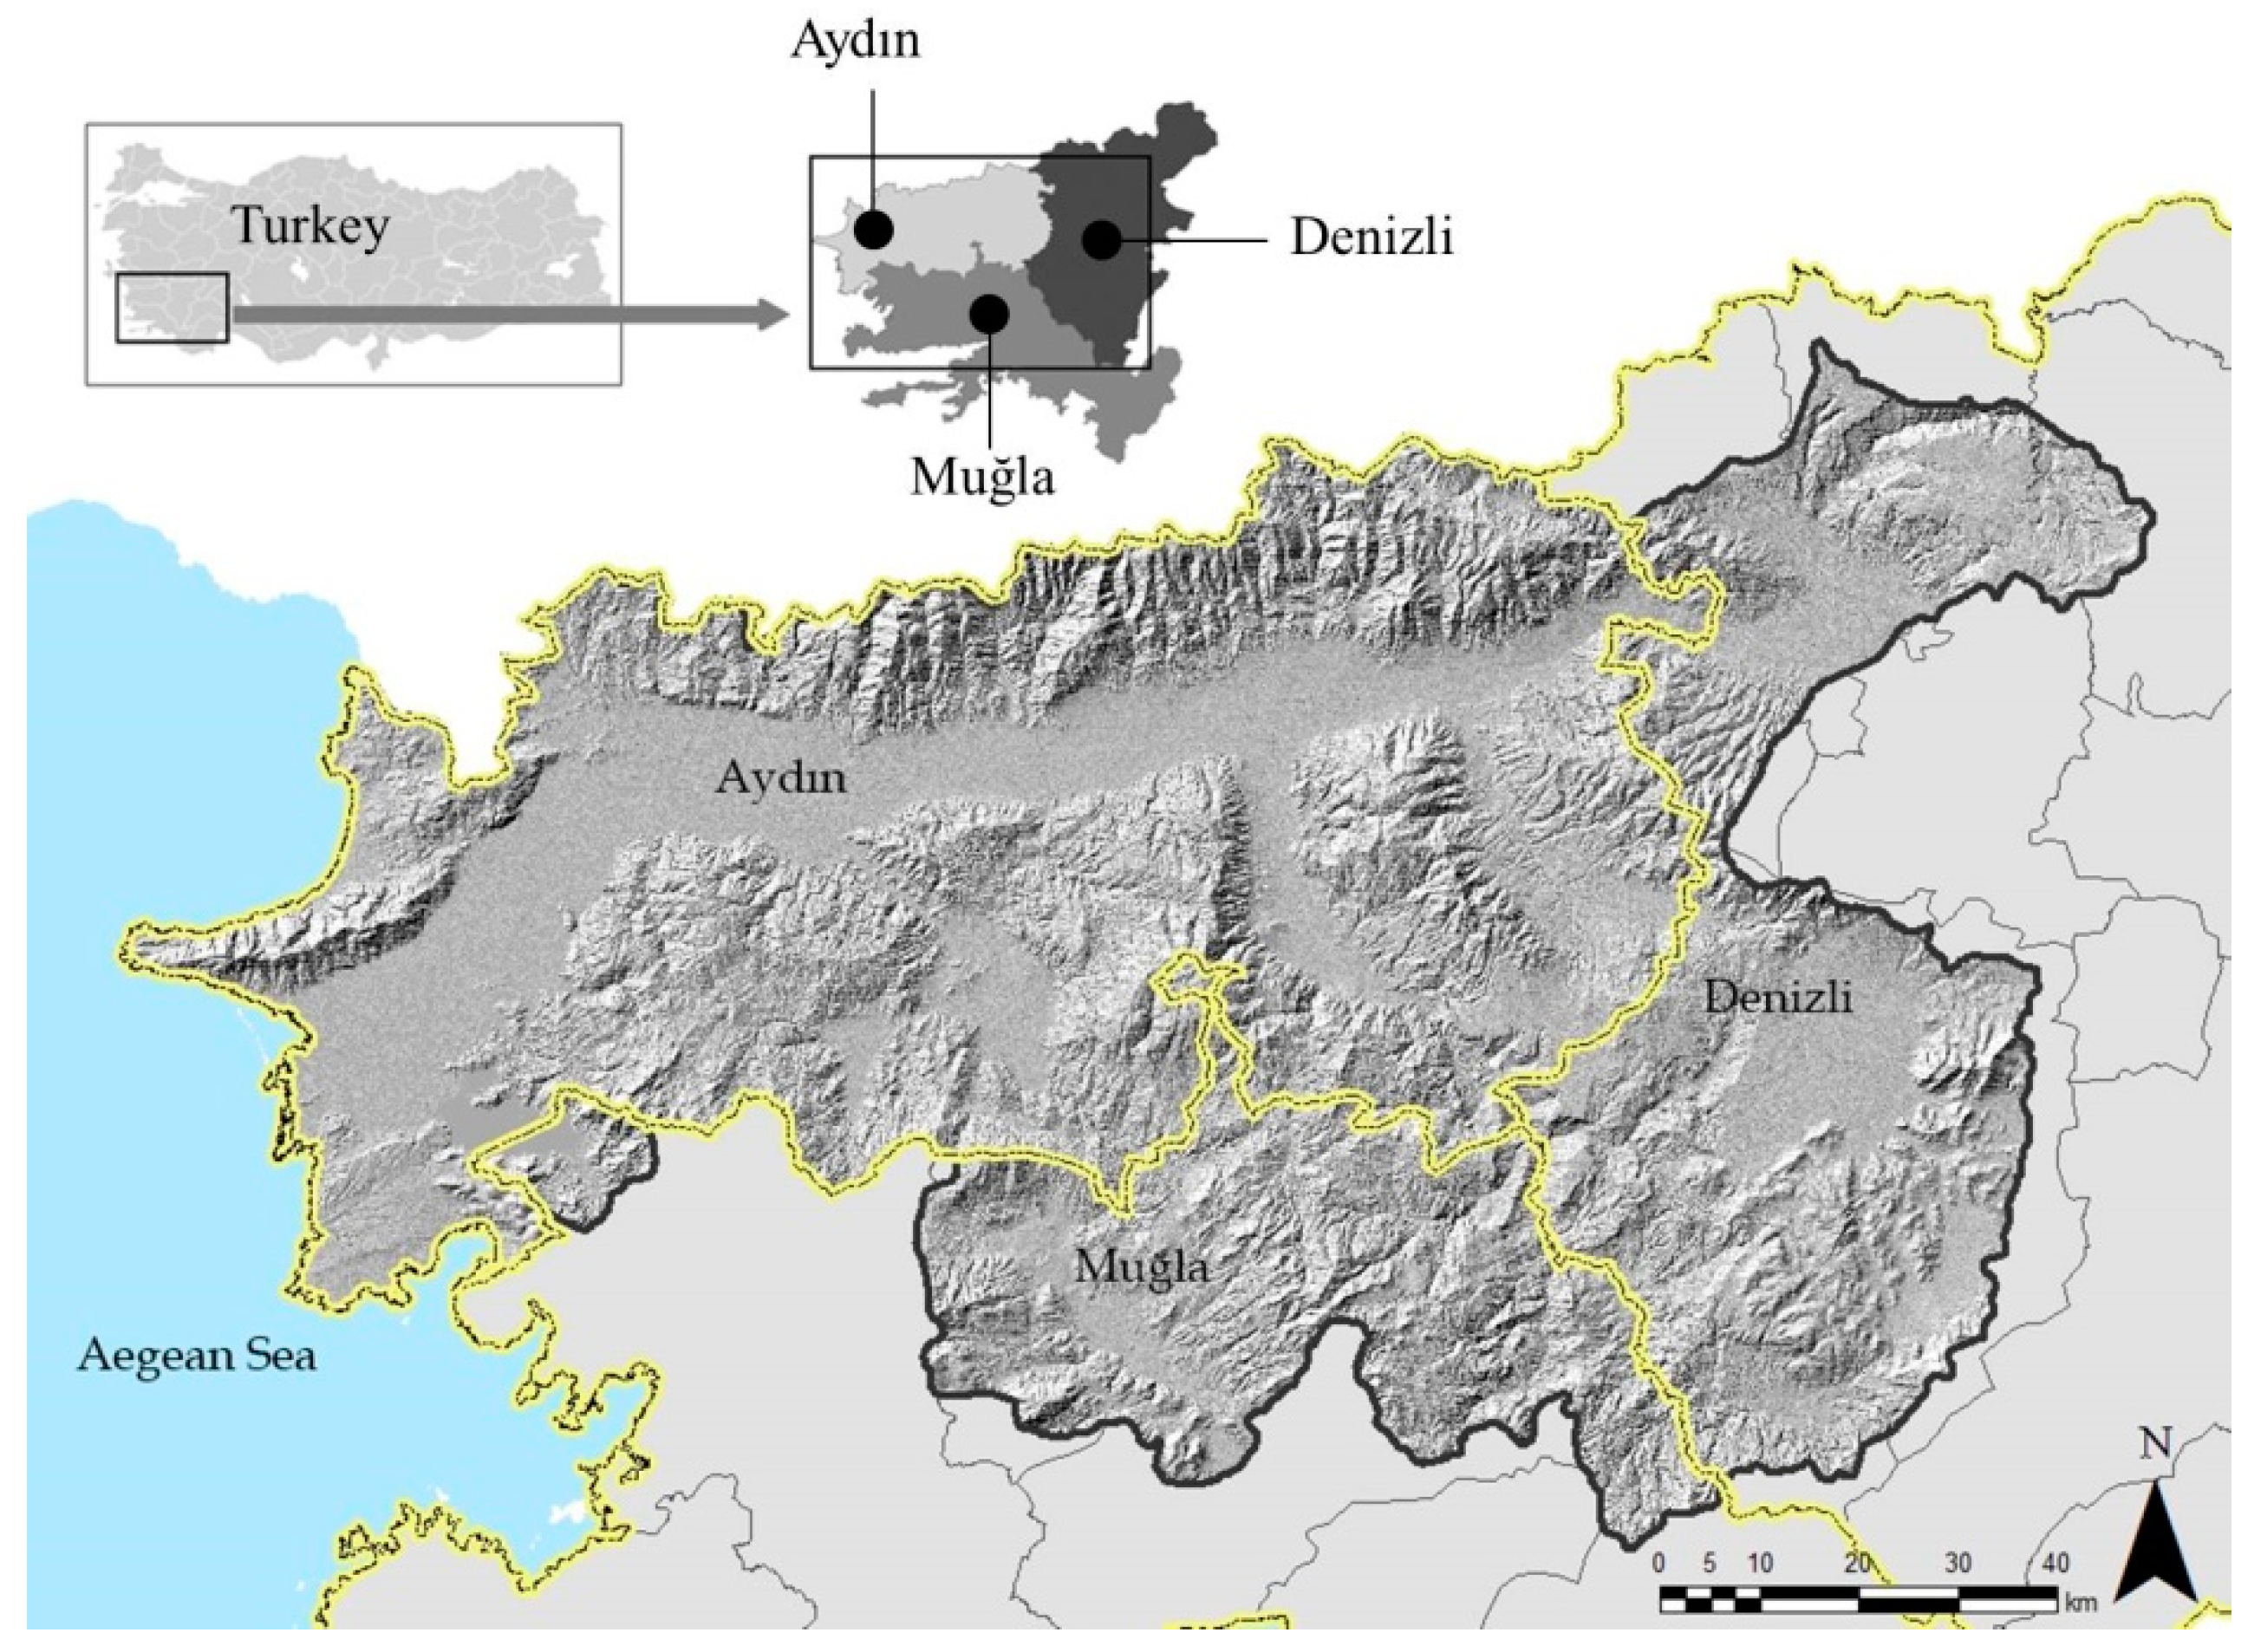
The study area is the lower Büyük Menderes River Basin located in the Aegean Region, bordered by the Aegean Sea in the western part of Turkey, which gives the region its name. The semi-natural and urban landscapes within the boundaries of Aydın Province and the lower catchment of the Büyük Menderes River comprise the material of this study, located 37°50′–37°44′ north and 27°50′–29°17′ east (Figure 1), covering approximately 1,368,200 hectares.
The study area, which was called Caria in ancient times, represents diverse land use types, dominated by agricultural fields on fertile soils of the Büyük Menderes plain, where forests play an important role in social forestry at present. The area incorporates rural settlements, urban settlements, tourist destinations along the coast, the Dilek Peninsula National Park in the Kuşadası district of Aydın Province, and Lake Bafa Nature Park within the boundaries of the Milas district of Muğla Province as nature conservation areas, forests, and the lower catchment of the Büyük Menderes River. In contrast to these land uses, this area is valuable in terms of landscape types and landscape diversity. Due to industrial, agricultural, and domestic waste discharges, the water quality of the Büyük Menderes River and its effluent is generally rather low due to pollution, which poses an important threat to the ecosystem of the delta [33,34].
The materials of this study were obtained from the Geographic Information Centre of Aydın Metropolitan Municipality. The main materials used were an existing land cover map based on an IKONOS satellite image (0.5 × 0.5 m resolution), a digital forest stand map, and a digital elevation model (DEM) derived from the NASA Earthdata website. For mapping bioclimatic belts, DEM and related literature were combined by using ArcMap 10.7.
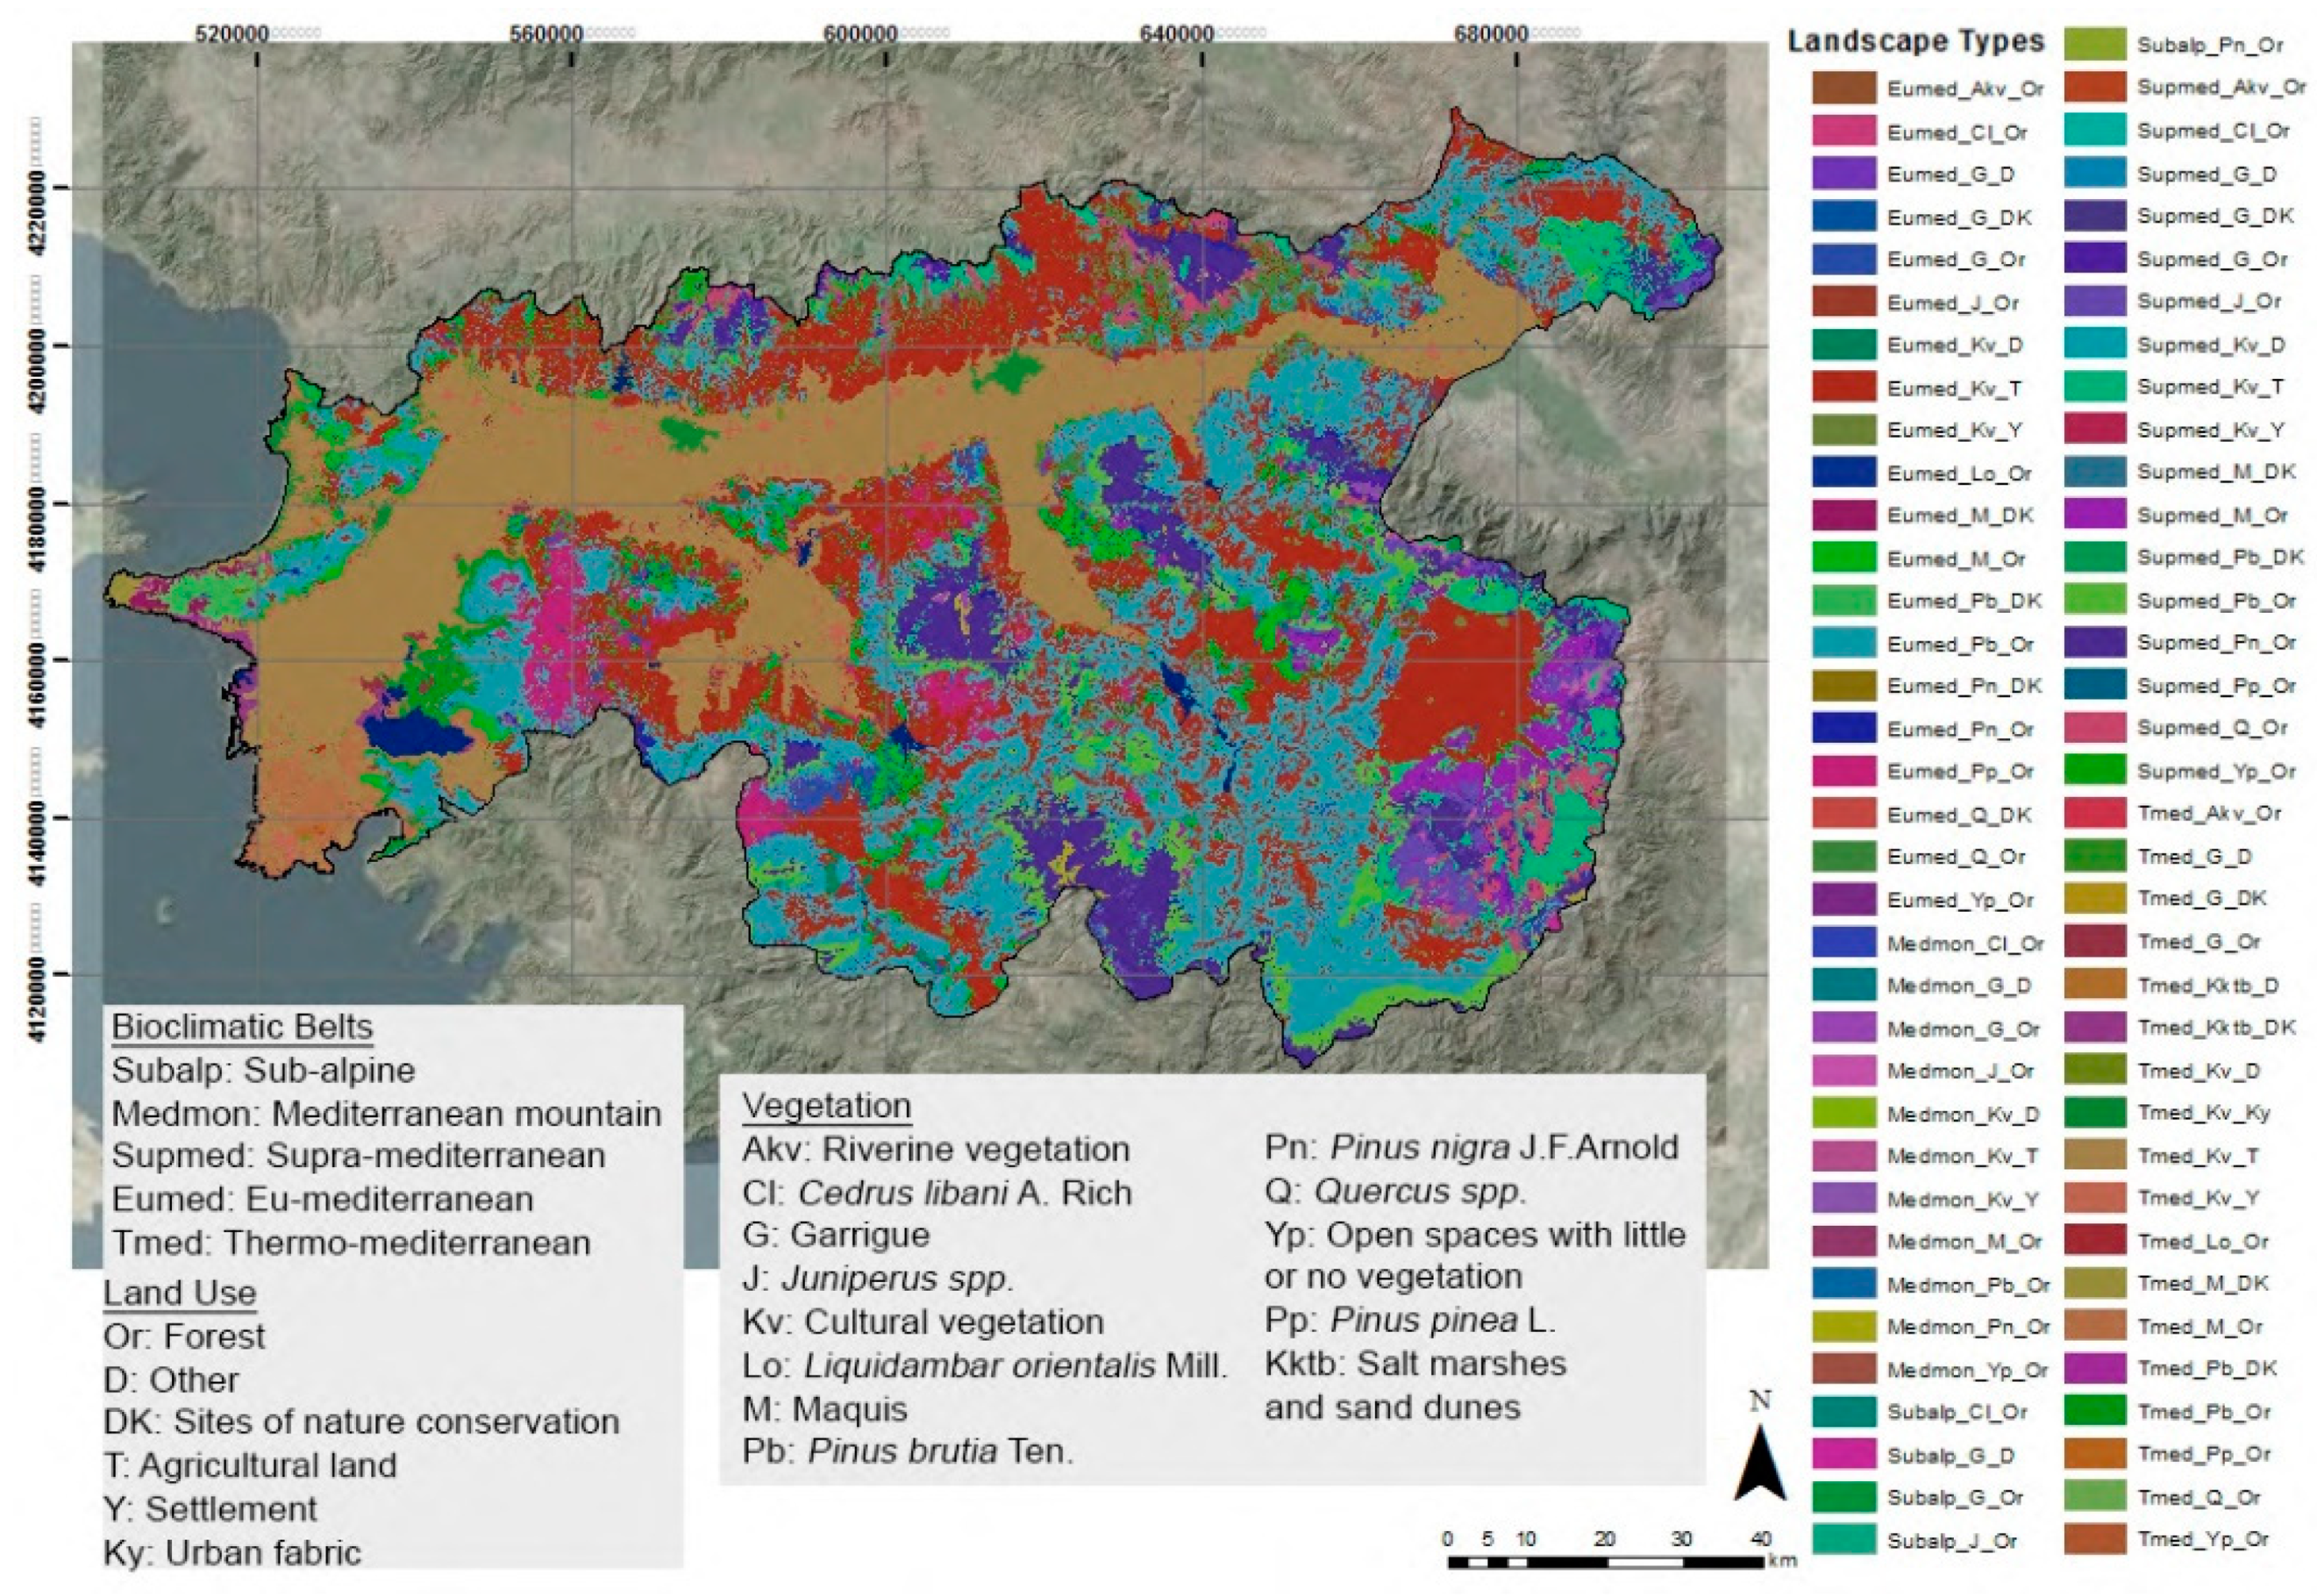
The methodology consisted of three steps: (1) classification of landscape types by employing landscape character analysis (LCA); (2) assessing landscape types according to the three criteria of landscape diversity, connectivity, and rareness; and (3) determining LP for mapping GI (Figure 2). First, the related literature was reviewed, and the inventory of the study area was obtained from the Municipality of Metropolitan City of Aydın. Second, three thematic maps (i.e., bioclimatic belts, vegetation cover, and land use) were produced to be processed in the LCA. The DEM of the study area and the bioclimatic classification system were the main datasets for mapping the bioclimatic belts [35]. Vegetation formations for indicator species according to bioclimatic belts were taken into consideration [35,36,37,38]. In the study area, where a Mediterranean-type climate prevails, five bioclimatic belts were classified: sub-alpine (Subalp), Mediterranean mountain (Medmon), supra-Mediterranean (Supmed), Eu-Mediterranean (Eumed), and thermo-Mediterranean (Tmed). The classification of the forest map showing the spatial distribution of stands and the indicator species of plant formations spreading in western Anatolia was used to map vegetation [35,36,37,38]. According to this map, eight vegetation types were determined: riverine vegetation, open spaces with little or no vegetation, sand dunes and salt marshes, cultural vegetation, maquis, garrigue, and forest and woodland vegetation types dominated by Juniperus spp., Pinus brutia Ten., Pinus pinea L., Pinus nigra J.F. Arnold, Quercus spp., Cedrus libani A. Rich., and Liquidamber orientalis Mill. Other deciduous tree species that occurred in the cultural lands and open spaces with little or no vegetation were Juglans regia L., Castanea sativa Mill., Prunus dulcis Mill., Platanus orientalis Linn., Alnus orientalis Decne., Robinia pseudoacacia L., Populus spp., and Eucalyptus camaldulensis Dehnh.
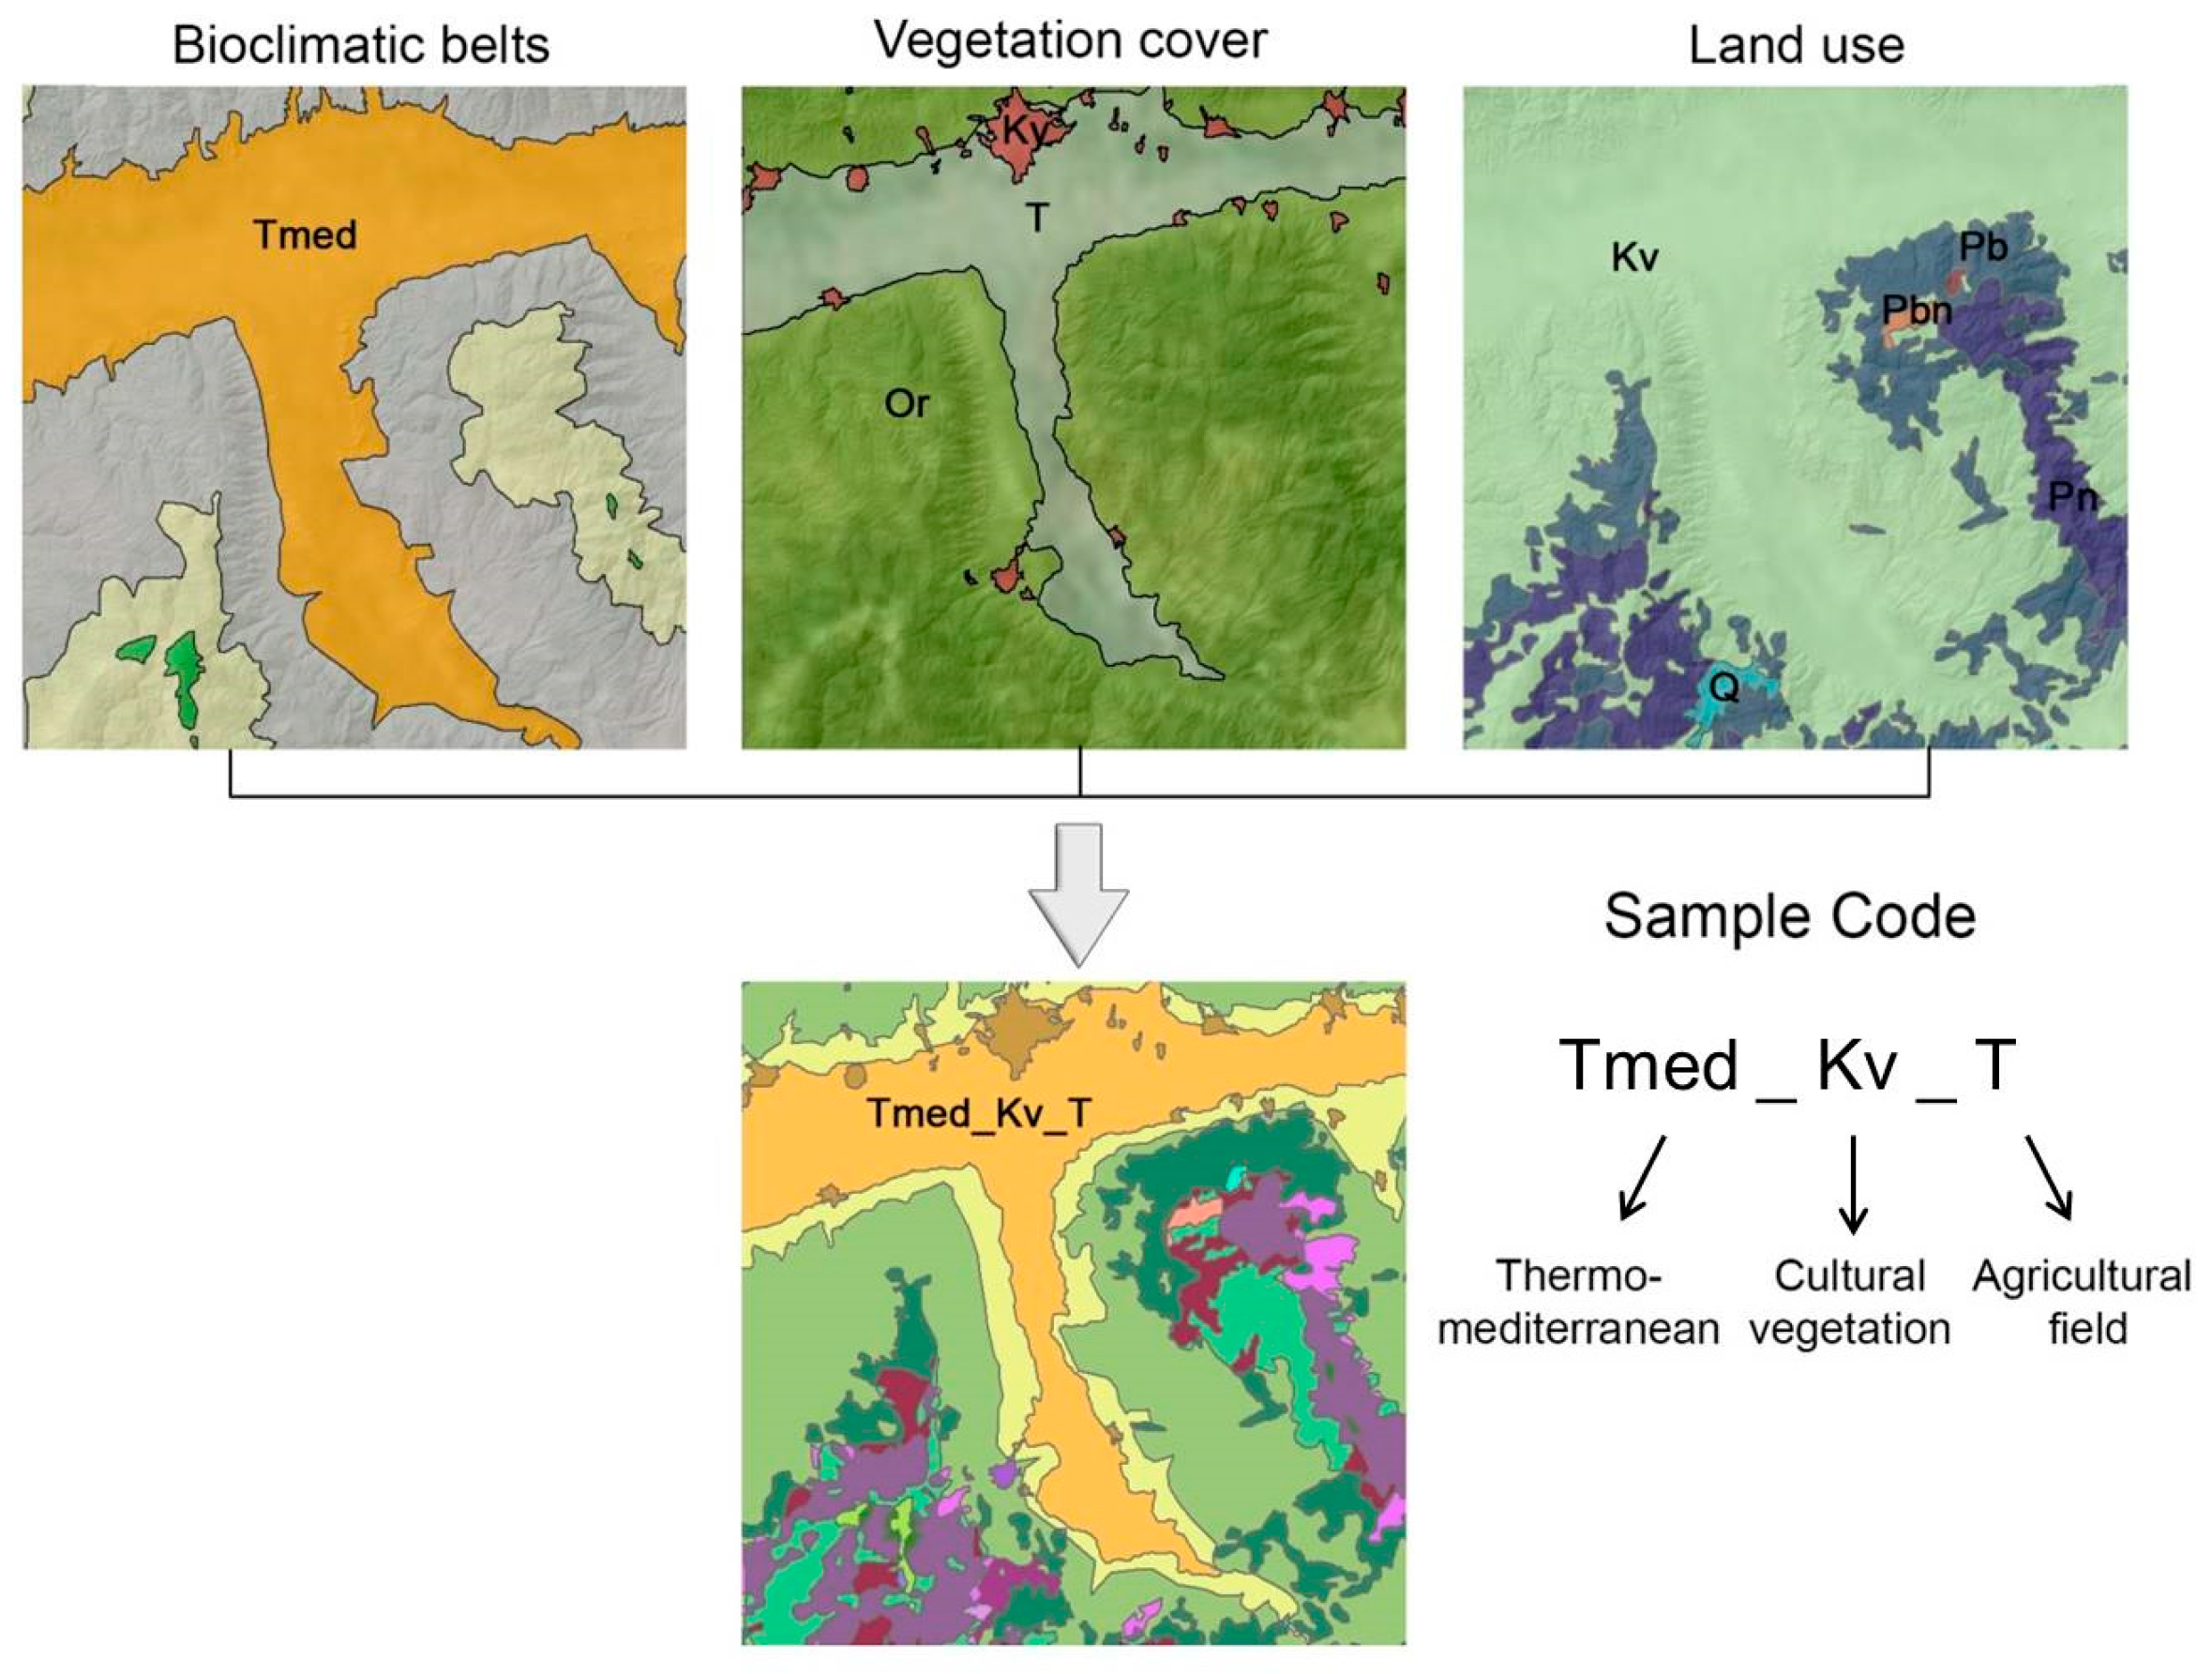
In order to create the GI plan, three thematic maps produced in the first step of the study were overlaid and the landscape types of the study area were mapped. The landscape grid cells that might offer a variety of functions were identified, and their connections in a network were evaluated. Each landscape unit was allocated a code that was representative of the abbreviations of the bioclimate belts, vegetation cover, and land use, respectively. The configuration of a sample code is illustrated in Figure 3.
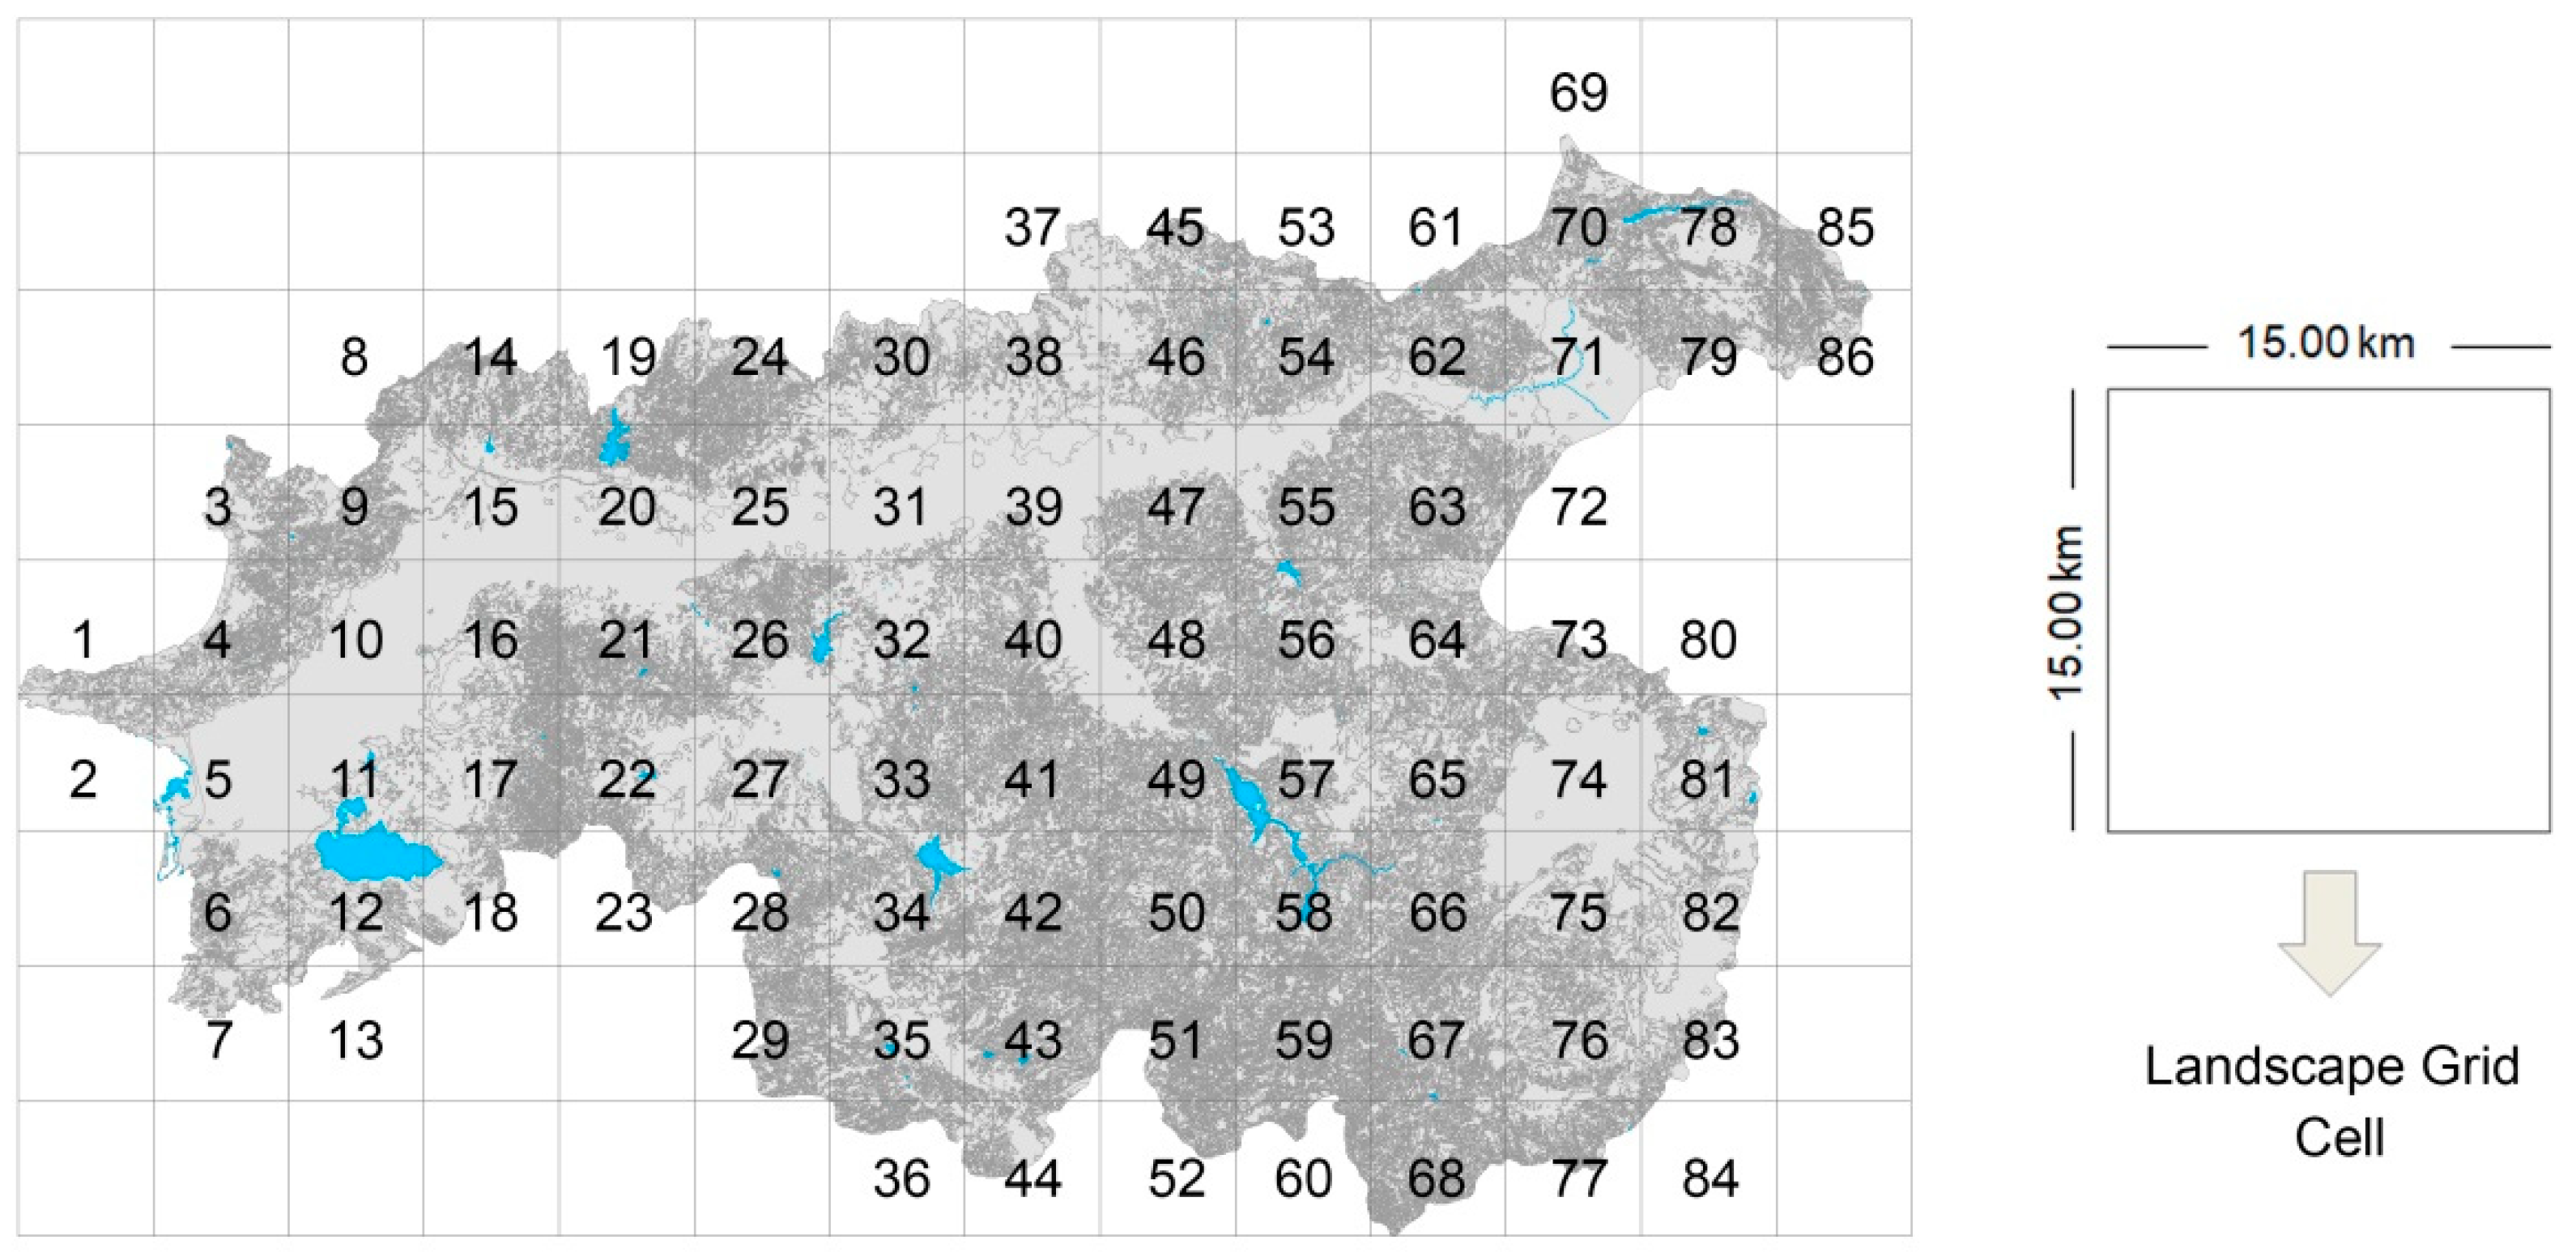
For assessing landscape types, three criteria were determined, namely landscape diversity, connectivity, and rareness. Naturalness was used as a sub-criterion of rareness. The reason for choosing these three criteria was to assess landscape types cost-effectively, efficiently, and quickly due to the fact that the study area covers more than 13.000 km2. Two different scales were used to evaluate landscape typology: a fine scale for assessing landscape types and a coarse scale for assessing landscape grid cells. At the fine scale, the ratio of the area size to the total size (percentage of dominance), the frequency, and the total (minimum and maximum) field sizes of the landscape types were calculated. At the coarse scale, the determined criteria were investigated for each grid cell. The study area was divided into 15 × 15 km squares and each square was referred to as a landscape grid cell (Figure 4).
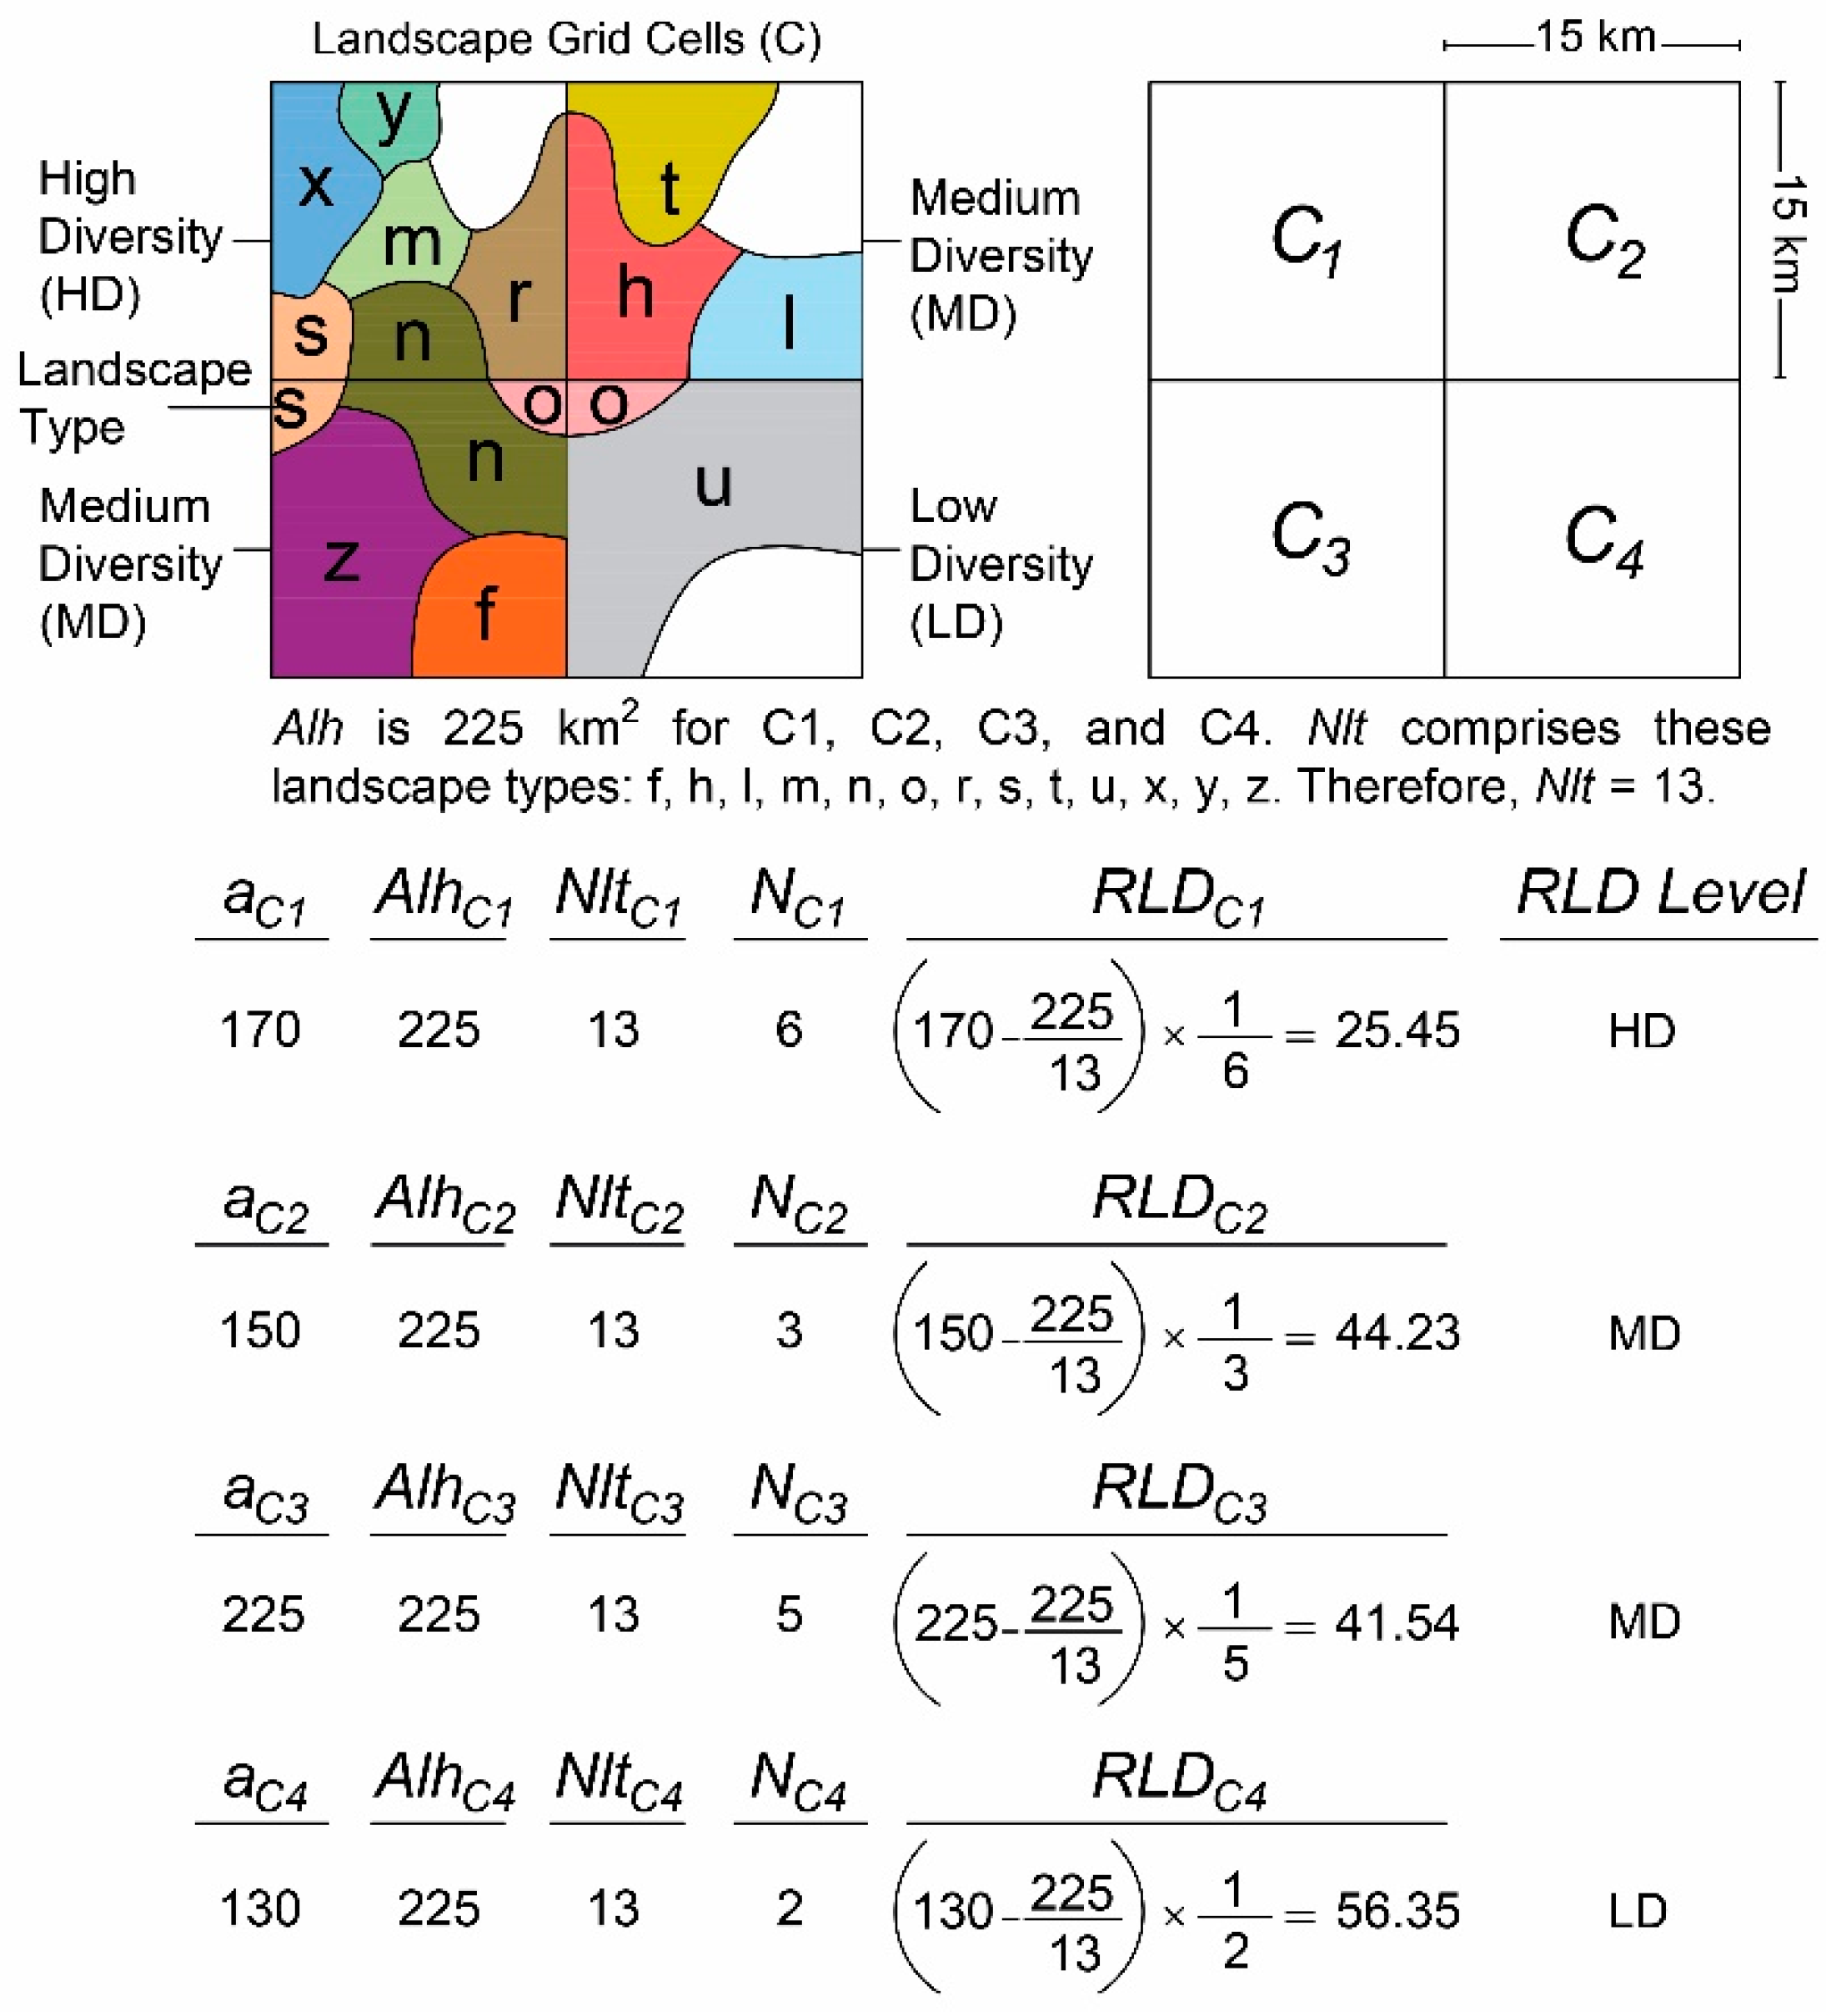
To decide the size of a landscape grid cell, the landscape diversity of the total area was taken into consideration by applying a trial-and-error approach. The number of landscape types in each landscape grid cell was calculated. In order to determine the diversity of the landscape grid cells, the relative landscape diversity (RLD) formula was used. RLD was employed to rank the landscape units according to their performance in representing the entire typology of a landscape complex. RLD describes the relationship between the presence of landscape types and the representative landscape patches of those types, in a particular area (e.g., a micro-basin or a sub-basin). RLD takes into account both the number and the total area of landscape patches of each landscape type. The relative landscape diversity value of a particular area reflects a rate of occurrence of the entire landscape typology, detected in a larger area (e.g., a basin) while the concept of evenness is concerned. It is a useful means of comparing neighboring landscape units that form a landscape complex, in terms of landscape diversity. In this study, a grid cell size of 15 × 15 km was assumed as a landscape unit, according to the following equation:
where is the area of all landscape types located in a grid cell, is the total area of a landscape grid cell, is the total number of landscape types detected in the entire landscape complex (in other words, the sum of the numbers of unique landscape types occurring in each landscape grid cell), and is the total number of landscape types in a landscape grid cell. Alh/Nlt refers to the mean area of all landscape types when their even distribution in a landscape grid cell is expected. Therefore, a − (Alh/Nlt) provides the difference between this theoretical value and the observed value of the area of any landscape type located in a landscape grid cell. So, the bigger the difference, the smaller the evenness. This tendency lowers the landscape diversity value of a landscape grid cell. If the result of the subtraction is zero, then the diversity value is the highest. Figure 5 shows how to calculate the RLD for four sample grid cells.
The landscape grid cells were evaluated in terms of the relative landscape diversity, and thus divided into four groups: very high, high, medium, and low. In order to determine the level of rarity of a landscape grid cell, both the field size and the frequency of the landscape types in the grid were used. Factor analysis was performed in SPSS 24 to determine the level of rarity of the landscape types with low size and low incidence. With the factor analysis, the eigenvalue of each type was calculated according to the field size and the number of types. In the next stage, the rank case tool of SPSS was used to order the eigenvalues, and thus the level of rarity was classified into one of four groups (i.e., high, medium, low, or none). The classification of rare types in the landscape grid cells in terms of naturalness was important in order to reveal their protection values. The naturalness evaluation of rare landscape types in the landscape grid cells was determined by the proportional (%) value of the natural types. Another criterion was the connectivity between the landscape grid cells, and similarity analysis was conducted to determine this spatial connectivity. The common landscape types that provide transition between grids were examined, and those landscape types that provided a high level of similarity with the landscape diversity and the criterion of rarity were mapped. The relationship between the number of landscape units and the logarithmic values of the total area amount covered by landscape types (ha) was tested by the correlation analysis performed in SPSS.
For assessing landscape types, three criteria were determined, namely the level of connectivity (criterion 1), landscape diversity, and rareness (criterion 2 and criterion 3) (Table 1). When any landscape grid cell is labeled with high scores according to all criteria, then its landscape potential was evaluated as “1” (very high potential) and the case of low scores was evaluated as “5” (low potential). Thus, “2”, “3”, and “4” score labels were given to the cases of high-moderate, high-low, and moderate-low, respectively.
3. Results and Discussion
In this study, a total of 71 landscape types were identified by applying LCA (Figure 6). It was shown that the spatial distribution of the landscape types varied marginally. Eumed_Pb_Or (Pinus brutia L. forest in the Eu-Mediterranean climatic zone) represented the largest area of 71 types and had the highest value in terms of its frequency.
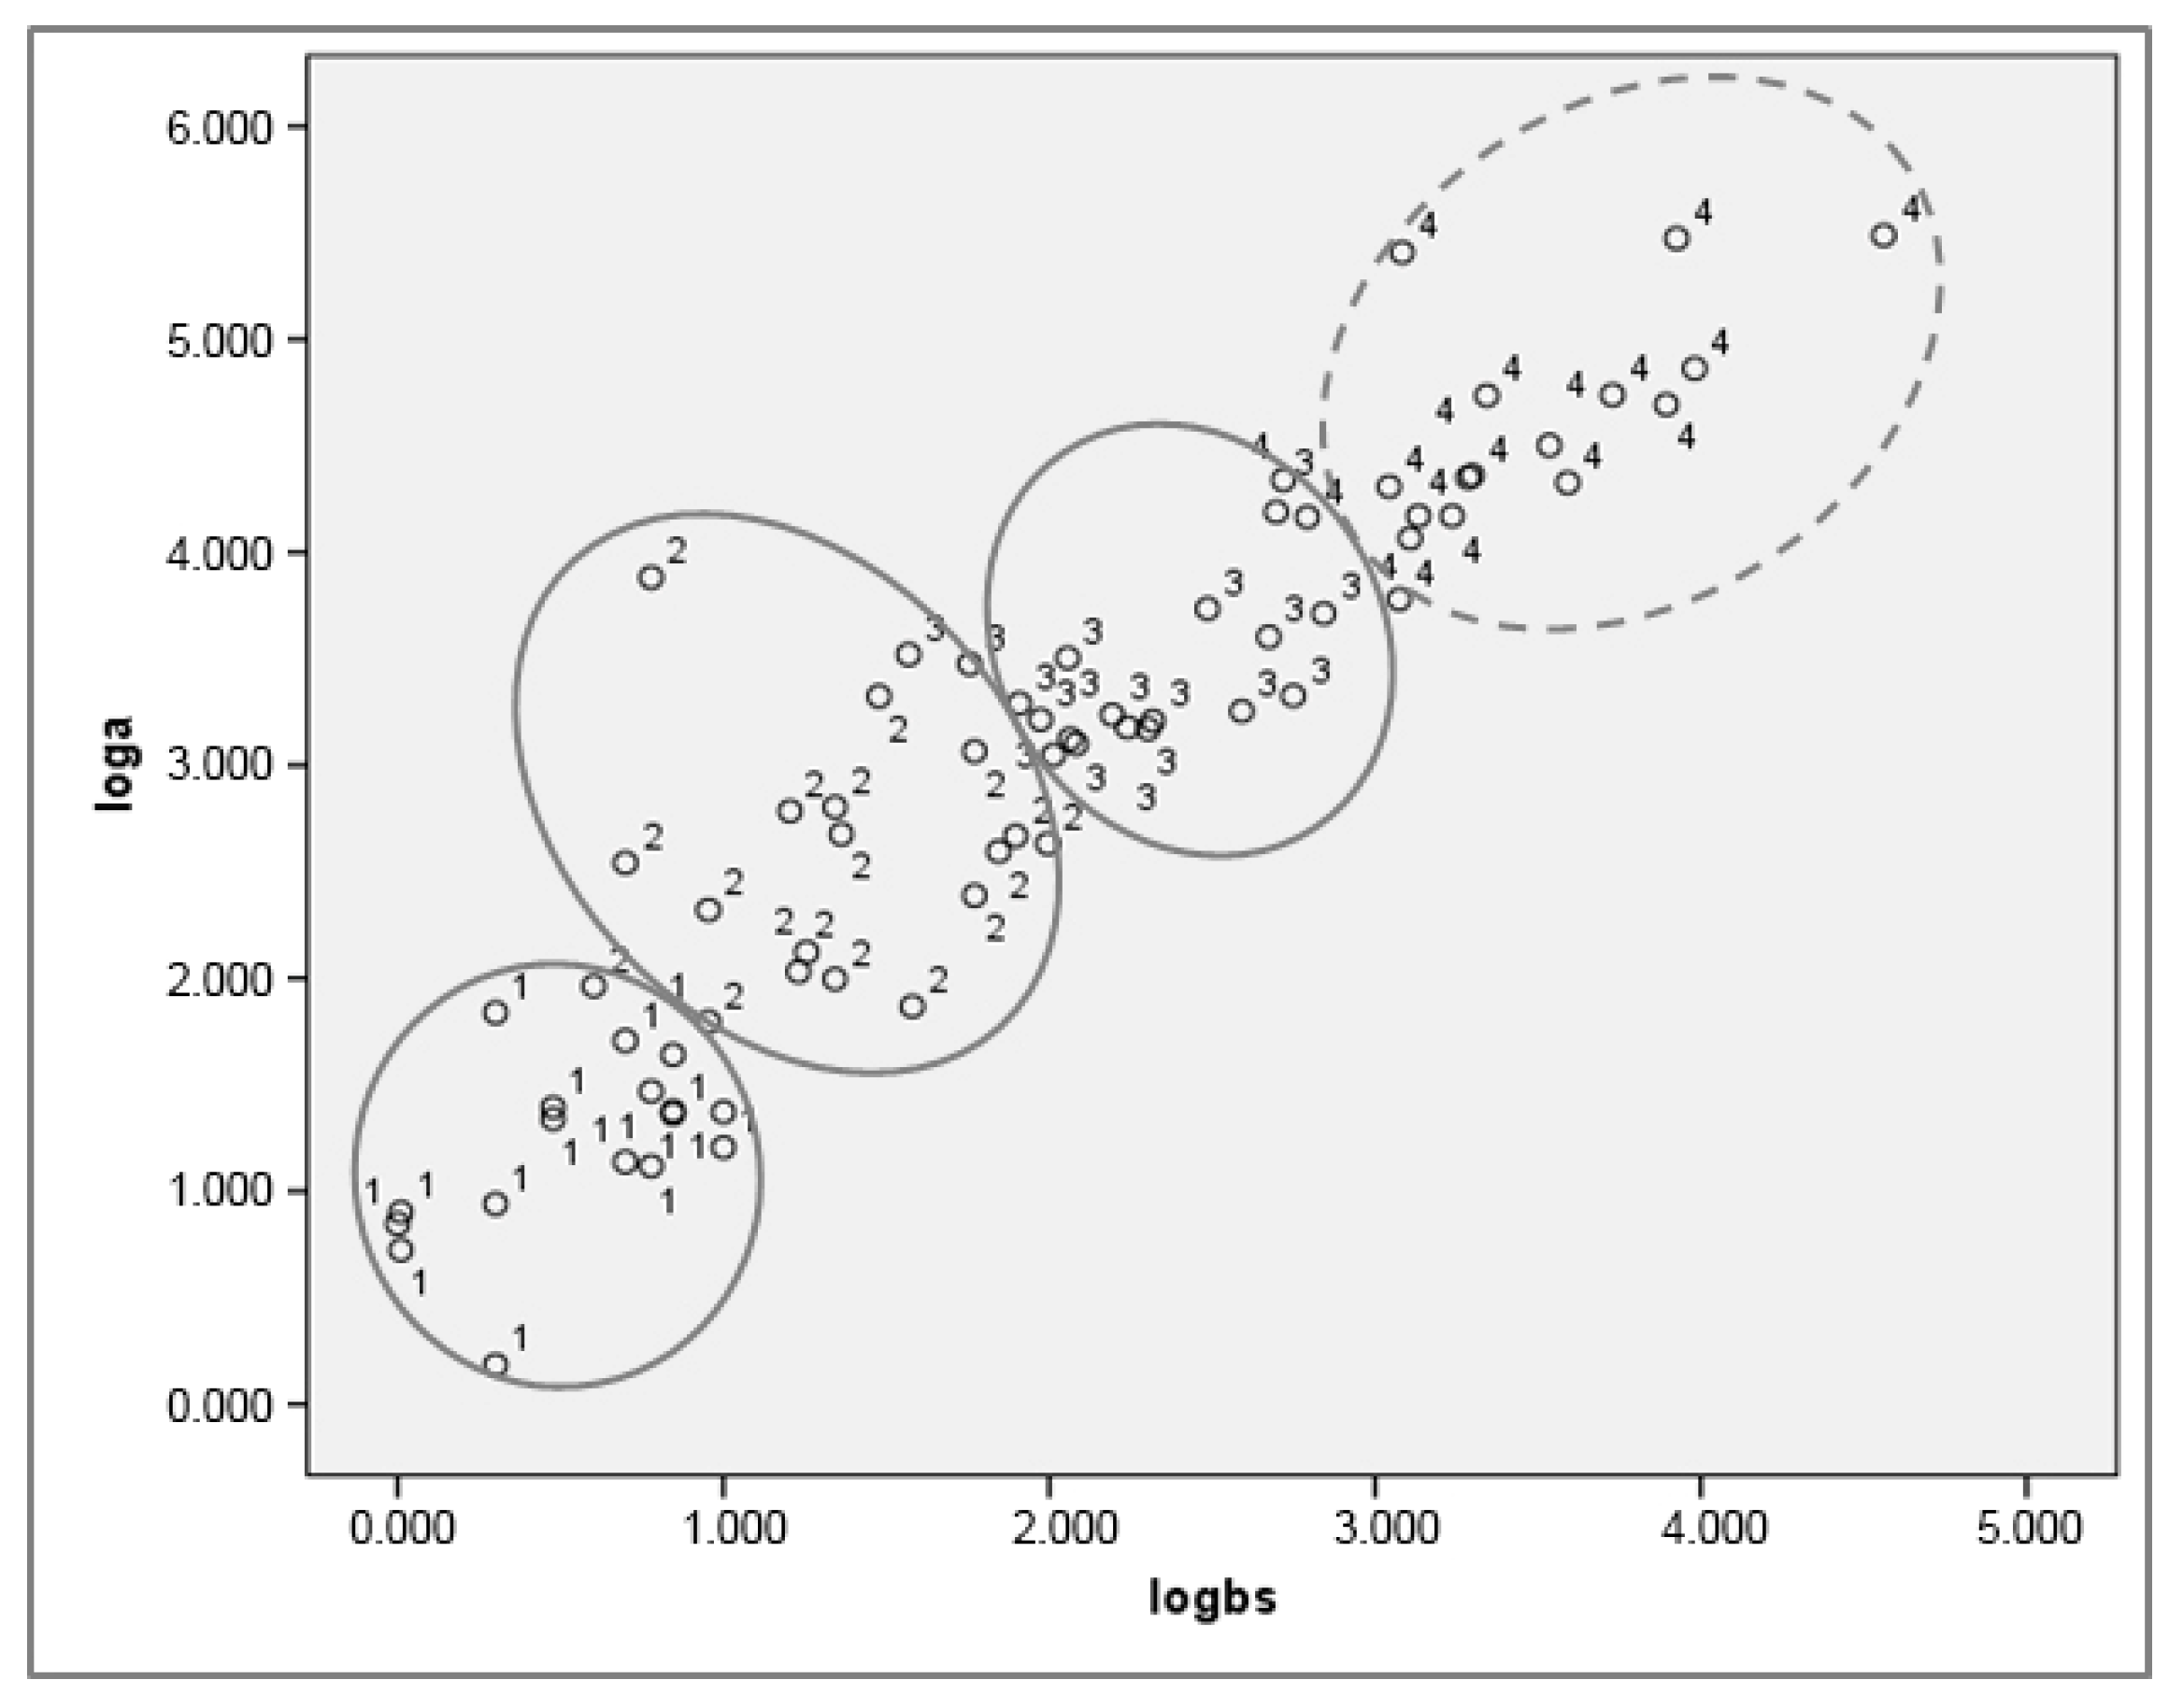
According to the Pearson correlation, the relation between the number of landscape units and the logarithmic values of the total area amount covered by landscape types (ha) was high (R2 = 0.923, Figure 6). The landscape types marked in the fourth group in Figure 6 were excluded from the analysis. According to this evaluation, a total of 17 types had high, 18 had moderate, and 18 had low levels of rarity. To evaluate the naturalness, the land uses were taken into consideration and it was determined that 27 out of the 35 rare types were natural and 8 were cultural. Thus, mapping of GI, which represented and protected the LP in the planning area, was completed. Following this, the spatial distribution of the priority areas—in other words, the LP—was mapped and grouped into low (1), medium (2), high (3), and very high (4) (Figure 7).
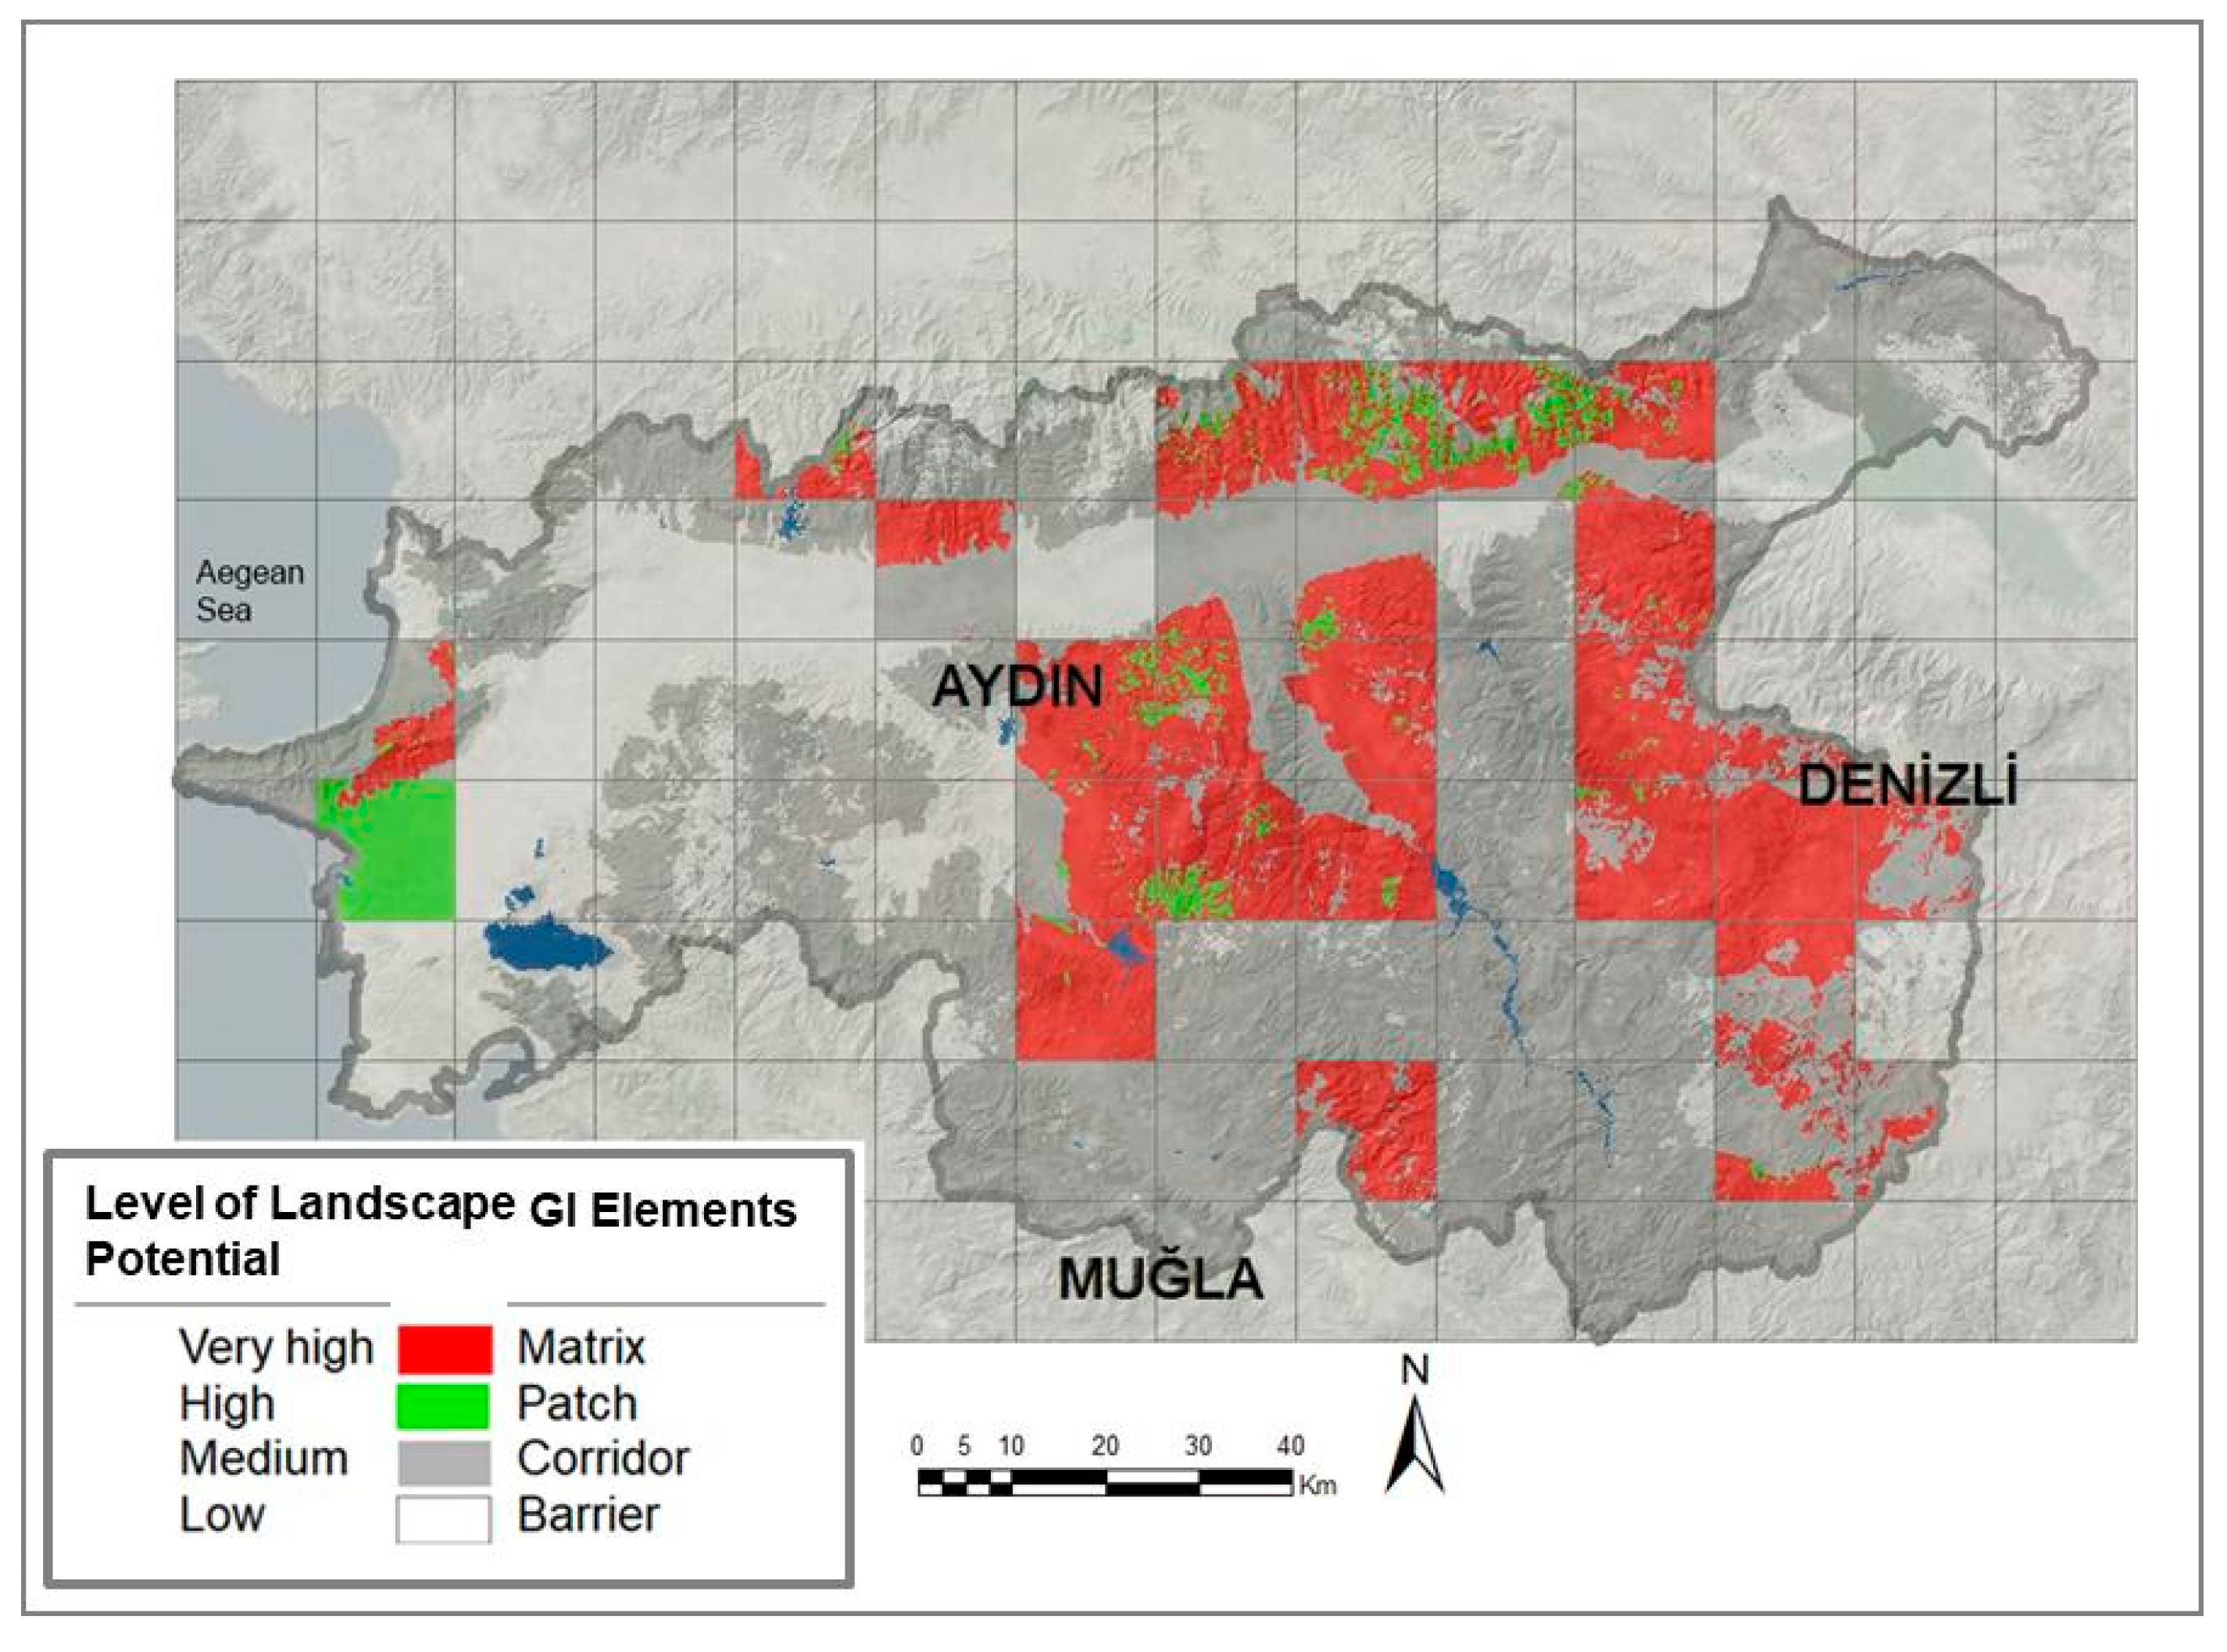
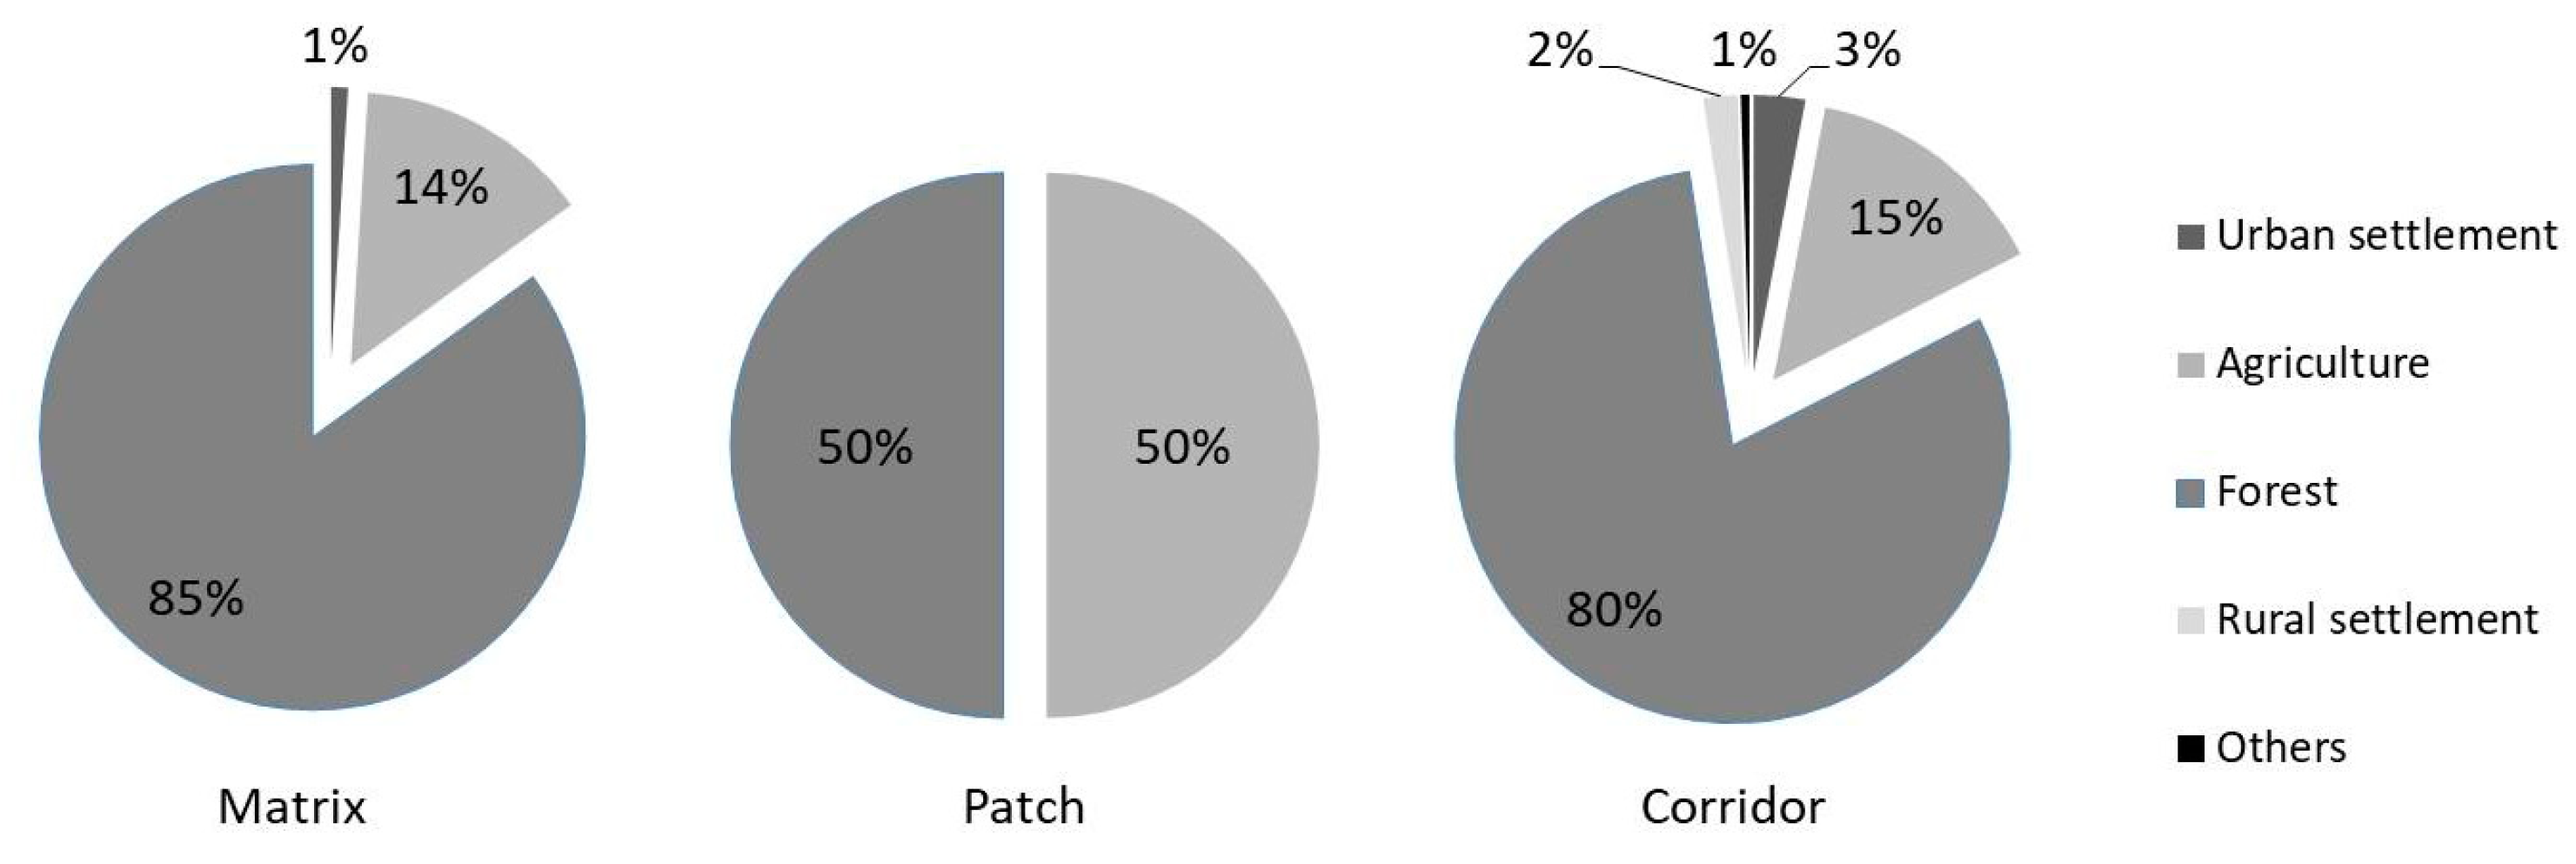
As seen in Figure 8, a map for the spatial distribution of the level of LP was produced and interpreted for the creation of the GI map. For the interpretation, the GIS-based ecological connectivity assessment by Chang et al. [39] and the patch–corridor–matrix model based on the ecological connectivity pattern developed by Marulli and Mallarach [40] were taken as references. Thus, the level of LP was integrated with the GI elements. As shown in Figure 8.85% of the matrix consisted of GI elements that were valuable in terms of preserving the LP: 50% of the patch and 80% of the corridor consisted of forest, respectively.
The RLD formula differs from other spatial metrics referred to in this study, in that it takes into account the proportional level of the components that consider the whole area representing all landscape types (such as the lower basin). In short, it reveals which sub-unit has the highest number of landscape types according to the evenness rule in the study area.
In this study, the LP was grouped into three grids, namely grid 1, grid 2, and grid 3, and the modelled corridors were defined. When the LP was determined, the highest quality grids were considered as the matrix and the high-quality grids were accepted as the patches. A medium level of LP was regarded as a corridor, while a low level was considered as a barrier. In order to make an objective evaluation, equal-sized landscape grid cells (15 × 15 km) were selected. For determining the size and natural boundary of the grids, new algorithms need to be determined in further studies. As a result of this study, it was observed that the landscape grid cells with the highest potential (matrix) in terms of landscape protection included 68 out of the 71 landscape types in the whole of the planning area. This result proves that 95.7% of the landscape typology was represented. We believe that the determination of this ratio contributes to discovering the protection value, in order to ensure the sustainable management of the LP in coarse-scale studies within the process of GI planning. It is interesting that the landscape grid cells that included Lake Bafa Nature Park were found to have a low level of LP. The reason for this is that the area covered by the lake surface is disproportionately large compared to the areas of the other landscape types in the cluster.
Three thematic maps were created according to the following criteria: diversity, connectivity, and rareness, at the scale of landscape grids. These maps were overlaid to determine the landscape potential. The concept of landscape potential was defined by Haase [41] as natural space with properties of its substances, latent energies, and processes, i.e., with a structure and dynamics of its own, that have the capacity to satisfy community needs. Furthermore, landscape potential refers a sum of all landscape properties that create essentials for the economic assessment of landscape with its energy and materials forming the structure [42]. Landscape potential is handled as an important indicator and its determination is a base for landscape planning in some countries, particularly in Germany, where all considerations on the ecological optimization of land use and resources depend on the landscape potential [14,42]. Since diverse, rare, and spatially continuous landscapes are considered as the main component of the natural and economic capital for sustaining the environment and improving the quality of human life, landscape potential was employed for mapping GI in the study site. Thus, a comparative evaluation on ecological importance and the level of priority for conservation of any landscape grid is presented in Figure 9.
Considering the city center of Aydın, access to GI was found at a distance of 2.5 km. In this context, the spatial distribution of the GI elements revealed the existence of an important potential for the planning of urban green spaces that could provide integrity and continuity between green spaces in Aydin and its surrounding and rural landscape units. Additionally, it was observed that the matrix with the highest LP consisted mainly of forest cover. Consequently, the importance of a forest map that shows the spatial distribution of stands in the planning of GI was proved.
We found that for evaluating the value and the potential of landscapes from a natural and cultural perspective, the “diversity of landscape” was a functional criterion. The “relative landscape diversity” formula developed and used in this study gives the highest (ideal) value in cases where the total areas belonging to the landscape types in the cluster are equal. As shown in this example, the scale of the landscape set covered in the dimensions of 15 × 15 km included the entire lake area, reducing the importance of the relatively narrow landscape types outside of the lake area in the evaluation. It is clear that if the grid cell size was to be downscaled to 5 × 5 km, the clusters would be smaller in areas, and therefore they would have a higher “landscape diversity” value. As can be seen from this interpretation, the database scale used in the analysis of landscapes may increase the sensitivity of the assessment of the LP. In this study, the methodological approach based on landscape diversity was followed, and whether or not landscape types have an existing conservation status was not evaluated as a criterion. In addition to the basic components and criteria that form the landscape pattern discussed in this study, taking into account criteria such as “current conservation status of landscape types” could also lead to the emergence of legislation in the implementation of an open/green space system in the context of GI.
4. Conclusions
In this paper, a methodological approach based on landscape diversity was presented, and landscape types were evaluated regardless of their existing protection status. Taking into consideration the current protection status of landscape types may also highlight the legislation in force, which is applicable to the construction of the green space system in the context of GI. While nature conservation focuses on biodiversity and species richness, the approach to assess landscape diversity should have a place in green infrastructure planning. The authors believe that the diversity of the landscape and its value incorporate not only natural landscapes, but also cultural and semi-natural landscapes. In addition to the criteria (e.g., naturalness, connectivity, rareness, etc.) used to determine protection zones in the landscape, the RLD aims to add value to landscape ecology studies particularly in decision-making processes. The use of the index presented in this study can be integrated into conservation planning and, therefore, RLD can be a part of planning processes. The principal limitation of this study is the scale that was applied due to the ecological boundary of the basin. Therefore, the RLD formula needs to be tested at different scales with different grid cell sizes.
The ranking of GI elements in terms of conservation was achieved by transferring the LP that emerged as a result of the multi-criteria analysis in the whole of the study area. The GI map that represents and protects the LP in the entire planning area constitutes the basis of the open/green space system plan. In the context of this study, carried out in the case of the lower Büyük Menderes River Basin, the findings of rare landscape types that show a high level of landscape diversity (the ratio of landscape types in the unit area) and that are valuable in terms of protection contributed to the map of GI. In addition, the determination and mapping of the landscape clusters of relevance for the green infrastructure to be spread across the planning area played an important role in the creation of the GI map.
In order to achieve conservation/development goals in the context of the environment, nature, ecosystem, and landscape, the process and tools for defining the green space elements comprising GI as a whole in rural–urban areas, determining the functions of and organizing the spatial organization, and the distribution of the “plan” scale should be defined. This study may be referenced for further studies regarding the planning of green spaces at different scales in the context of GI and LP.
Author Contributions
Conceptualization, K.T.Y. and D.G.; methodology, K.T.Y. and D.G.; software, D.G.; analysis, D.G.; investigation, D.G.; resources, D.G.; data curation, D.G.; writing—original draft preparation, D.G.; writing—review and editing K.T.Y. and D.G.; visualization, D.G.; supervision, K.T.Y.; project administration, D.G.; funding acquisition, D.G. All authors have read and agreed to the published version of the manuscript.
Funding
The authors are indebted to the Scientific and Technological Research Council of Turkey for their financial support under the 2211-A program.
Acknowledgments
This paper is based on the doctoral research of the first author. The Directorate for Development and Urban Planning of Aydın Municipality and all those having provided data for this study are also thanked. Special thanks to Dr. Cecil C. Konijnendijk van den Bosch for revising this paper and sharing his valuable comments. We would like to thank the anonymous reviewers for their constructive comments and suggestions.
Conflicts of Interest
The authors declare no conflicts of interest.
References
- Sandström, U.G. Green infrastructure planning in urban Sweden. Plan. Pract. Res. 2002, 17, 373–385. [Google Scholar] [CrossRef]
- Firehock, K. Strategic Green Infrastructure Planning: A Multi-Scale Approach; Island Press: Washington, DC, USA, 2015. [Google Scholar]
- Mell, I.C. Green Infrastructure: Concepts, Perceptions and Its Use in Spatial Planning; Newcastle University: Newcastle, UK, 2010. [Google Scholar]
- Benedict, M.A.; McMahon, E.T. Green Infrastructure: Linking Landscapes and Communities; Island Press: Washington, DC, USA, 2012. [Google Scholar]
- European Commission. Communication from the Commission to the European Parliament, the Council, the European Economic and Social Committee and the Committee of the Regions. Green Infrastructure (GI)—Enhancing Europe’s Natural Capital; Commission for the Environment, Climate Change and Energy: Brussels, Belgium, 2013. [Google Scholar]
- Kaplan, A. “Green Infrastructure” Concept as an Effective Medium to Manipulating Sustainable Urban Development. In Green and Ecological Technologies for Urban Planning: Creating Smart Cities; IGI Global: Hershey, PA, USA, 2012; pp. 234–254. [Google Scholar]
- Pauleit, S.; Liu, L.; Ahern, J.; Kazmierczak, A. Multifunctional Green Infrastructure Planning to Promote Ecological Services in the City; Oxford University Press: Oxford, UK, 2011. [Google Scholar]
- Herzog, C.P. A multifunctional green infrastructure design to protect and improve native biodiversity in Rio de Janeiro. Landsc. Ecol. Eng. 2016, 12, 141–150. [Google Scholar] [CrossRef]
- Lanzas, M.; Hermoso, V.; de-Miguel, S.; Bota, G.; Brotons, L. Designing a network of green infrastructure to enhance the conservation value of protected areas and maintain ecosystem services. Sci. Total Environ. 2019, 651, 541–550. [Google Scholar] [CrossRef] [PubMed]
- Ahern, J.; Cilliers, S.; Niemelä, J. The concept of ecosystem services in adaptive urban planning and design: A framework for supporting innovation. Landsc. Urban Plan. 2014, 125, 254–259. [Google Scholar] [CrossRef] [Green Version]
- Coutts, C.; Hahn, M. Green infrastructure, ecosystem services, and human health. Int. J. Environ. Res. Public Health 2015, 12, 9768–9798. [Google Scholar] [CrossRef] [PubMed] [Green Version]
- Lafortezza, R.; Davies, C.; Sanesi, G.; Konijnendijk, C.C. Green Infrastructure as a tool to support spatial planning in European urban regions. IForest 2013, 6, 102. [Google Scholar] [CrossRef] [Green Version]
- Mell, I. Green infrastructure planning: Policy and objectives. In Handbook on Green Infrastructure; Sinnett, D., Smith, N., Burgess, S., Eds.; Chapter 6; Edward Elgar Publishing: Glos, UK, 2015; pp. 105–123. [Google Scholar]
- Pechanec, V.; Janíková, V.; Brus, J.; Kilianová, H. Typological data in the process of landscape potential identification with using GIS. Morav. Geogr. Rep. 2009, 17, 12–24. [Google Scholar]
- Kaya, L.G.; Cetin, M.; Doygun, H. A holistic approach in analyzing the landscape potential: Porsuk Dam Lake and its environs, Turkey. Fresenius Environ. Bull. 2009, 18, 1525–1533. [Google Scholar]
- Ada, E.; Yener, D. Evaluation of Cittaslow-Slow City Association within the Conservation of Landscape Potential. Inonu Univ. J. Art Des. 2017, 7, 66–78. [Google Scholar]
- Ritters, K.H.; Wickham, J.D. A Landscape Atlas of the Chesapeake Bay Watershed. In Naval Research Lab Stennis Space Center Ms Coupled Dynamic Processes Section; US Environmental Protection Agiency: Las Vegas, NV, USA, 1995. [Google Scholar]
- Hofkens, E.; Roosens, I. Nieuwe impulsen voor de landschapszorg. De Landschapsatlas, Baken Voor Een Verruimd Beleid. In Ministerie van de Vlaamse Gemeenschap, Afdeling Monumenten En Landschappen, Brussel; UGent: Brussel, Belgium, 2001. [Google Scholar]
- Miklós, L. Landscape Atlas of the Slovak Republic. Ministry of Environment of the Slovak Republic; Slovak Environmental Agency: Bratislava, Slovakia, 2002. [Google Scholar]
- Wascher, D.M. European Landscape Character Areas: Typologies, Cartography and Indicators for the Assessment of Sustainable Landscapes; Landscape Europe: Wageningen, The Netherlands, 2005. [Google Scholar]
- Council of Europe. Landscape included in the Flemish regional planning process. In Seventh Meeting of the Workshops of the Council of Europe for the Implementation of the European Landscape Convention Proceedings; Council of Europe Publishing: Piestany, Slovakia, 2009. [Google Scholar]
- Van Eetvelde, V.; Antrop, M. Landscape policy and participative processes: Examples at the Flemish level. In 1st Careggi Seminar: Participation in Landscape Planning: The Cases of the Tuscany Region and the Flemish Region: Theory and Governance Aspects Compared; European Network for the Implementation of the European Landscape Convention (UNISCAPE): Florence, Italy, 2012; Volume 1, pp. 14–21. [Google Scholar]
- Yazgı, D.; Yılmaz, K.T. Employing SHE analysis method for evaluating landscape diversity. Biol. Divers. Conserv. 2017, 10, 58–65. [Google Scholar]
- Botequilha Leitão, A.; Miller, J.; Ahern, J.; MacGarigal, K. Measuring Landscapes: A Planner’s Handbook; Island Press: Washington, DC, USA, 2006; p. 245. [Google Scholar]
- Tóth, A.; Štěpánková, R.; Feriancová, Ľ. Landscape Architecture and Green Infrastructure in the Slovak Countryside; Powerprint: Prague, Czech Republic, 2016. [Google Scholar]
- Landscape Institute. Green Infrastructure. An Integrated Approach to Land Use; Landscape Institute Position Statement: London, UK, 2013. [Google Scholar]
- Tudor, C. An Approach to Landscape Character Assessment; Natural England: New York, NY, USA, 2014. [Google Scholar]
- Landscape Institute. Landscape Character Assessment; Technical Information Note: Edinburgh, UK, 2015. [Google Scholar]
- Uzun, O.; Dilek, F.; Erduran, F.; Accedil, S. National and regional landscape classification and mapping of Turkey: Konya closed basin, Suğla Lake and its surrounding area. Int. J. Phys. Sci. 2011, 6, 550–565. [Google Scholar]
- Atik, M.; Işikli, R.C.; Ortaçesme, V.; Yildirim, E. Definition of landscape character areas and types in Side region, Antalya-Turkey with regard to land use planning. Land Use Policy 2015, 44, 90–100. [Google Scholar] [CrossRef]
- Jia, Y.; Tang, L.; Xu, M.; Yang, X. Landscape pattern indices for evaluating urban spatial morphology–A case study of Chinese cities. Ecol. Indic. 2019, 99, 27–37. [Google Scholar] [CrossRef]
- He, L.; Shen, J.; Zhang, Y. Ecological vulnerability assessment for ecological conservation and environmental management. J. Environ. Manag. 2018, 206, 1115–1125. [Google Scholar] [CrossRef] [PubMed]
- Akcay, H.; Oguz, A.; Karapire, C. Study of heavy metal pollution and speciation in Buyuk Menderes and Gediz river sediments. Water Res. 2003, 37, 813–822. [Google Scholar] [PubMed]
- Ozonat, C. Integrated River Basin Management: A Case of Büyük Menderes River Basin. Master’s Thesis, Middle East Technical University, Ankara, Turkey, 2013. [Google Scholar]
- Barbero, M.; Quézel, P. Les groupements forestiers de Grèce centro-méridionale. In Forest Regions of Central-Southern Greece; Faculté des Sciences et Techniques de St Jérôme: Marseille, France, 1976. [Google Scholar]
- Yılmaz, K.T. Akdeniz Doğal Bitki Ortüsü. In Natural vegetation of Mediterranean, 2nd ed.; Çukurova Universitesi Ziraat Fakültesi Genel Yayınları No: 172,179s: Adana, Turkey, 1996. [Google Scholar]
- Barth, H.G.; Duthweiler, H.; Voight, W. Umweltqualität und Naturraumpotentiale im Ballungsraum Izmir. In Environmental Quality and Natural Potential of Izmir Metropolitan Area; Luftimmissionen, Veränderung Und Beeinträchtigung von Landschaft Und Vegetation, Siedlungsstruktur Und Siedlungsentwicklung; Beiträge Zur Räumlichen Planung: Hannover, Germany, 1988. [Google Scholar]
- Schwarz, O. Die Vegetationsverhältnisse Westanatoliens. The vegetation conditions in western Anatolia. Bot. Jahrbücher Syst. Pflanzengesch. Pflanzengeogr. 1936, 67, 297–436. [Google Scholar]
- Chang, Q.; Li, X.; Huang, X.; Wu, J. A GIS-based green infrastructure planning for sustainable urban land use and spatial development. Procedia Environ. Sci. 2012, 12, 491–498. [Google Scholar] [CrossRef] [Green Version]
- Marulli, J.; Mallarach, J.M. A GIS methodology for assessing ecological connectivity: Application to the Barcelona Metropolitan Area. Landsc. Urban Plan. 2005, 71, 243–262. [Google Scholar] [CrossRef]
- Haase, G. Zur Ableitung und Kennzeichnung von Naturpotentialen. Petermanns Geogr. Mitt. 1978, 122, 113–125. [Google Scholar]
- Izakovıčová, Z.; Miklós, l.; Drdoš, J. Krajinnoekologické Podmienky Trvalo Udržateľného Rozvoja. Veda: Bratislava, Slovakia, 1997; p. 186. [Google Scholar]
Figure 1.
Geographic location and boundaries of the study area.

Figure 2.
Research methodology. LCA, landscape character assessment.
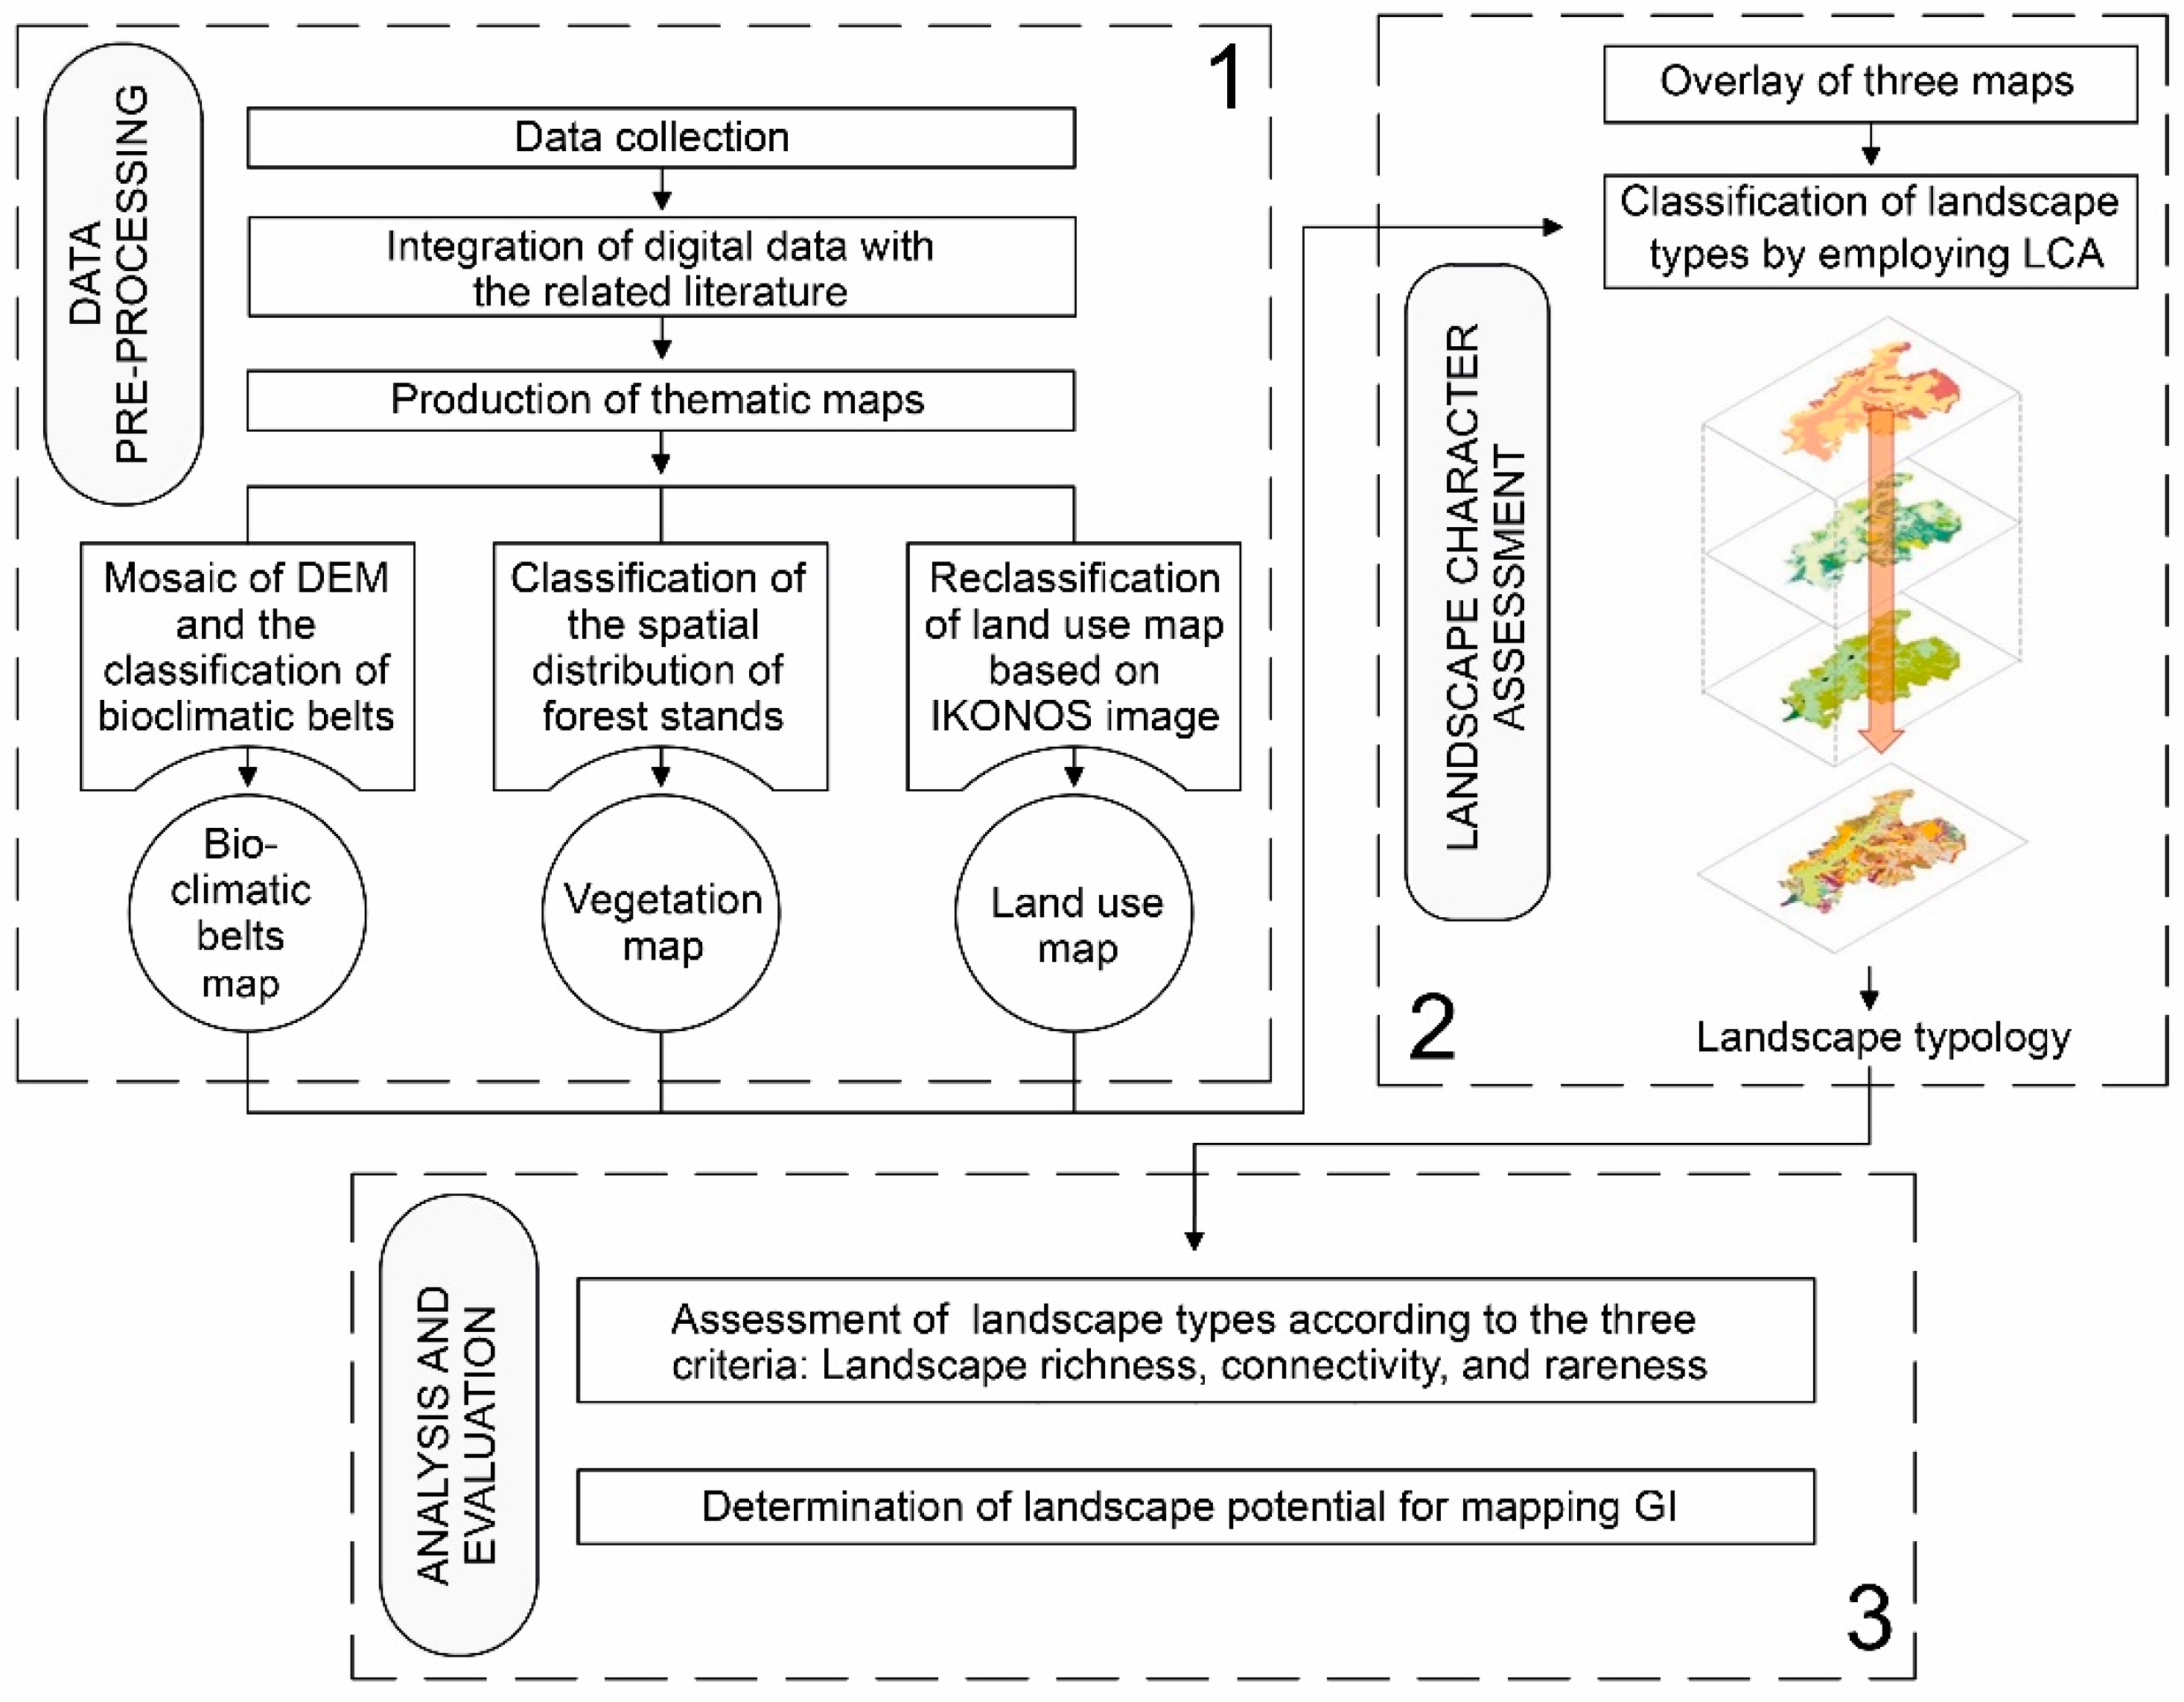
Figure 3.
The configuration of the landscape codes and the case of a salt marsh/sand dune landscape.
Figure 3.
The configuration of the landscape codes and the case of a salt marsh/sand dune landscape.

Figure 4.
Landscape grid cells.

Figure 5.
The computation of relative landscape diversity (RLD) for four grid cells.

Figure 6.
The spatial distribution of the landscape types.

Figure 7.
The determination of the rareness levels of the landscape types. loga, logarithmic value of the amount of area covered by the landscape type; logbs, logarithmic value of the number of landscape units.
Figure 7.
The determination of the rareness levels of the landscape types. loga, logarithmic value of the amount of area covered by the landscape type; logbs, logarithmic value of the number of landscape units.

Figure 8.
Green infrastructure (GI) map of the lower Büyük Menderes River Basin.

Figure 9.
The proportional distribution of the land cover types in the GI elements.


Table 1.
Functional scores for the evaluation of the landscape grid cells according to the determined criteria for mapping the landscape potential (LP).
Table 1.
Functional scores for the evaluation of the landscape grid cells according to the determined criteria for mapping the landscape potential (LP).
| Level | Landscape Diversity and Rareness (Criteria 2 and 3) | ||
|---|---|---|---|
| Landscape Connectivity (Criteria 1) | Low Moderate High | High | Low |
| 3 | 5 | ||
| 2 | 4 | ||
| 1 | 3 | ||
© 2020 by the authors. Licensee MDPI, Basel, Switzerland. This article is an open access article distributed under the terms and conditions of the Creative Commons Attribution (CC BY) license (http://creativecommons.org/licenses/by/4.0/).
Share and Cite
MDPI and ACS Style
Gülçin, D.; Yılmaz, K.T. Mapping Landscape Potential for Supporting Green Infrastructure: The Case of a Watershed in Turkey. Land 2020, 9, 268. https://doi.org/10.3390/land9080268
AMA Style
Gülçin D, Yılmaz KT. Mapping Landscape Potential for Supporting Green Infrastructure: The Case of a Watershed in Turkey. Land. 2020; 9(8):268. https://doi.org/10.3390/land9080268
Chicago/Turabian StyleGülçin, Derya, and Kemal Tuluhan Yılmaz. 2020. "Mapping Landscape Potential for Supporting Green Infrastructure: The Case of a Watershed in Turkey" Land 9, no. 8: 268. https://doi.org/10.3390/land9080268
Note that from the first issue of 2016, this journal uses article numbers instead of page numbers. See further details here.