Article

Benefits Are Limited with High Nitrogen Fertiliser Rates in Kikuyu-Ryegrass Pasture Systems

by
Charné Viljoen
1,
Janke van der Colf
2 and
Pieter Andreas Swanepoel
1,*
1
Department of Agronomy, Stellenbosch University, Stellenbosch 7602, South Africa
2
Western Cape Department of Agriculture, Outeniqua Research Farm, George 6529, South Africa
*
Author to whom correspondence should be addressed.
Land 2020, 9(6), 173; https://doi.org/10.3390/land9060173
Submission received: 26 March 2020 / Revised: 9 May 2020 / Accepted: 11 May 2020 / Published: 29 May 2020
(This article belongs to the Section Soil-Sediment-Water Systems)

Abstract

:
Nitrogen (N) fertiliser is applied to pastures in dairy farming systems to ensure productivity, but it is an expensive input that could be damaging to the environment if used excessively. In the southern Cape region of South Africa, N fertilisation guidelines for pastures were developed under conditions different to current management practices, yet dairy producers still base fertiliser programmes on these outdated guidelines. This study aimed to determine the efficiencies of N fertilisation. Various N fertiliser rates (0, 20, 40, 60 and 80 kg ha−1 applied after grazing), as well as a variable rate according to the nitrate concentration in the soil water solution, were assessed on a grazed pasture. Dairy cows returned to a pasture approximately 11 times per year. Pasture production showed a minimal response to fertilisation within each season. The most responsive parameters to fertilisation were the herbage crude protein content, soil mineral N content and urease activity. Reduced microbial activity was observed when more than 40 kg N ha−1 was applied. When considering the soil total mineral N content, N is used inefficiently at rates above 40 kg N ha−1. The results are indicative of an N saturated system that provides a rationale for reducing N fertiliser rates.

1. Introduction

Kikuyu grass (Pennisetum clandestinum) is utilised as a pasture base for dairy production [1]. However, kikuyu becomes dormant when temperatures decrease during winter and spring [2] and therefore, the strategic incorporation of cool-season forage species is used to improve fodder availability throughout the year [3]. Ryegrass (Lolium spp.) is a productive grass species commonly sown into kikuyu to contribute to herbage production [1,3,4] and pasture quality [5]. It is often suggested that legumes, such as clovers (Trifolium spp.), should be incorporated into grass pastures to reduce nitrogen (N) fertiliser requirements. Unfortunately, oversowing clovers into grass pastures is often unreliable. This is because clovers exhibit lower herbage production than grasses [5], present poor establishment abilities [6,7] and often display poor persistence as a result of the competitive nature of grasses, particularly kikuyu [5,8].
In the southern Cape of South Africa, the guidelines for the N fertilisation of kikuyu-ryegrass pastures are based on data gathered from small cutting plot trials, cultivated on conventionally tilled soils [9]. In cutting trials, N cycling through animal excreta is generally not taken into account and over-fertilisation often manifests. The urine N input under simulated conditions in New Zealand was between 132 and 216 kg N ha−1 year−1 [10], and between 165 and 268 kg N ha−1 year−1 in Australia [11]. Over the past few decades, no-tillage has been implemented in these systems, which significantly alters N cycling as a result of an increased soil organic matter content and a greater soil N reserve [12]. A high potentially mineralisable pool of N in soil has further implications for N fertilisation, which are not considered by the current fertiliser guidelines [12].
The main source of N applied to kikuyu-ryegrass pastures in South Africa is mineral N fertiliser. In an effort to increase herbage production, so as to increase the stocking rates of dairy cows, high N rates are often applied. Nitrogen fertiliser rates ranging between 300 and 500 kg N ha−1 year−1 are common for kikuyu-ryegrass pasture systems [2], even though some producers have started applying lower N rates in the range of 100 to 250 kg N ha−1 year−1. The exception will apply as high as 800 kg N ha−1 year−1. The application of organic N sources, such as chicken litter, is not common in South Africa due to a lack of availability and the fact that it may lead to excessive levels of phosphorous and other nutrient imbalances [13]. Organic N application, especially chicken litter, is only advised in the region when the soil can accommodate additional nutrients, such as phosphorous and potassium. The reapplication of dairy effluent only occurs when a producer has the infrastructure to dilute and filter effluent, in order to prevent effluent solids from blocking the irrigation sprinklers. The South African N fertiliser guideline for attaining a 20 t dry matter (DM) yield ha−1 year−1 suggests that 430 kg N ha−1 year−1 should be applied [14].
Nitrogen is a macronutrient required in large amounts to sustain food production, but may also have detrimental effects on the environment if managed injudiciously. The efficient utilisation of resources, sustainable intensification of agricultural production systems and combatting climate change are high on the agenda of governments and scientists, and are also included in the Sustainable Development Goals of the United Nations [15]. Besides the environmental risks associated with the leaching or volatilisation of N, the cost of applying a nutrient that is lost to the environment without a return on investment could have a substantial impact on the profitability of farming systems [16,17]. Nitrogen pollution has diverse and far-reaching effects on local economies, as it impacts human and animal health, climate change, the biodiversity of natural ecosystems and tourism [18,19,20,21].
The current study investigated the efficiency related to the N fertilisation of a no-tillage, grazed kikuyu-ryegrass pasture in the southern Cape of South Africa. Historically, the dairy pastures in this area have been fertilised abundantly and may be eligible for reduced N fertiliser rates in an attempt to improve eco-efficient production. The first objective was to evaluate the response of kikuyu-ryegrass pasture herbage production and quality parameters to different N fertilisation rates. The second objective was to investigate the effects of N fertilisation rates on soil N dynamics.

2. Results and Discussion

The study was designed to evaluate the seasonal and annual herbage production response of kikuyu pasture over-sown with ryegrass to N fertilisation of pastures grazed by Jersey cows. Grazing took place approximately every 28 days in summer and c. 32 days in winter. The response of the botanical composition, agronomic N use efficiency (ANUE) and crude protein content of the pasture were also evaluated in response to season and N fertilisation. The N treatments of 0, 20, 40, 60, and 80 kg N ha−1 (N0, N20, N40, N60, and N80, respectively) and a variable rate (Nvar) according to the nitrate concentration in soil water were applied after every grazing event. This resulted in the total annual N fertiliser rates found in Table 1. The application rate for Nvar was determined by measuring the soil water nitrate concentration of a sample collected from a Fullstop™ Wetting Front Detector inserted into the soil to a depth of 150 mm (explained in detail in Section 3.2; Materials and Methods).

2.1. Herbage Production

Herbage production was determined through cutting herbage to a height of 30 mm above ground level from five randomly placed rings (0.0985 m2) per plot, prior to grazing. The total annual herbage production of 23.48 t DM ha−1 year−1 was the highest (p < 0.05) for the N80 treatment, but did not differ from that of the N60 treatment, for which a herbage production of 22.94 t DM ha−1 was recorded (Figure 1). Similar herbage production (p ≥ 0.05), ranging between 19.10 and 21.68 t DM ha−1 year−1, was found for the treatments N0, N20, N40, and Nvar.
Herbage production was higher than that generally recorded in the literature. Previous research conducted by Swanepoel et al. [22] on kikuyu-ryegrass pasture on Outeniqua Research Farm found an annual herbage production value of 20.3 t DM ha−1 year−1 for pasture receiving approximately 32 kg N ha−1 month−1, while Van der Colf [3] found a value between 18.8 and 13.5 t DM ha−1 year−1 on pasture receiving 55 kg N ha−1 month−1. Botha et al. [5] reported an annual herbage production value of 16.0 to 19.3 t DM ha−1 year−1 at 600 kg N ha−1 year−1 (applied in 10 split dressings). High production could be attributed to high residual N in the soil or more efficient ryegrass cultivars sown into kikuyu. Ryegrass variety trials on the Outeniqua Research Farm found that the cultivar Barmultra outperformed the cultivars Jeanne and Energa (used in trials at the same location) in terms of total annual herbage production [23].
Seasonal herbage production (described in Section 3.4, Materials and Methods) was calculated by adding herbage produced from individual grazing events within a specific season to obtain the cumulative seasonal herbage production. Treatments were applied after every grazing event, which resulted in seasonal N application rates of N applied per grazing event multiplied by the number of grazing events within a season. For instance, for the treatment N20, where three grazing events took place within a season, the seasonal N application will be 60 kg N ha−1 season−1, applied as 20 kg N ha−1 three times during the season after every grazing event.
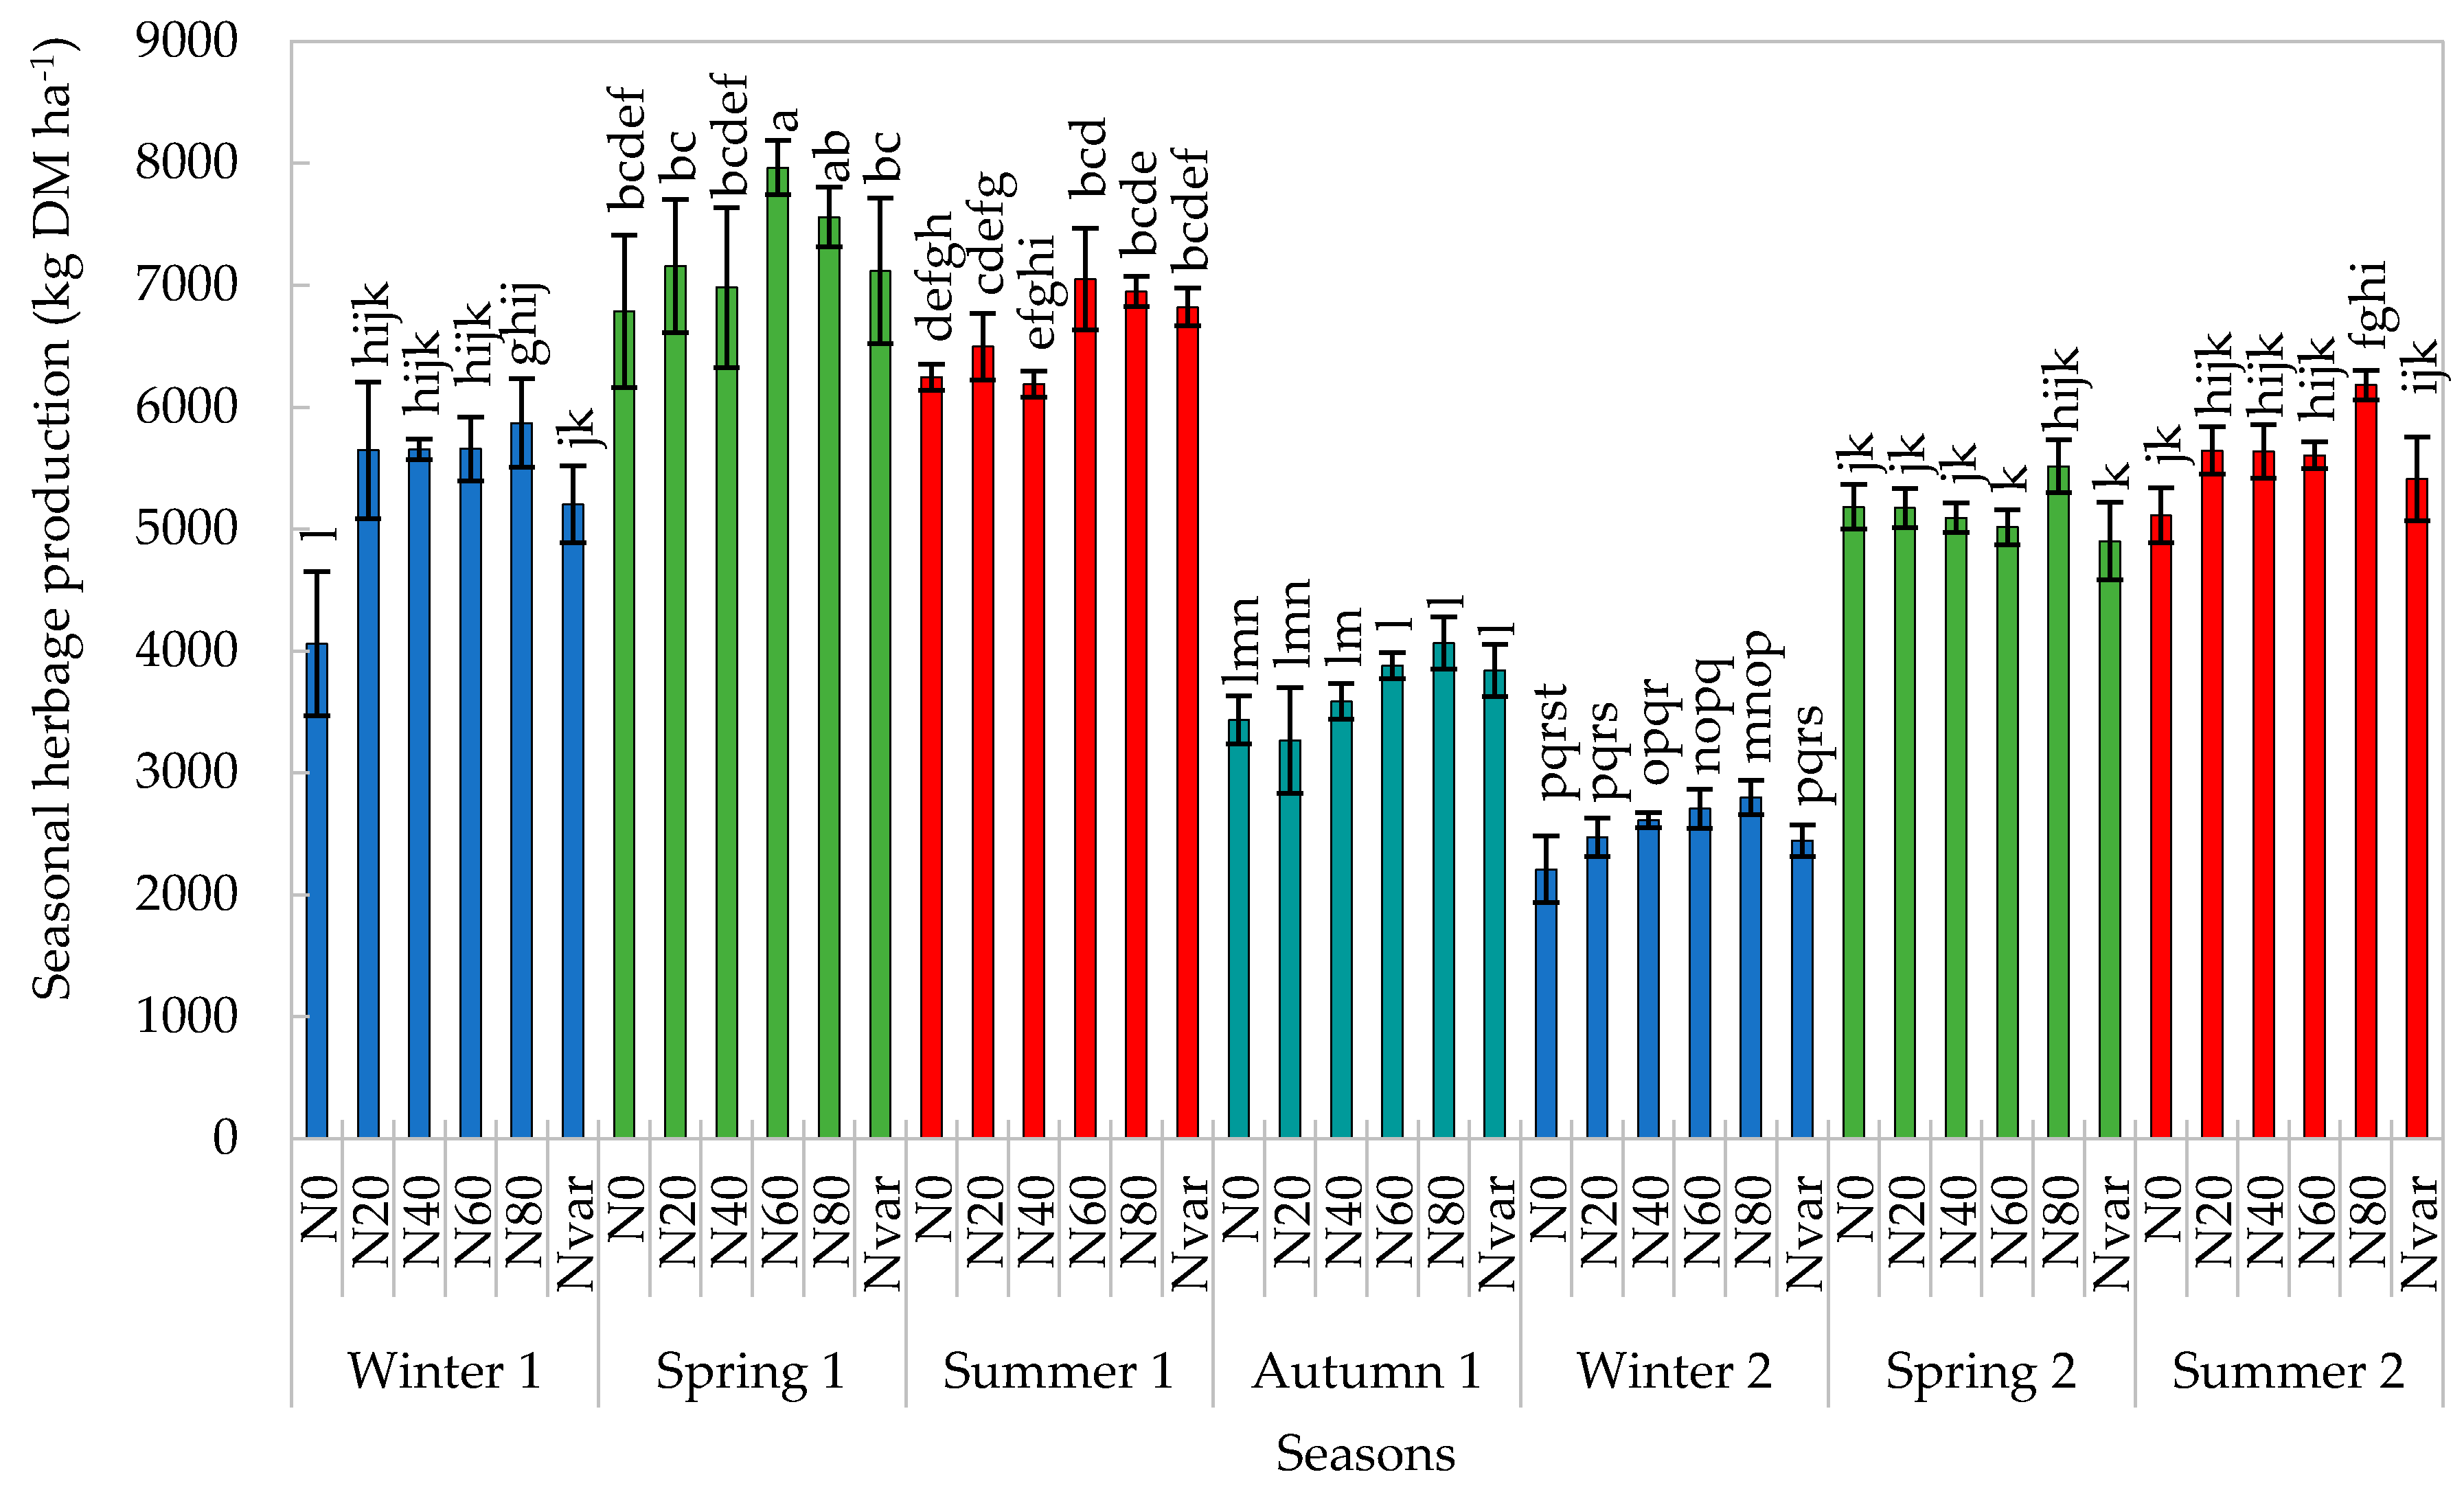
Both of the main effects (N rate and season) were significant (p < 0.05) for seasonal herbage production (Table 2). Nitrogen rate effects were only visible in the winter, spring and summer of year 1 (Figure 2). During the winter of year 1, no nitrogen resulted in the lowest (p < 0.05) production compared to other treatments (p ≥ 0.05). In the spring and summer of year 1, treatments mostly displayed similar herbage production (p ≥ 0.05), ranging between 6.98 and 7.96 t DM ha−1 season−1 in summer and between 6.18 and 7.05 t DM ha−1 season−1 in spring. Treatment N60 was the exception, and produced 981 and 860 kg DM ha−1 season−1 more herbage (p < 0.05) compared to N40 in spring and summer, respectively. The 3 t ha−1 season−1 lower production of winter in year 2 compared to winter in year 1 is the result of only two grazing events in year 2 compared to three grazing events in year 1, which resulted in lower cumulative herbage production in the winter of year 2. Differences between seasons could be primarily due to the botanical composition changes in the pasture.
During the winter and spring of year 2, no N was required to maintain similar production to fertilised treatments, while up to 80 kg N ha−1 grazing−1 during the summer of year 2 was needed for production higher than that of the unfertilised control. The financial implication of applying an 80 kg N ha−1 grazing−1 increase in pasture herbage, and thus 240 kg N ha−1 season−1 compared to no N for a 1.0 t ha−1 season−1, will be substantial. In a similar comparison, Christie et al. [11] recommended that it would be more profitable to purchase supplemental feed with a higher nutritional value than apply additional fertiliser to increase pasture production if herbage production does not increase by more than 6 kg per kg N.

2.2. Botanical Composition

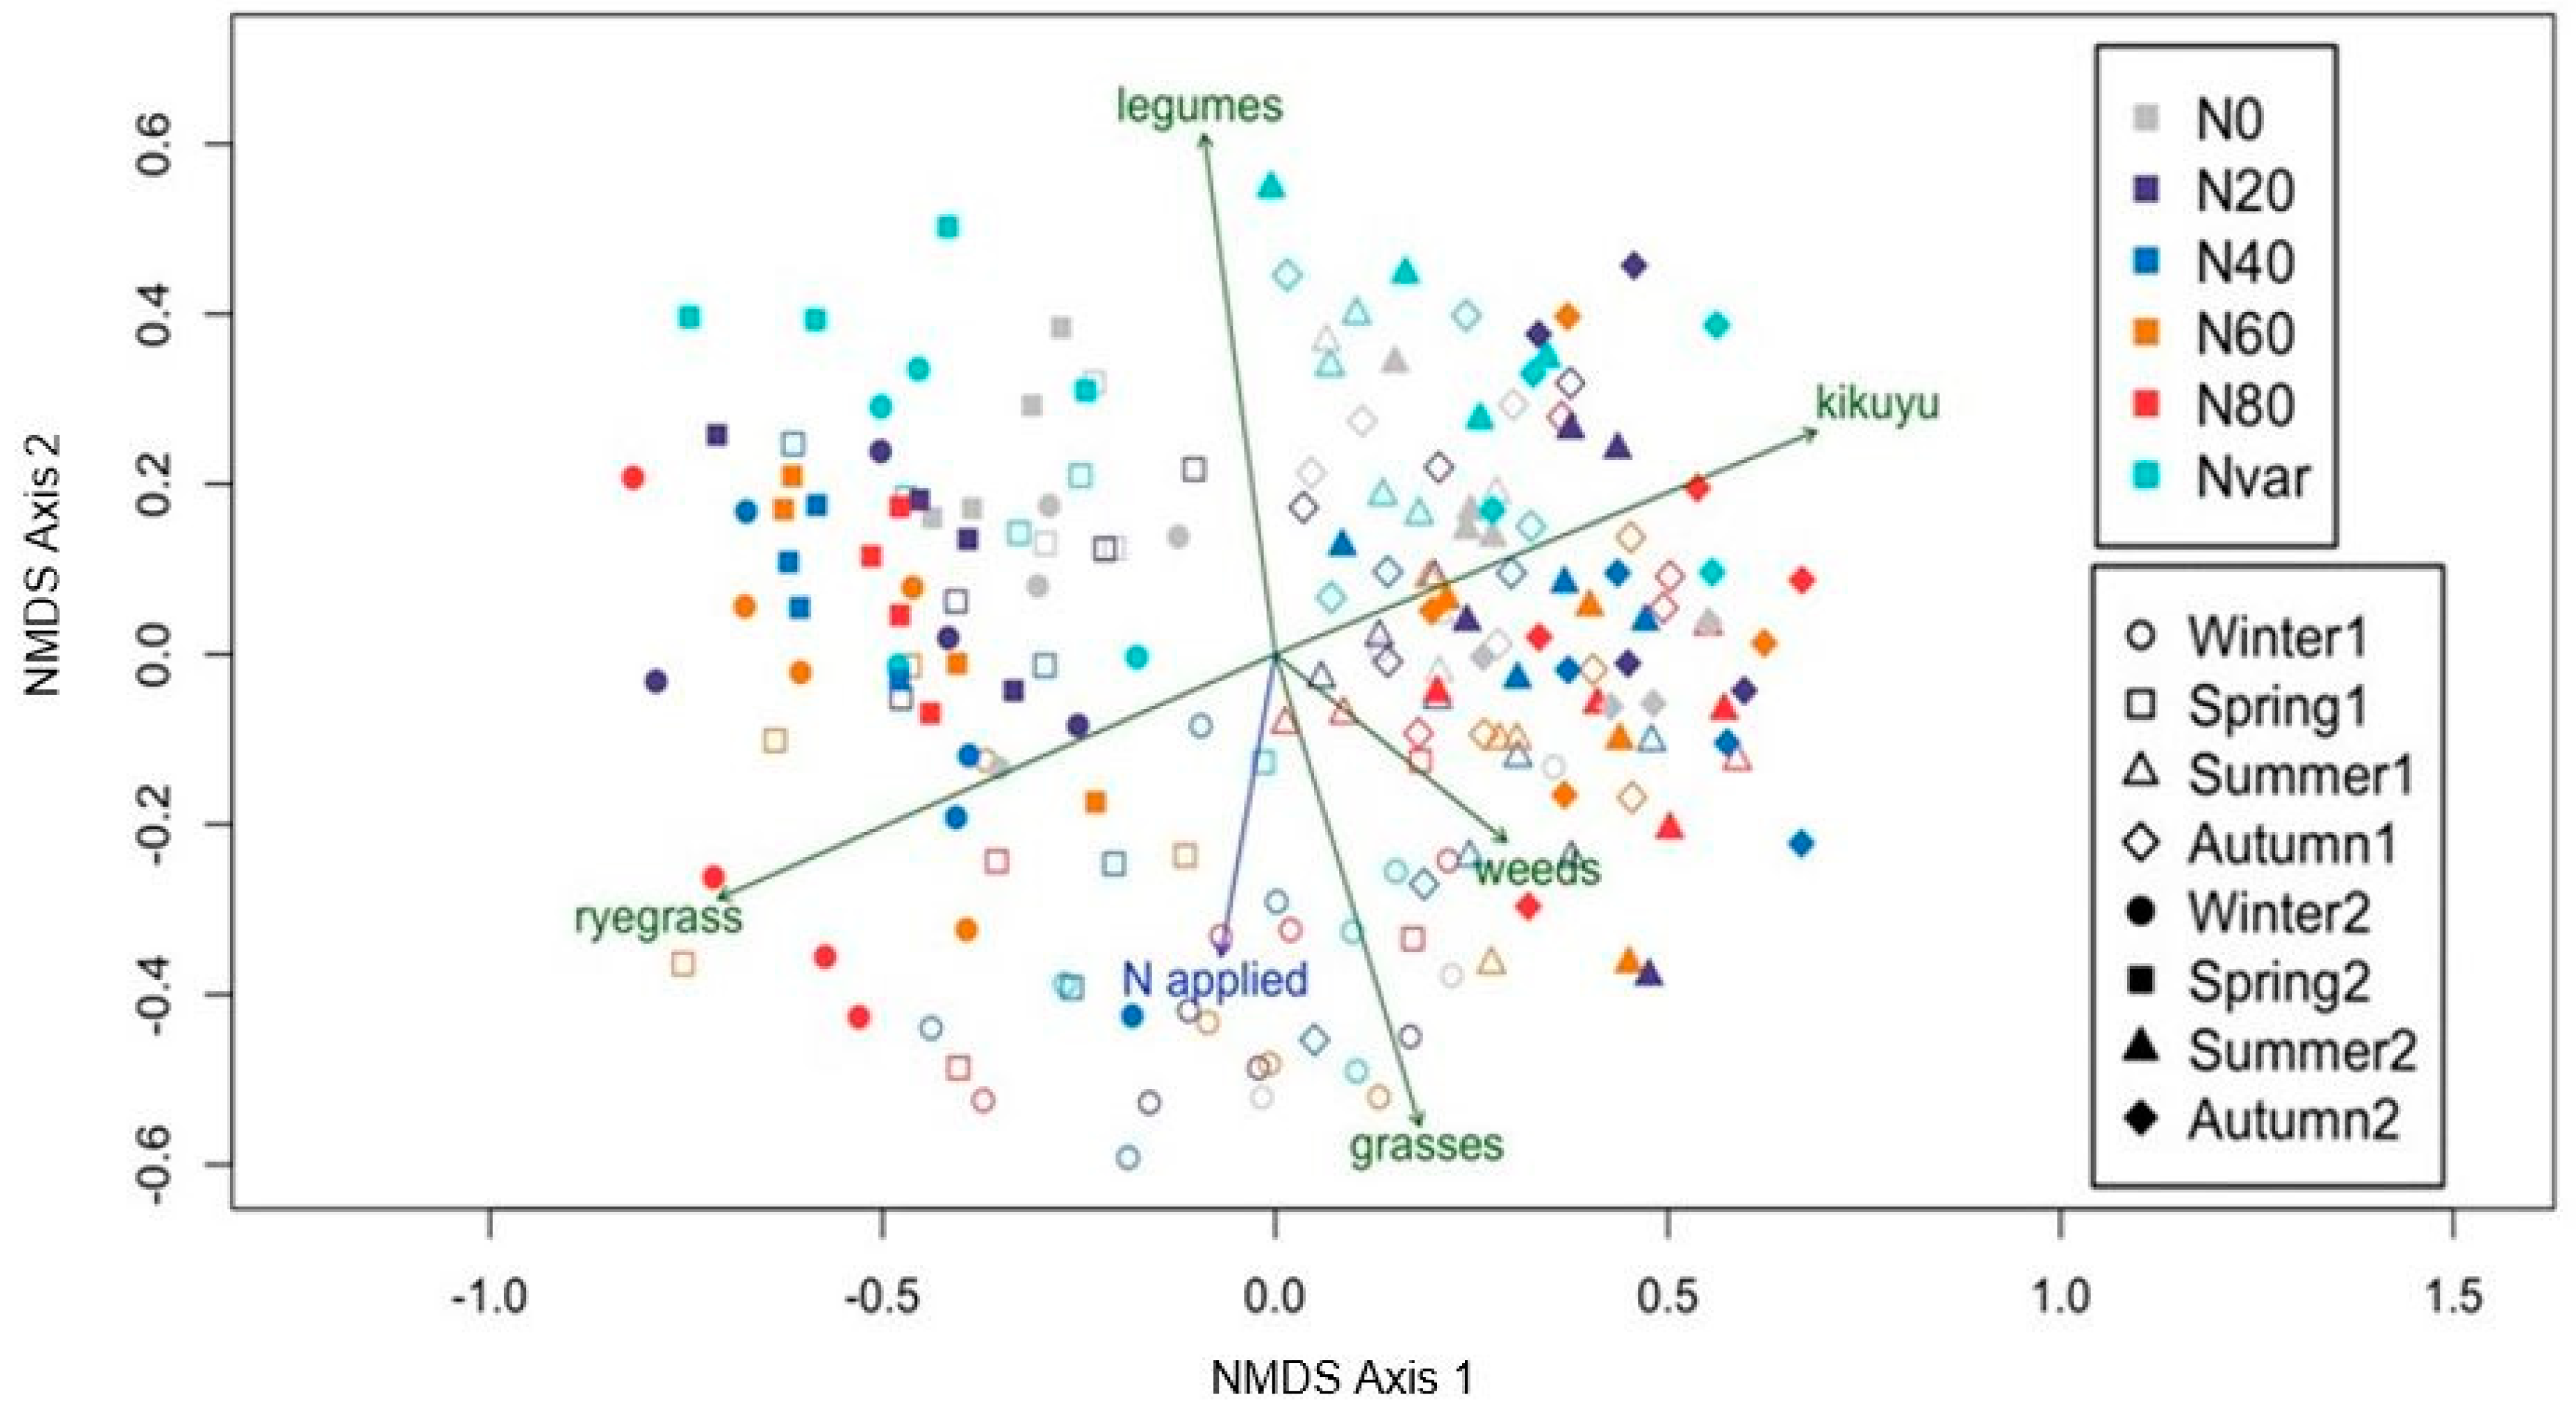
The botanical composition influences the quality of pasture, which in turn influences the production of a dairy cow. Changes in the botanical composition of the pasture were determined as a response to N treatments and season. Non-metric multidimensional scaling (NMDS) ordination is a visual display of how dissimilar the botanical composition of the pasture is as a result of N fertilisation and season. A sufficient fit with stress below 0.2 (above 0.2, visualisation is deemed arbitrary) was found in two dimensions, resulting in one biplot with a stress of 0.14 (Figure 3). The correlation between N application and ordination was significant (p < 0.05), with an R2 of 0.21.
It is clear from Figure 3 that there is a difference between seasons. There was a higher grouping of summer and autumn of both years along axis 1, while winter and spring were found to be lower along axis 1. There were also differences between years, which is especially visible when examining the grouping of winter and spring. The grouping of these two seasons is located higher along axis 2 for year 2 compared to year 1.
Volunteer legumes and the N rate were negatively correlated, resulting in a higher legume contribution with lower N applications, especially in summer and spring. The clover component recorded in this study (data not shown) ranged between 20% and 30% during spring and summer in the N0 and Nvar treatments, but drastically decreased with increasing fertiliser application. An increase in clover content is beneficial for the producer on two accounts. Firstly, clovers add N to the soil by biologically fixing N. Secondly, a higher clover content leads to a higher nutritional value of the herbage, as was found when kikuyu-ryegrass pastures were compared to kikuyu-clover pastures [24]. The benefits of an increased clover content will also be lost if high N rates are applied. The competitive ability of clovers is reduced in cool seasons compared to warmer seasons, and the clover contribution to pasture is increased with a decreasing N rate [25,26]. A clover contribution of >30%, which is the minimum amount required for the effective contribution of biological fixation to a mixed pasture [27], was only achieved in the current study for low N treatments (N0 and Nvar), and only during the warmer months.
Ryegrass is a cool-season species and it is sown into a kikuyu base to compliment the fodder availability throughout the year. It is therefore expected that ryegrass is more dominant in the cooler months of winter, with the effect lasting into spring until kikuyu regains its competitiveness in warmer temperatures of summer and autumn. This is seen in Figure 3, where NMDS axis 1 displays predominately kikuyu, weeds, and other grasses during summer and autumn, and ryegrass-dominated pasture in winter and spring. The composition varied between year 1 and year 2, since the open and shaded shapes are not clustered together. Ryegrass is expected to increase with an increase in N application. However, the correlation between ryegrass and the N application rate is not strong, shown by a short arrow. Botha et al. [24] found that the grazing capacity of a kikuyu-ryegrass system was higher in autumn compared to summer, but milk production was lower in autumn, verifying the lower nutritional value of kikuyu, which was most dominant in autumn.
A positive correlation was seen between N fertilisation and other grasses and weeds during winter in year 1 (Figure 3). Generally, other grasses and weeds were influenced by season rather than N treatments and the combined effect of the two was never more than 25% of the pasture (data not shown). The highest occurrence of these two groups combined was seen during winter (24.29%) and summer (19.39%) of year 1 and summer (17.57%) and autumn (13.28%) of year 2 (data not shown).

2.3. Agronomic Nitrogen Use Efficiency

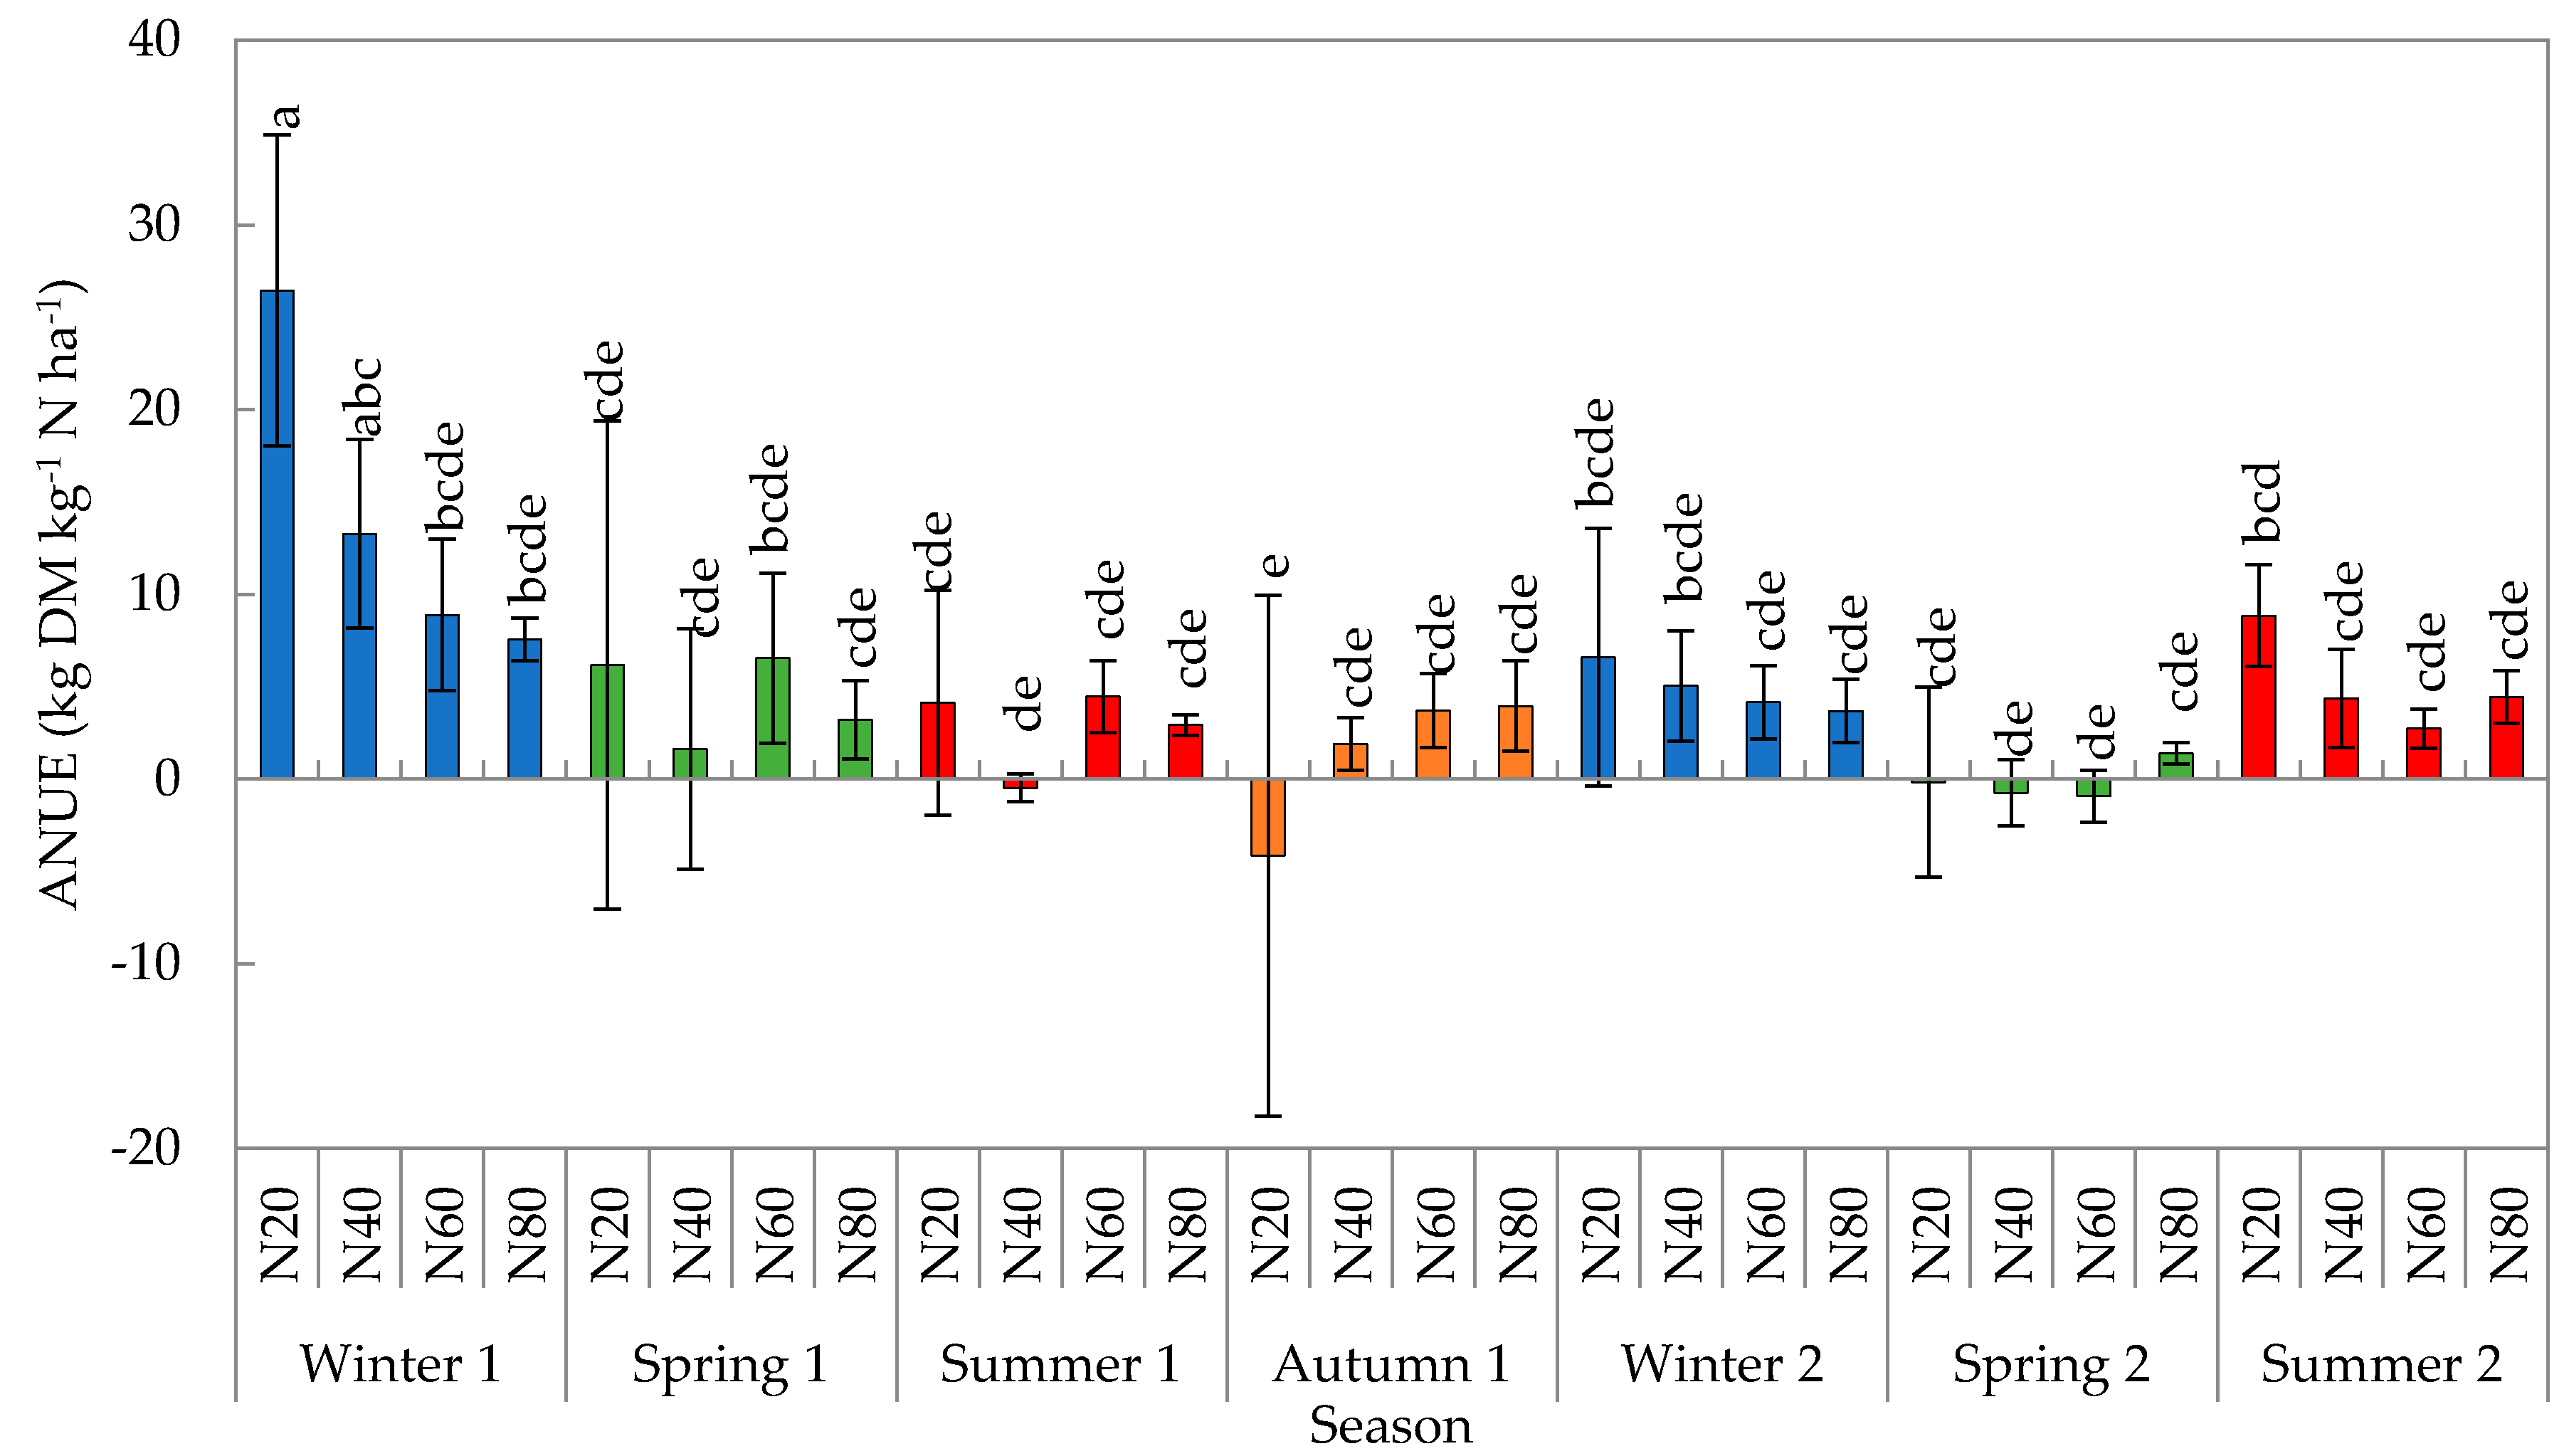
The agronomic N use efficiency (ANUE) was calculated to demonstrate the increase in herbage production for every unit of N applied as fertiliser (Equation (1), Section 3.4 in Materials and Methods). The fact that almost no difference (p ≥ 0.05) between treatments was found within seasons, with the exception of winter 1, could be indicative that sufficient N can be supplied by soil in these systems (Figure 4). Previous studies also found that N fertiliser did not have an effect on the ANUE, but fluctuated in different years and studies [28]. A variable N rate according to season could yield a higher ANUE compared to the fixed rates in the current study, in agreement with some contexts in south-eastern Australia [29]. The botanical composition also influences the ANUE of the pasture. An increase in the N application rate increased the contribution of ryegrass to the pasture [30] and more N was utilised by ryegrass during autumn, winter and early spring [31], while kikuyu contribution did not respond to N in times of low temperatures and low water availability [32].

2.4. Crude Protein Content of Herbage

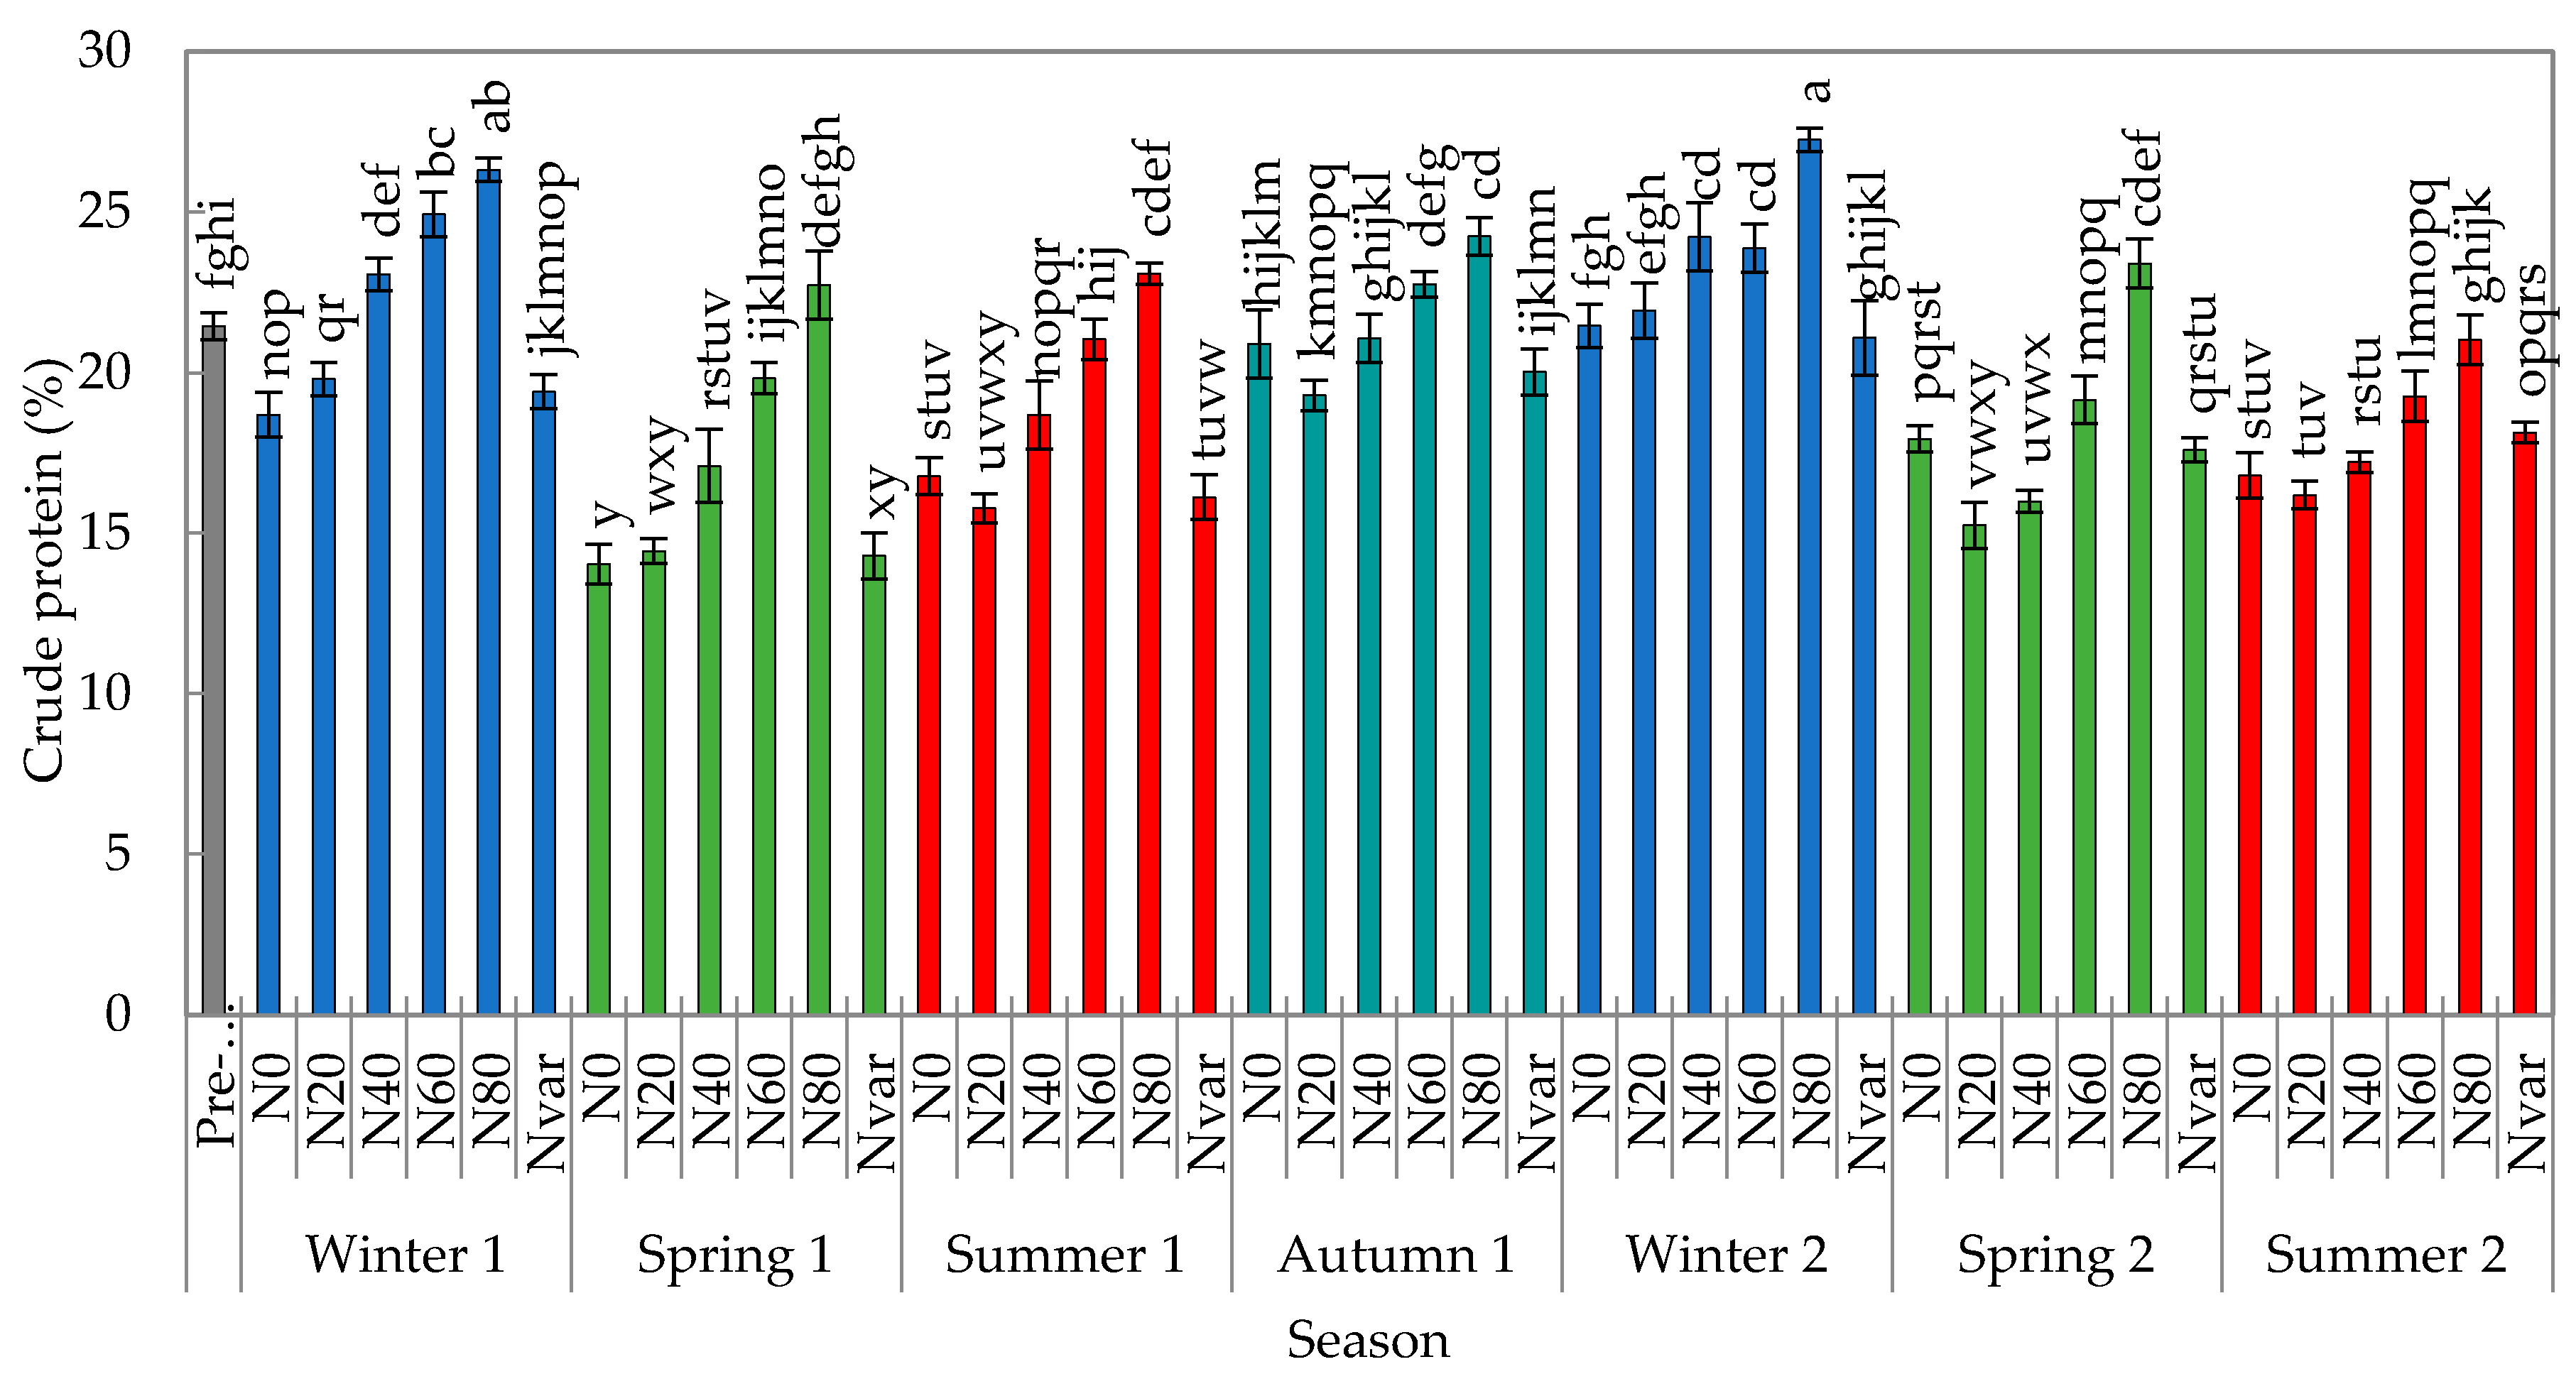
The crude protein content was determined as a measure of quality of the pasture. All the herbage samples were analysed and the average seasonal crude protein is reported. The crude protein content of herbage increased with an increase in N application. Within any season, treatment N80 was 3%–8% higher (p < 0.05) compared to N0, N20, N40 and Nvar (Figure 5). The crude protein content of N0 and Nvar was similar (p ≥ 0.05) when compared within seasons. The spring and summer crude protein content was 4% to 5% lower (p < 0.05) compared to that of winter during both years. This finding was in agreement with other studies conducted at the same location [3,5]. Where low N rates were applied in spring and summer, an increase in the crude protein content of the concentrate fed to dairy cattle in the milking parlour could be justified, as suggested by Botha et al. [5].
A variety of factors influence the crude protein requirement of animals, for example, the breed of cow, body weight, days in milk, dry matter intake, etc. An increase in the crude protein content of the diet results in an increase in milk production, but only to a certain point, after which a reduction in milk production is expected [33]. A small-breed lactating cow (e.g., Jersey cows) has a crude protein requirement ranging between 15% and 19% [33,34]. Excessive N is primarily excreted from the cow through urine, which negatively affects the N efficiency of the cow, and in turn reduces the profit margins [35]. Another disadvantage of high crude protein is that it negatively affects the heat stability of the milk, resulting in milk that is not desired by the milk processor [36].

2.5. Total Mineral Nitrogen Content of the Soil

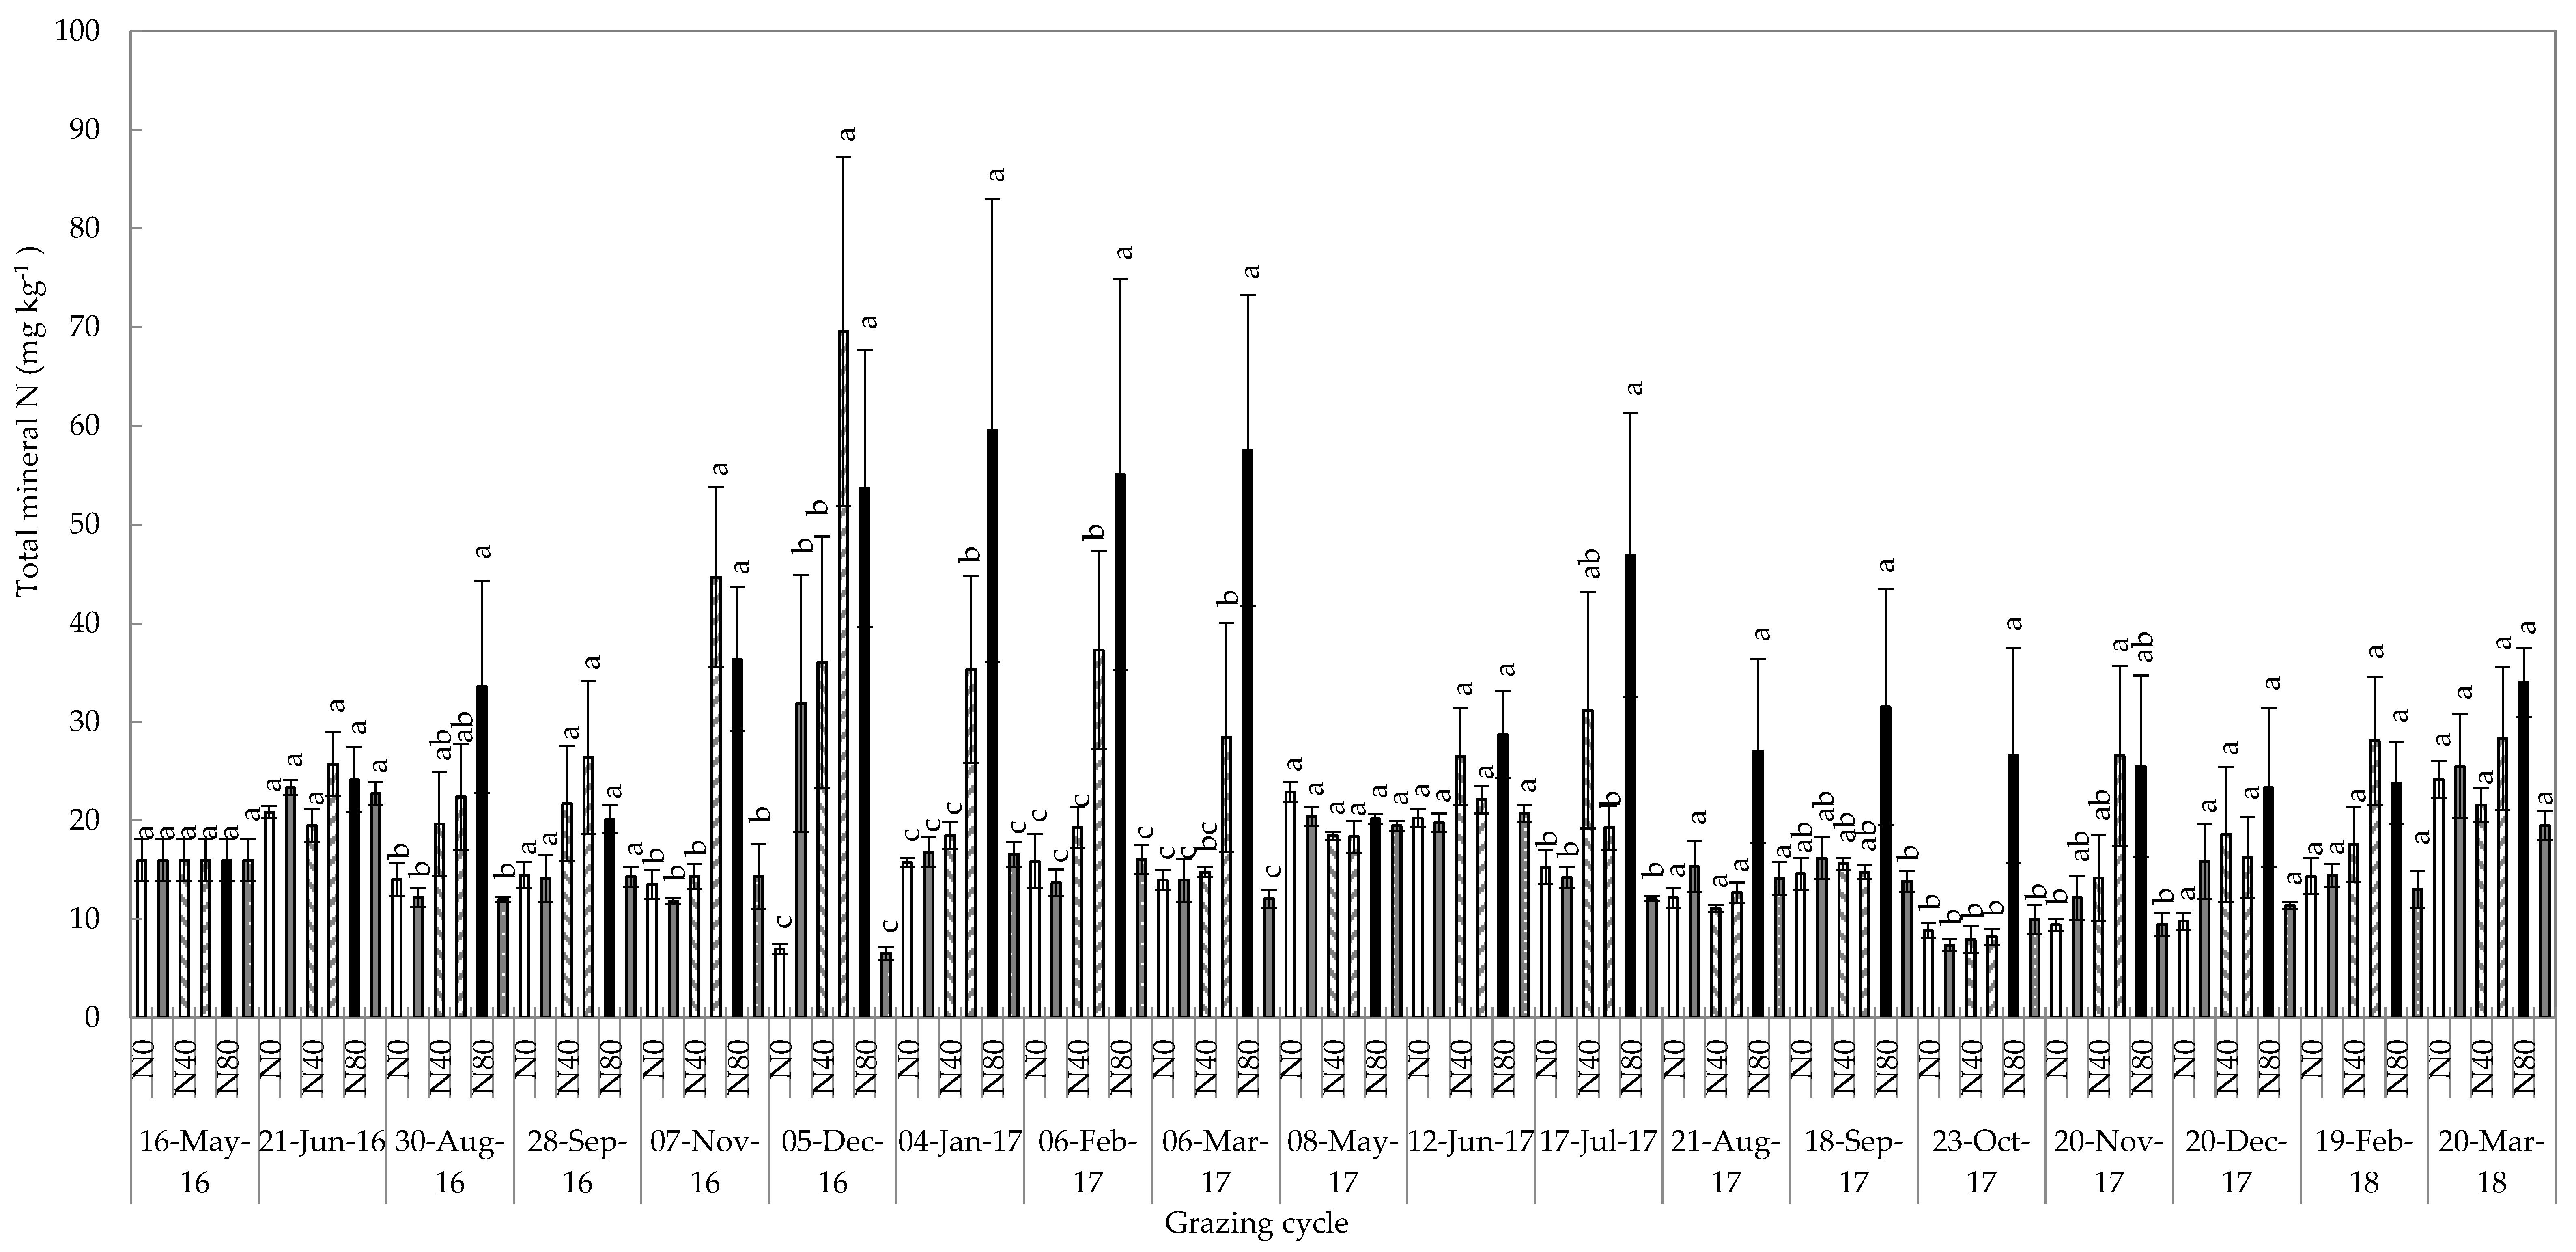
The total mineral N content in the soil is the N available for uptake by plants and primarily consists of ammonium and nitrate. Fertiliser N treatments are expected to influence the mineral N content of the soil. The response of total mineral N in the 0–100 mm soil layer varied (p < 0.05) for different grazing events (Table 2). With the exception of June 2016 and May and June 2017, there was an upward trend as the N rate increased, although this effect was not always significant (Figure 6). This upward trend was also seen for the 100–200 and 200–300 mm depths (data not shown). In the first year, during the summer months, the total mineral content in the soil in N60 and N80 (high N treatments) was between 16 and 63 mg kg−1 higher relative to N0 and Nvar (low N treatments). During May and June of both years, the treatments did not differ (p ≥ 0.05) and no mineral N build-up was observed in the higher treatments, as was the case for some of the other grazing events. A possible explanation for this is that no N was applied to the different N treatments when over-sowing in April 2016 and March 2017, resulting in the build-up of mineral N occurring later. Standard errors were high in some instances and could have been rectified by an increased sample size. However, high variability could be the result of animals grazing the site and depositing urine at random, together with soil mineral N analysis, which uses a small amount of the soil sample to determine the mineral soil N.
Soil mineral N is vulnerable to loss in the environment through various pathways. Ammonium may be converted to ammonia and lost through volatilisation, while nitrate is water-soluble and capable of causing eutrophication when lost to groundwater. Urine patches and N fertilisation both increase the possibility of volatilisation losses [37,38]. Animal excreta on pasture results in volatilisation losses of between 3% to 8%, but this may increase by up to five times at high fertiliser rates [39].
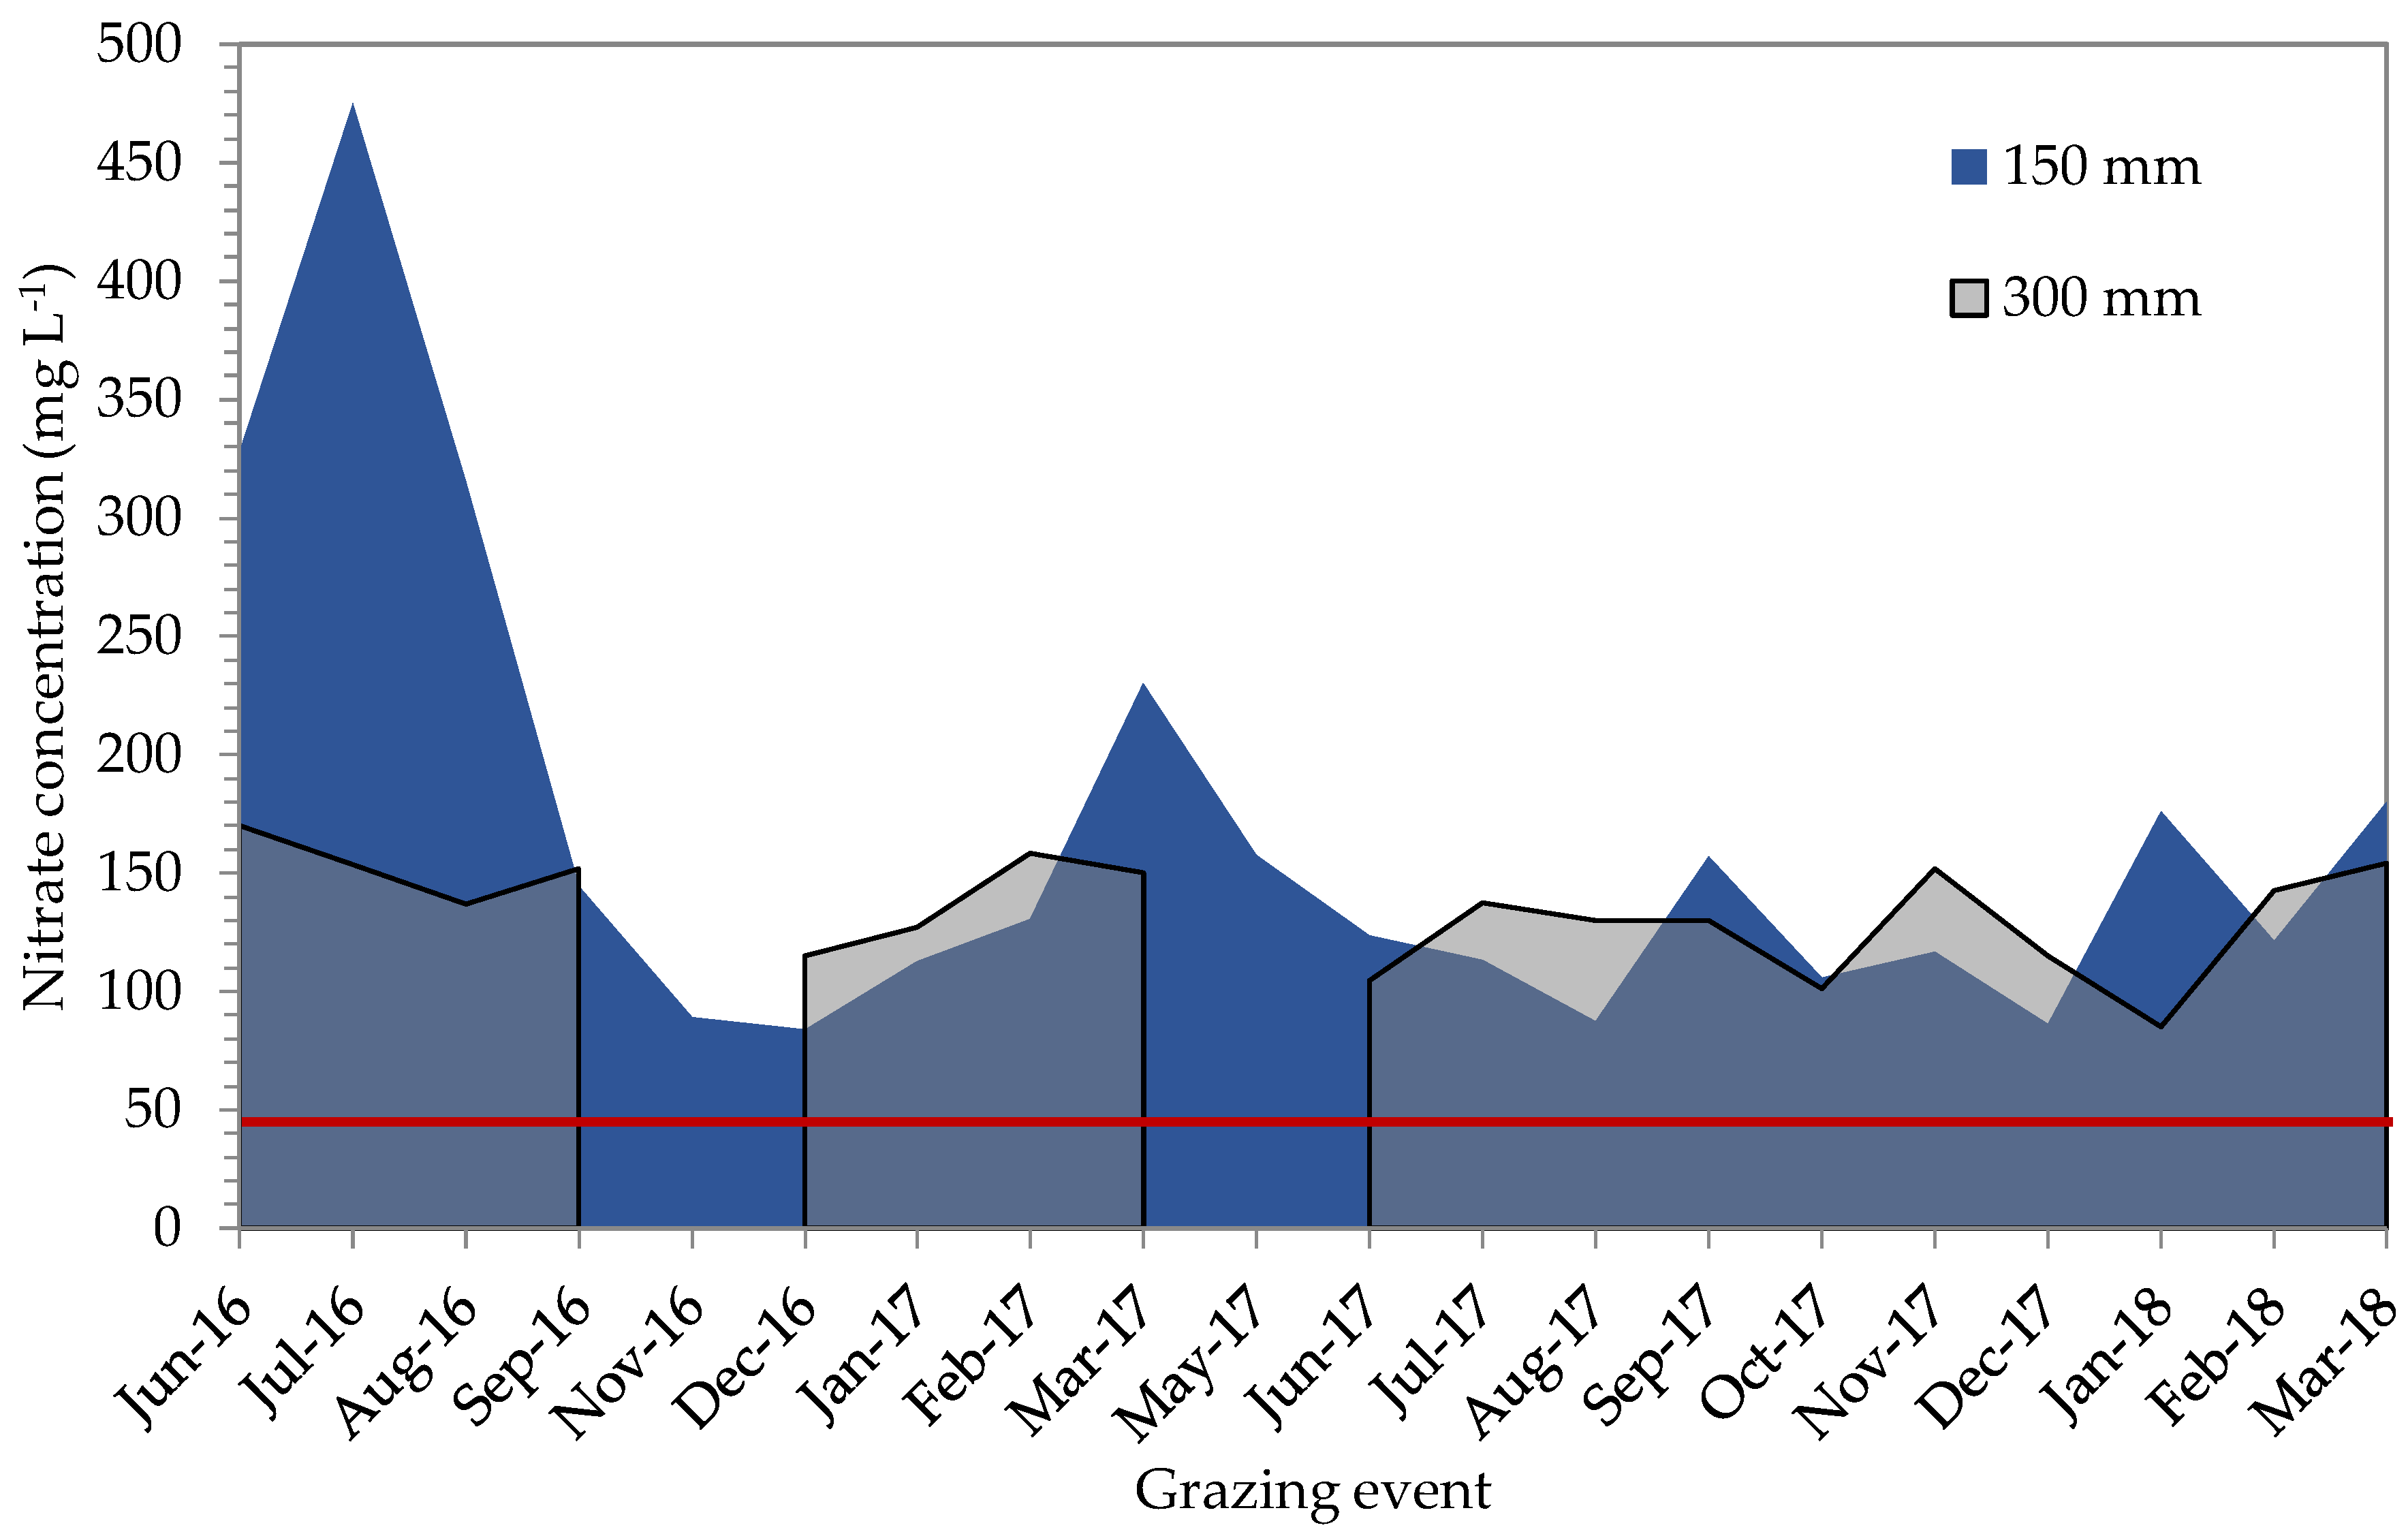
A direct measure of N leaching was not determined in the current study, but the use of the Wetting Front Detector (WFD) allowed an estimation of the amount of nitrate available in the soil water at 150 and 300 mm soil depths. As nitrate is negatively charged, leaching often occurs [40]. High N rates in the current study resulted in a high mineral N content in soil, which, if present in nitrate form, is at risk of being lost to the deeper soil layers [37]. Even with no N fertilisation, the nitrate concentration of the soil water solution at a 300 mm depth was higher than the allowable nitrate concentration in soil water in Europe [41] and in South African drinking water [42], suggesting that the soil has a significant amount of residual N available to be used by the pasture. In addition to the nitrate concentration, the total mineral soil N at the three respective depths also points to a build-up of mineral N in treatments that received more than 40 kg N ha−1 grazing−1.

2.6. Potentially Mineralisable Nitrogen in the Soil

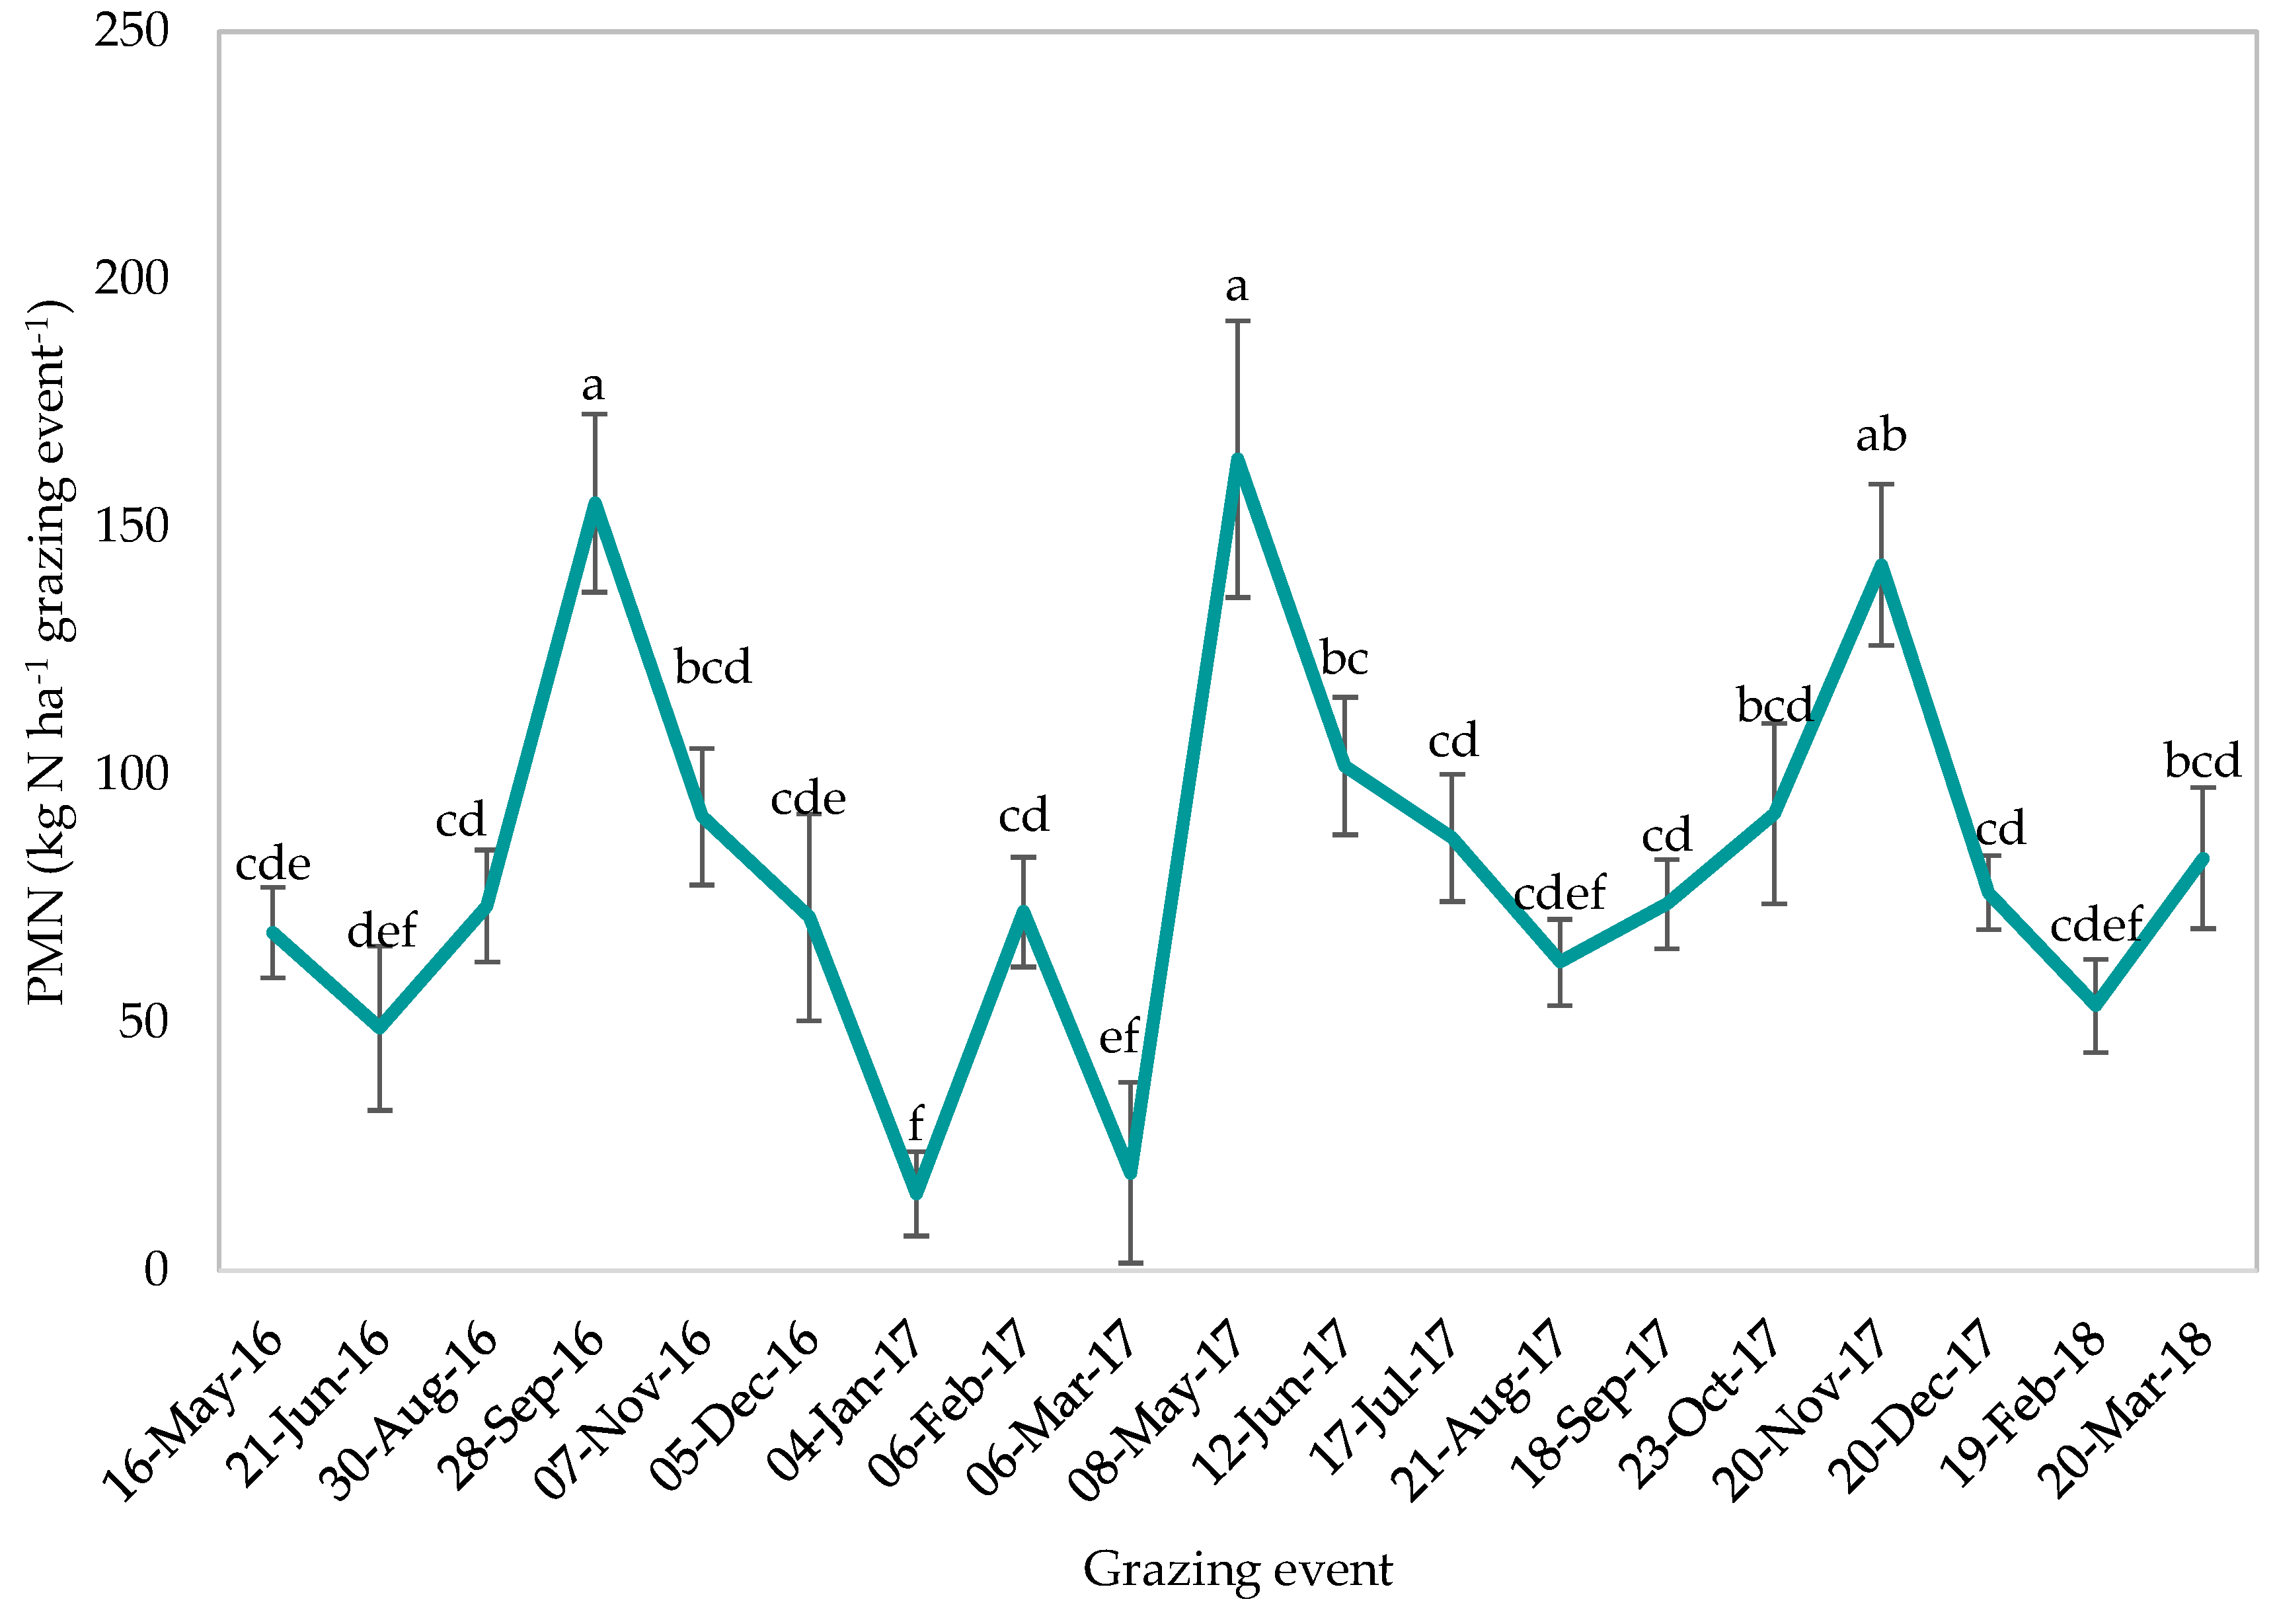
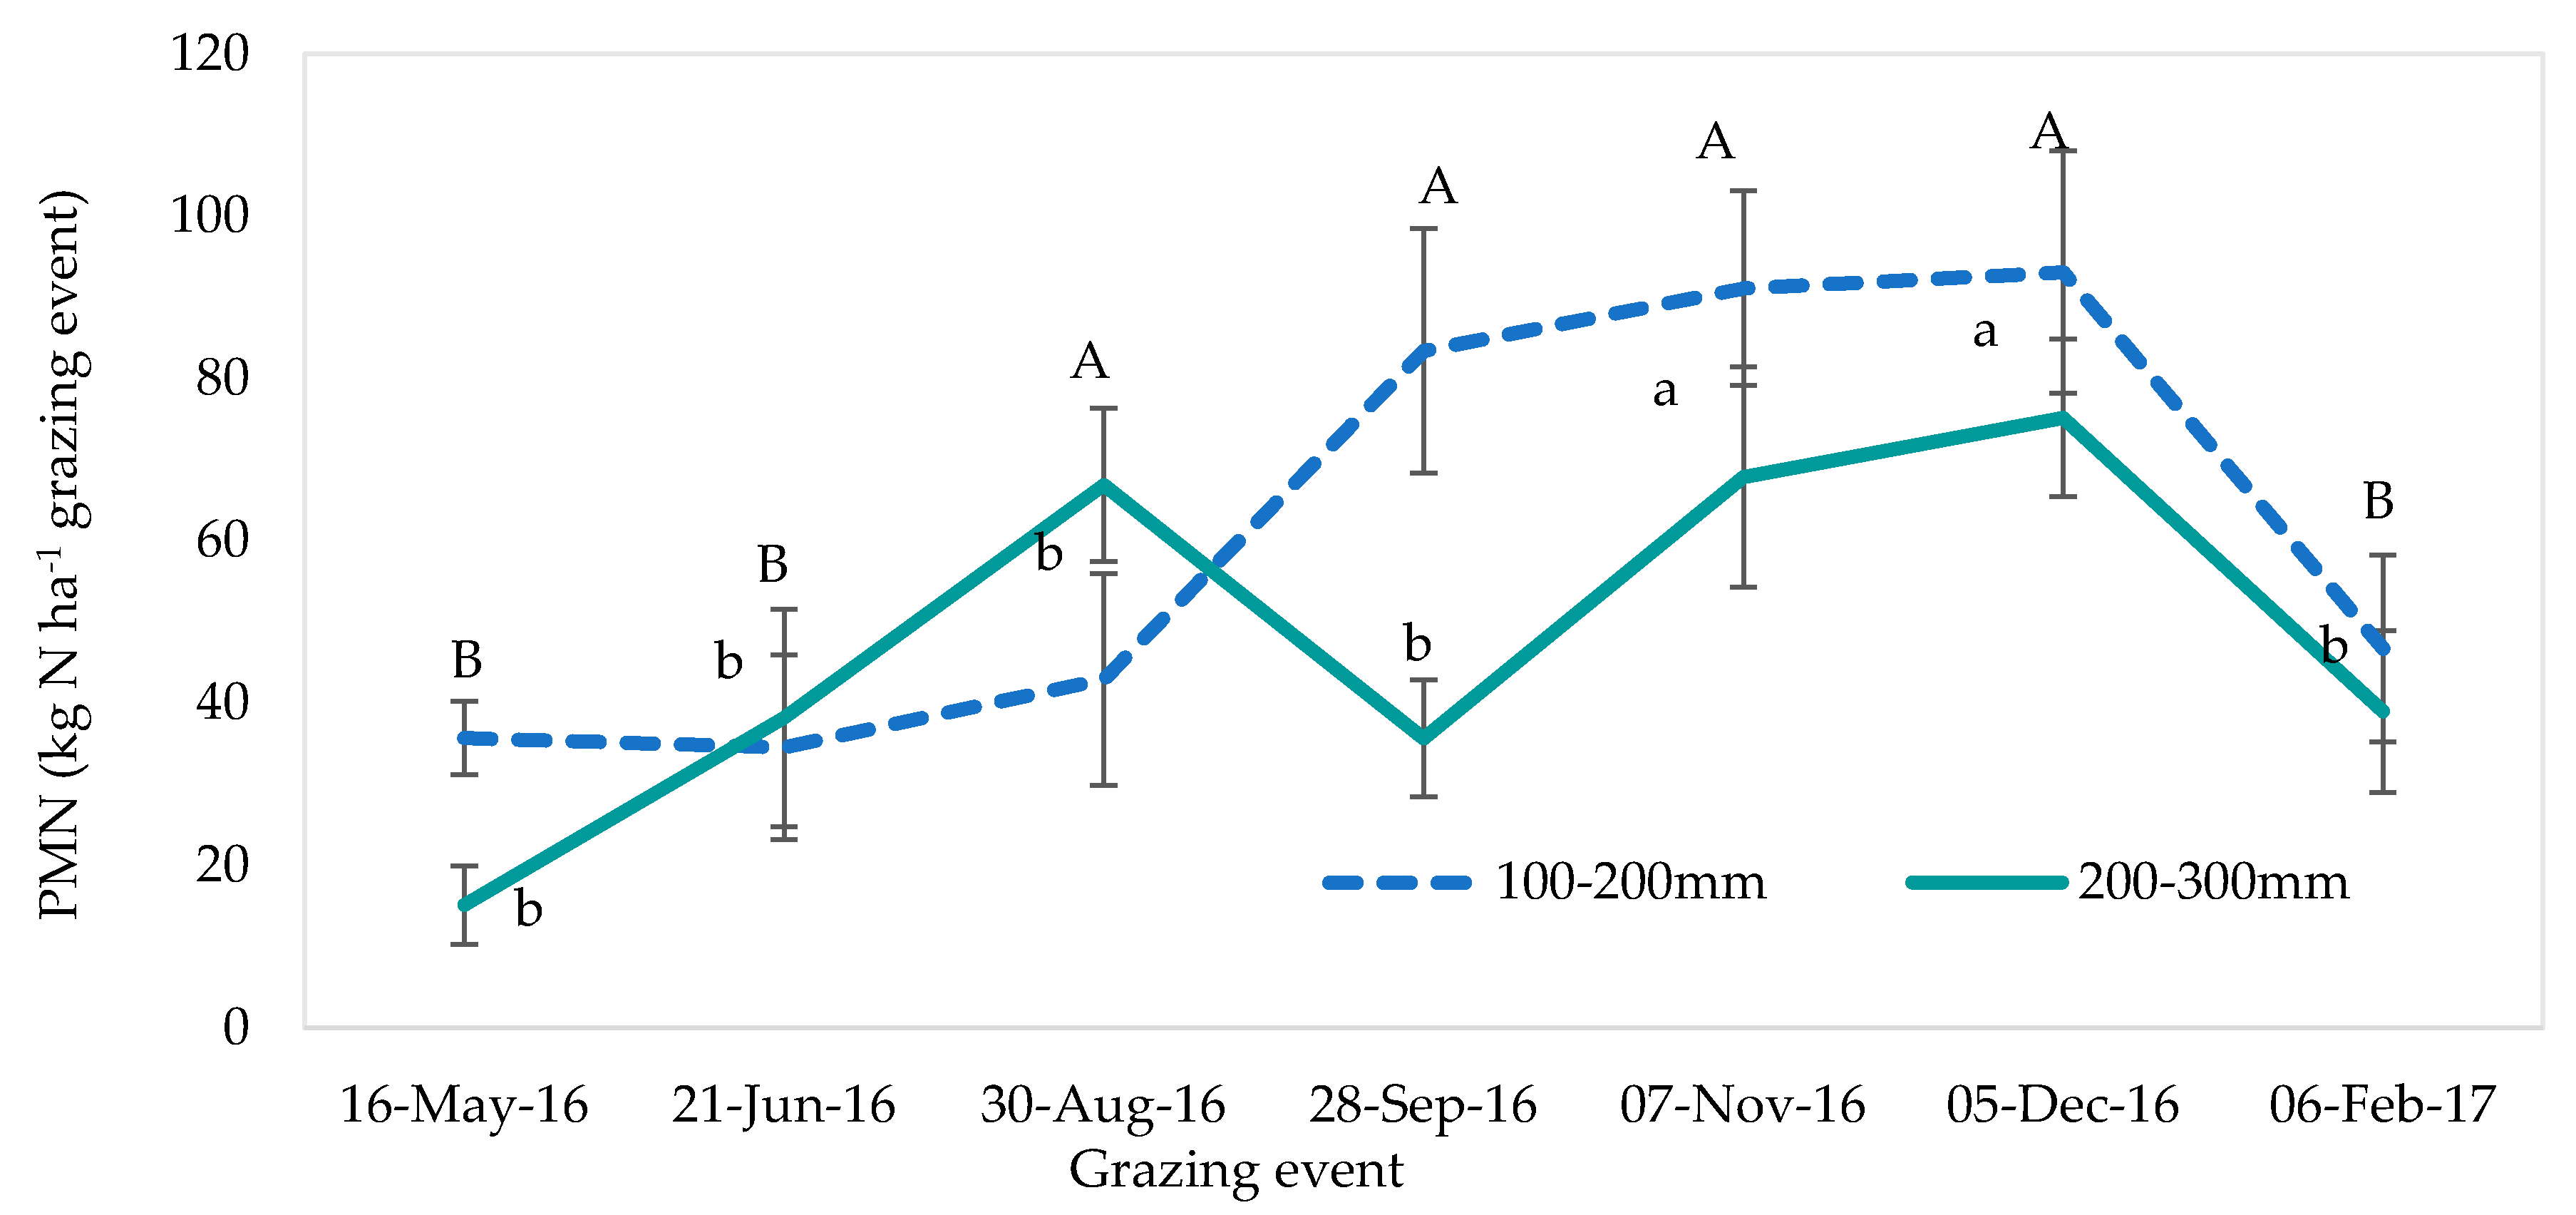
Potentially mineralisable N (PMN) was calculated to give an estimation of the ability of the soil to supply N. The time of grazing influenced (p < 0.05) the PMN at all depths, while N treatments did not have an effect on the potential of the soil to mineralise N (Table 2 and Figure 7 and Figure 8). There was a trend for PMN to be higher in the spring of both years and mid-winter during year 2. A minimal response in PMN was seen in 100–200 and 200–300 mm soil layers.
The lack of response of PMN at the extremes of N fertilisation treatments in this study was unexpected. According to Fulkerson et al. [43], N mineralisation in temperate climates can account for 20–120 kg N ha−1 year−1 available for plant uptake. In the current study, it was found that 15–163 kg ha−1 grazing event−1 is available for plants, depending on the sampling date. The soil N reserve thus has the ability to supply plants with a significant amount of N. There is a possible financial saving that can be achieved by not applying N due to the potential of the soil to supply N through microbial-mediated mineralisation (i.e., healthy soils; see [44]), which is sufficient to sustain pasture growth or could at least partially replace N from fertilisation.

2.7. Urease Activity

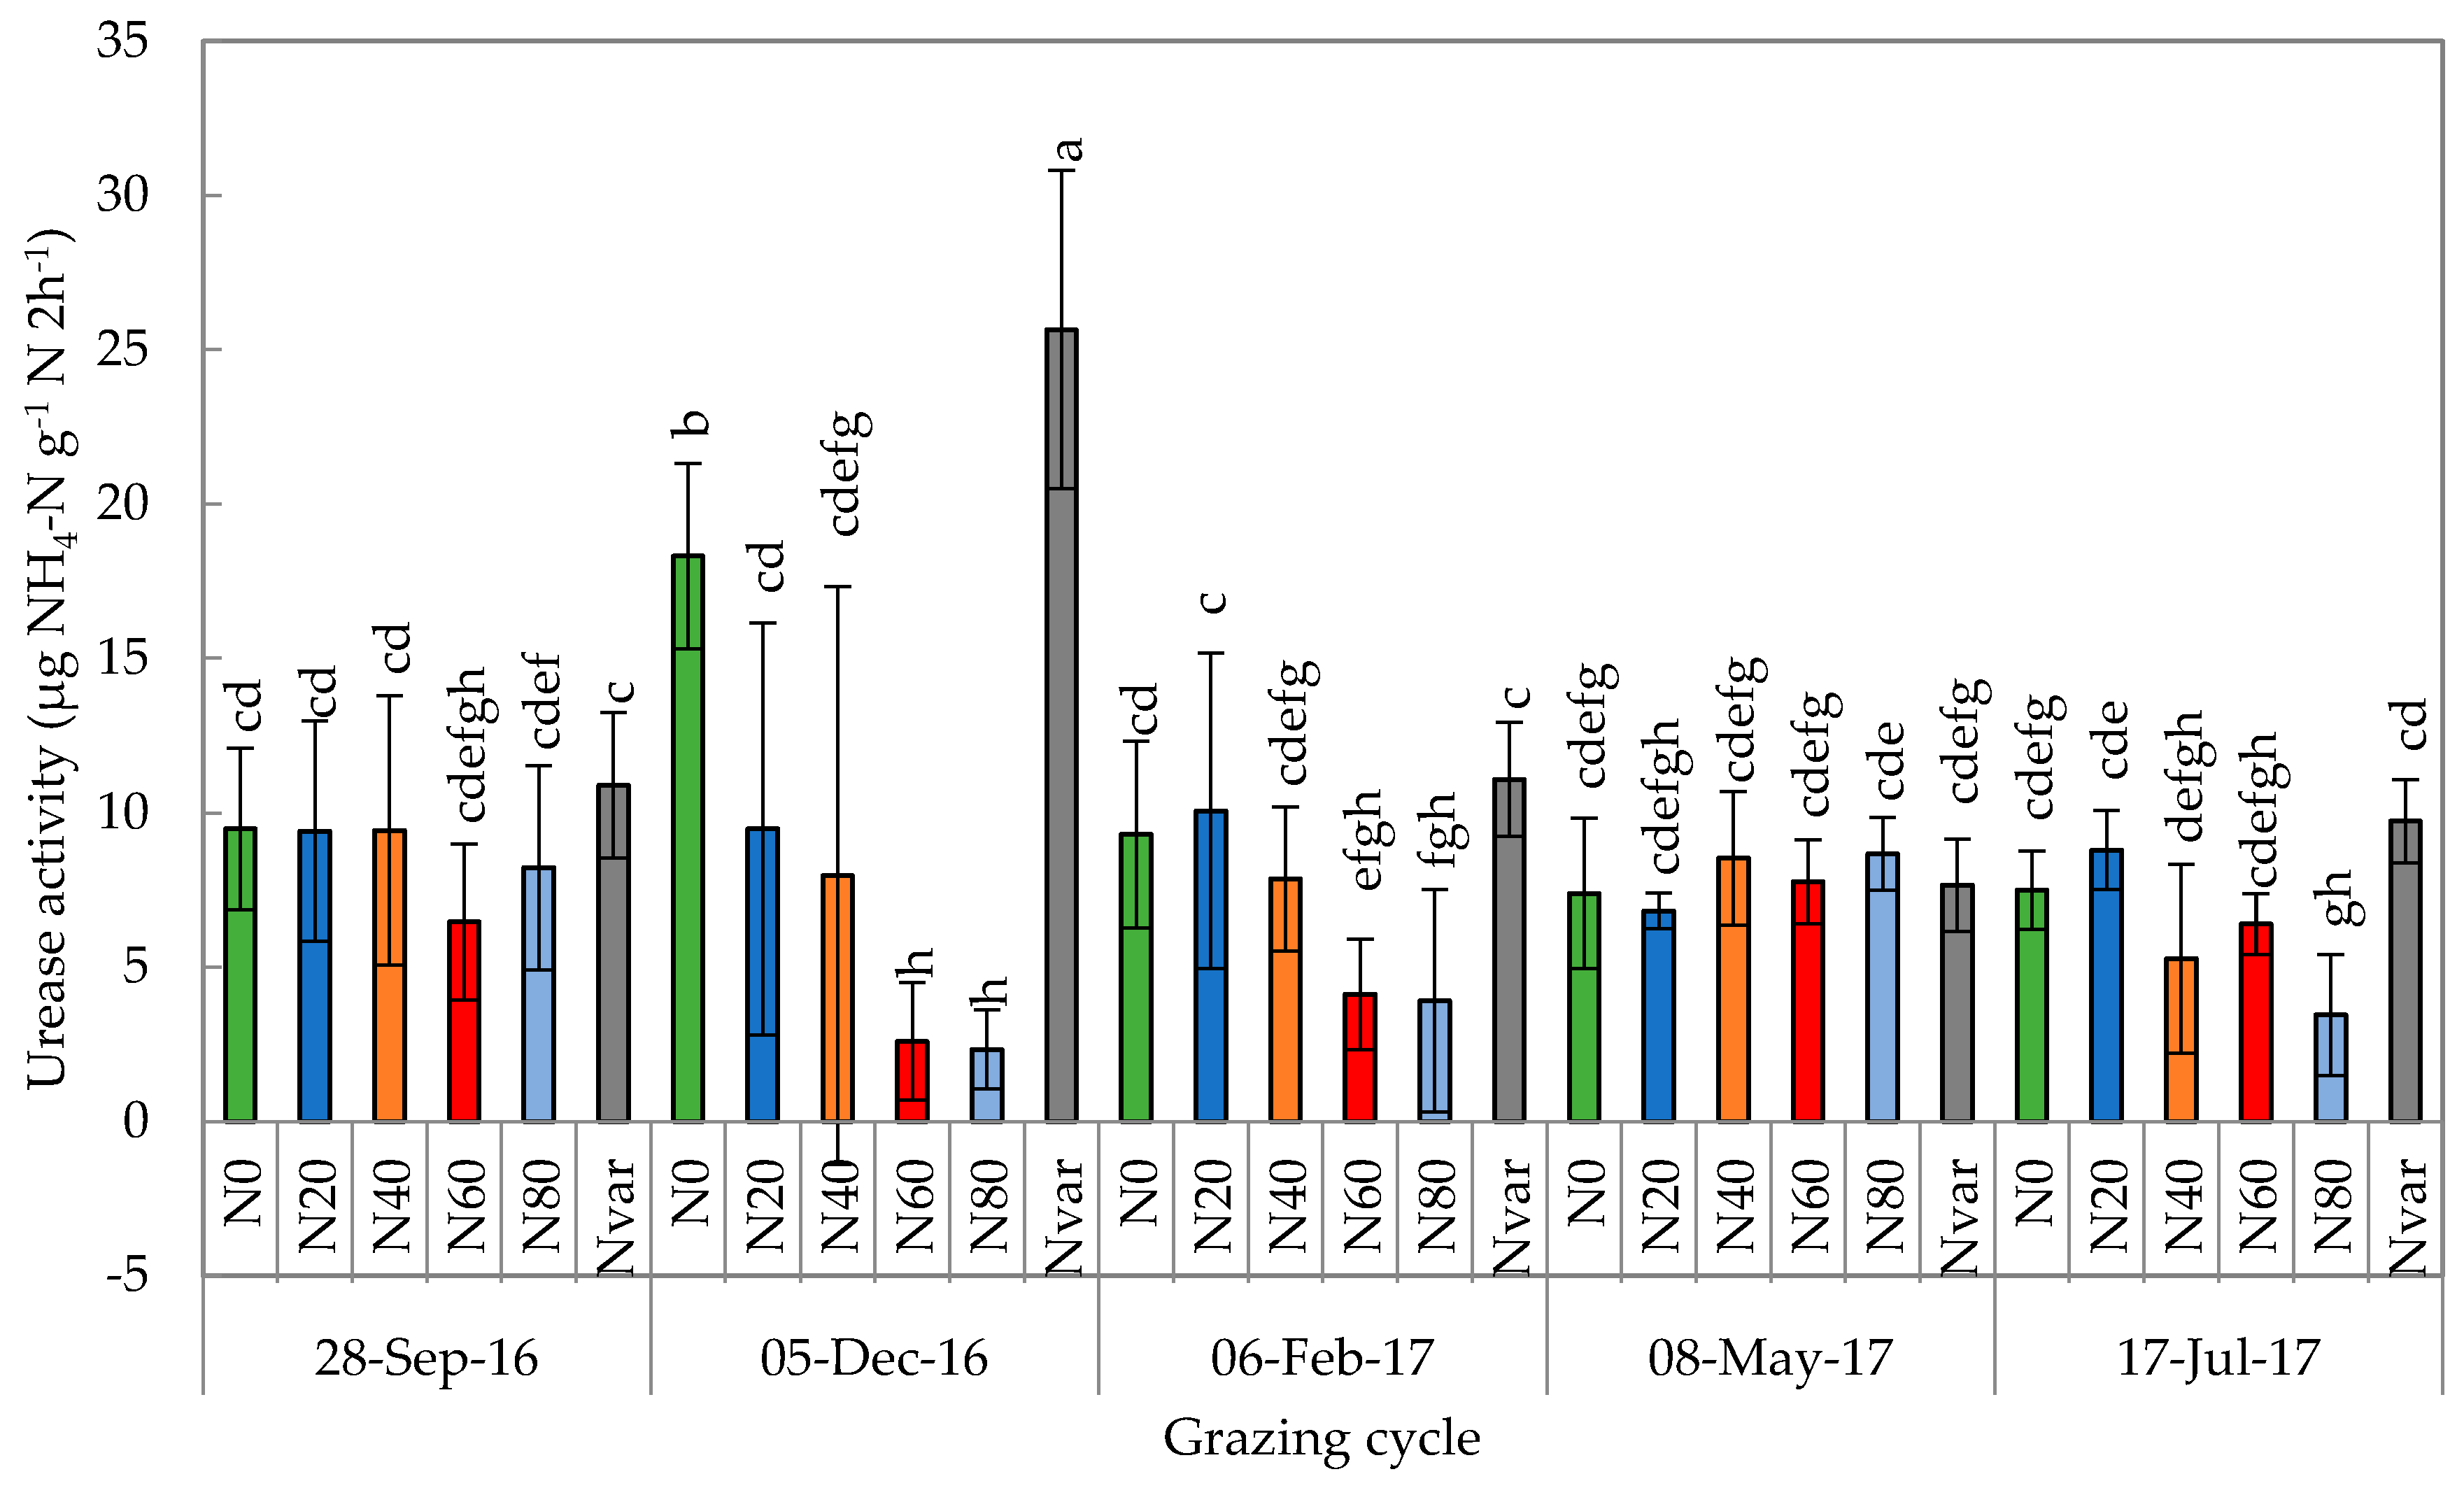
The potential of the soil to convert organic N to plant-available N was quantified by the urease activity. The response of urease activity to N treatment varied (p < 0.05) between the time of grazing at the 0–100 mm depth (Table 2 and Figure 9). During grazing events that occurred within summer, the low N rates (N0, N20, and Nvar) had 1.4 to 12.5 times greater (p < 0.05) activity compared to the high N rates (N60 and N80). During the cooler months, there were no treatment responses (p ≥ 0.05). Where high amounts of inorganic fertiliser were applied, the urease activity decreased. Other authors have reported higher urease activity in treatments where no N was applied [45] or when high amounts of organic material were added to the soil [46,47] compared to chemically fertilised plots [48]. This supports the postulation that the urease enzyme is unnecessary in the presence of mineral forms of N. Applying lower amounts of N helps to maintain the ability of soil microbes to supply plant-available N [49]. The suppression of urease activity, which is indicative of reduced microbial activity, was more evident at N rates above 40 kg N ha−1 grazing−1 in the current study. Becker et al. [49] also found that microbes that immobilise N and release soil carbon are favoured when high rates of N are applied to canola (Brassica napus).

2.8. Synthesis

The results demonstrate an N-saturated system. Pastures in the southern Cape of South Africa could be productively managed at lower N fertiliser rates of less than 200 kg N ha−1 year−1. Nitrogen fertiliser rates should be adjusted according to the specific season as the plant’s demand for N and the soil’s ability to release N differ between seasons. The soil has a significant N reserve, which could be used by the pasture to sustain productivity. The evaluation of different N fertiliser rates in the current study showed that adjusting the current N fertiliser guidelines in a grazed system downwards could maintain a favourable crude protein percentage, without majorly compromising pasture production. The urease activity (soil microorganism activity) will be higher at low rates of N fertiliser, whereby the soil will be able to release N through mineralisation, which can be used by the pasture. If the total mineral N in the soil is considered, rates above 40 kg N ha−1 can result in inefficient N use and an increased possibility of losses. The ANUE was similar between treatments, and the botanical composition was, with the exception of legume contributions, mostly influenced by season rather than the N rate. The benefit of biological N fixation from volunteer clovers can be captured at low N rates—generally at 20 kg N ha−1 or less. With a flexible fertilisation regime, producers could increase the profitability and environmental sustainability on the farm with a lowered N input, while still maintaining DM production rates.
Although higher yields could be obtained at higher N rates (N60 and N80) in some seasons, the financial implication and return on investment should be critically investigated to prevent financial losses. The total cost of pasture production where 350 kg N is applied per ha is approximately ZAR12 000 (650US$) per year, of which 30% is N fertiliser. A considerable amount could be saved if N fertiliser rates are reduced, which could make the systems more profitable. An economical evaluation of N usage in the southern Cape of South Africa is beyond the scope of this study, but warrants further investigation.
It is important when interpreting the results to consider that the study was only conducted for two years. Long-term effects of different N treatments and the ability of the soil reserve to supply N should be investigated further through longer-term studies. Additionally, the study was also only carried out on one soil type on irrigated pasture, thereby excluding the assessment of other soil types and dryland pasture production. However, the soil type is representative of the dominant soil type in the southern Cape region. This study is the first step in the re-evaluation of N under the current management systems and a starting point for research which requires further refinement. It is not known whether lower applications will result in nutrient mining or if the soil biology will be able to sustain pasture production with a lower mineral N input.
The end goal is to move to a system where the application of nutrients only occurs where it is needed and applied at rates required to replenish the system and maintain productivity. Precision technologies have a variety of benefits, such as the ability to support sustainable intensification and reduce costs [50]. Applying N fertiliser based on an expansion of agro-ecological information improved the efficiency of N utilisation and did not have a significant effect on herbage production [29]. Shalloo et al. [50] concluded, in a review, that the increased utilisation of pasture is one of the main forces for increased profitability [51]. An increased adoption of precision technologies within a dairy system was seen where technologies decrease labour, especially with large cow numbers [52]. The need for producers to understand the value of certain precision technologies in both economic and environmental spheres to facilitate the adoption of these technologies is emphasised [52].

3. Materials and Methods

3.1. Site Description

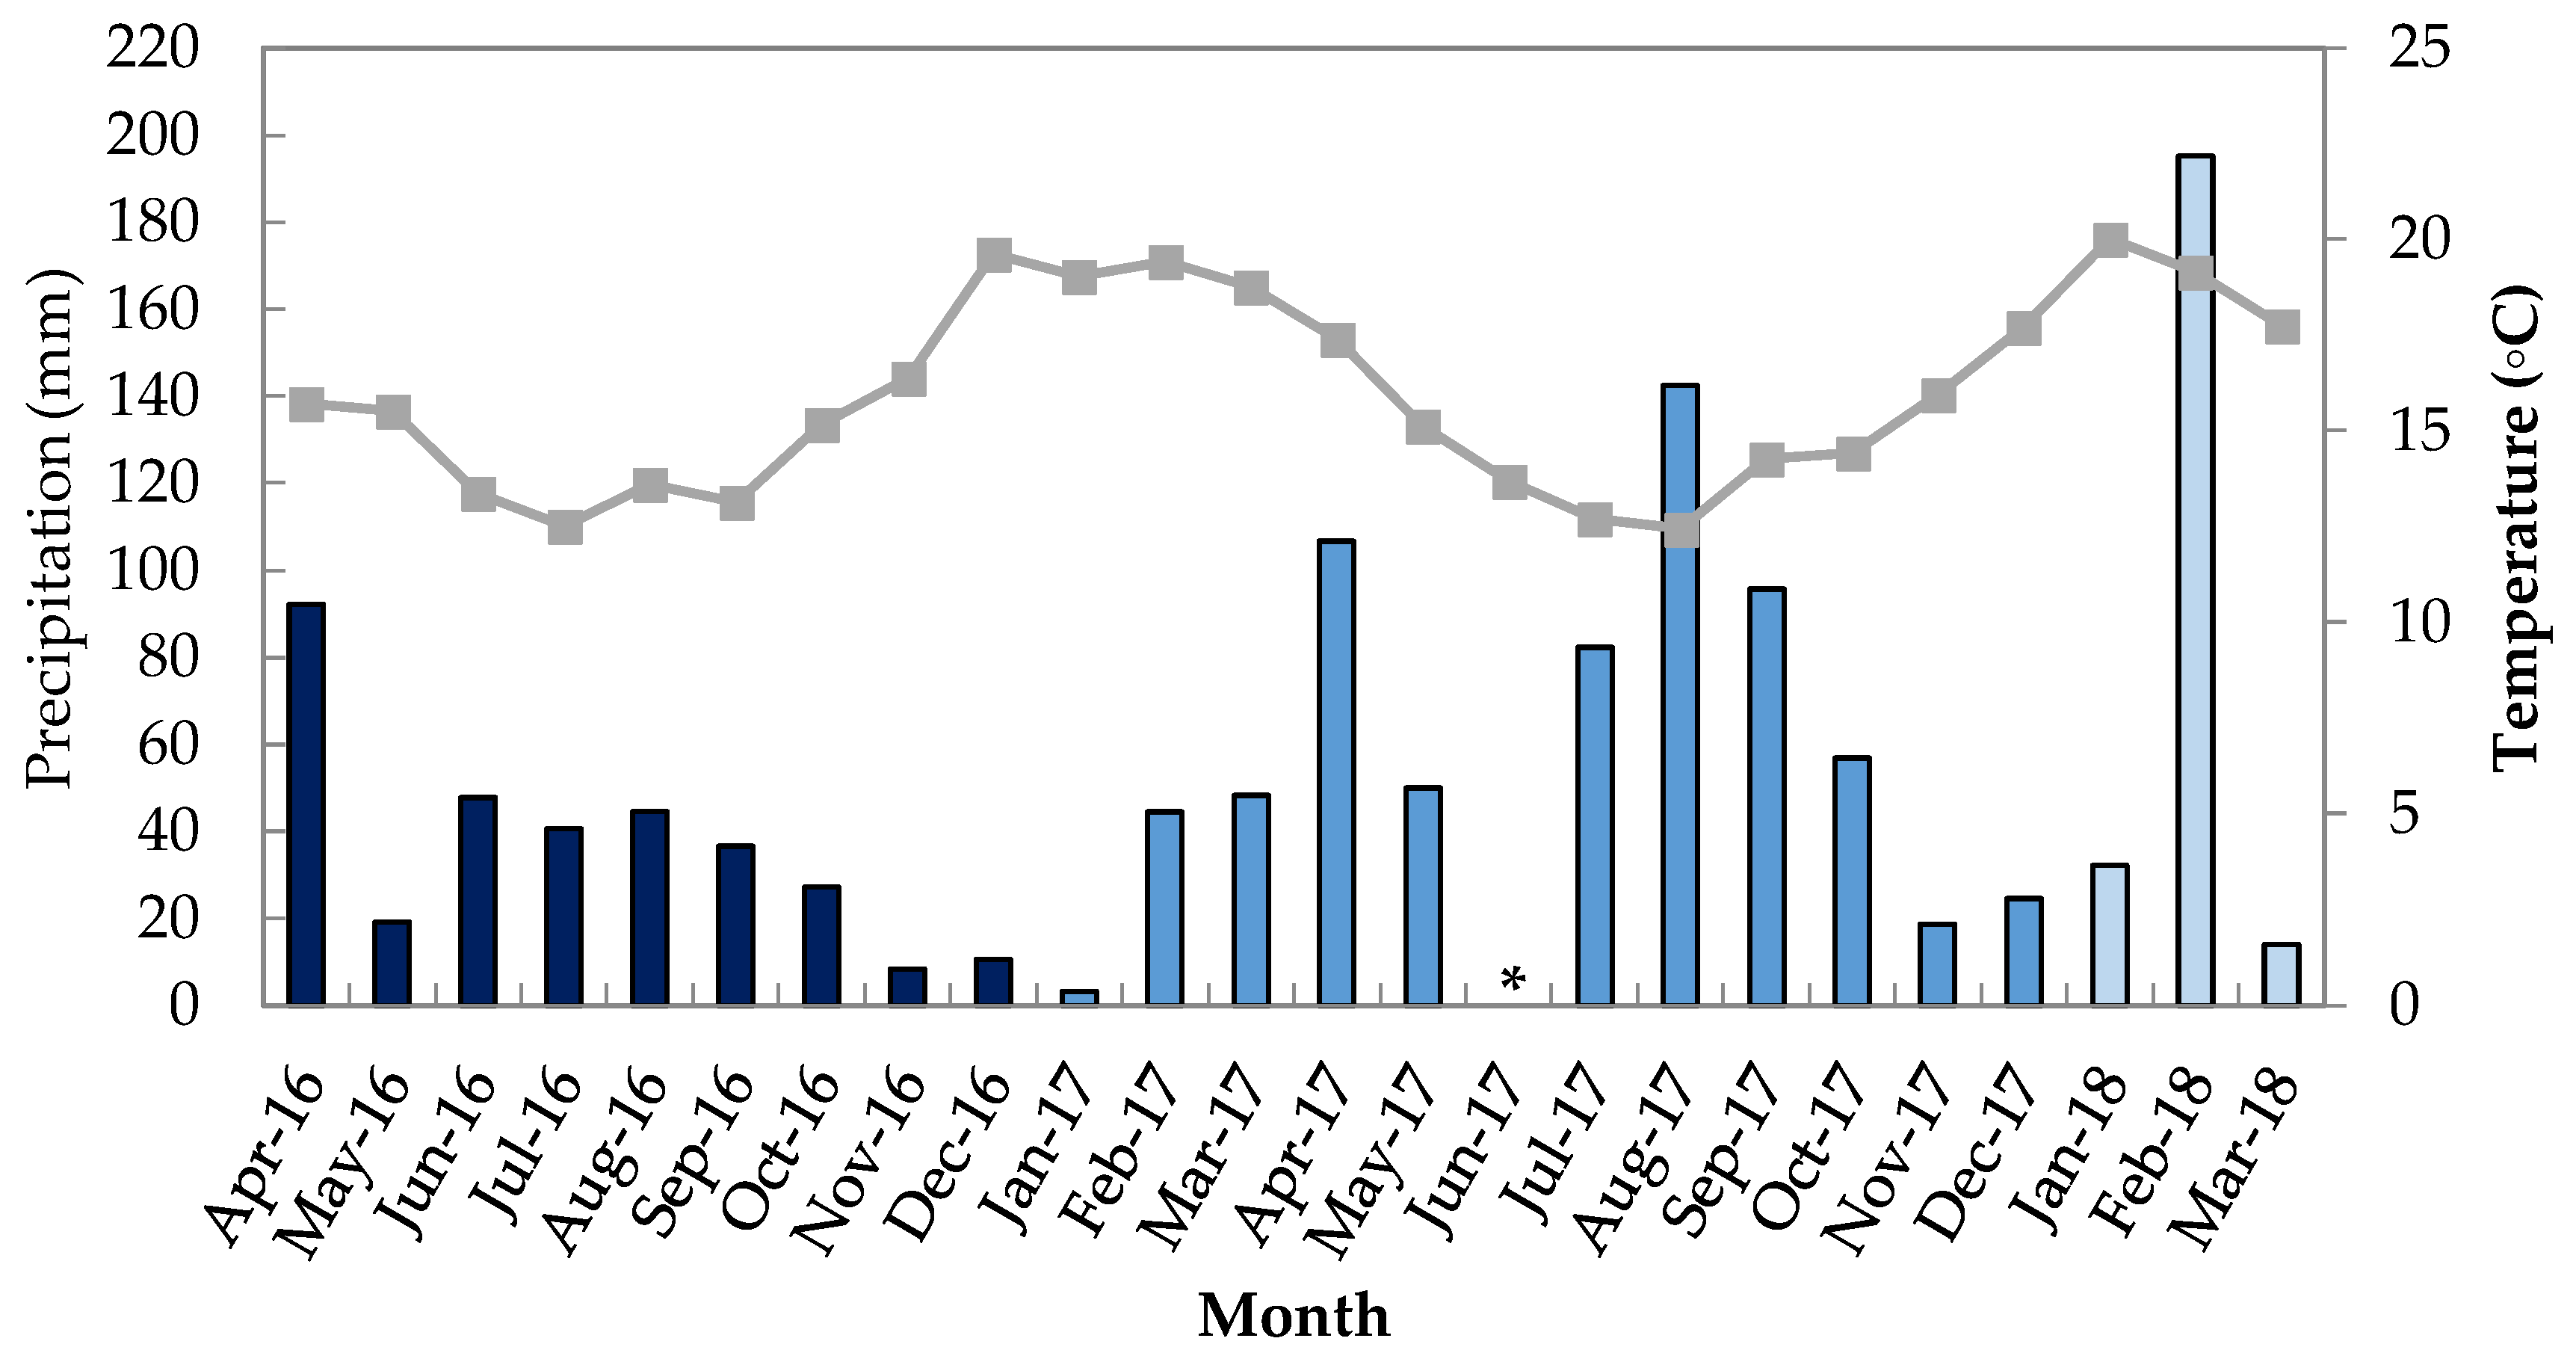
The research was conducted from 4 April 2016 to 20 March 2018 on Outeniqua Research Farm (33 58′ 38” S, 22 25′ 16” E) near George in the Western Cape province of South Africa (201 m altitude, 8 km from the Indian Ocean). The region has a temperate climate, with rain distributed throughout the year. The mean daily temperatures range between 7 and 18 °C in winter and 15 to 25 °C in summer, with a mean total annual precipitation of 728 mm [44]. Temperature and precipitation during the current study are presented in Figure 10. The soil at the study site is classified as a Podzol soil [53] or Spodosol [54] of a Witfontein soil form [55]. There are signs of underlying wetness (300–600 mm). The soil has an orthic A horizon (0–200 mm) and podzol B horizon (200–300 mm). The long-term management of the site is a kikuyu-based pasture under no-tillage management practices that have been conducted for more than 10 years.

3.2. Experimental Layout and Treatments

The trial was laid out as a randomised block design, with four blocks and six N fertilisation treatments within each block, totalling 24 experimental plots, where each plot was 15 × 15 m in dimensions (Table 3). The blocks were separated with electric fencing to facilitate grazing management.
Nitrogen was applied by hand in the form limestone ammonium nitrate (LAN) at five fixed rates and a variable rate. The five fixed rates consisted of a control (no N) and 20, 40, 60 and 80 kg N ha−1 applied after every grazing event. The annual N application rates are shown in Table 1. Grazing and pasture management will be discussed in Section 3.3. The variable rate (Nvar) was dependent on the nitrate concentration of the soil water.
The Nvar treatment was based on the nitrate concentration of the soil water determined by inserting two Fullstop™ Wetting Front Detectors (WFDs) in each variable rate plot into the soil: one WFD at a 150 mm depth and one WFD at a 300 mm depth [56]. That equates to a total of eight WFDs in the study: four at each depth, and two in each Nvar plot. Fessehazion et al. [57] found that more than 80% of the roots occurred in the top 300 mm and 98% in the top 600 mm for a well-drained, deep soil in KwaZulu-Natal, South Africa. Since Outeniqua Research Farm has a shallower soil than the aforementioned one, 150 and 300 mm depths were chosen under the assumption that most of the root biomass occurs at these depths. A WFD is a funnel-shaped passive lysimeter that is used for irrigation scheduling. Free water is produced at the base of the funnel when the soil around the WFD reaches c. −3 kPa. When a sufficient amount of water has flown through the funnel into the reservoir, a float is magnetically latched to indicate that a soil water sample is ready to be retrieved [58]. The soil water sample was collected from each WFD with a syringe as often as the float indicated that a water sample was ready to be retrieved and taken to the lab to measure the nitrate concentration with a Horiba Scientific LAQUAtwin compact water quality meter. The frequency at which water samples were collected from the 150 mm WFD (the four Nvar plots combined) was 82 and 26 from the 300 mm WFD during the course of the two-year study. The variable N application rate treatment was based on the results of nitrate concentration of the 150 mm depth WFD. Fessehazion et al. [59] determined that ryegrass requires a soil water nitrate concentration of 50 mg L−1 for optimum pasture production and quality, which was also the initial assumption for the current study. In addition, the allowable nitrate concentration in drinking water in South Africa is 44.3 mg L−1. In Europe, the allowable nitrate concentration in drinking water is 50 mg L−1, and this is also the allowable concentration of groundwater since many people utilise groundwater as drinking water [41]. Nvar plots showed visual signs of N-deficiency. The pasture displayed slow growth and yellowish pasture and based on these observations, rates of the treatment Nvar were increased N (Table 4). The nitrate concentration was consistently high at both the 150 mm depth (≥250 mg nitrate L−1) and 300 mm depth (≥130 mg nitrate L−1), which resulted in low rates of N fertilisation applications (Figure 11).

3.3. Pasture Management

Prior to ryegrass (Lolium multiflorum cv. Barmultra II) being sown into the existing kikuyu-base (local strain), the pasture was grazed down to 50 mm above ground level. The aboveground material was mulched to ground level. Ryegrass was planted into the kikuyu base on 4 April 2016 and again on 9 March 2017 at 25 kg ha−1 using a minimum-till seed-drill. The planting method has been described in detail by multiple authors [22,60]. No nitrogen was applied at planting to prevent the kikuyu from outgrowing the ryegrass seedlings. Pastures were irrigated with a permanent over-head sprinkler system, according to soil water tension measurements taken by tensiometers maintained between −25 and −10 kPa.
Jersey cows mob-grazed the blocks and fresh pasture was allocated twice per day. The experimental site was therefore grazed over a two-day period. The cows were then removed from the experimental site and offered additional pasture that was not part of the study, to allow proper regrowth. The experimental plots were grazed c. every 28 days during the summer and c. 32 days during winter, resulting in a total of 23 grazing events during the two-year study (Table 1). Pasture allocation was 9–10 kg DM cow−1 day−1 above 30 mm [24,61]. A disc pasture meter was used to estimate the amount of pasture on offer for cows using a regression model developed by van der Colf [62]. The number of cows used for grazing was adjusted, depending on the herbage on offer estimated by the pasture disc meter, with the aim to remove herbage above a 30 mm height. More cows were added if more pasture was available and fewer cows were used if less pasture was available.

3.4. Sampling and Analysis

Just prior (within two days) to cows grazing the pasture, soil and herbage samples were collected from all of the plots for soil and pasture analysis. Five randomly placed rings similar to the size of the disc pasture meter (0.0985 m2) were cut on each plot in order to determine herbage production to a height of 30 mm above ground level from each 225 m2 plot. Samples were oven-dried for 72 h at 60 °C and weighed to determine herbage production per grazing event (kg DM ha−1). The total seasonal production was calculated through the accumulation of herbage production obtained from grazing events that occurred within a specific season. The herbage production of a specific grazing event was considered to fall within a specific season when more than half of the pasture growth period occurred within that season. Seasons were grouped as follows: December, January and February were grouped as summer; autumn included March, April and May; winter included June, July and August; and September, October and November were grouped as spring.
The five dried pasture samples per plot were pooled and milled (SWC Hammer mill, 1 mm sieve) to determine the crude protein content. Total N (%) in the herbage was determined with the Kjeldahl method and multiplied with a factor of 6.25 to determine the crude protein content [63].
To determine seasonal botanical composition, an additional three rings were cut per plot once per season prior to a grazing event. The samples were separated into five classes, namely kikuyu, ryegrass, other grasses, volunteer legumes and weed components. Other grasses included species such as Eragrostis plana, Paspalum urvillei, Poa annua, Bromus catharticus and Sporobolus africana. The majority of the volunteer legumes observed in the pasture were white clover (Trifolium repens), while broadleaf weed species dominated the weed component, with the exception of Cyperus spp. Weeds included Arctotheca calendula, Taraxacum officinale, Stellaria media, Rumex crispus and Urtica spp. Each botanical class was oven-dried for 72 h at 60 °C to determine the dry weight and to calculate the proportional contribution of each class on a DM basis to the herbage production.
The agronomic N use efficiency (ANUE) was used to calculate the seasonal herbage production increase due to applied N of the fixed fertilisation treatments (20, 40, 60 and 80 kg N ha−1) (Equation (1)). The ANUE of variable N application treatment could not be calculated since, more often than not, no N was applied.
ANUE   ( kg   DM   kg 1   N   ha 1 ) = Pasture   production f e r t i l i s e d Pasture   production c o n t r o l N   s u p p l y
A composite soil sample (consisting of three subsamples) was taken from each experimental plot at three soil depth increments viz. 0–100, 100–200 and 200–300 mm. Potentially mineralisable N (PMN) was determined for each soil depth increment using aerobic incubation of samples taken prior to every grazing event [64,65]. The soil mineral N content was determined prior to incubation and after seven days of aerobic incubation at 20 °C and at 75% of the field water capacity. Soil N stocks were calculated using bulk density values reported by previous research [22] conducted at the same experimental site. The soil bulk densities used were 1280, 1519 and 1542 kg m−3 for the 0–100, 100–200 and 200–300 mm depth increments, respectively [22].
Bi-monthly urease activity was determined from soil taken at the 0–100 mm depth for the first year. The soil was incubated with urea according to the method described by Kandeler and Gerber [66]. Urease activity was determined per gram of soil in a two-hour timeframe (μg NH4-N g−1 h−1). Enzyme efficiency, as described in Kotzé et al. [67], was obtained by normalising values. Normalised urease activity was determined by dividing urease activity (μg NH4-N g−1 h−1) by the total mineral N (mg kg−1) to express the microbial activity per milligram of soil N to obtain normalised values (μg NH4-N g−1 N h−1).

3.5. Statistical Analysis

The Restricted Maximum Likelihood (REML) method of mixed models was used to test for differences between treatments. Treatment, time (grazing event or season) and their interaction were specified as the fixed effects, in order to take the repeated measures into account. The F statistic in the ANOVA table was calculated by dividing the mean square for treatments (MST) by the mean square for error (MSE). Each F statistic has a Snedecor F-distribution with numerator and denominator degrees of freedom, i.e., degrees of freedom for treatments and degrees of freedom for error. The block was specified as a random effect. The means were separated using Fishers’ Protected Least Significant Difference (LSD) test, but only if the Bonferroni post-hoc test indicated significance at a 5% significance level [68,69]. Data was analysed by STATISTICA version 13.2 [70]. For a better overall interpretation of the botanical composition, these components were analysed using non-metric multidimensional scaling. The Bray–Curtis/Whittaker dissimilarity matrix was used to visualise how dissimilar the botanical compositions were. The statistical programme R (version 3.3.2, package vegan and function monoMDS) was used for this analysis. The appropriate number of axes for each ordination was determined using a scree plot of ordination stress using the function dimcheckMDS. An ordination stress of less than 0.2 was maintained to ensure that no more dimensions were added that did not give extra information with regards to the season and N application rate.

4. Conclusions

Nitrogen fertiliser rates of less than 200 kg N ha−1 year−1 are suggested to productively manage kikuyu-ryegrass pasture systems in the southern Cape of South Africa. Nitrogen fertiliser rates should be adjusted according to the specific season, as the plant’s demand for N and the soil’s ability to release N differ between seasons. Many advantages are observed when lower N fertiliser rates are applied, such as a favourable crude protein content, while pasture production is sustained. The pasture productivity and soil health could be sustained as the soil has the potential to supply significant amounts of N to plants through microbially-driven mineralisation processes in soil. Low N rates, generally 20 kg N ha−1 grazing event−1 or less, increased the contribution of volunteer clovers, with additional benefits being obtained through biological N fixation and the increased pasture quality.

Author Contributions

Conceptualization, P.A.S.; methodology, P.A.S. and J.v.d.C.; investigation, C.V.; resources, P.A.S. and J.v.d.C.; data curation, C.V.; writing—original draft preparation, C.V.; writing—review and editing, P.A.S. and J.v.d.C.; supervision, P.A.S. and J.v.d.C.; project administration, all authors; funding acquisition, P.A.S. and J.v.d.C. All authors have read and agreed to the published version of the manuscript.

Acknowledgments

The Agricultural Research Trust, Western Cape Department of Agriculture and Stellenbosch University Department of Agronomy are hereby thanked for financial assistance. The Western Cape Department of Agriculture is thanked for providing the use of the Outeniqua Research Farm as the study site. DG Nel and C MacLaren are thanked for the statistical analyses. Stephano Haarhoff is thanked for critically reviewing the manuscript prior to submission.

Conflicts of Interest

The authors declare no conflicts of interest.

References

  1. Garcia, S.C.; Islam, M.R.; Clark, C.E.F.; Martin, P.M. Kikuyu-based pasture for dairy production: A review. Crop Pasture Sci. 2014, 65, 787–797. [Google Scholar] [CrossRef]
  2. Marais, J.P. Factors affecting the nutritive value of kikuyu grass. Trop. Grassl. 2001, 35, 65–84. [Google Scholar]
  3. van der Colf, J.; Botha, P.R.; Meeske, R.; Truter, W.F. Seasonal dry matter production, botanical composition and forage quality of kikuyu over-sown with annual or perennial ryegrass. Afr. J. Range Forage Sci. 2015, 32, 133–142. [Google Scholar] [CrossRef] [Green Version]
  4. Botha, P.R.; Zulu, L.B.; van der Colf, J.; Swanepoel, P.A. Production potential of Italian and Westerwolds ryegrass established at different planting dates. Afr. J. Range Forage Sci. 2015, 32, 153–159. [Google Scholar] [CrossRef]
  5. Botha, P.; Meeske, R.; Snyman, H. Kikuyu over-sown with ryegrass and clover: Dry matter production, botanical composition and nutritional value. Afr. J. Range Forage Sci. 2008, 25, 93–101. [Google Scholar] [CrossRef]
  6. Brock, J.L.; Kane, G.J. Variability in establishing white clover in pastures on farms. Proc. N. Z. Grassl. Assoc. 2003, 65, 223–228. [Google Scholar]
  7. Schlueter, D.; Tracy, B. Sowing Method Effects on Clover Establishment into Permanent Pasture. Agron. J. 2011, 104, 1217–1222. [Google Scholar] [CrossRef] [Green Version]
  8. Caradus, J.R.; Woodfield, D. Overview and vision for white clover white clover: New Zealand’s competitive edge. Spec. Publ.-Agron. Soc. N. Z. 1995, 11, 1–6. [Google Scholar]
  9. Beyers, C.D.L. Die bemesting van aangeplante weidings. Weidings Pastures. Winterreën Spes. Uitgawe Elsenbg. Dep. Agric. 1994, 5, 86–93. [Google Scholar]
  10. Romera, A.J.; Levy, G.; Beukes, P.C.; Clark, D.A.; Glassey, C.B. A urine patch framework to simulate nitrogen leaching on New Zealand dairy farms. Nutr. Cycl. Agroecosyst. 2012, 92, 329–346. [Google Scholar] [CrossRef]
  11. Christie, K.M.; Smith, A.P.; Rawnsley, R.P.; Harrison, M.T.; Eckard, R.J. Simulated seasonal responses of grazed dairy pastures to nitrogen fertilizer in SE Australia: Pasture production. Agric. Syst. 2018, 166, 36–47. [Google Scholar] [CrossRef]
  12. Swanepoel, P.A.; du Preez, C.C.; Botha, P.R.; Snyman, H.A. A critical view on the soil fertility status of minimum-till kikuyu–ryegrass pastures in South Africa. Afr. J. Range Forage Sci. 2015, 32, 113–124. [Google Scholar] [CrossRef]
  13. Sistani, K.R.; Adeli, A.; Tewolde, H. Apparent use efficiency of nitrogen and phosphorus from litter applied to bermudagrass. Commun. Soil Sci. Plant Anal. 2010, 41, 1873–1884. [Google Scholar] [CrossRef]
  14. Fertasa, (Fertilizer Association of Southern Africa). Fertilizer Handbook, 8th ed.; Fertilizer Association of Southern Africa: Pretoria, South Africa, 2016. [Google Scholar]
  15. UN. Transforming our World: The 2030 Agenda For Sustainable Development; United Nations: New York, NY, USA, 2015. [Google Scholar]
  16. Pannell, D.J. Economic perspectives on nitrogen in farming systems: Managing trade-offs between production, risk and the environment. Soil Res. 2017, 55, 473–478. [Google Scholar] [CrossRef]
  17. Monjardino, M.; McBeath, T.; Ouzman, J.; Llewellyn, R.; Jones, B. Farmer risk-aversion limits closure of yield and profit gaps: A study of nitrogen management in the southern Australian wheatbelt. Agric. Syst. 2015, 137, 108–118. [Google Scholar] [CrossRef]
  18. Sutton, M.A.; Oenema, O.; Erisman, J.W.; Leip, A.; van Grinsven, H.; Winiwarter, W. Too much of a good thing. Nature 2011, 472, 159–161. [Google Scholar] [CrossRef] [Green Version]
  19. Foote, K.J.; Joy, M.K.; Death, R.G. New Zealand Dairy Farming: Milking Our Environment for All Its Worth. Environ. Manag. 2015, 56, 709–720. [Google Scholar] [CrossRef]
  20. Adenuga, A.; Davis, J.; Hutchinson, G.; Donnellan, T.; Patton, M. Valuing Agricultural Externalities: Nitrogen Surplus in the Dairy Sector on the Island of Ireland. In Proceedings of the 30th International Conference of Agricultural Economists (IAAE), Vancouver, BC, Canada, 28 July–2 August 2018. [Google Scholar]
  21. Pretty, J.N.; Brett, C.; Gee, D.; Hine, R.E.; Mason, C.F.; Morison, J.I.L.; Raven, H.; Rayment, M.D.; Van Der Bijl, G. An assessment of the total external costs of UK agriculture. Agric. Syst. 2000, 65, 113–136. [Google Scholar] [CrossRef]
  22. Swanepoel, P.A.; Botha, P.R.; Snyman, H.A.; Preez, C.C. Impact of cultivation method on productivity and botanical composition of a kikuyu—Ryegrass pasture. Afr. J. Range Forage Sci. 2014, 31, 215–220. [Google Scholar] [CrossRef]
  23. van der Colf, J. The evaluation of annual ryegrass varieties in the southern Cape: 2014 to 2015. In Proceedings of the Inligtingsdag│Information Day, Outeniqua Research, George, South Africa, 19 October 2016; pp. 15–20. [Google Scholar]
  24. Botha, P.; Meeske, R.; Snyman, H. Kikuyu over-sown with ryegrass and clover: Grazing capacity, milk production and milk composition. Afr. J. Range Forage Sci. 2008, 25, 103–110. [Google Scholar] [CrossRef]
  25. Sun, X.; Luo, N.; Longhurst, B.; Luo, J. Fertiliser Nitrogen and Factors Affecting Pasture Responses. Open Agric. J. 2008, 2, 35–42. [Google Scholar] [CrossRef]
  26. Enriquez-Hidalgo, D.; Gilliland, T.J.; Hennessy, D. Herbage and nitrogen yields, fixation and transfer by white clover to companion grasses in grazed swards under different rates of nitrogen fertilization. Grass Forage Sci. 2016, 71, 559–574. [Google Scholar] [CrossRef]
  27. Clark, D.A.; Harris, S.L. White clover or nitrogen fertiliser for dairying? Spec. Publ. Agron. Soc. N. Z. 1996, 6, 107–114. [Google Scholar]
  28. Bolland, M.D.A.; Guthridge, I.F. Responses of intensively grazed dairy pastures to applications of fertiliser nitrogen in south-western Australia. Aust. J. Exp. Agric. 2007, 47, 927–941. [Google Scholar] [CrossRef]
  29. Smith, A.P.; Christie, K.M.; Rawnsley, R.P.; Eckard, R.J. Fertiliser strategies for improving nitrogen use efficiency in grazed dairy pastures. Agric. Syst. 2018, 165, 274–282. [Google Scholar] [CrossRef]
  30. Nevens, F.; Rehuel, D. Effects of cutting, grazing grass swards on herbage yield, N uptake and residual soil N at different levels of N fertilization. Grass Forage Sci. 2003, 58, 431–449. [Google Scholar] [CrossRef] [Green Version]
  31. Malcolm, B.J.; Moir, J.L.; Cameron, K.C.; Di, H.J.; Edwards, G.R. Influence of plant growth and root architecture of Italian ryegrass (Lolium multiflorum) and tall fescue (Festuca arundinacea) on N recovery during winter. Grass Forage Sci. 2015, 70, 600–610. [Google Scholar] [CrossRef]
  32. Goold, G.J. Effect of nitrogen and cutting interval on production of grass species swards in Northland, New Zealand. N. Z. J. Exp. Agric. 1979, 7, 353–359. [Google Scholar] [CrossRef]
  33. NRC, (National Research Council). Nutrient Requirements of Dairy Cattle, 7th ed.; National Academy Press: Washington, DC, USA, 2001.
  34. Veterinary Medicine: A Textbook of the Diseases of Cattle, Horses, Sheep, Pigs and Goats, 10th ed.; Radostits, O.M.; Gay, C.C.; Hinchcliff, K.W.; Constable, P.D. (Eds.) Saunders Elsevier: London, UK, 2006; ISBN 9788578110796. [Google Scholar]
  35. Olmos Colmenero, J.J.; Broderick, G.A. Effect of dietary crude protein concentration on milk production and nitrogen utilization in lactating dairy cows. J. Dairy Sci. 2006, 89, 1704–1712. [Google Scholar] [CrossRef] [Green Version]
  36. Reid, M.; O’Donovan, M.; Elliott, C.T.; Bailey, J.S.; Watson, C.J.; Lalor, S.T.J.; Corrigan, B.; Fenelon, M.A.; Lewis, E. The effect of dietary crude protein and phosphorus on grass-fed dairy cow production, nutrient status, and milk heat stability. J. Dairy Sci. 2015, 98, 517–531. [Google Scholar] [CrossRef] [PubMed]
  37. Huddell, A.M.; Galford, G.L.; Tully, K.L.; Crowley, C.; Palm, C.A.; Neill, C.; Hickman, J.E.; Menge, D.N.L. Meta-analysis on the potential for increasing nitrogen losses from intensifying tropical agriculture. Glob. Chang. Biol. 2020, 26, 1668–1680. [Google Scholar] [CrossRef] [PubMed]
  38. Maire, J.; Krol, D.; Pasquier, D.; Cowan, N.; Skiba, U.; Rees, R.M.; Reay, D.; Lanigan, G.J.; Richards, K.G. Nitrogen fertiliser interactions with urine deposit affect nitrous oxide emissions from grazed grasslands. Agric. Ecosyst. Environ. 2020, 290, 106784. [Google Scholar] [CrossRef]
  39. Ledgard, S.F.; Penno, J.W.; Sprosen, M.S. Nitrogen inputs and losses from clover/grass pastures grazed by dairy cows, as affected by nitrogen fertilizer application. J. Agric. Sci. 1999, 132, 215–225. [Google Scholar] [CrossRef]
  40. Di, H.J.; Cameron, K.C. Nitrate leaching in temperate agroecosystems: Sources, factors and mitigating strategies. Nutr. Cycl. Agroecosyst. 2002, 64, 237–256. [Google Scholar] [CrossRef]
  41. Directive, N. Council Directive 91/676/EEC of 12 December 1991 concerning the protection of waters against pollution caused by nitrates from agricultural sources. Off. J. 1991, 375, 1–8. [Google Scholar]
  42. DWAF (Department of Water Affairs and Forestry, South Africa). South African Water Quality Guidelines: Volume 1 Domestic Use; Department of Water Affairs and Forestry Private: Pretoria, South Africa, 1996; Volume 1, ISBN 0798853387.
  43. Fulkerson, W.J.; Lowe, K.F.; Hume, D.E. Perennial Forage and Pasture Crops—Establishment and Maintenance. Science 2011, 2, 586–593. [Google Scholar]
  44. Swanepoel, P.A.; Habig, J.; du Preez, C.C.; Snyman, H.A.; Botha, P.R. Tillage effects, soil quality and production potential of kikuyu–ryegrass pastures in South Africa. Grass Forage Sci. 2017, 72, 308–321. [Google Scholar] [CrossRef]
  45. Saha, S.; Prakash, V.; Kundu, S.; Kumar, N.; Mina, B.L. Soil enzymatic activity as affected by long term application of farm yard manure and mineral fertilizer under a rainfed soybean-wheat system in N-W Himalaya. Eur. J. Soil Biol. 2008, 44, 309–315. [Google Scholar] [CrossRef]
  46. Pascual, J.A.; García, C.; Hernandez, T. Lasting microbiological and biochemical effects of the addition of municipal solid waste to an arid soil. Biol. Fertil. Soils 1999, 30, 1–6. [Google Scholar] [CrossRef]
  47. Zaman, M.; Cameron, K.C.; Di, H.J.; Inubushi, K. Navigating wall-sized displays with the gaze: A proposal for cultural heritage. Nutr. Cycl. Agroecosyst. 2002, 63, 275–290. [Google Scholar] [CrossRef]
  48. Liu, E.; Yan, C.; Mei, X.; He, W.; Bing, S.H.; Ding, L.; Liu, Q.; Liu, S.; Fan, T. Long-term effect of chemical fertilizer, straw, and manure on soil chemical and biological properties in northwest China. Geoderma 2010, 158, 173–180. [Google Scholar] [CrossRef]
  49. Becker, F.; MacLaren, C.; Brink, C.J.; Jacobs, K.; Roux, M.R.; Swanepoel, P.A. High nitrogen rates do not increase canola yield and may affect soil bacterial functioning. Agron. J. 2020, 112, 523–536. [Google Scholar] [CrossRef]
  50. Shalloo, L.; Donovan, M.O.; Leso, L.; Werner, J.; Ruelle, E.; Geoghegan, A.; Delaby, L.; Leary, N.O. Review: Grass-based dairy systems, data and precision technologies. Animal 2018, 12, S262–S271. [Google Scholar] [CrossRef] [PubMed] [Green Version]
  51. Bell, L.W.; Hayes, R.C.; Pembleton, K.G.; Waters, C.M. Opportunities and challenges in Australian grasslands: Pathways to achieve future sustainability and productivity imperatives. Crop Pasture Sci. 2014, 65, 489–507. [Google Scholar] [CrossRef]
  52. Gargiulo, J.I.; Eastwood, C.R.; Garcia, S.C.; Lyons, N.A. Dairy farmers with larger herd sizes adopt more precision dairy technologies. J. Dairy Sci. 2018, 101, 5466–5473. [Google Scholar] [CrossRef]
  53. IUSS Working Group. World Reference Base for Soil Resources 2014, Update 2015 International Soil Classification System for Naming Soils and Creating Legends for Soil Maps; FAO: Rome, Italy, 2015. [Google Scholar]
  54. Soil Survey Staff. Keys to Soil Taxonomy, 9th ed.; Department of Agriculture: Washington, DC, USA, 2003. [Google Scholar]
  55. Soil Classification Working Group. Soil Classification: A Taxonomic System for South Africa: Memoirs on the Agricultural Natural Resources of South Africa No. 15; Department of Agricultural Development: Pretoria, South Africa, 1991. [Google Scholar]
  56. Stevens, J.; Stirzaker, R. Wetting Front Detector Transfer of Technology. WRC Report No. KV 246/10; Water Research Comission: Pretoria, South Africa, 2010. [Google Scholar]
  57. Fessehazion, M.K.; Abraha, A.B.; Everson, C.S.; Truter, W.F.; Annandale, J.G.; Moodley, M. Water Use and Nitrogen Application for Irrigation Management of Annual Ryegrass and Kikuyu Pasture Production; Water Research Comission: Pretoria, South Africa, 2012. [Google Scholar]
  58. Stirzaker, R.J. When to turn the water off: Scheduling micro-irrigation with a wetting front detector. Irrig. Sci. 2003, 22, 177–185. [Google Scholar] [CrossRef]
  59. Fessehazion, M.K.; Stirzaker, R.J.; Annandale, J.G.; Everson, C.S. Improving nitrogen and irrigation water use efficiency through adaptive management: A case study using annual ryegrass. Agric. Ecosyst. Environ. 2011, 141, 350–358. [Google Scholar] [CrossRef] [Green Version]
  60. Botha, P. Factors influencing the persistence and production potential of kikuyu (Pennisetum clandestinum) over-sown with different ryegrass and clover species in the southern Cape. Agriprobe 2009, 6, 4–9. [Google Scholar]
  61. van der Colf, J.; Botha, P.R.; Meeske, R.; Truter, W.F. Grazing capacity, milk production and milk composition of kikuyu over-sown with annual or perennial ryegrass. Afr. J. Range Forage Sci. 2015, 32, 143–151. [Google Scholar] [CrossRef] [Green Version]
  62. van der Colf, J. The Production Potential of Kikuyu (Pennisetum Clandestinum) Pastures Over-Sown with Ryegrass (Lolium spp.); University of Pretoria: Pretoria, South Africa, 2011. [Google Scholar]
  63. AOAC. Official Method of Analysis 988.05, 17th ed.; Association of Official Analytical Chemists, Inc.: Rockville, MD, USA, 2000. [Google Scholar]
  64. Cataldo, D.; Haroon, H.; Schrader, L.; Young, V. Rapid colorimetric determination of nitrate in plant tissue by nitration of salicylic acid. Commun. Soil Sci. Plant Anal. 1975, 6, 71–80. [Google Scholar] [CrossRef]
  65. Keeney, D.R.; Nelson, D.W. Nitrogen-Inorganic Forms. In Methods of Soil Analysis: Part 2, Chemical and Microbiological Properties—Agronomy Monograph no. 9; ASA-SSSA, 677 S.; Segoe Rd.: Madison, WI, USA, 1982. [Google Scholar]
  66. Kandeler, E.; Gerber, H. Short-term assay of soil urease activity using colorimetric determination of ammonium. Biol. Fertil. Soils 1988, 6, 68–72. [Google Scholar] [CrossRef]
  67. Kotzé, E.; Sandhage-Hofmann, A.; Amelung, W.; Oomen, R.J.; du Preez, C.C. Soil microbial communities in different rangeland management systems of a sandy savanna and clayey grassland ecosystem, South Africa. Nutr. Cycl. Agroecosyst. 2017, 107, 227–245. [Google Scholar]
  68. Glass, G.V.; Peckham, P.D.; Sanders, J.R. Consequences of failure to meet assumptions underlying the fixed effects analyses of variance and covariance. Rev. Educ. Res. 1972, 42, 237–288. [Google Scholar] [CrossRef]
  69. Snedecor, G.W.; Cochran, W.G. Statistical Methods, 7th ed.; Iowa State University Press: Ames, IA, USA, 1980. [Google Scholar]
  70. Statistica (Data Analysis Software System), Version 13; TIBCO Software: Palo Alto, CA, USA, 2017.
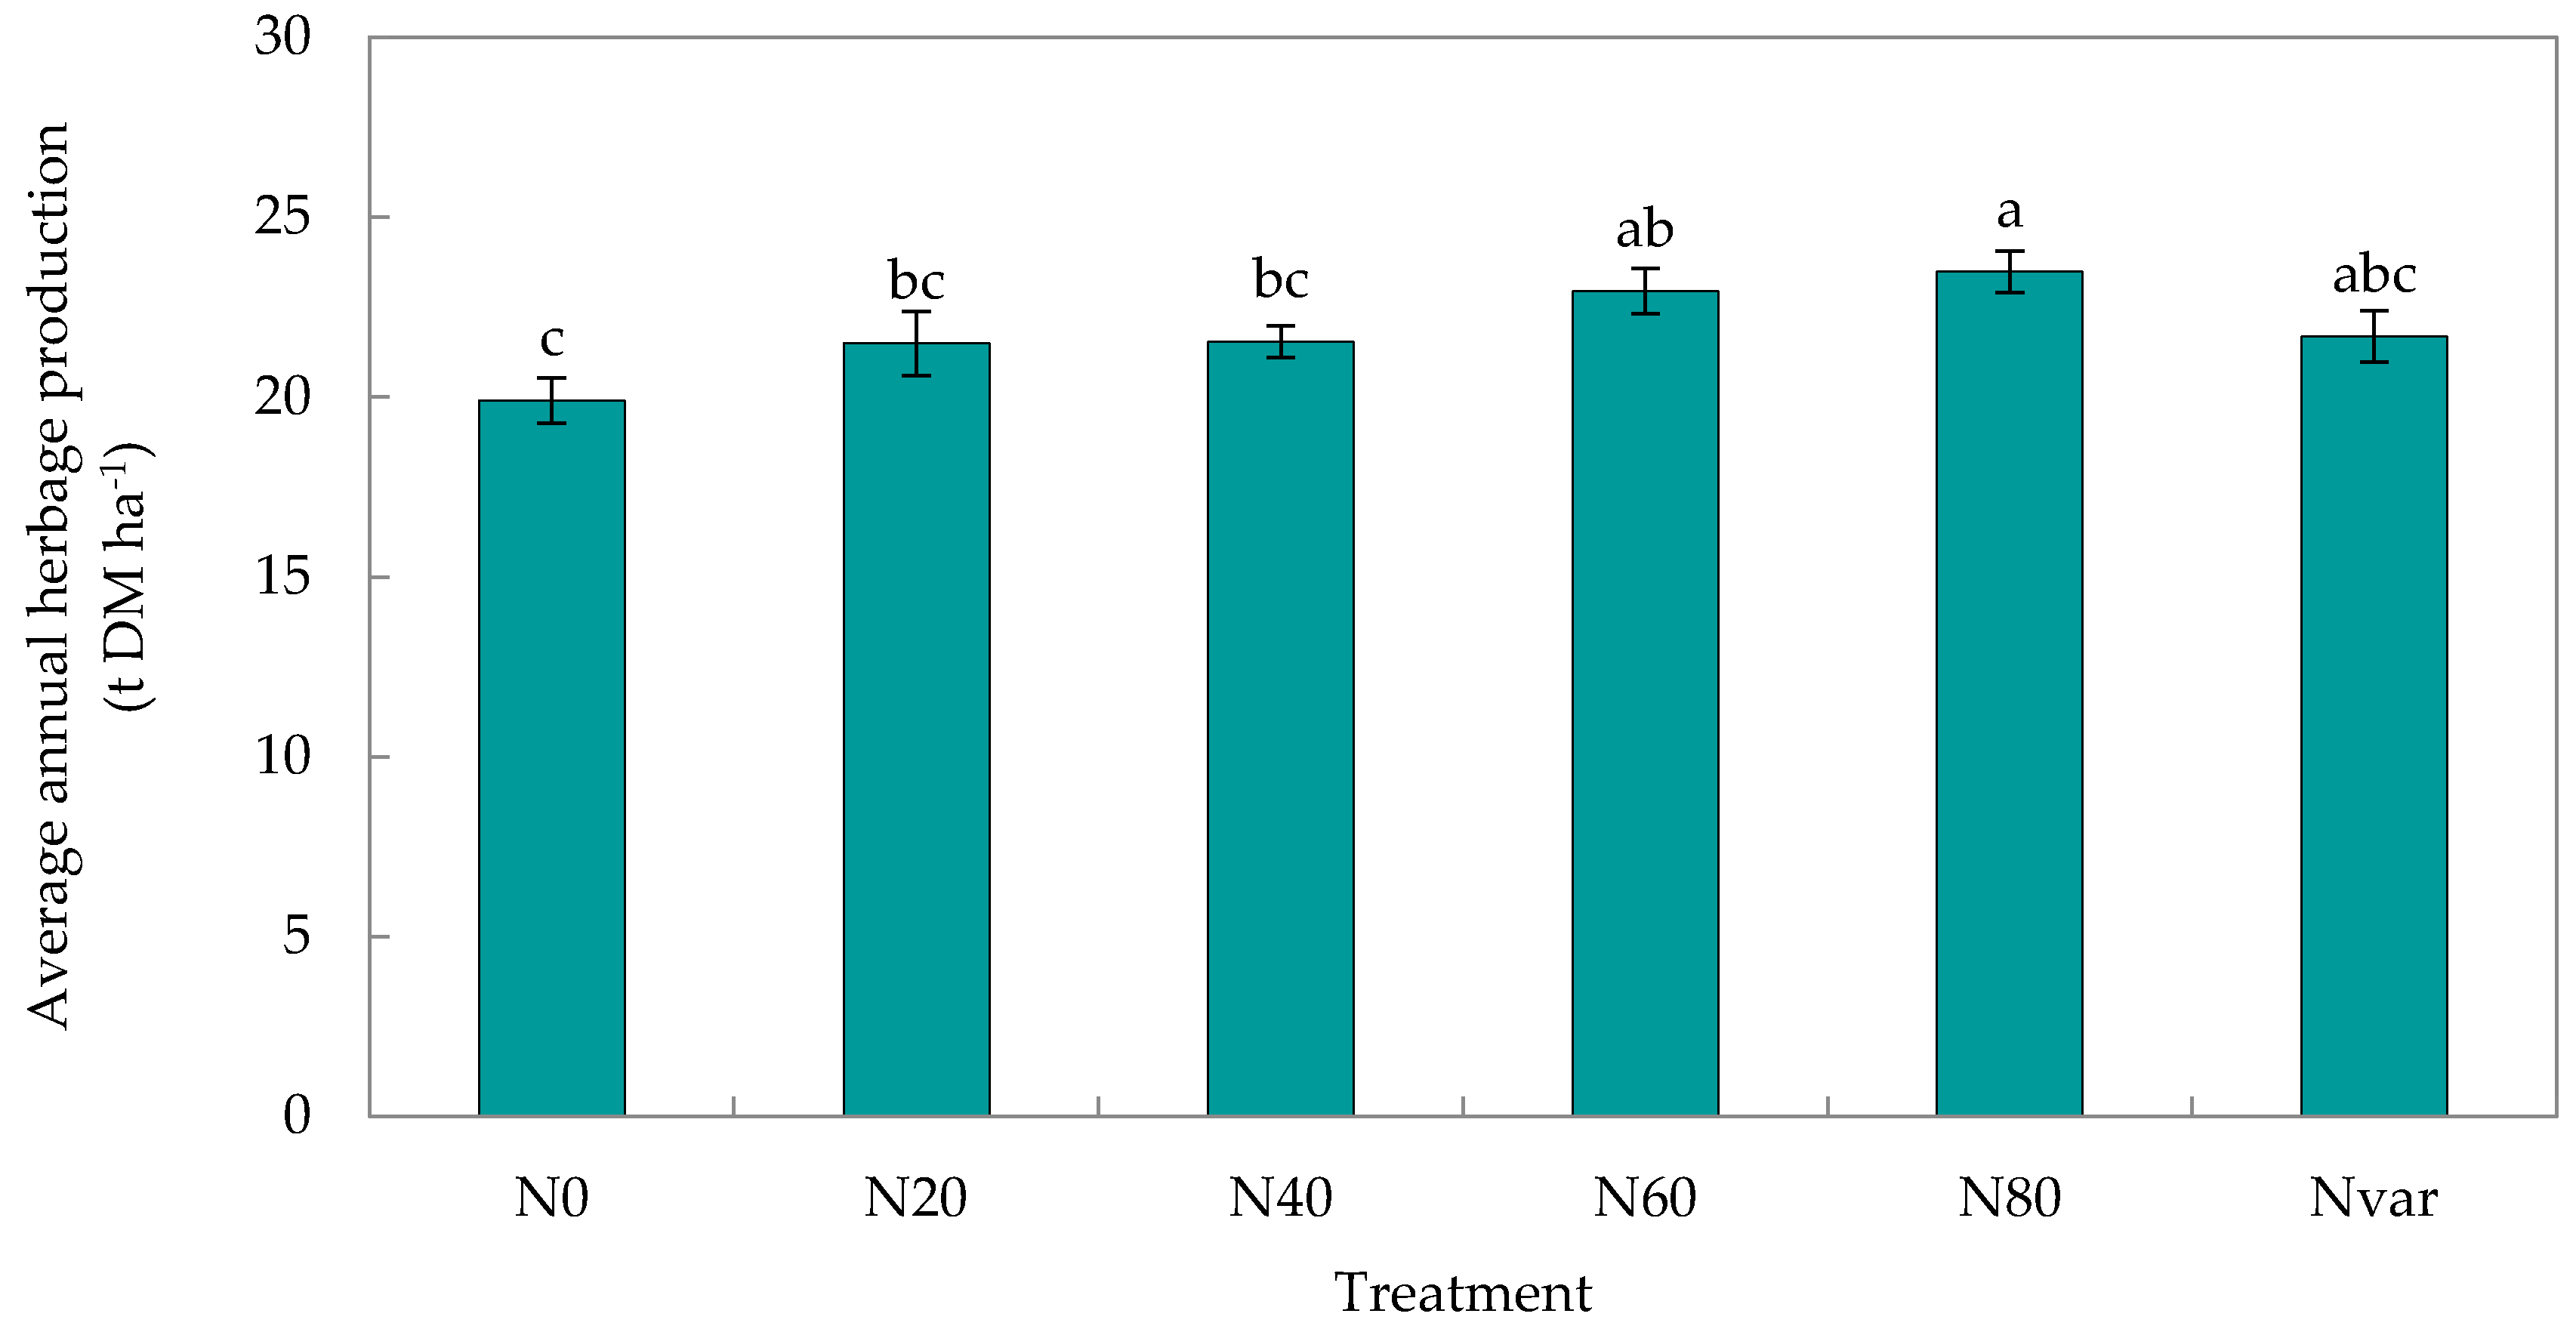
Figure 1. Average annual herbage production (t DM ha−1) of the kikuyu-ryegrass pasture influenced by nitrogen (N) treatments. N0, N20, N40, N60, and N80 = 0, 20, 40, 60, and 80 kg N ha−1 grazing−1 and Nvar = varying rate of N application according to the soil water nitrate concentration. Error bars indicate the standard error. No common letter above bars indicates significant difference at the 5% level.
Land 09 00173 g001
Figure 2. Seasonal herbage production (kg DM ha−1) of kikuyu-ryegrass displaying seasons during year 1 and 2, as affected by treatments N0, N20, N40, N60, and N80 = 0, 20, 40, 60, and 80 kg N ha−1 grazing−1 and Nvar = varying N rate according to the nitrate concentration in the soil water. Error bars indicate the standard error. No common letters above bars indicate significant difference at the 5% level.
Land 09 00173 g002
Figure 3. Nonmetric multidimensional scaling (NMDS) ordination axes 1 and 2 of the botanical composition component (kikuyu, ryegrass, volunteer legumes, and other grasses and weeds) in kikuyu-annual ryegrass pasture, as influenced by season (winter, spring, summer and autumn of year 1 and 2) and N treatments (N0, N20, N40, N60, N80 and Nvar). N0, N20, N40, N60, and N80 = 0, 20, 40, 60, and 80 kg N ha−1 grazing−1 and Nvar = varying N rate according to the nitrate concentration in the soil water.
Land 09 00173 g003
Figure 4. Agronomic nitrogen use efficiency (ANUE) (kg DM kg−1 N ha−1) of kikuyu-ryegrass pasture across seasons, as affected by treatments N0, N20, N40, N60, and N80 = 0, 20, 40, 60, and 80 kg N ha−1 grazing−1 and Nvar = varying N rate according to the nitrate concentration in the soil water. Error bars indicate the standard error. No common letter above bars indicates significant difference at the 5% level.
Land 09 00173 g004
Figure 5. Average crude protein content (%) of the kikuyu-ryegrass site in seasons of year 1 and year 2 and affected by treatments N0, N20, N40, N60, and N80 = 0, 20, 40, 60, and 80 kg N ha−1 grazing−1 and Nvar = varying N rate according to the nitrate concentration in the soil water. Error bars indicate the standard error. No common letter above bars indicates significant difference at the 5% level.
Land 09 00173 g005
Figure 6. Total mineral N (mg kg−1) on the day of sampling at the 0-100 mm soil depth at the kikuyu-ryegrass site, as affected by treatments N0, N20, N40, N60, and N80 = 0, 20, 40, 60, and 80 kg N ha−1 grazing−1; Nvar = variable nitrogen fertilisation. Error bars indicate the standard error. No common letter above bars indicates significant difference at the 5% level when treatments are compared within times of grazing.
Land 09 00173 g006
Figure 7. Average potential mineralisable N (PMN) (kg N ha−1 grazing event−1) at the 0–100 mm depth at the kikuyu-ryegrass site averaged across treatments, as affected by the grazing event. Error bars indicate the standard error. No common letters above bars indicate significant difference at the 5% level.
Land 09 00173 g007
Figure 8. Average potential mineralisable N (PMN) (kg N ha−1 grazing−1) at the 100–200 mm (dashed line) and 200–300 mm (solid line) depths at the kikuyu-ryegrass site averaged across treatments, as affected by the time of grazing events. Error bars indicate the standard error. No common letters above bars indicate significant difference at the 5% level, when compared within a depth.
Land 09 00173 g008
Figure 9. Urease activity (μg NH4-N g−1 N 2 h−1) at the 0–100 mm soil depth at the kikuyu-ryegrass site approximately every second grazing event. N0, N20, N40, N60, and N80 = 0, 20, 40, 60, and 80 kg N ha−1 grazing−1; Nvar = variable nitrogen fertilisation. Error bars indicate the standard error. No common letter above bars indicates significant difference at the 5% level.
Land 09 00173 g009
Figure 10. Precipitation and mean daily temperature recorded at Outeniqua Research Farm during the course of the study. * faulty instrument, missing value.
Land 09 00173 g010
Figure 11. Average nitrate concentration (mg nitrate L−1) of soil water in Nvar plots, as collected from Wetting Front Detectors (WFDs), at a 150 and 300 mm depth, for the duration of the trial at the kikuyu-ryegrass site. Red line indicates the 44.3 mg L−1 nitrate concentration allowable in South African drinking water [42].
Land 09 00173 g011
Table 1. Total annual nitrogen (N) applications for year 1 and 2 and number of grazing events within a year for the kikuyu-ryegrass pasture.
N Application after Every Grazing (kg N ha−1 grazing −1)Total Annual N Application (kg N ha−1 year−1)
TreatmentYear 1Year 2
N0 000
N20 20200220
N40 40400440
N60 60600660
N80 80800880
Nvar Dependent on soil water nitrate concentration10–350–50
Number of grazing events 1112
Days in production year 356379
Table 2. Results of repeated measures ANOVA for cumulative herbage production (kg DM ha−1), crude protein of herbage (%) and agronomic nitrogen use efficiency (kg DM kg−1 N ha−1), soil mineral N (mg kg−1), potential mineralisable pool (N kg N ha−1 grazing1) and urease activity (μg NH4-N g−1 N 2 h−1) under different N fertiliser treatments.
Variable F-Statisticp-Value
Herbage Production
Treatment3.470.023
Season314.63<0.001
Treatment * season1.020.455
Agronomic N use efficiency
Treatment0.470.712
Season4.79<0.001
Treatment * season0.840.663
Crude protein
Treatment25.65<0.001
Season31.20<0.001
Treatment * season4.47<0.001
Total mineral soil N
Treatment12.51<0.001
Time of grazing event4.02<0.001
Treatment * Time of grazing event 2.04<0.001
Potentially mineralisable N (0–100 mm)
Treatment0.170.971
Time of grazing event 4.45<0.001
Treatment * Time of grazing event 0.880.764
Potentially mineralisable N (100–200 mm)
Treatment0.380.855
Time of grazing event 4.39<0.001
Treatment * Time of grazing event 0.630.928
Potentially mineralisable N (200–300 mm)
Treatment1.240.333
Time of grazing event 4.99<0.001
Treatment * Time of grazing event 0.680.886
Urease activity
Treatment9.67<0.001
Time of grazing event 4.430.008
Treatment * Time of grazing event 5.59<0.001
Table 3. Nitrogen (N) fertiliser rate treatments laid out as a randomised block design on Outeniqua Research Farm in South Africa. Plot numbers are indicated in the top left corner of each coloured plot. Block numbers (replications) are indicated with a B. The N rate treatments are indicated as N0, N20, N40, N60, and N80 and Nvar, which correspond to 0, 20, 40, 60, and 80 kg N ha−1 grazing−1 and a variable N fertilisation rate based on the soil water nitrate concentration, respectively.
6 12 18 24
B1 Nvar B2 N0 B3 N20 B4 N40
5 11 17 23
B1 N20 B2 N60 B3 N0 B4 Nvar
4 10 16 22
B1 N80 B2 N20 B3 Nvar B4 N0
3 9 15 21
B1 N0 B2 N80 B3 N40 B4 N20
2 8 14 20
B1 N60 B2 N40 B3 N60 B4 N80
1 7 13 19
B1 N40 B2 Nvar B3 N80 B4 N60
Table 4. Nitrate concentration (mg L−1) of the soil water and corresponding nitrogen application rates.
Initial Nitrate Concentration Range of 150 mm WFD (mg L−1) Adapted Nitrate Concentration Range of 150 mm WFD (mg L−1)Nitrogen Application Rate
(kg N ha−1 grazing−1)
<25<5050
25–5050–7525
>50>750
150 mm = Depth at which WFD is inserted into the soil. WFD = Fullstop™ Wetting Front Detector.