Article

A Spatial-Temporal Analysis of the Effects of Households’ Land-use Behaviors on Soil Available Potassium in Cropland: A Case Study from Urban Peripheral Region in Northeast China

1
College of Land and Environment, Shenyang Agricultural University, Shenyang 110866, China
2
Leibniz Institute of Agricultural Development in Transition Economies (IAMO), 06120 Halle (Saale), Germany
3
Jiangxi Economic Development Research Institute, College of Finance, Jiangxi Normal University, Nanchang 330022, China
4
College of Public Administration, Nanjing Agricultural University, Nanjing 210095, China
*
Author to whom correspondence should be addressed.
Land 2020, 9(5), 160; https://doi.org/10.3390/land9050160
Submission received: 17 April 2020 / Revised: 18 May 2020 / Accepted: 19 May 2020 / Published: 20 May 2020
(This article belongs to the Special Issue Soil Management for Sustainability)

Abstract

:
Available potassium (AVK) in the soil of cropland is one of the most important factors determining soil quality and agricultural productivity. Thus, it is crucial to understand the variation of AVK and its influencing factors for sustaining soil fertility and mitigating land degradation. Farm households are the ultimate land users, and their land-use behaviors inevitably play an important role in the variation of AVK. This paper, therefore, aims to explore the effects of households’ land-use behaviors on soil AVK from spatial and temporal perspectives. Taking an urban peripheral region in Northeast China as the study area, we firstly use geostatistics (Kriging interpolation) and GIS tools to map out the spatial AVK distributions in 1980, 2000, and 2010, based on soil sampling data points, and then assess the impacts of land-use behaviors on AVK using econometric models. The results show that, although the AVK content in the study area has a largely downward trend over the 30 years, there are distinct trends in different stages. The disparity of trends can be attributed to the changes in households’ land-use behaviors over time. The spatial variation of AVK is also substantial and intriguing: the closer to the urban area, the greater the decline of soil AVK content, while the farther away from the urban area, the greater the rise of soil AVK content. This spatial disparity can too be largely explained by the obvious differences in households’ land-use behaviors in various regions.

1. Introduction

China faces the great challenge of meeting the ever-increasing food demand, due to its large and ever-growing population and dietary shifts accompanying rapidly increasing income, with scarce agricultural land. Land conservation is not only essential for the realization of sustainable social and economic development in China, but also of great strategic significance for ensuring world food security and stabilizing international food prices [1,2,3]. Chinese governments have prioritized maintaining the soil quality of arable lands to safeguard national food security. Therefore, researches on how and where improvements can be made to enhance the sustainability of agricultural production are of paramount importance to policymakers. While much attention has been focused on maintaining the arable land area—as reflected by the so-called “cropland red line” policy, aiming to maintain at least 1.8 billion mu (i.e., 0.12 billion ha) area of quality arable land, the deterioration of soil quality and land degradation has long been overlooked. Recently, soil preservation has been recognized as one of the most important factors restricting food security and agricultural product safety in China [4,5]. Potassium is one of the four essential macronutrients (N, P, K, and S) needed by plants, which directly and indirectly affect soil fertility. Soil available potassium (AVK) determined by ammonium acetate leaching-flame photometric method is an effective method that determines soil availability of potassium, which can be can directly absorbed and utilized by plants [6,7]. It is thus a good indicator of the supply capacity of potassium nutrient and soil fertility of cropland, which in turn affects the yield and quality of crops [8,9]. The critical soil test values or the AVK values at which relative yield to potassium fertilizer application is equal to 90% for each crop in the study. Therefore, the study on the spatial and temporal variation of AVK in soil and its influencing factors are critical for monitoring the dynamic evolution characteristics of cropland soil fertility and scientific planning and management of croplands.
There is a growing body of literature on the spatial and temporal variations of soil fertility and its driving factors [10,11]. The current literature mainly focused on two aspects. One is on the spatial variation of soil physical properties and soil salinity from the perspective of natural science [12,13,14]. In past years, geostatistical methods have been increasingly used to analyze the spatial variation of soil nutrients [15,16,17], for example, soil organic matter [18], NO−3-N [19], available phosphorus [5], AVK [20,21], nugget effect and correlation degree [22], coefficient of variation [23]. At the same time, studies on the influencing factors of soil fertility have gained much attention. Researches showed that soil fertility changes are directly or indirectly affected by soil erosion, farming systems, land-use modes, and fertilizer inputs [24,25,26,27,28]. However, the existing researches still have the following limitations: firstly, the change of soil nutrient content is affected not only by natural conditions, but also by human activities. In intensive land use areas, for example, in urban peripheral regions, human factors play an important role. However, existing researches focus more on the natural perspective, and the discussions on human production behavior and activities are relatively rare; convincing empirical analyses are still lacking. Secondly, most studies have been either on the spatial variation or temporal changes of soil nutrient content in a certain region. There is a lack of spatial-temporal analysis of continuous monitoring data, especially in the area of intensive land use, where land-use behaviors significantly influence soil nutrients changes. Thirdly, there are few researches on the mechanism of the change of soil AVK based on multivariate data—especially on the data of soil fertility, the role of farm households’ behaviors, and socio-economic statistics.
To bridge the existing research gaps, this study aims to investigate the link between soil AVK and farm households’ behaviors from a theoretical and empirical perspective. For that, we take a suburban area of Shenyang, a megacity in Northeast China, as the study area. This region is at the interface between urban expansion and cropland conservation, and forms intricate regional complexes [29,30,31]; substantial changes have taken place in both households’ land-use behaviors and management measures ever since the implementation of the household contract responsibility system (HRS) in China in the early 1980s. Small households, with diverse characteristics are the main land users and the ultimate decision-makers on the ground. This provides a perfect setting to study how land-use behaviors influence the change of soil AVK content.
Specifically, we try to answer two research questions: first, what changes have taken place in the content of AVK in cropland soil in the urban peripheral region, where land-use changes most dramatically? Second, what is the relationship between these changes and the households’ land-use behaviors? In this research, first of all, we embark on a multidisciplinary approach, by integrating theories and methods from soil sciences, land-use change science, and household economics of social sciences. Secondly, by revealing the temporal and spatial variation of soil AVK content, we hope to provide technical guidance for the sustainable utilization of regional cropland by preserving the soil quality of cropland, and at the same time, provide scientific bases for policymakers in designing policy measurements in regulating households’ land-use behaviors to maintain and enhance cropland quality and health, while improving agricultural productivity in intensive agricultural areas.

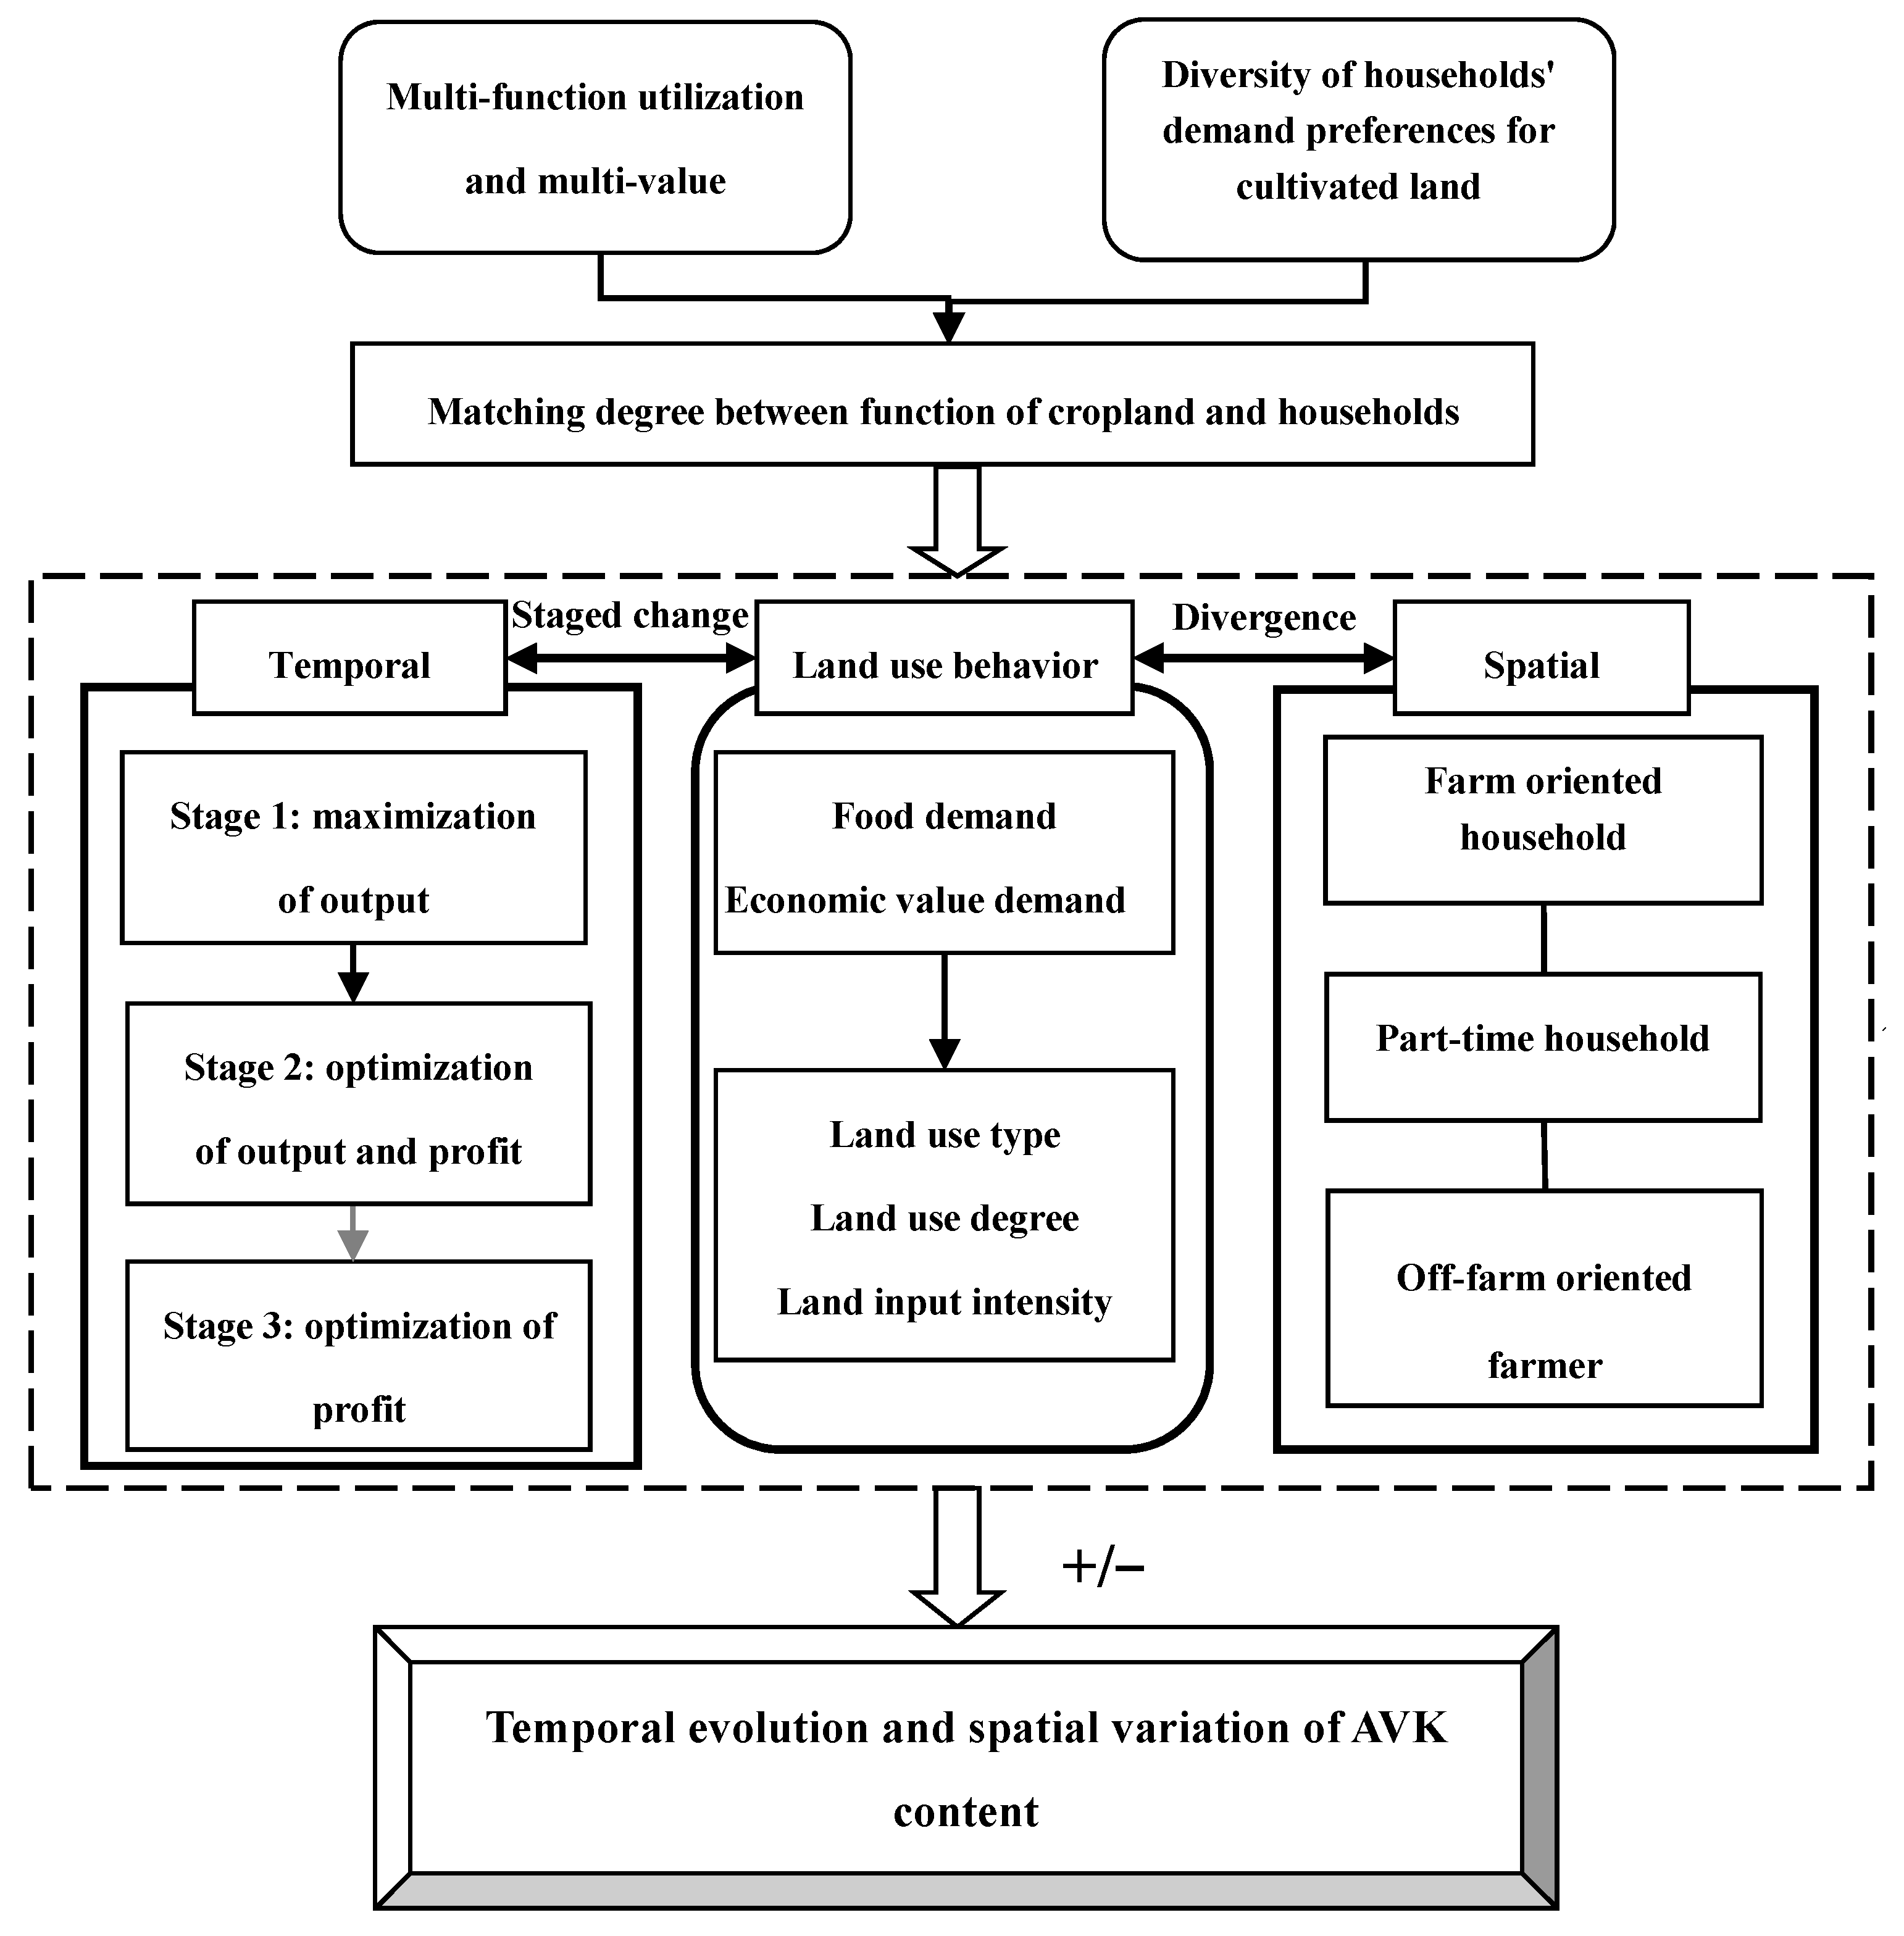
2. Conceptual Framework

Before the analytical study, here, we construct a conceptual framework to illustrate the causal relationship between land-use behaviors and soil fertility change. This framework shows how households’ decisions and behaviors affect the AVK content in soil from temporal and spatial perspectives. Households are the ultimate decision-makers in the family-based farming system in China; they are both producers and consumers; they make decisions on land use, capital, and labor inputs in agricultural production to partially fulfil demand from consumers. According to household behavior theory in neoclassical economics, the goal of household production is to maximize utility [32,33]. However, the utility function of households may vary in different stages of economic development, and so does the goal of agricultural farming of households. The level of development has been constantly changing. During this process, households generate and measure their own needs, namely food demand and monetary demand. The former can meet the household consumption of food, and the latter can meet the family’s money expenditure needs. Under the strong constraints of household consumption, households have a priority to meet the needs of household food demand, and the decision-making basis is the satisfaction of household food consumption capacity. After household consumption is met, farmer households then focus on attaining the maximum economic value from the land. The process would eventually match the value and function of the cropland, according to the needs of the household.
However, the difference in households’ land-use targets in different periods results in the temporal and spatial variability of households’ land-use behaviors. Generally speaking, since the reform and opening up in the late 1970s, the main demands of households have shifted from food self-consumption, to pursuing monetary returns from the land to meet the basic money expenditure needs on diversifying food consumption, to the purchase of basic needs like clothing, and then to profit maximization demand, based on the market-oriented production system. The land use target of households is consistent with the realization of the goals of their economic activities. Households’ land-use behaviors vary in different stages, accordingly. Specifically, it passed from the stage of maximizing grain production, to the stage of grain production and profit optimization, and then to profit maximization. The differentiation of households has also presented the stage of farm-oriented households, to part-time households, and then to the off-farm oriented households, in different spatial extents at the same time. The change of land-use pattern, degree, and input intensity would inevitably lead to different evolutionary laws of soil AVK in time and space (see Figure 1).

3. Materials and Methods
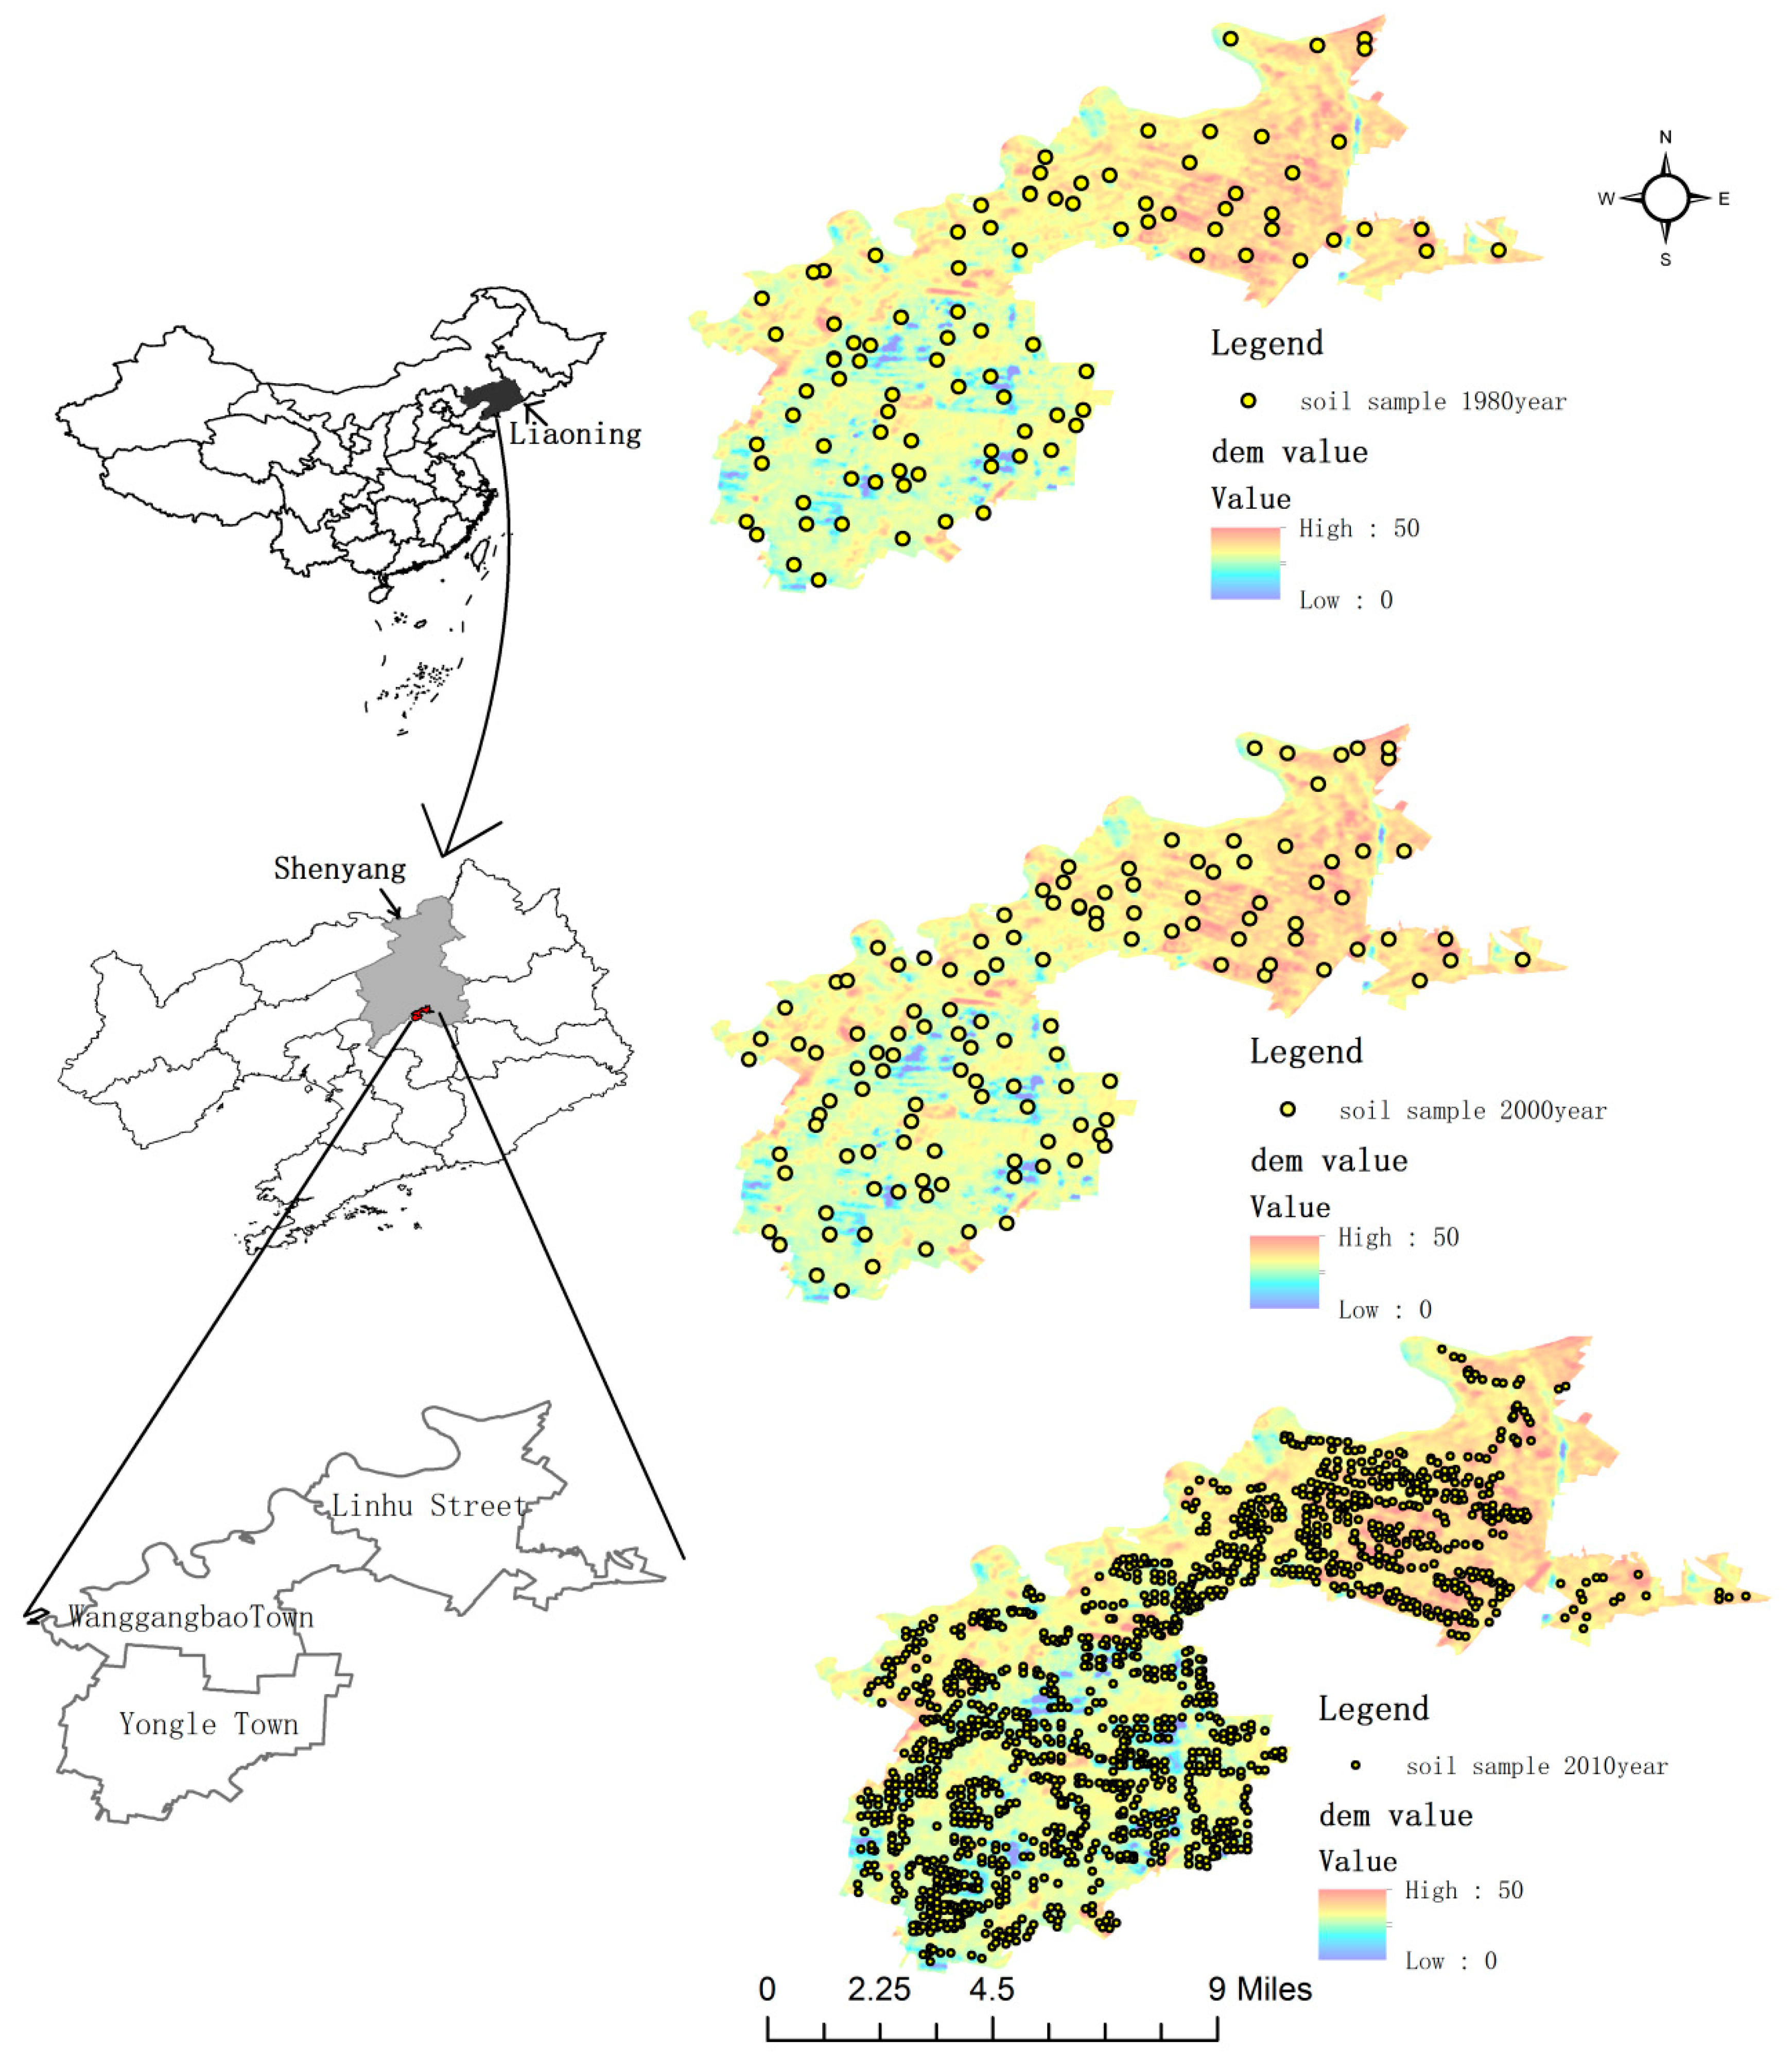
3.1. Study Areas

Sujiatun District, our case study area, is located in the south of Shenyang City, 15 km away from the center of Shenyang, which is the only mega-city in the three northeastern provinces of China. The total area is 782 km2, located at east longitude ranging from 123°09′ to 123°47′ and north latitude ranging from 41°27′ to 41°43′. The study area belongs to a continental semi-humid monsoon climate of the warm temperate zone with four distinct seasons, abundant sunshine, and concentrated rainfall. The annual average temperature is about 8 degrees Celsius, The average frost-free period is 150.5 days, the longest is 175 days (1975). The shortest is 128 days (1972, 1974). The earliest final frost date was April 20 (1967). The latest date is May 18 (1960). The annual average precipitation is 659.6 mm, the highest year is 1055.3 mm (1953), and the lowest is 445 mm (1965). The annual sunshine hours are 2527 h on average. Annual average evaporation 1430.3 mm. Sujiatun is a national commodity grain base and demonstration area of grain self-sufficiency. It is also a demonstration area of agricultural standardization production in Liaoning Province, a base of high-quality rice in Shenyang City, and a suburban agricultural demonstration area [2]. In this study, we select Linhu Street (near suburb), Yongle Township (outside suburb), and Wanggangbao Township (middle area) as sample areas, which are located in the western plain area (see Figure 2). The soil type in this area is cultivated loamy meadow soil, and the land use type is dry land. Under the condition of relatively homogeneous natural conditions, the change of AVK content in soil is mainly driven by human factors, which determine the potassium balance of the agricultural production system. Thus this region makes a suitable study area for our study.

3.2. Data Collection and Processing

3.2.1. Soil Observations

To ensure the continuity and comparability of soil sample collection, the number and location of sampling points were determined according to the difference of plot size, planting system, crop species, and yield level of cropland. The sample points used in this study include soil observation data from three periods, 1980, 2000, and 2010. The number of sampling points has increased over time, with 119 sampling points collected in 1980, 141 sampling points collected in 2000, and 1437 sampling points collected in 2010. The initial soil data and sample distribution map in the year 1980 comprehensively used the data and soil map of the second national soil survey in Sujiatun District. The soil map at a scale of 1:50,000 was used to facilitate the collection of 119 sampling points—evenly distributed across the study area—between May and June in 1980. Based on the main section of the second national soil survey, 141 soil observations were collected from May to June in 2000. In 2010, as soil tests had become more widespread in the region over time, the number of sampling points in the cropland concentrated area increased to 1437 according to the geographical coordinates of the soil sample points in 2000. Approximately 15 ~ 20 sampling points of the 0–20 cm soil layer of cropland were taken in a chessboard spatial sampling pattern. GPS was used to obtain the geographic coordinates of soil sample points in 2000 and 2010. As the 2000 sampling points include the 1980 sampling points, the GPS locations of the 1980 sampling points can be determined. Removing the plant roots and debris, stones, insect corpses, and other debris from the soil samples is a standard practice in preparing soil samples for analysis using a soil sieve. Subsequently, soil samples were air-dried and passed through a 0.15–1.0 mm sieve to remove plant roots and debris, stones, insect corpses, and other debris. The chemical analysis methods of soil AVK in three periods were the same, which is the ammonium acetate leaching-flame photometric method [6,7].

3.2.2. Socioeconomic Data

The socioeconomic data used in this study mainly comes from two sources, one is the statistical data provided by the local statistical bureau and the other is the survey data of the households in the study area.
The socioeconomic statistics are mainly derived from Shenyang Statistical Yearbook (1995–2010), Shenyang City Economic Statistics Yearbook (1985–1991), Compilation of National Economic Data of Sujiatun District (1984–1997) and Compilation of Statistical Materials of Sujiatun District (1998–2010). The household-level data of this study comes from the sample survey of the households in Sujiatun District from March to June 2010. To support this research, the soil sampling data and the households’ survey data were designed to be matched with each other: while taking soil samples in households’ land, the households were interviewed to record their land use, planting systems, fertilization status, water conservancy facilities, irrigation water sources, irrigation systems, and average yields. The sampling approach is based on the average distribution, according to the principle of representativeness and variability. The clustering, stratification, and random sampling methods were carried out to ensure the reliability of data collection. Overall 240 households were interviewed; excluding non-representative invalid questionnaires, 238 valid questionnaires were obtained: 79, 78, and 81 in Linhu Street, Wanggangbao Township, and Yongle Township, accounting for 33.2%, 32.8%, and 34% of the total sample size, respectively.

3.3. Methodology

We first used geostatistical analysis, the Kriging interpolation method, to generate the soil AVK surface maps, based on the soil survey data at sampling points. Then, we further related the AVK content value to human activities, namely, the households’ land-use behaviors, by a linear regression model.

3.3.1. Geostatistical Analysis Methodology

We firstly conducted spatial superposition analysis using the semi-variance function [34,35,36,37] and the Kriging interpolation on the soil AVK in 1980, 2000, and 2010 [38,39,40]. The process is described as follows: The coordinate transformation had to be carried out, because the reference ellipsoids used in the two spatial coordinate systems are different. The land and topographic survey was based on the Beijing 54 Coordinate System in China, while the GPS survey data was based on the WGS84 geocentric coordinate system. In China, the 1:50,000 soil map is projected to the two-dimensional plane rectangular coordinate system, according to the three-degree band Gauss-Kruger, therefore the GPS survey data needs to be reprojected to match with the GIS data. In this study, we used MapGIS® software to read in GPS data, complete precise projection conversion and data format conversion, and then convert GPS data in the WGS84 coordinate system to Beijing 54 Coordinate system. Finally, data in ESRI shapefile format was exported, which can be read by ESRI ArcView®. Thus, we obtained the soil sampling point bitmaps of 1980, 2000, and 2010 at the plot scale. Then, we calculate the theoretical model of the semivariance function, draw the graph, and count the area of each level by the ESRI ArcGIS® v10.

3.3.2. Econometric Model Construction

Based on the theoretical analysis framework presented earlier, we constructed the following econometric analysis model:
L U B = f ( G C C , M C I , L I I )
The model indicates that households’ land-use behaviors (LUB), including land-use patterns, land use levels, and land input intensity, can be quantified by three quantifiable dependent variables. GCC indicates whether households plant economic crops, indicating the difference in land-use patterns; MCI means the land multiple cropping index, indicating the difference in land use level; while LII indicates the amount of land capital investment per unit area of household showing the difference in household’s land input intensity.
A V K = g ( L U B )
Model (1) is brought into Model (2) to obtain Model (3) to model the effects of households’ land-use behaviors on the change of AVK content in cropland.
A V K = g ( L U B ) = g [ f ( G C C , M C I . L I I ) ] = h ( G C C + / , M C I + / , L I I + / )
The model represents the theoretical model of the relationship between households’ land-use behavior and AVK content.
In addition, it should be noted that the above model is only a general model of the interaction mechanism between the land-use behavior of households and the change of AVK in cropland. In specific applications, we need to choose a specific model form according to the specific characteristics of each study area, as well as the availability of data.

4. Results

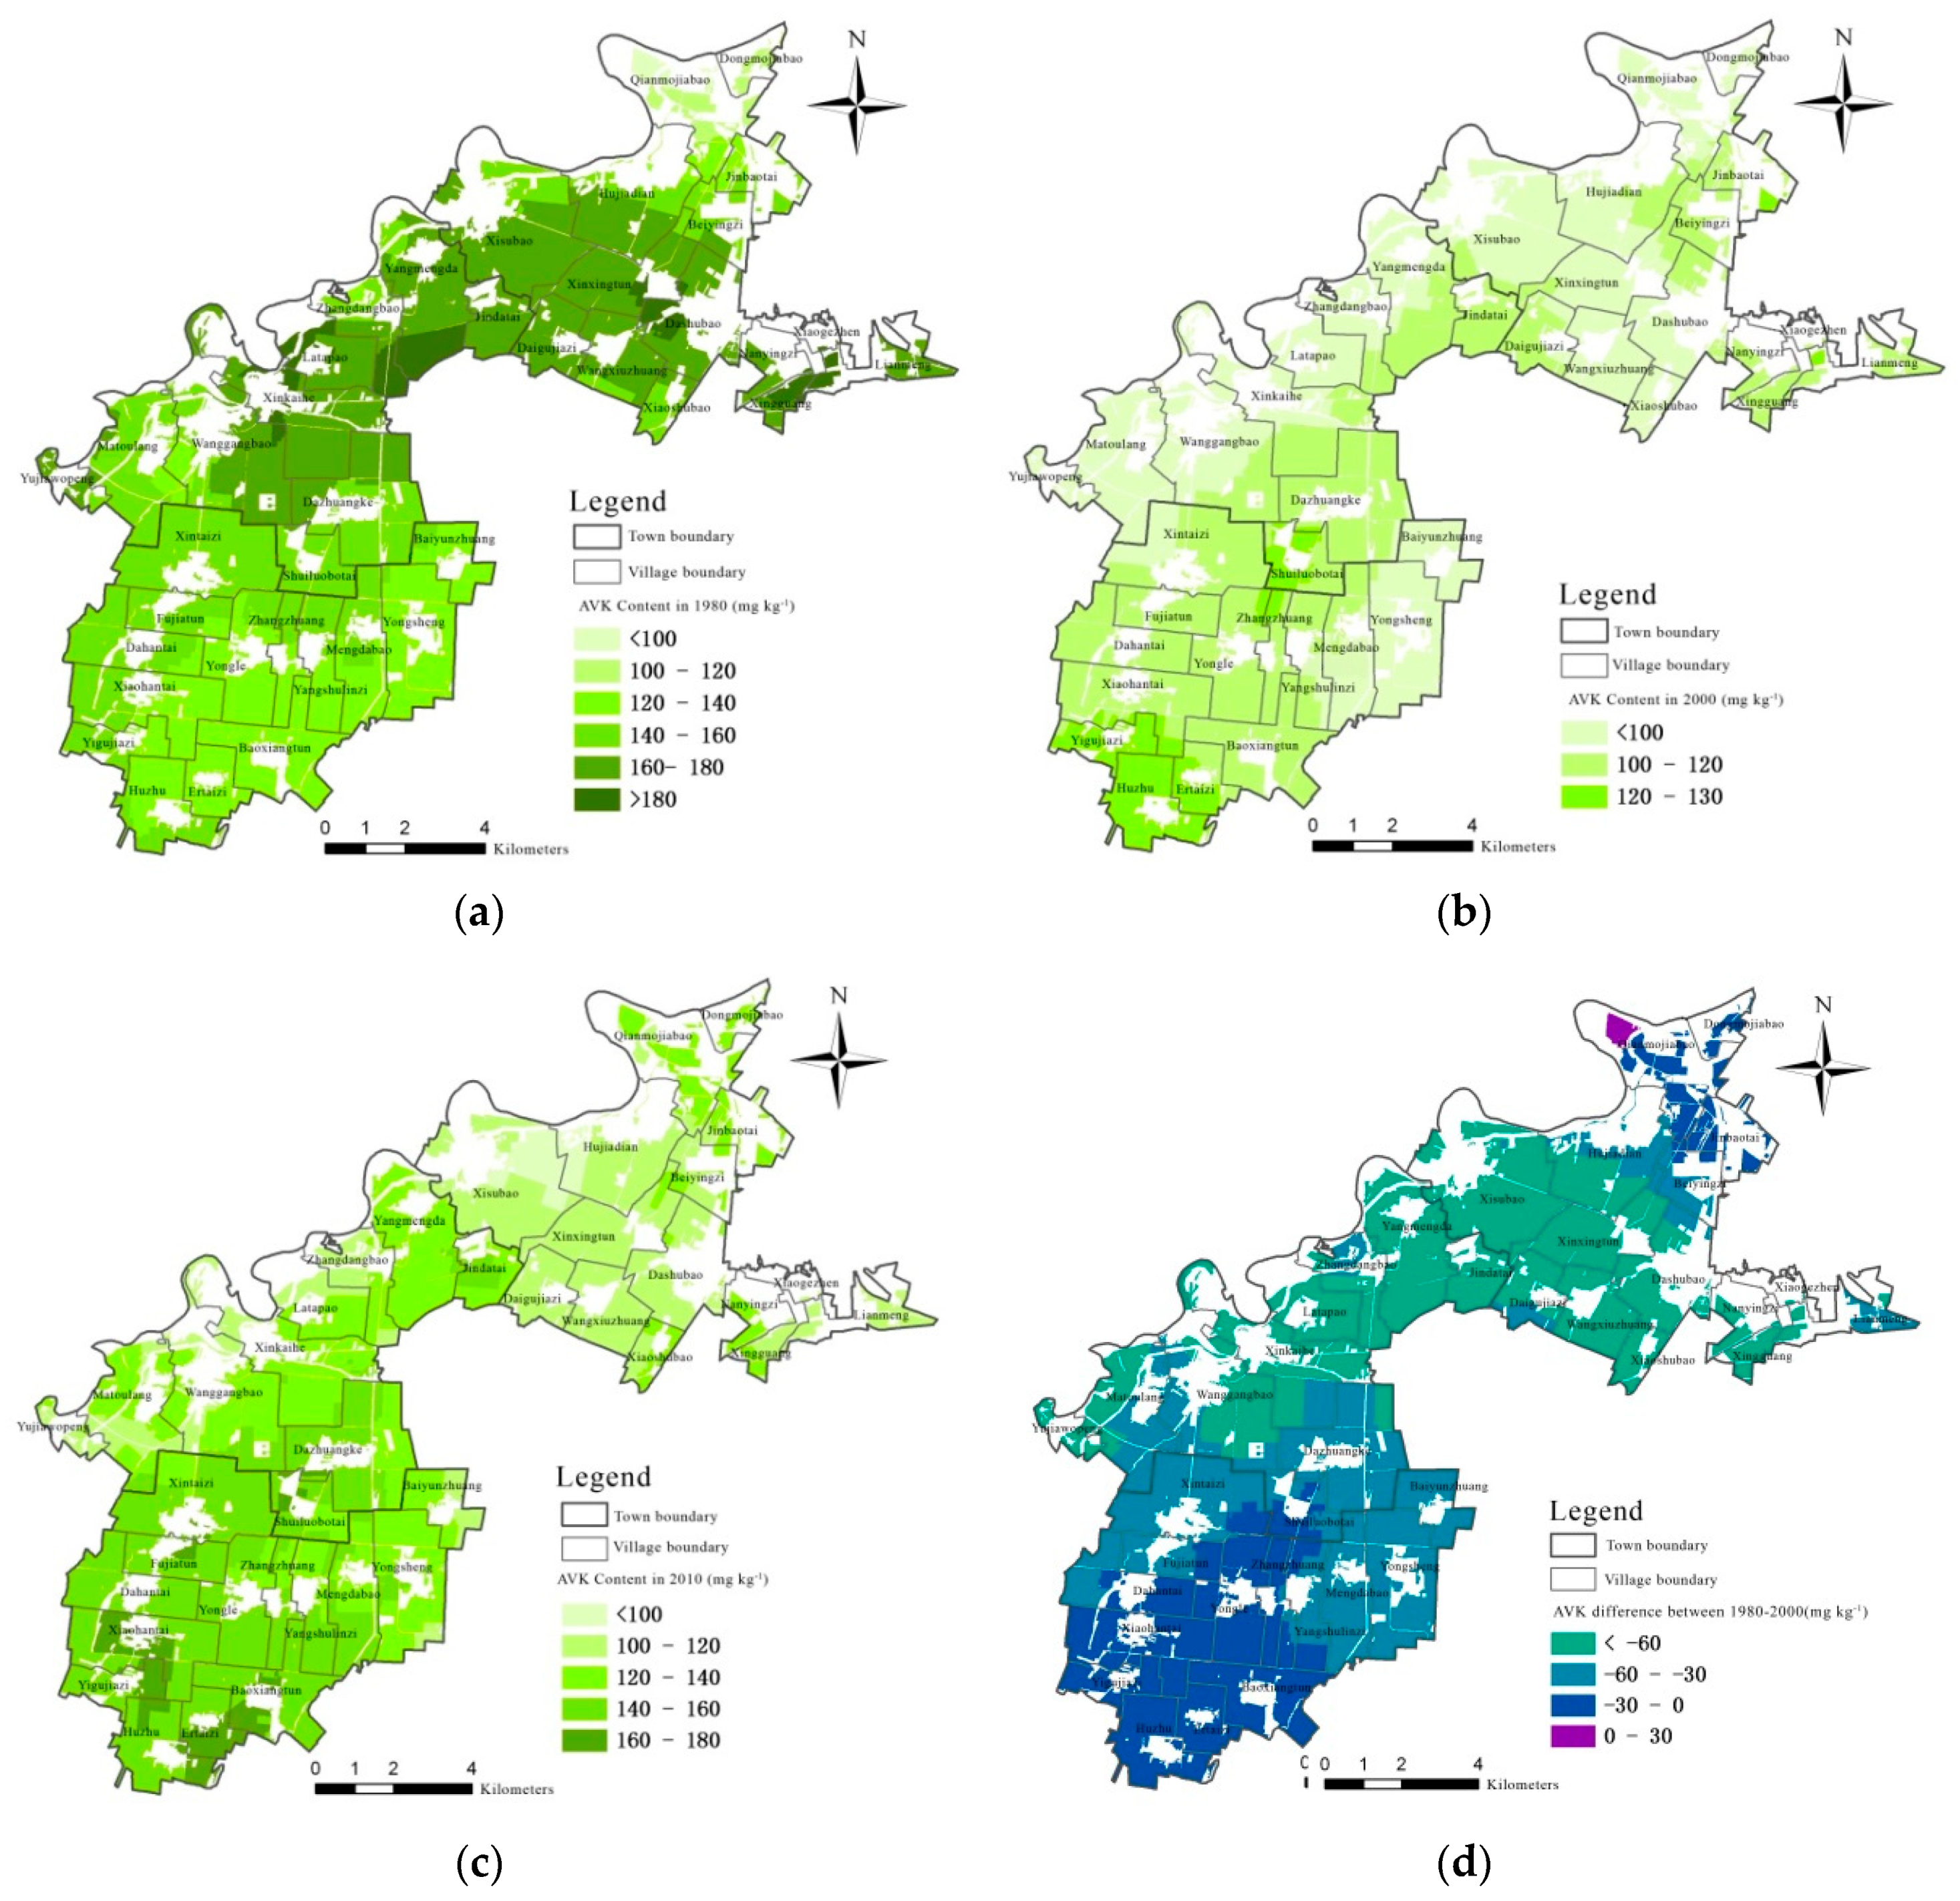
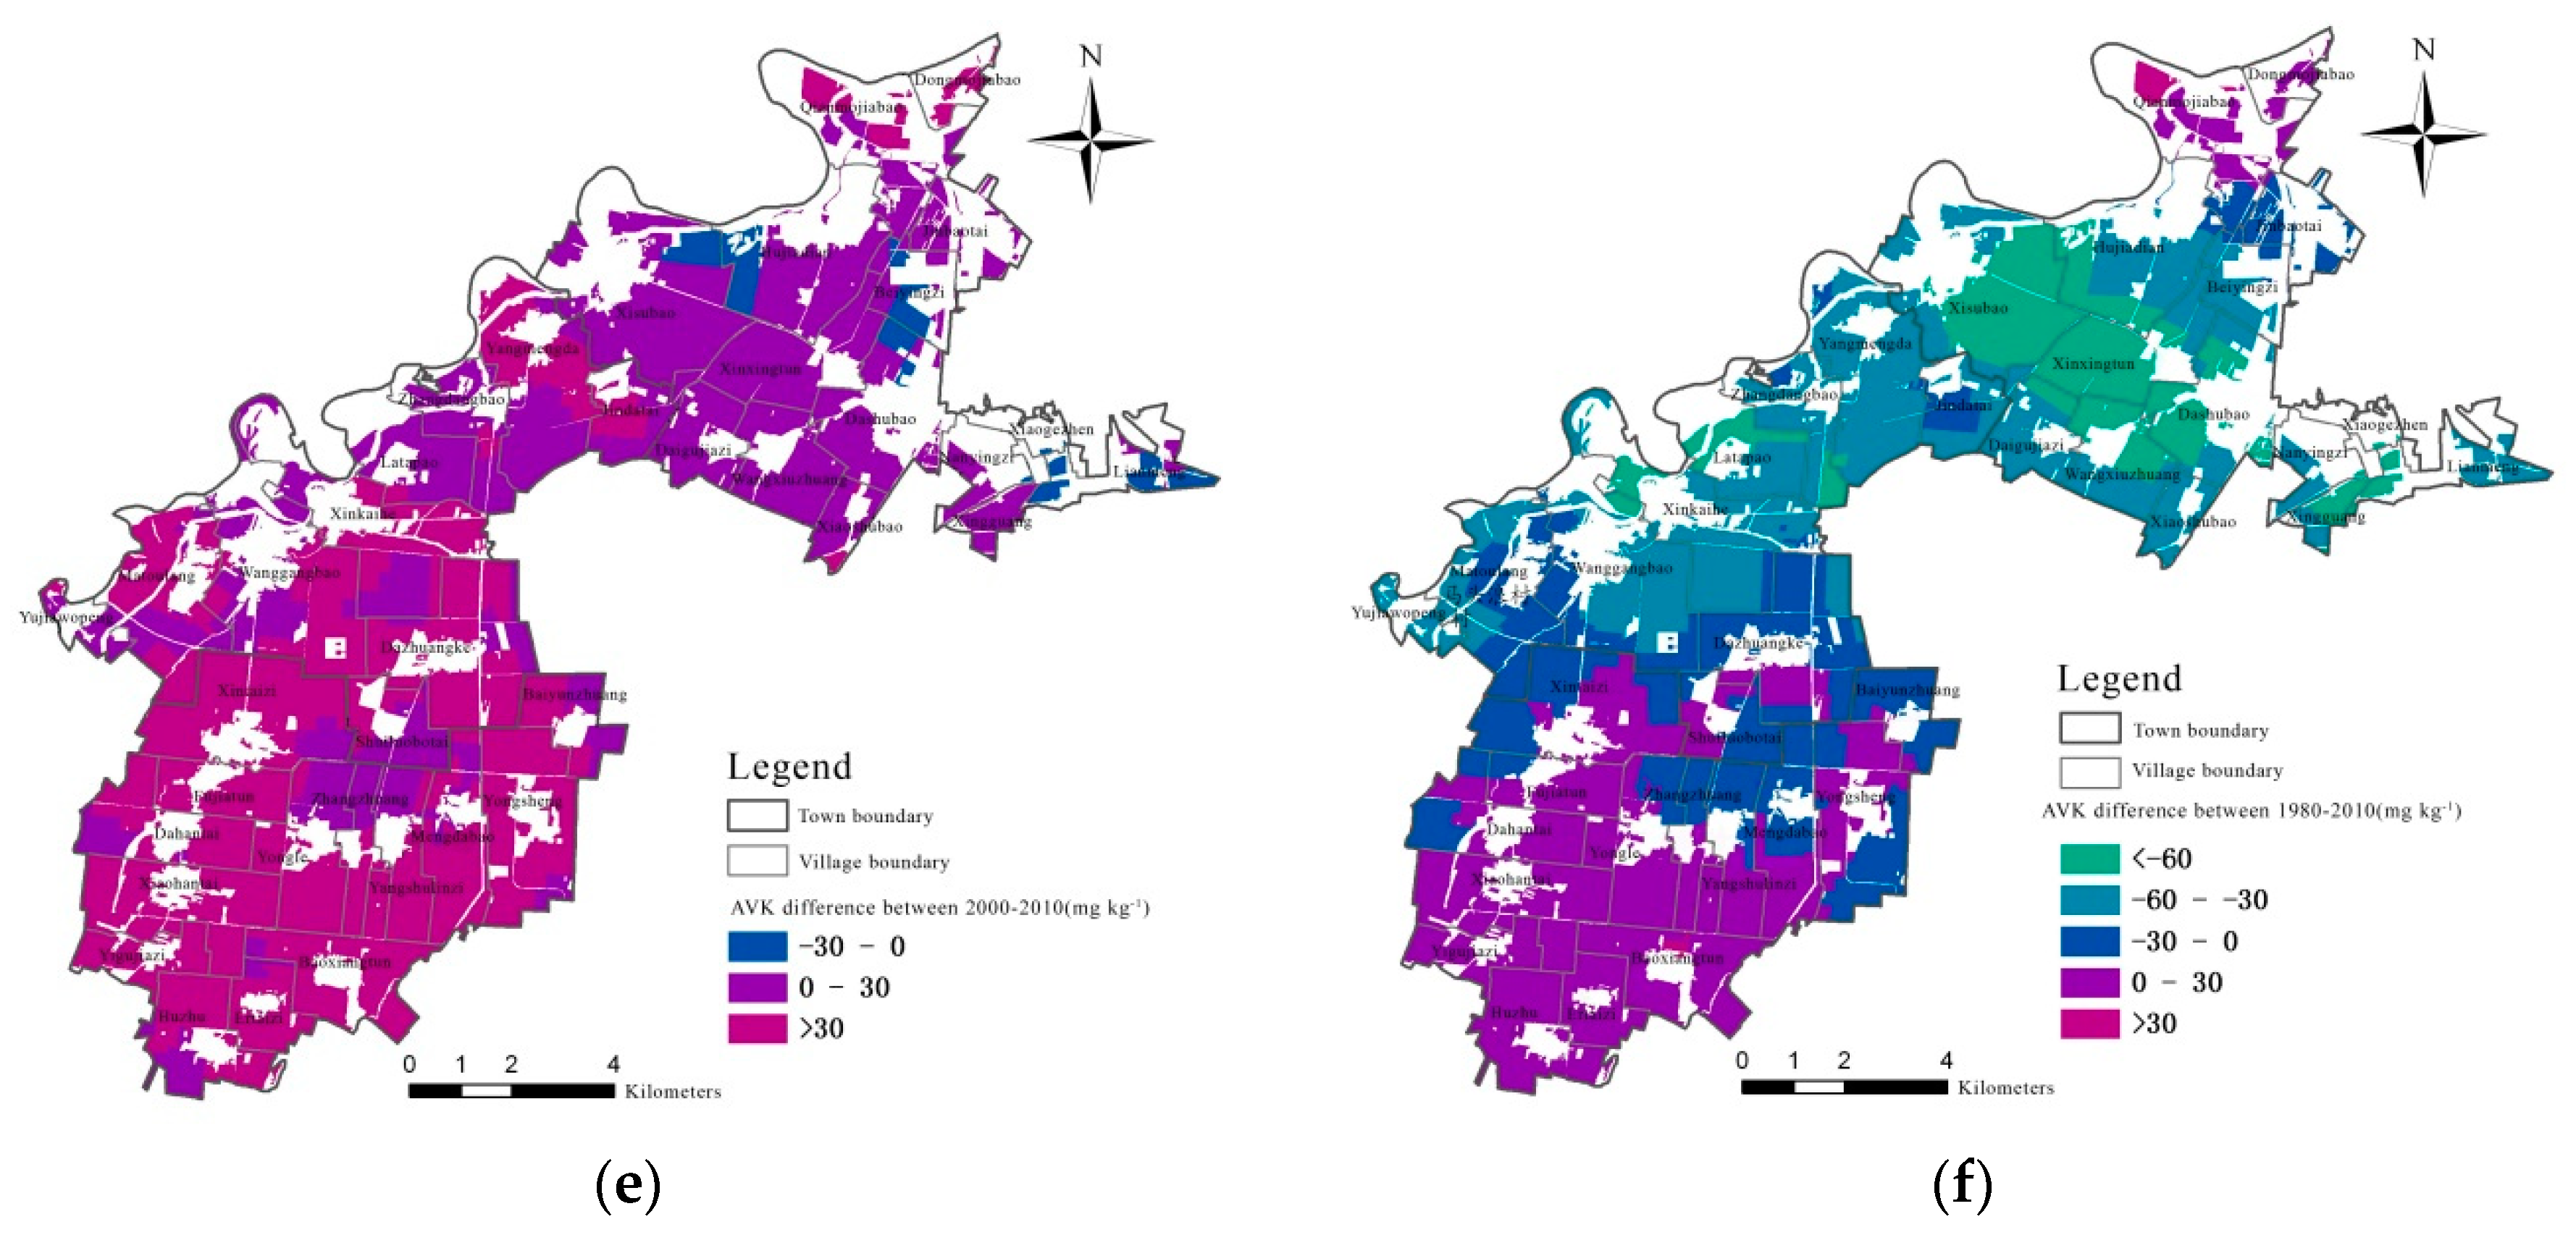
4.1. Temporal and Spatial Evolution Characteristics of AVK

4.1.1. Temporal Evolution Characteristics of Soil AVK

Using the semi-variance model parameters fitted in GS+win9® (a software platform developed by Tetoc scientific instrument in China). The optimal models are exponential, spherical, and exponential in 1980, 2000, and 2010, respectively. The coefficients of determination R2 are 0.878, 0.775, and 0.838, respectively. It indicates that the interpolation models have good accuracy, and the interpolated values are consistent with the spatial distribution characteristics of soil AVK. Based on the result of the semi-variance model, the Ordinary Kriging interpolation method was chosen in Geostatistical module of ArcGIS® 9.3 to interpolate the soil AVK levels [18] in the three periods, respectively (Table 1). The root-mean-square errors (RMSE) are 2.176 in 1980, 3.173 in 2000, and 2.749 in 2010, respectively. This meets the standard requirements for the accuracy of spatial interpolation. As a result, the soil AVK grade area tables and spatial interpolation maps of AVK1980, AVK2000, and AVK2010 were obtained (Figure 3).
AVK levels were grouped according to national soil survey levels—Level 1: > 180 mg/kg, Level 2: 160–180 mg/kg, Level 3: 140–160 mg/kg, Level 4: 120–140 mg/kg, Level 5: 100–120 mg/kg, and Level 6: < 100 mg/kg. In general, the soil AVK positively correlate soil quality and crop productivity. Thus, soil in Level 1 is the best, while Level 5 is the worst in terms of soil quality. From the temporal evolution, it can be seen that the average content of AVK in the soil in 1980 was 149.58 mg/kg, which was mainly distributed in Level II (160–180 mg/kg), III (140–160 mg/kg), and IV (120–140 mg/kg). Among them, the area of cropland in Level II was the largest (3899 ha), accounting for 34.7%, mainly distributed in Linhu Street and Wanggangbao Township. Followed by Level III, the cropland area was 3760 ha, accounting for 33.5%, mainly distributed in the north of Yongle Township and the south of Wanggangbao Township. Soil AVK was high on the whole, and specifically, the content in the north was higher than that in the south. By 2000, the average content of AVK in soil was 103.62 mg/kg, which was mainly distributed in Level IV (120–140 mg/kg), V (100–120 mg/kg), and VI (less than 100 mg/kg). Among them, the area of cropland in Level V was the largest, accounting for 47.5% of the total area of cropland in the study area, which mainly located in the middle south of Wanggangbao Township and middle west in Yongle Township. Then followed by Level VI, the area is 5036 ha, accounting for 47.5%, which mainly distributed in Linhu Street and Wanggangbao Township. In short, from 1980 to 2000, the content of AVK in soil decreased significantly. By 2010, the average content of AVK in soil was 134.29 mg/kg, mainly distributed in Level III, IV, and V, and the area was 3657 ha, 3670 ha, and 3072 ha, respectively. During the 30 years from 1980 to 2010, the average content of AVK in soil decreased, but the trends vary spatially among places. AVK decreased in the first 20 years and increased in the next 10 years, but the ranges of change were different. The average annual decrease was 0.51 mg/kg. In the first two decades (1980–2000), the average content of AVK decreased by 46.04 mg/kg, with an average annual decrease of 2.30 mg/kg, while the average annual increase in the next 10 years (2000–2010) was 1.5 mg/kg.

4.1.2. Spatial Distribution Characteristics of Soil AVK

As shown in Table 2 and Figure 3, the changes of AVK varied over time and space from 1980 to 2010. The magnitude of the AVK increase was between 0 and 30 mg/kg. Overall, an area of 3512 ha, or 31.30% of the total area of the study area, showed an increase of AVK over that study period. It was mainly distributed in the south of Yongle Township. The range of the AVK decline was between −60 to −30 mg/kg to 0 mg/kg, accounting for 53.97% of the total area of the study area. It was mainly distributed in Linhu Street and Wanggangbao Township. The results showed that the content of AVK in the soil near the peripheral region of the city showed a downward trend, and the extent of the decline was gradually increasing, while it showed a slightly increasing trend far away from the city. From 1980 to 2000, the soil AVK content showed a downward trend. The largest decline was more than 60 mg/kg, covering an area of 4508 ha, accounting for 40.17% of the total area of the study area. It mainly distributed in Linhu Stree and Wanggangbao Township. While the declining trend was more moderate in Yongle Township, and the range was 0 ~ 30mg/kg, indicating a trend that the nearer the city is, the larger the decline is. From 2000 to 2010, the soil AVK in the whole study area showed an upward trend. The largest increase was more than 30 mg/kg, covering an area of 5788 ha, accounting for 51.59% of the total area of the study area, mainly concentrated in the southern part of Wanggangbao Township and Yongle Township. That is, the farther away from the urban area is, the greater the increase is.

4.2. Households’ Land-Use Behaviors Change over Time and its Effect on Soil AVK

4.2.1. Households’ Land-Use Behaviors Change over Time

Based on the above theoretical analysis and socioeconomic and environmental changes in the study area, this paper mainly selects some specific indicators to represent land-use behaviors. The areas of grain crops and cash crops are used to measure land-use type, the multiple cropping index is regarded as land use degree (or land use intensity), while chemical fertilizer input is used as land input intensity.

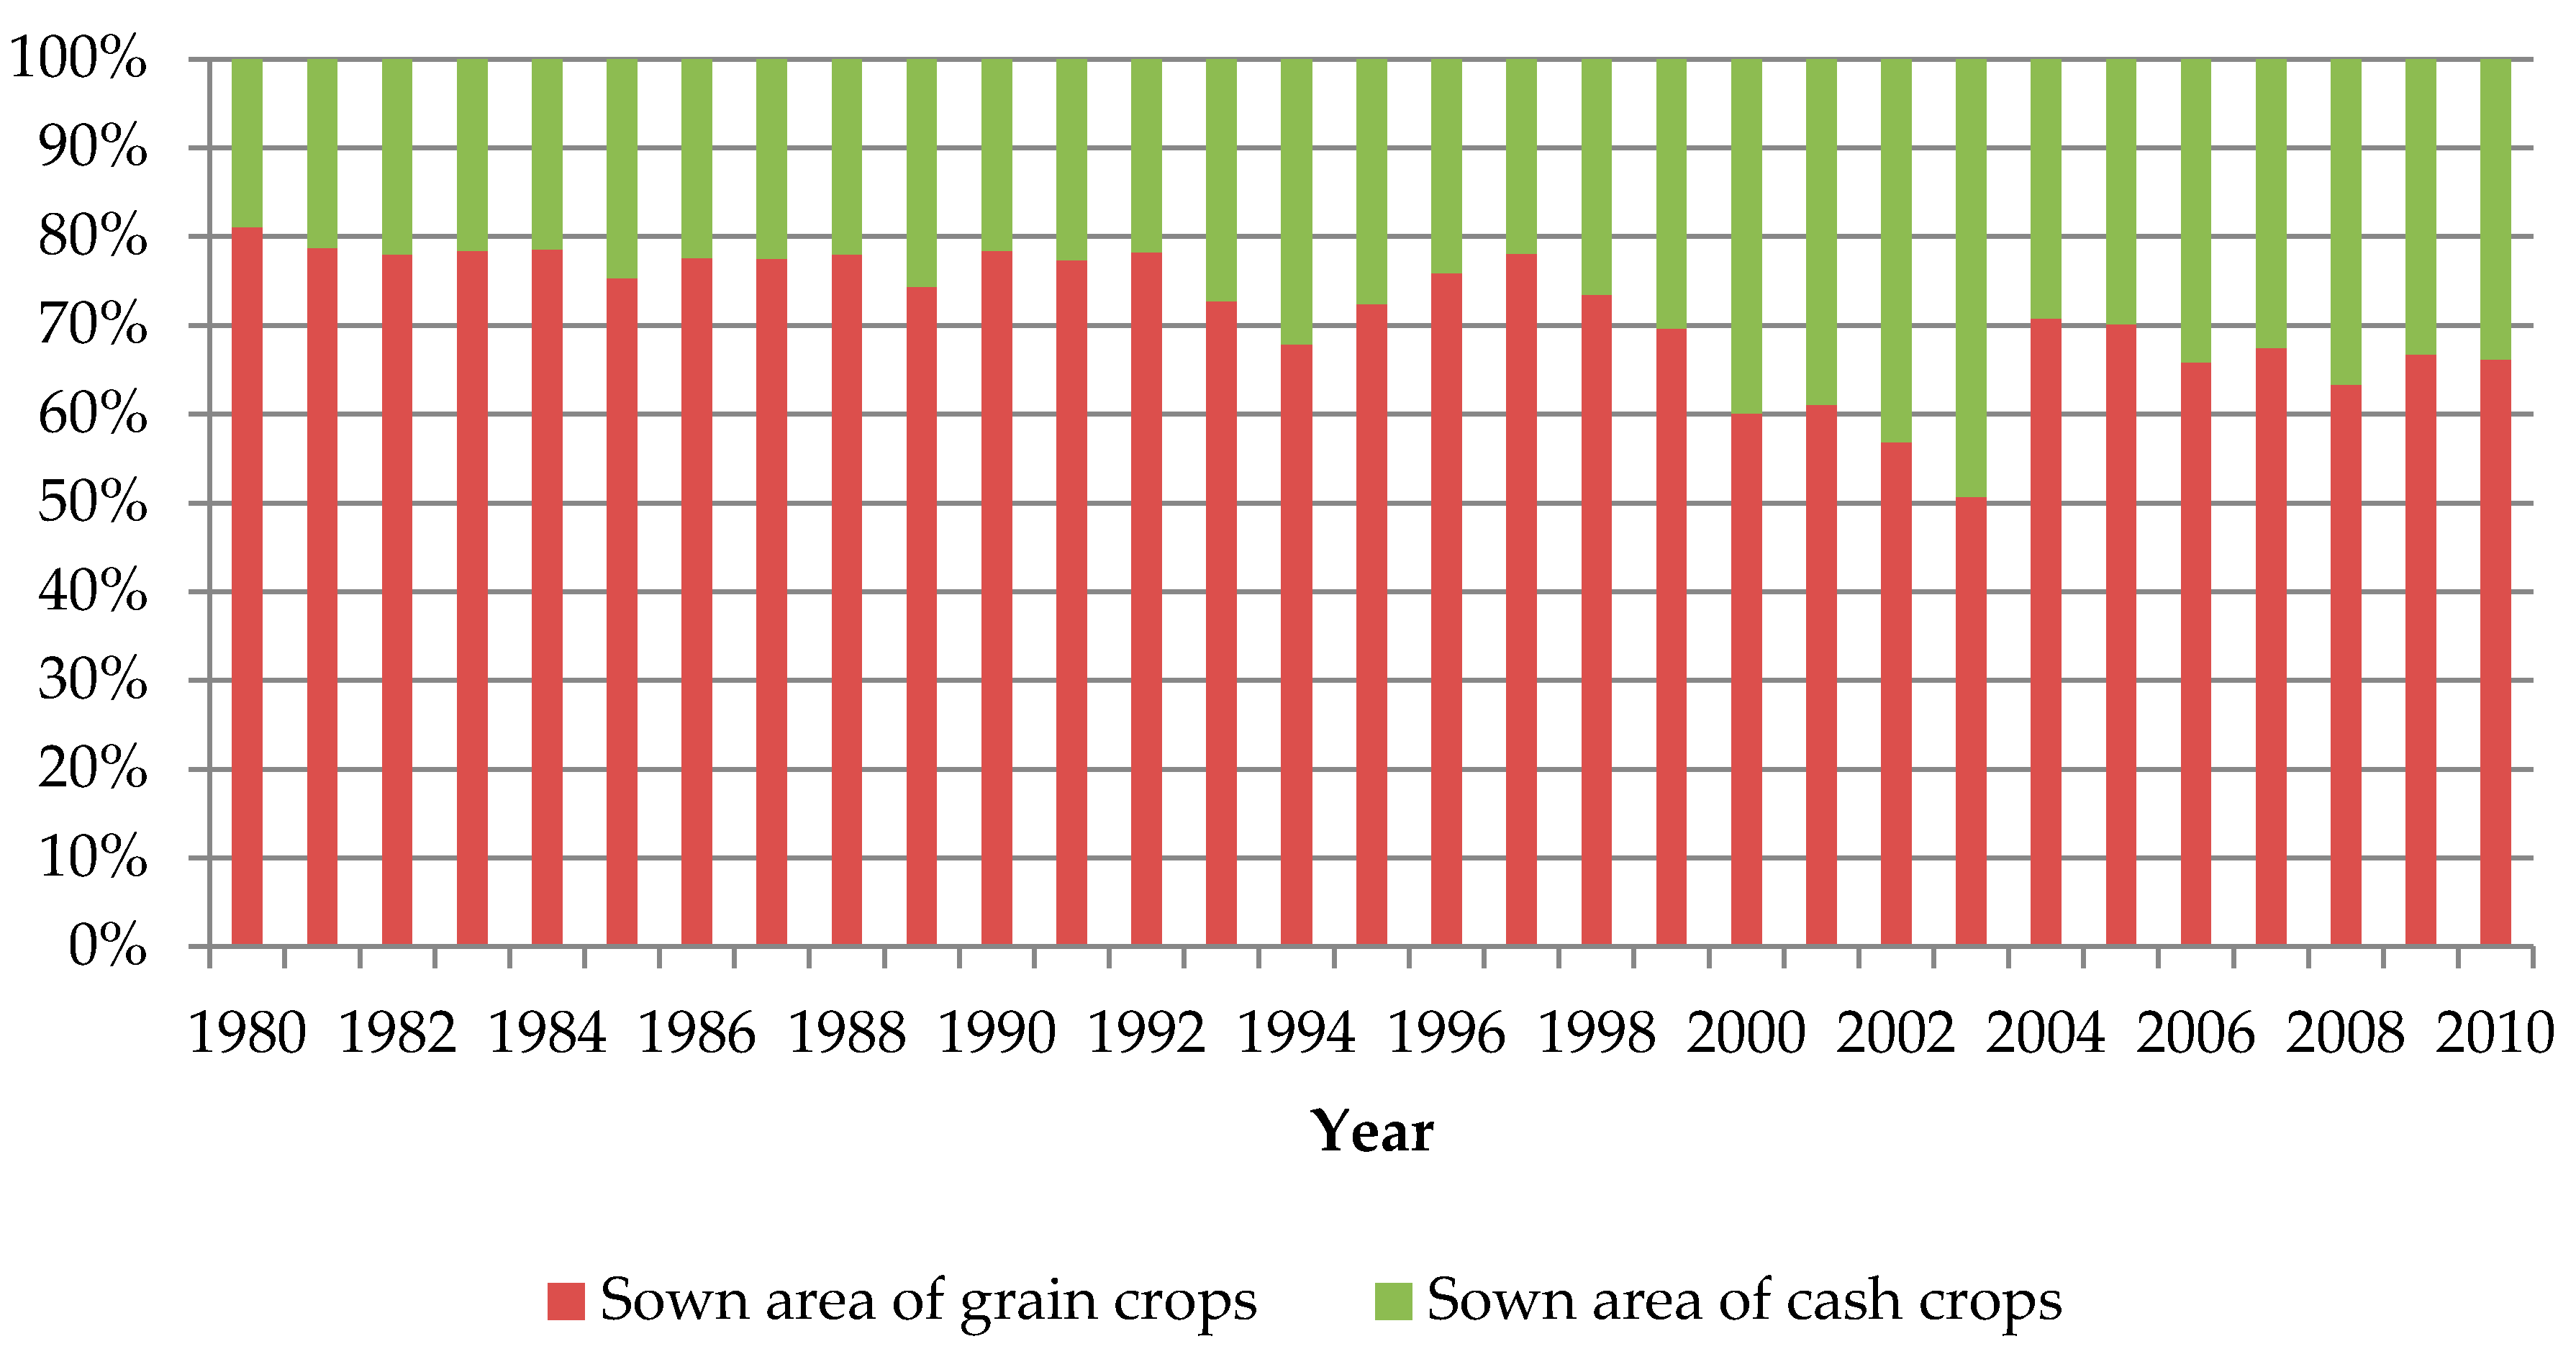
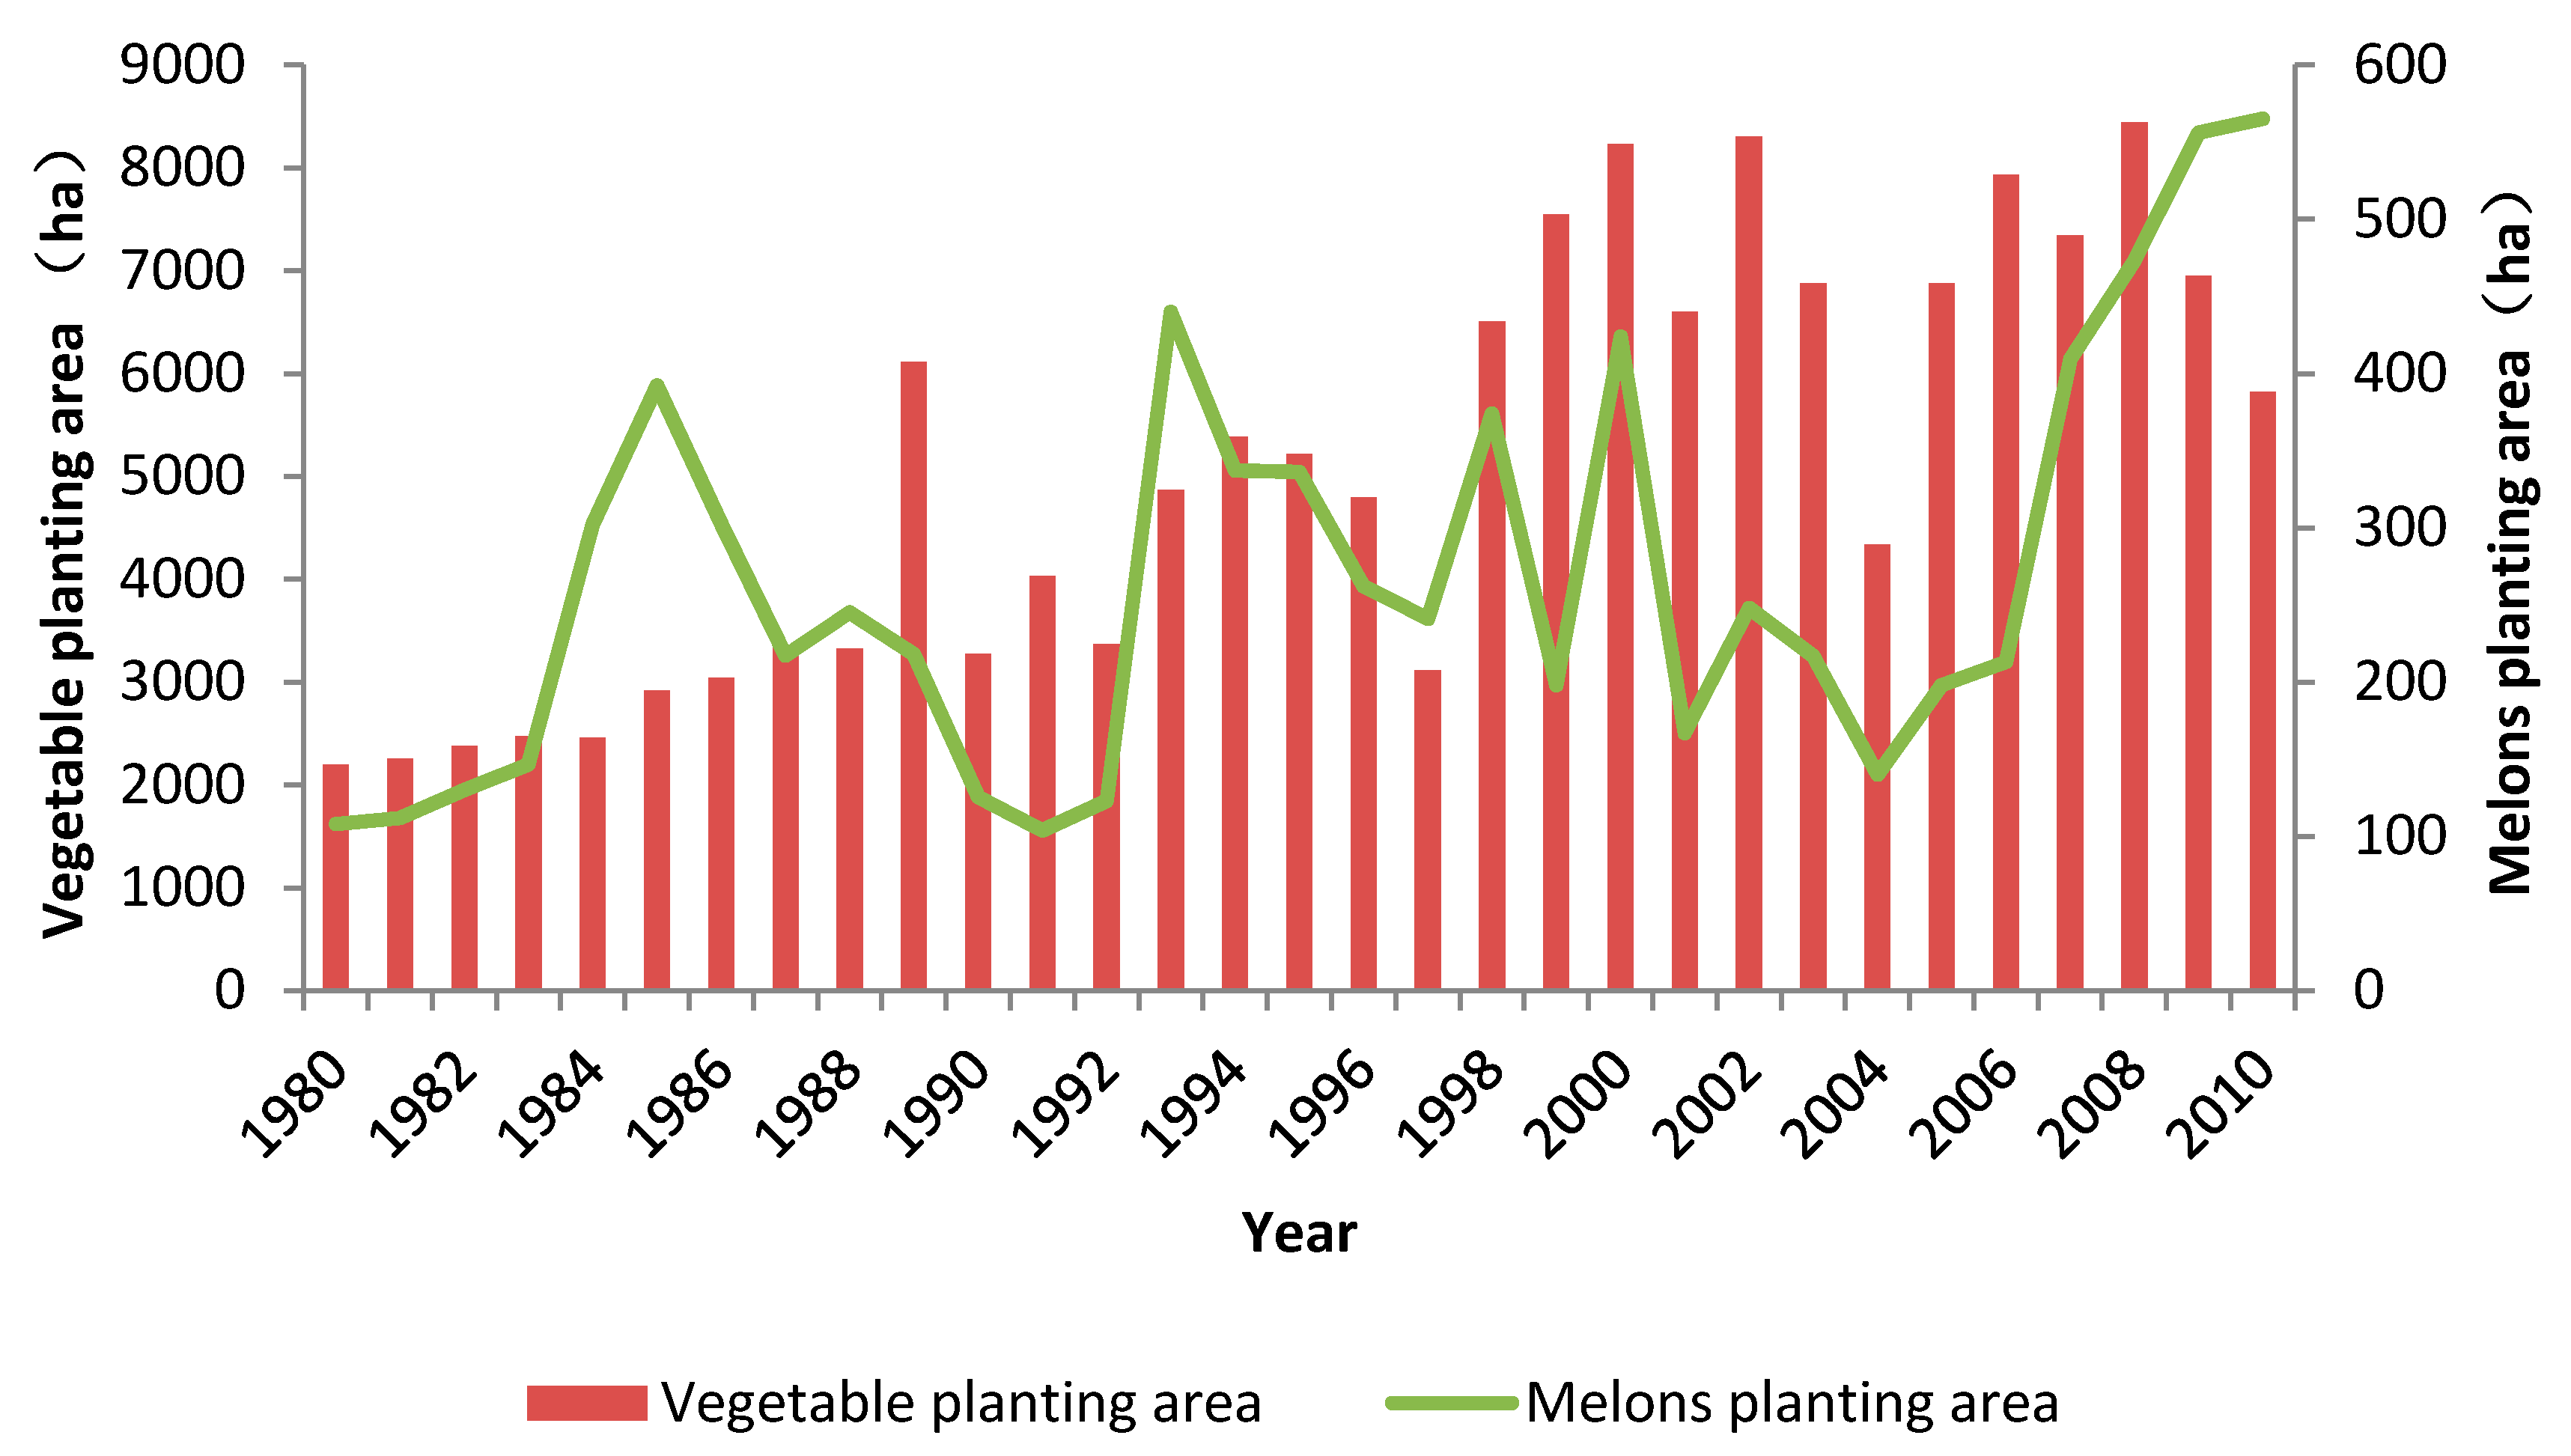
Land-Use Type Change over Time

Figure 4 displays the change in planting area of grain crops (corn and rice) and cash crops (vegetables and melons) from 1980 to 2010 in the Sujiatun District. It indicates that grain crops planting area has declined overall, from 32457 ha in 1980 down to 25812 ha in 2010. The total decrease amounts to 6645 ha in 30 years, with an average annual reduction of 221.5 ha. In particular, the reduction in grain crop area has become more pronounced since 2000. By 2003, the area of grain crops was essentially equal to those of cash crops.
The change in the vegetable planting area has gone through three stages: slow growth, rapid growth, and stabilization (Figure 5). In the first 10 years, the vegetable planting area increased slowly from 2271 ha in 1983 to 3271 ha in 1990, with an average annual growth of 100 ha. In the second 10 years, from 1991 to 1999, the vegetable planting area showed a rapid growth trend, from 4030 ha in 1992 to 8230 ha in 2000, with an average annual growth of 420 ha. In the last 10 years, from 2001 to 2010, the area remained at a high level—about 8000 ha overall.
The change in the planting area of melon and fruit mainly experienced two stages. In the first two decades, the area of melon and fruit cultivation stayed at a low level with an average area of 257 ha. However, during the last 10 years, from 2001 to 2010, the area of the melon and fruit area began to rise rapidly to 565 ha in 2010, which increased nearly four times in ten years.

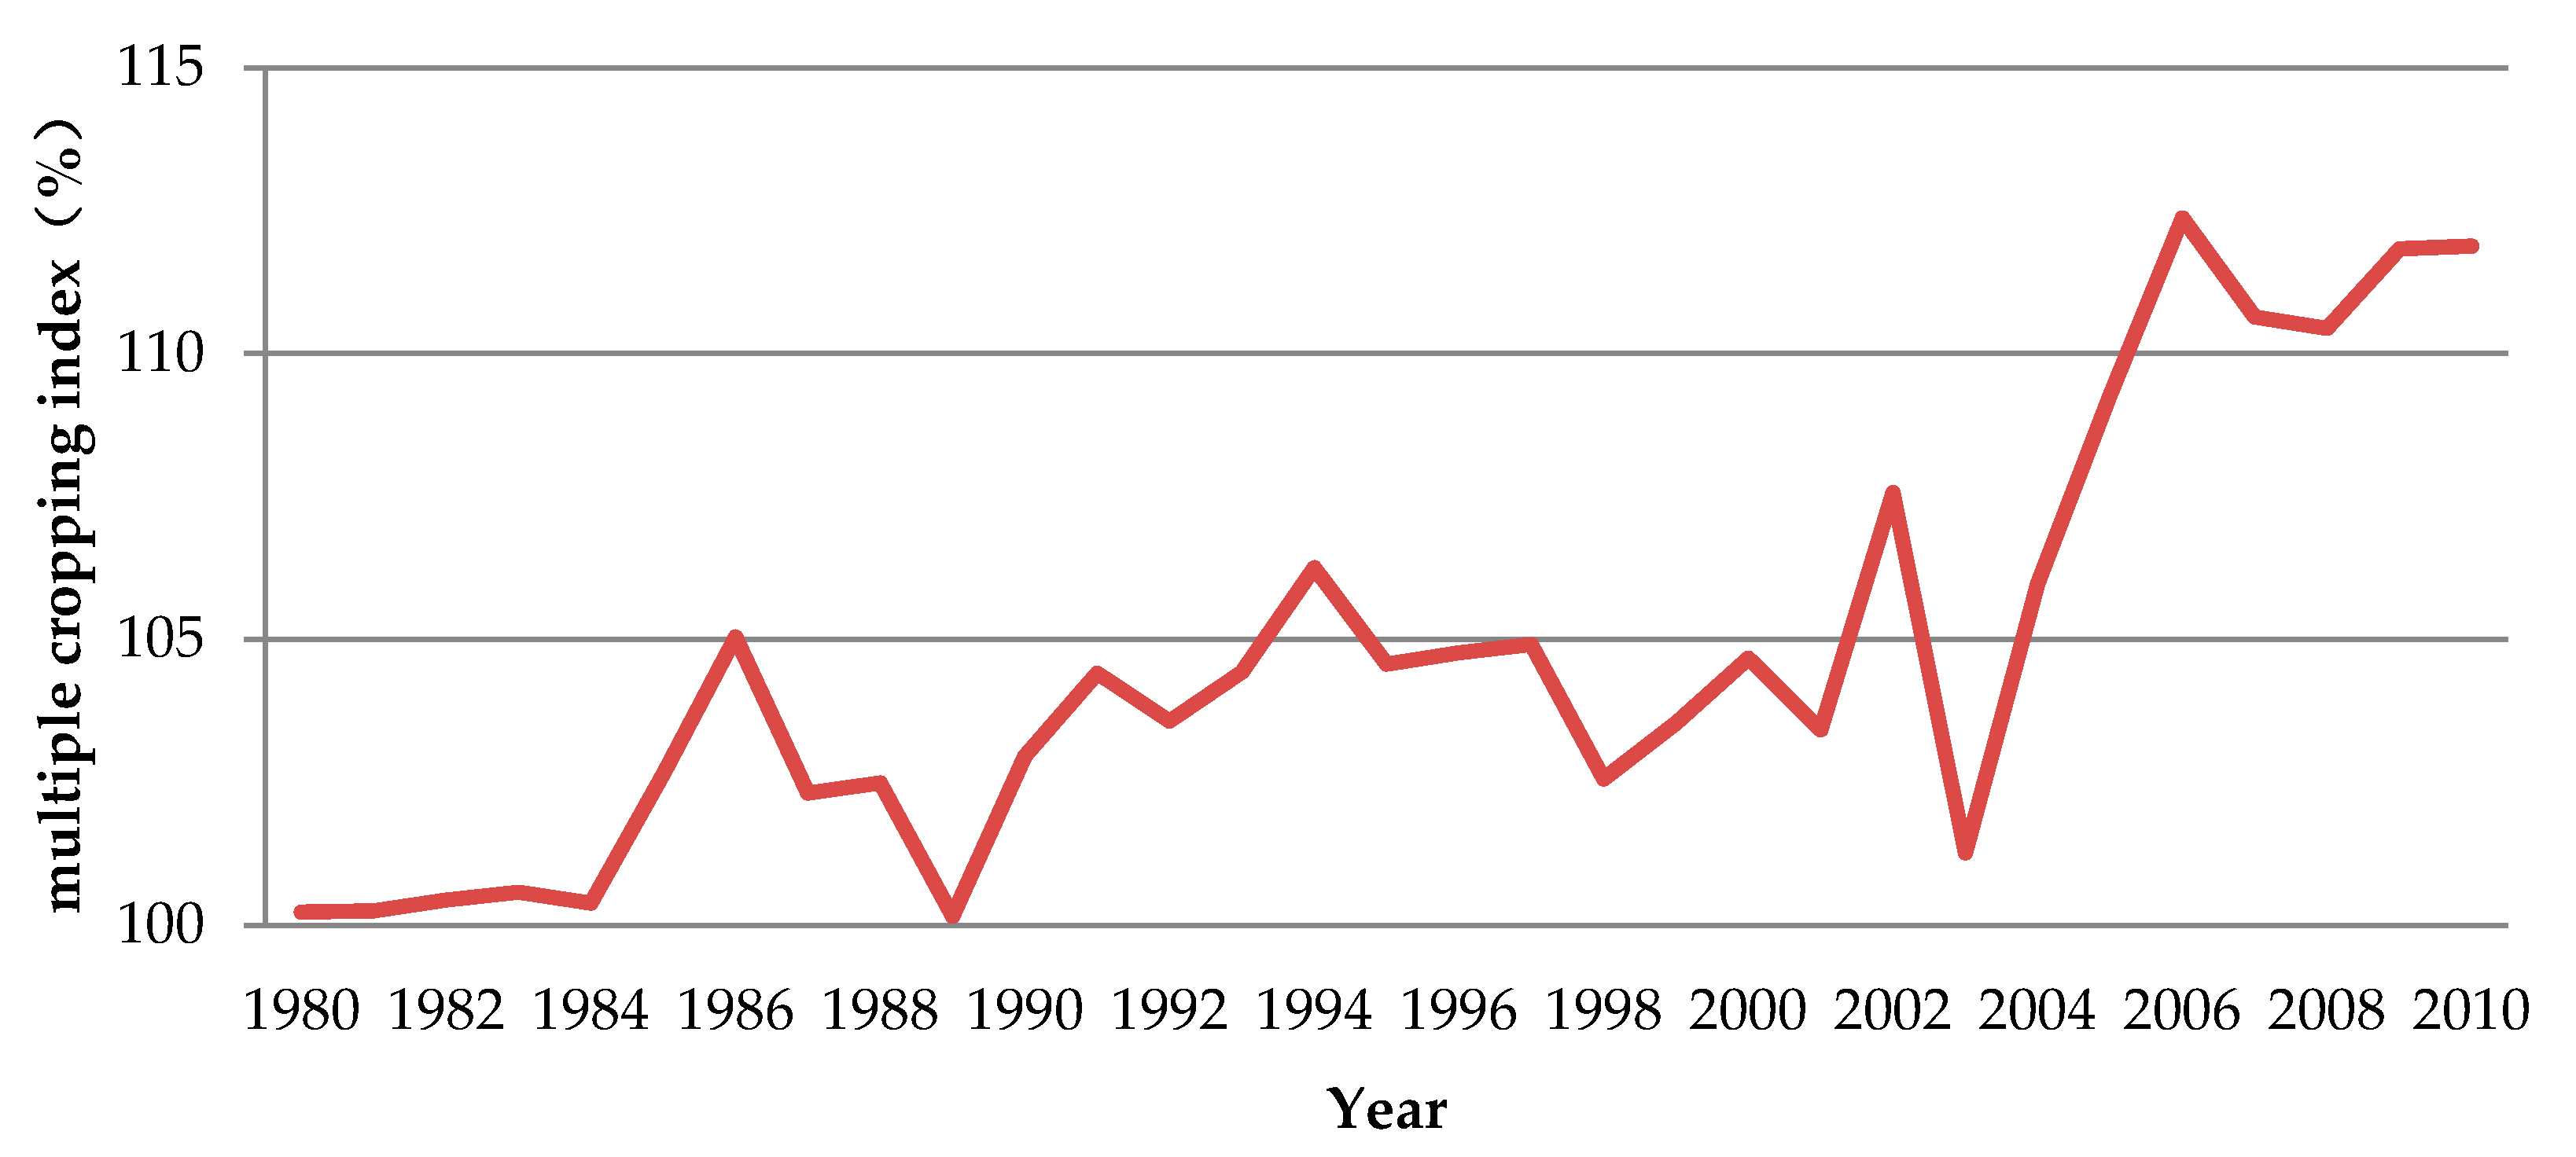
Land Use Degree Change over Time

As an indicator to measure land-use degree, the multiple cropping index can reflect the final impact of population pressure on the cropping system under certain natural resource conditions. The multiple cropping index of households in Sujiatun District from 1980 to 2010 shows that households’ land-use degree is gradually increasing, which can be roughly divided into three stages (shown in Figure 6). In the first stage from 1980 to 1990, the multiple cropping index increased from 100.23% to 102.96%, with a peak of 105.04% in 1986 and a trough of 100.16% in 1989. In the second stage between 1991 and 2000, the change of multiple cropping index is in a relatively stable stage with an annual growth rate of 0.026%. However, the multiple cropping index first rose sharply and then grew steadily in the third stage from 2001 to 2010. The multiple cropping index rose from 103.42% in 2000 to 111.88% in 2010, with a trough of 101.27% in 2003 and a peak of 112.37% in 2006.

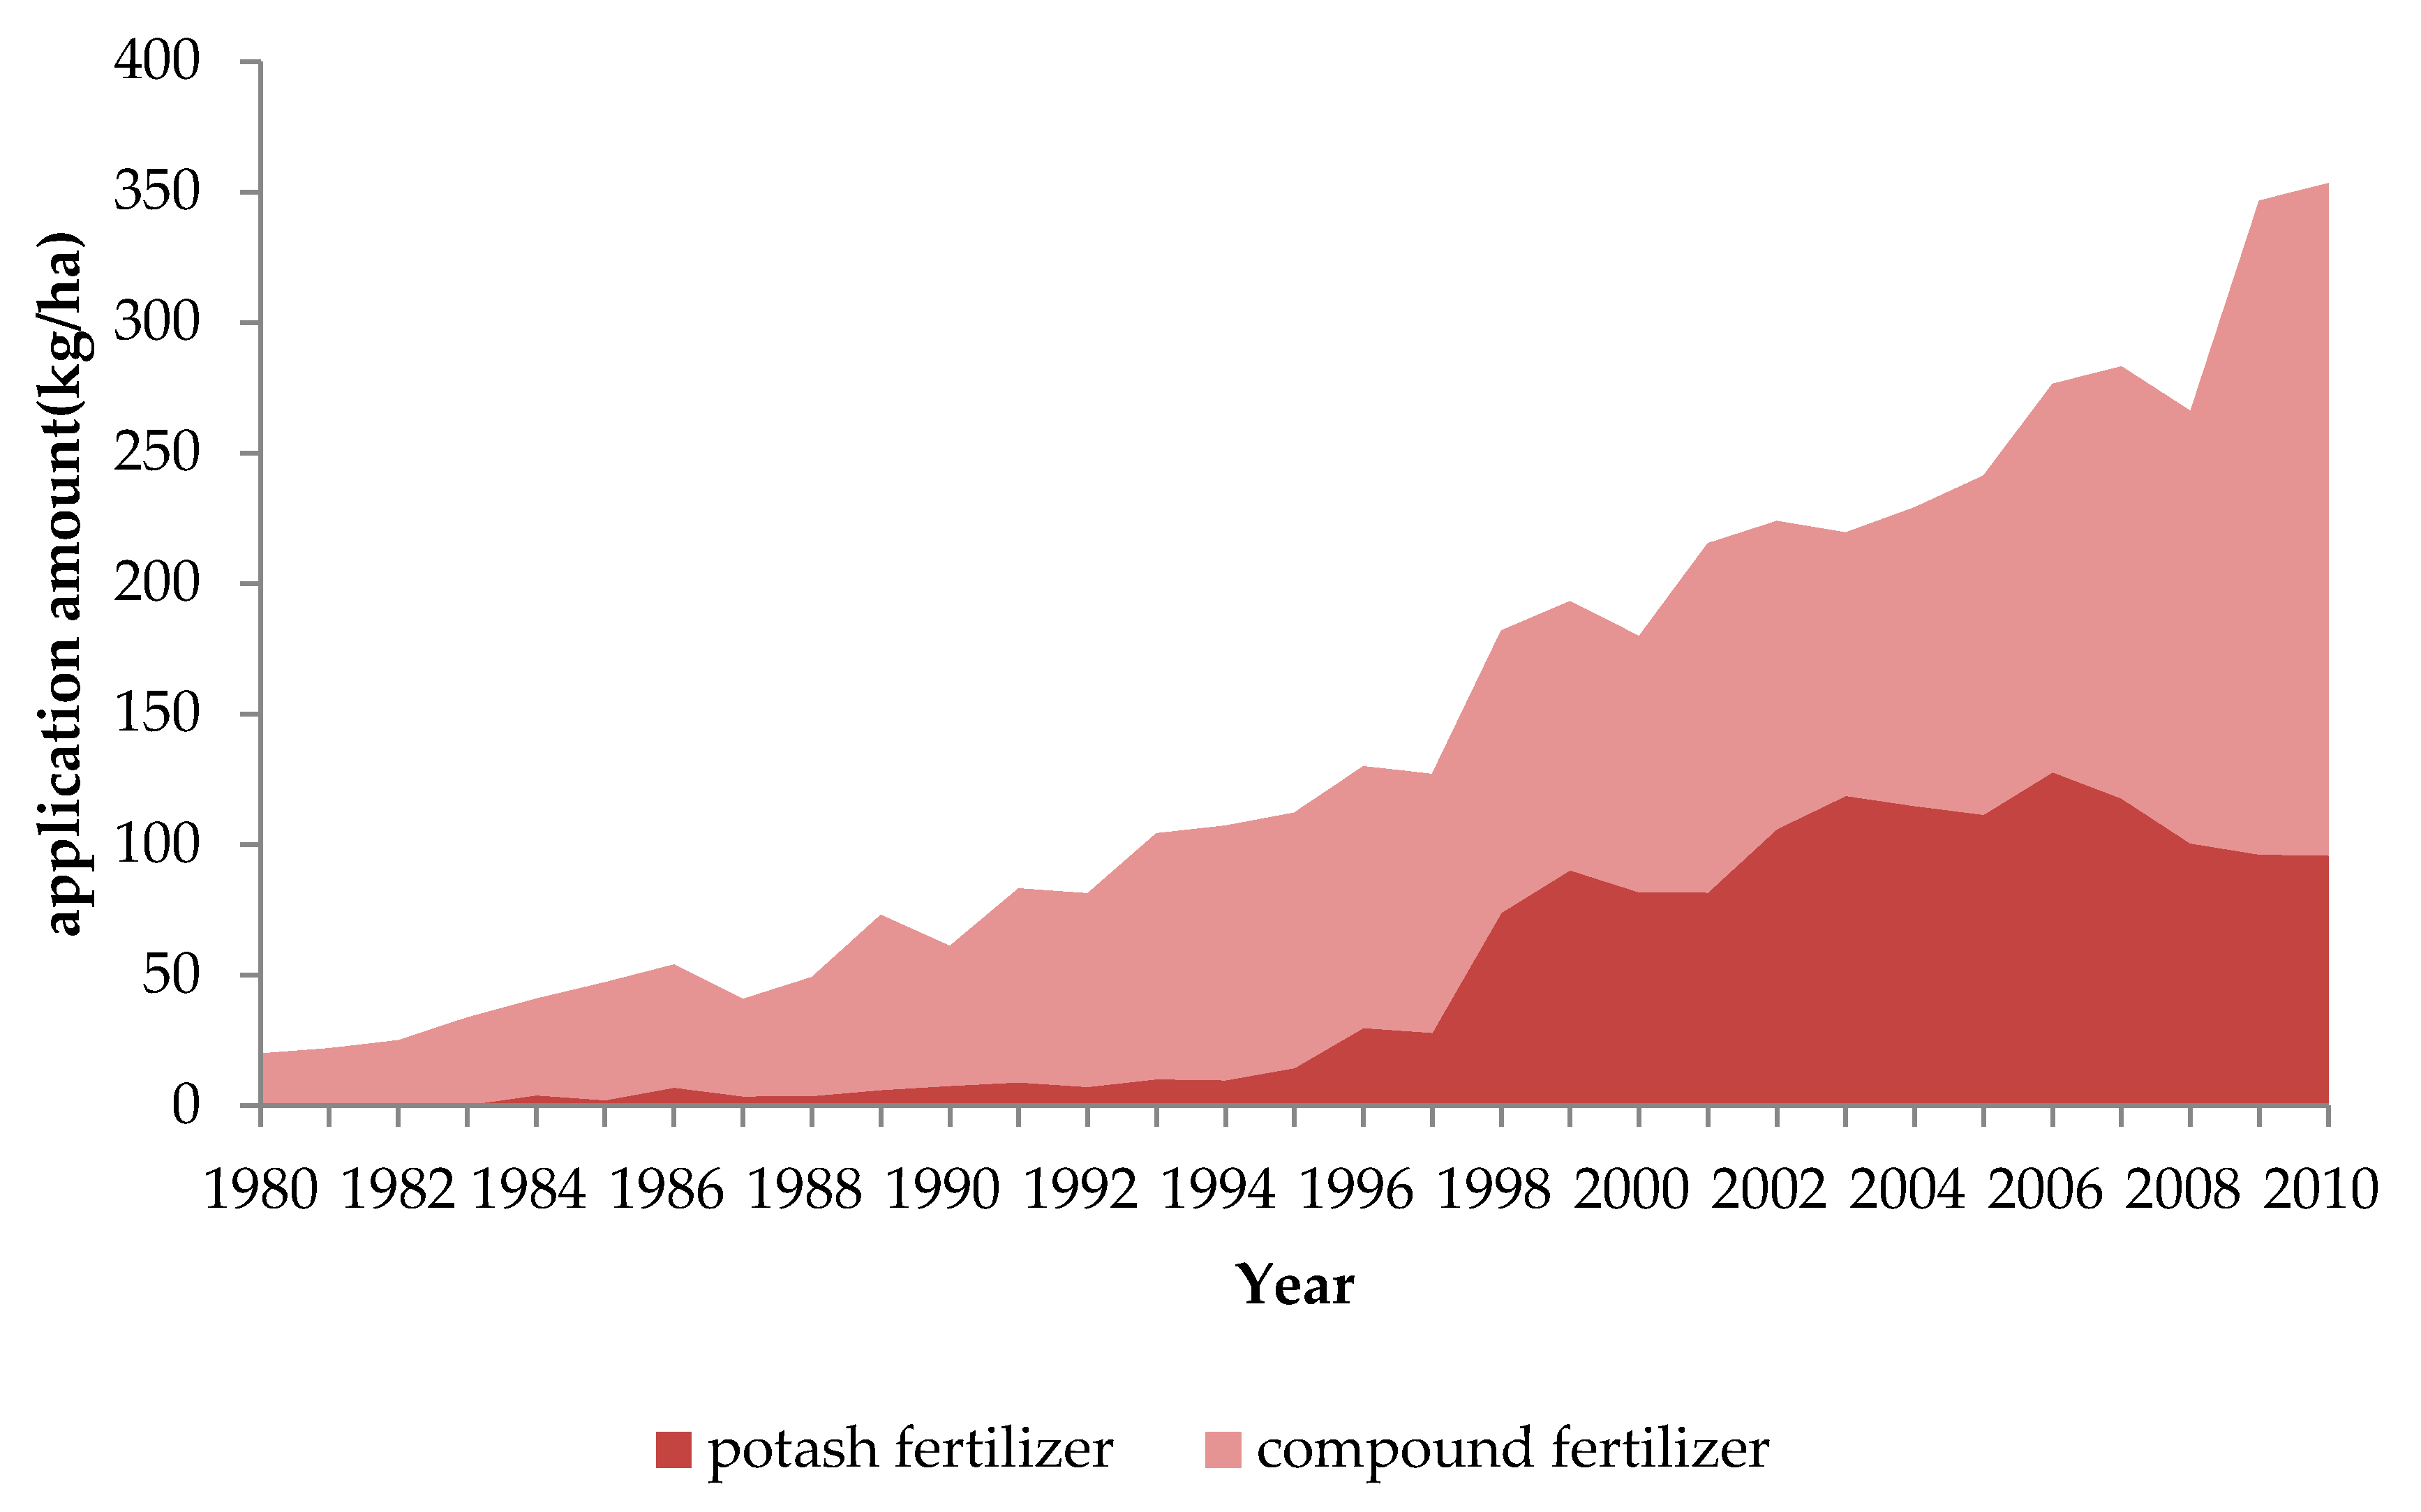
Land Input Intensity Change over Time

It can be seen from Figure 7 that the application intensity of potash fertilizer and compound fertilizer increased from 1980 to 2010, increasing from 0 kg/ha to 96 kg/ha and 20 kg/ha to 257 kg/ha, respectively. The temporal trends of these two fertilizers differed significantly. For the amount of potash fertilizer applied, the changes can be divided into three phases: slow rise (1980–1995), rapid rise (1996–2005), and slow decline (2006–2010). In contrast, the compound fertilizer side, the application amount experienced a slow increase stage (1980–2000), and a significant increase stage (2000–2010). The average annual increase was 3.9 kg/ha in the first stage, while the application amount was 15.9 kg/ha in the second stage, nearly four times as much as the former.

4.2.2. Impact of Households’ Land-Use Behaviors on Temporal Evolution on AVK

In the first stage (1980–2000), the soil AVK content in the whole study area decreased, and the average content decreased from 149.56 mg/kg in 1980 to 103.52 mg/kg in 2000. This time corresponds to the early stage of reform and opening up in China, and GDP per capita has gradually increased from a low level at RMB 1013 (USD 680) in 1980 (shown in Figure 8), and then grew to RMB 10,125 USD (1212) in 1995 and RMB 15,666 (USD 1,982) in 20001. Under such a socioeconomic background, households’ land-use behaviors are mainly characterized by the cultivation of corn and rice, and the area of cash crops remained low, but started to slowly increase. As a result of the cultivation of corn and rice, the multiple cropping index also grew slowly. In terms of agricultural inputs, the input of compound fertilizer and potash fertilizer is at a low level, and this leads to a significant decline in soil AVK content in this area.
In the second stage (2000–2010), the soil AVK content in the whole study area tended to increase, and the average content increased from 103.52 mg/kg in 2000 to 134.27 mg/kg in 2010. At this stage, GDP per capita increased from RMB 15,666 (USD 1,892) in 2000 to RMB 62,357 (USD 9,211) in 2010—nearly an four-fold increase. The labor force engaged in agriculture also began to shift and differentiate. The proportion of employment in agriculture dropped from 23.5% in 2000 to 10.9% in 2010. Under the influence of the external socioeconomic environment, the land use behavior of households had also undergone major changes. The proportion of cash crops increased rapidly, and so did multiple cropping index and fertilizer application; all of them reached a high level in 2010. Negative potassium balance can happen when potassium removal from agricultural cultivation is greater than the application of potassium fertilizer. The deficiency of potassium fertilizer has become the main constrain for the increase in crop yield. Realizing the problem, farm households have increased the amount of potassium fertilizer since 1998. While after 2005, local soil and fertilizer stations began to promote soil testing and customized fertilization technology, so that households gradually learned that an optimal ratio of nitrogen, phosphorus, and potassium in the soil could increase the yield more effectively. As a result of these changes in the land-use behaviors of the households, the AVK content increased significantly and households began to practice intensive farming to obtain the maximal benefit.

4.3. Temperal Evolution of Households’ Land-Use Behaviors and its Effect on Soil AVK

4.3.1. Spatial Variation of Households’ Land-Use Behaviors

Spatial Variations of Land Use Type

Through the investigation on the three study areas, it was found that there were obvious spatial differences in households’ crop selection behaviors, and the crop selection options were divided into three types of households including grain crops only, both grain crops and cash crops, and cash crops only. Moreover, as the distance from the city center increases, the grain crop area gradually decreases, while the cash crops area gradually increase. As shown in Table 3, Linhu Street, the closest to Shenyang City, 93.7% of the respondents in this area only planted grain crops, while the proportion in Yongle Township, the farthest from the city center, is just 2.5%. Nearly 45% of the respondents in Wanggangbao Township selected both grain crops and cash crops, where is in the middle of the three study area.

Spatial Evolution of Land Use Degree

Regarding the multiple cropping index (MCI), we divided the respondents into five groups between 1.0 and 3.0, with 0.5 as intervals. The results show that the farther from the city center is, the higher of MCI is. The MCI values of 93.7% of the respondents in Linhu Street were 1.0—as they mainly grew corn once per year, while half of the respondents in Wanggangbao Township have MCI values above 1.0. However, the proportion of respondents, whose MCI is above 1.0 in Yongle Township, is about 97.5%; specifically, 39.5% of them have MCI between 1.5 and 2.0, and more than 30% of them have MCI over 2.0.

Spatial Evolution of Land Input Intensity

Land investment mainly includes labor input and capital investment, and the labor force is divided into self-employed labor and employment. Therefore, this study is mainly focused on the differences in household’s self-employment input, employee input, and household’s capital investment. The spatial evolution between self-employment and employment is similar, that is, as the distance from the city increases, the number of self-employed and employment inputs increased gradually. In terms of the capital investment intensity, the proportion of households in Linhu Street decreased with the increase of land input intensity, which are 91.1%, 7.6%, 1.3%, and 0.0%, respectively. In the opposite direction of Yongle Township, the proportion increased by 11.1%, 8.6%, 11.1%, and 69.2%, respectively, meaning the land input intensity was higher. Wanggangbao Township in the outer peripheral region is located between the first two regions, and the change range is relatively small.
These results indicate that with the accelerating process of industrialization and urbanization, households’ land-use targets and land use types in the study area have significantly diverged. Specifically, the households in the suburban Linhu Street mainly engage in off-farm work or business, and agriculture becomes less important in livelihood. Farmers plant grain crops such as corn, which are time-saving and labor-saving, with low land-use and labor intensity. While the households who are in the outer suburb of Yongle Township mainly involved in agriculture. They planted vegetables and greenhouse vegetables, meaning the land use degree and land input intensity are the highest. The households in Wanggangbao Township located in the middle place, are mainly part-time households, and they plant both corn and vegetables. As a result, the land use degree and land input intensity are also in the middle of Linhu Street and Yongle Township. The differences in land-use behaviors of various types of households in different regions are bound to have different effects on the changes of AVK in cropland soil.

4.3.2. Empirical Results of the Impact of Households’ Land-Use Behavior in Spatial Evolution on AVK

To quantitively analyze the impact of households’ land-use behaviors on the AVK content, multiple linear regression models were used by testing and comparing different model estimation forms. As shown in Table 4, land use types, land use degree and input intensity have different effects on the change of AVK content in cropland soil. Specifically, households’ crop selection behavior has a significant positive impact on the soil AVK content in Wanggangbao Township, with a significant level of 1%. It indicates that when other conditions remain unchanged, the switch from grain to cash crops will lead to an increase of soil AVK by an average of 61.205 mg/kg. The multiple cropping index had a significant negative impact on AVK in Linhu Street. While holding other variables constant, soil AVK in the study area decreases by an average of 15.469 mg/kg for each additional unit of the multiple cropping index. While land input intensity has a significant positive impact on the soil AVKcontent in Wanggangbao Township and Yongle Township, indicating that land input intensity increases by 1 yuan per mu unit, the average AVK content increased by 0.009 mg/kg and 0.037 mg/kg, respectively. That is, the impact on Yongle Township was greater than that on Wanggangbao Township.
Due to the different effects of land-use behaviors of households in various regions, the soil AVK appears obvious spatial differences. The main reason is that households in the suburban Linhu street are affected by urban expansion and with more off-farm employment opportunities. The households there mainly plant corn and other field crops, and land use degree and land input intensity are both low, due to the relatively low efficiency of agricultural production. While the households in the remote suburb of Yongle Township, they mainly plant land vegetables and greenhouse vegetables to meet the need of urban residents, with the highest level of land use degree and land input intensity. Households in Wanggangbao Township in the middle of the study area can choose both grain crops and cash crops, and they mainly grow corn and terrestrial vegetables, with higher land-use degrees and greater land input intensity. The resulting land-use intensity forms a ring structure surrounding the central city and resembles a distribution pattern of “anti Thunen circle” in space, which is a special manifestation of classical agricultural location theory.

5. Discussion

Compared with previous studies [5,19,41], this study reveals the temporal and spatial evolution characteristics of soil AVK in the marginal zone of large cities based on continuous, high-density soil sampling data, and discusses the underlying reasons for this evolutionary feature from the micro perspective of households, according to long-term sequence statistics and households’ survey data. It answers what kind of change takes place in the AVK content in time and space at the plot scale, and its relationship with households’ land-use behavior in the peripheral region of the big cities. It is of great significance to explore the regular pattern of soil fertility change in cropland. On one hand, this study establishes links between soil science and economics, and reveals the influence mechanism of households’ land-use behaviors on soil AVK content from the temporal and spatial dimensions, which may inspire future multi-disciplinary researches. On the other hand, this study has important policy implications. Generally, the fringe area of large cities is the most sensitive area for developing urban modern agriculture. The understanding of how households’ land-use behaviors affect the AVK content of the soil helps the government and policymakers to propose corresponding systems and policies to regulate households’ agricultural production activities and promote the sustainability of soil production capacity and environment. Finally, it realizes the dynamic analysis using multivariate data, including the soil survey data, households’ survey data, and socio-economic statistics.
Although we have obtained important and interesting research results, there is no denying that this study still has the following limitations: firstly, regarding the data, we only obtained three phases data of soil AVK content, therefore, it is impossible to analyze the impact of households’ land-use behavior on soil AVK content in the time dimension, by constructing an econometric time series analysis—which still lacks in this research, as we only have a households survey at a single point in time. Secondly, biophysical factors in this study, given the relatively short-time period, are assumed to be constant, despite the fact that biophysical factors and human factors are the two most important factors for the quality of soil quality change. The biophysical factors, such as topography, climate, parent material, and organisms, usually change slowly compared to human factors, so the effects need to be analyzed on a medium and long term basis. Additionally, we selected the area that is least affected by biophysical factors and greatest influenced by human factors as the study area. Nevertheless, future researches should examine how biophysical factors, especially climate change affect long-term soil AVK content.
With the increasing influences of human activities on land quality, social, economic, and human factors have become increasingly prominent in affecting the quality of cropland. Therefore, multidisciplinary and multi-dimensional pattern detection and analysis are important to investigate the temporal and spatial dynamics of cropland quality, such as the connecting spatial information data with socialeconomic data of microeconomic subjects. The multi-model coupling process and mechanism analysis are therefore promising and important fields for future researches in this regard, for example, the simulation of households’ land-use behaviors affecting the quality of cultivated land under different incentive policies and measurements. At the same time, the soil quality variation of croplands is a dynamic and complex process. Further researches are thus needed on the optimization of spatial soil sampling to facilitate the continuous soil quality monitoring. In addition, panel data on households’ land-use behaviors, which is lacking in this research, would help greatly in deepening the research.

6. Conclusions

This paper constructs a theoretical analysis framework for the impact of households’ land-use behaviors on soil AVK content from the spatial and temporal dimensions. The empirical research was conducted based on the matching data of high-density soil sampling data, long-term sequence statistics, and cross-sectional household survey data in the Sujiatun area of Shenyang City, Liaoning Province, China, comprehensively using the approach of geostatistics, econometric methods, and GIS. The results of this study can be summarized as:
(1)
Although the AVK content of the soil in the study area has a largely downward trend in the past 30 years, there are different trends in different stages. This variation can be attributed to to the gradual evolution of households’ land-use behaviors. From 1980 to 2000, the average value of AVK decreased from 149.56 mg/kg to 103.52 mg/kg, due to the underdeveloped economy, limited investment capacity, technology level, and management level, as well as the plunder of cropland. After the year 2000, with the acceleration of the urbanization process and driven by economic interests, households gradually seek to maximize profits by increasing agricultural production. This was achieved by improving potassium use management: the use of potassium soil test, potassium nutrient budgeting, and the increasing use of potassium fertilizers. As a result, the average of AVK rose to 134.27 mg/kg in 2010 with an increased rate of 29.70% compared to the year 2000.
(2)
The spatial variation of AVK is also substantial and intriguing. The closer to the urban area, the greater the decline of soil AVK content, while the farther away from the urban area, the greater the rise. This can be attributed to the differences in households’ land-use behaviors in different areas. The households in the near peripheral region mainly engage in off-farm work and only cultivate time and labor-saving corns. This leads to a low land-use degree and low input intensity, while the households further away from the city center mainly rely on agriculture as the major income source and pursue profit maximization resulting in the highest land-use degree and land input intensity.
This research provides a glimpse of how the land-use behaviors of small farm households influence the soil AVK through an empirical study in Northeastern China. It reveals the complex spatial dynamics of soil AVK driven by socioeconomic development. The results also shed light on how policy measurements can be designed to steer farmer’s behaviors and preserve soil for sustainable agricultural production.

Author Contributions

Conceptualization, H.L., Z.S. and X.L.; Formal Analysis, H.L. and X.D.; Funding Acquisition, X.L. and H.L.; Data Curation, H.L. and M.W.; Methodology, H.L. and X.D.; Writing-Review & Editing, H.L., Z.S. and X.L. All authors have read and agreed to the published version of the manuscript.

Funding

This research was funded by National Natural Science Foundation of China, under Grant: 71503174; 71503113; 71373127; Liaoning Province Social Science Planning Foundation, under Grant: L18BJY006; Foundation for Young Scientific and Innovative Talents in Shenyang City (RC170180); Jiangxi Province Social Science Planning Foundation, under Grant: 18GL08, and Research Project of Social Science and Economic Development in Liaoning Province, under Grant: 20201s1ktyb-077.

Conflicts of Interest

The authors declare no conflict of interest.

References

  1. Jin, J.J.; He, R.; Wang, W.Y.; Gong, H. Valuing cultivated land protection: A contingent valuation and choice experiment study in China. Land Use Policy 2018, 74, 214–219. [Google Scholar] [CrossRef]
  2. Jiang, G.; Zhang, R.; Ma, W.; Zhou, D.; Wang, X.; He, X. Cultivated land productivity potential improvement in land consolidation schemes in Shenyang, China: Assessment and policy implications. Land Use Policy 2017, 68, 80–88. [Google Scholar] [CrossRef]
  3. Liu, J.; Guo, Q. A spatial panel statistical analysis on cultivated land conversion and Chinese economic growth. Ecol. Indic. 2015, 51, 20–24. [Google Scholar] [CrossRef]
  4. Wu, Y.; Shan, L.; Guo, Z.; Peng, Y. Cultivated land protection policies in china facing 2030: Dynamic balance system versus basic farmland zoning. Habitat Int. 2017, 69, 126–138. [Google Scholar] [CrossRef]
  5. Xia, M.; Zhao, B.; Hao, X. Soil quality in relation to agricultural production in the North China Plain. Pedosphere 2015, 25, 592–604. [Google Scholar] [CrossRef]
  6. Evangelou, V.P.; Wang, J.; Phillips, R.E. New developments and perspectives on soil potassium quantity/intensity Relationships. Acad. Press 1994, 52, 173–227. [Google Scholar]
  7. Zanati, M.R.; Guirguis, M.A.; Saber, M.S.M. Biological and chemical determination of available potassium in soil. Zentralblatt Für Bakteriologie, Parasitenkunde, Infektionskrankheiten Und Hygiene. Zweite Naturwissenschaftliche Abteilung: Allgemeine. Landwirtsch. Techn. Mikrobiol. 1973, 128, 572–577. [Google Scholar]
  8. Bilias, F.; Barbayiannis, N. Potassium availability: An approach using thermodynamic parameters derived from quantity-intensity relationships. Geoderma 2019, 338, 355–364. [Google Scholar] [CrossRef]
  9. Zhang, S.; Zhang, X.; Liu, X. Spatial distribution of soil available potassium in different slope profiles of typical black soil region. Soil 2014, 46, 218–224. (In Chinese) [Google Scholar]
  10. John, V.S. Precision Agriculture ‘19, 1st ed.; Wageningen Academic Publishers, Wageningen University & Research: Wageningen, The Netherlands, 2019; pp. 1–1030. [Google Scholar]
  11. Cammarano, D.; Holland, J.; Ronga, D. Spatial and temporal variability of spring barley yield and quality quantified by crop simulation model. Agronomy 2020, 10, 393. [Google Scholar] [CrossRef] [Green Version]
  12. Milkevych, V.; Munkholm, L.J.; Chen, Y.; Tavs, N. Modelling approach for soil displacement in tillage using discrete element method. Soil Tillage Res. 2018, 183, 60–71. [Google Scholar] [CrossRef]
  13. Lin, T.; Sun, C.; Li, X.; Zhao, Q.; Zhang, G.; Rubing, G.; Ye, H.; Huang, N.; Yin, K. Spatial pattern of urban functional landscapes along an urban–rural gradient: A case study in Xiamen City, China. Int. J. Appl. Earth Obs. Geoinf. 2016, 46, 22–30. [Google Scholar] [CrossRef]
  14. Ho Leung, I.P.R.; Li, W.K. Matérn cross-covariance functions for bivariate spatio-temporal random fields. Spat. Stat. 2016, 17, 22–37. [Google Scholar]
  15. Abdelrahman, M.A.E.; Natarajan, A.; Hegde, R.; Prakash, S.S. Assessment of land degradation using comprehensive geostatistical approach and remote sensing data in GIS-model builder. Egypt. J. Remote Sens. Space Sci. 2018, 12, 1–12. [Google Scholar] [CrossRef]
  16. Hou, D.; O’Connor, D.; Nathanail, P.; Tian, L.; Ma, Y. Integrated GIS and multivariate statistical analysis for regional scale assessment of heavy metal soil contamination: A critical review. Environ. Pollut. 2017, 231, 1188–1200. [Google Scholar] [CrossRef] [PubMed]
  17. Abdelrahman, M.A.E.; Natarajan, A.; Srinivasamurthy, C.A. Estimating soil fertility status in physically degraded land using GIS and Remote Sensing techniques in Chamarajanagar District, Karnataka, India. Egypt. J. Remote Sens. Space Sci. 2016, 19, 95–108. [Google Scholar] [CrossRef] [Green Version]
  18. Wang, B.; Waters, C.; Orgill, S. Estimating soil organic carbon stocks using different modelling techniques in the semi-arid rangelands of Eastern Australia. Ecol. Indic. 2018, 88, 425–438. [Google Scholar] [CrossRef]
  19. Behm, S.; Haupt, H.; Schmid, A. Spatial detrending revisited: Modelling local trend patterns in NO2-concentration in Belgium and Germany. Spat. Stat. 2018, 28, 331–351. [Google Scholar] [CrossRef]
  20. He, P.; Yang, L.; Xu, X. Temporal and spatial variation of soil available potassium in China (1990–2012). Field Crops Res. 2015, 173, 49–56. [Google Scholar] [CrossRef]
  21. Zhang, L.; Shuang, W.; Yun, A. Spatial and temporal variability of available potassium in soils and its influencing factors in Quzhou County, Hebei Province during the past 30 years. Chin. Agric. Sci. 2014, 47, 923–933. (In Chinese) [Google Scholar]
  22. Dai, W.; Zhao, K.; Fu, W.; Jiang, P.; Li, Y.; Zhang, C. Spatial variation of organic carbon density in topsoils of a typical subtropical forest, Southeastern China. Catena 2018, 167, 181–189. [Google Scholar] [CrossRef]
  23. Shi, S.; Cao, Q.; Yao, Y.; Tang, H.; Yang, P.; Wu, W. Influence of climate and socio-economic factors on the spatio-temporal variability of soil organic matter: A case study of central Heilongjiang Province, China. J. Integr. Agric. 2014, 13, 1486–1500. [Google Scholar] [CrossRef]
  24. Zimmerman, E.K.; Tyndall, J.C.; Schulte, L.A.; Larsen, G.L.D. Farmer and farmland owner views on spatial targeting for soil conservation and water quality. Water Resour. Res. 2019, 55, 3796–3814. [Google Scholar] [CrossRef] [Green Version]
  25. Kuria, A.W.; Barrios, E.; Pagella, T.; Muthuri, C. Farmers’ knowledge of soil quality indicators along a land degradation gradient in Rwanda. Geoderma Reg. 2019, 16, 1–14. [Google Scholar] [CrossRef]
  26. Bai, Z.; Caspari, T.; Gonzalez, M.R.; Niels, H.B.; Paul, M.; Else, K.B.; Ron de, G.; Lijbert, B.; Minggang, X.; Carla, S.S.F.; et al. Effects of agricultural management practices on soil quality: A review of long-term experiments for Europe and China. Agric. Ecosyst. Environ. 2018, 265, 1–7. [Google Scholar] [CrossRef]
  27. Ebanyat, P.; de Ridder, N.; de Jager, A.; Robert, J.D.; Mateete, A.B.; Ken, E.G. Drivers of land use change and household determinants of sustainability in smallholder farming systems of Eastern Uganda. Popul. Environ. 2010, 31, 474–506. [Google Scholar] [CrossRef] [Green Version]
  28. Marenya, P.P.; Barrett, C.B. Soil quality and fertilizer use rates among smallholder farmers in Western Kenya. Agric. Econ. 2009, 40, 561–572. [Google Scholar] [CrossRef]
  29. Su, M.; Guo, R.; Hong, W. Institutional transition and implementation path for cultivated land protection in highly urbanized regions: A case study of Shenzhen, China. Land Use Policy 2019, 81, 493–501. [Google Scholar] [CrossRef]
  30. Li, W.; Wang, D.; Li, H. Urbanization-induced site condition changes of peri-urban cultivated land in the black soil region of Northeast China. Ecol. Indic. 2017, 80, 215–223. [Google Scholar] [CrossRef]
  31. Jin, J.J.; Chong, J.; Lun, L. The economic valuation of cultivated land protection: A contingent valuation study in Wenling City, China. Landsc. Urban Plan. 2013, 119, 158–164. [Google Scholar]
  32. Kong, X.B.; Li, C.; Liang, Y.; Wang, H. Arable Land Productivity and Its Elastic Loss on the Basis of Farm Household Land Use Behavior. Prog. Geogr. 2010, 29, 869–877. (In Chinese) [Google Scholar]
  33. Chen, M.; Wu, Y.; Liu, T. Research and prospect of farmland protection in China based on farmer’s behavior. J. Nanjing Agric. Univ. (Soc. Sci. Ed.) 2012, 12, 66–72. (In Chinese) [Google Scholar]
  34. Pfarrhofer, M.; Piribauer, P. Flexible shrinkage in high-dimensional bayesian spatial autoregressive models. Spat. Stat. 2019, 29, 109–128. [Google Scholar] [CrossRef] [Green Version]
  35. Mattos, C.L.C.; Barreto, G.A. A stochastic variational framework for recurrent gaussian processes models. Neural Netw. 2019, 112, 54–72. [Google Scholar] [CrossRef]
  36. Kerebel, A.; Gélinas, N.; Déry, S. Landscape aesthetic modelling using bayesian networks: Conceptual framework and participatory indicator weighting. Landsc. Urban Plan. 2019, 185, 258–271. [Google Scholar] [CrossRef]
  37. Hallin, C.; Huisman, B.J.A.; Larson, M.R.; Walstra, D.; Hanson, H. Impact of sediment supply on decadal-scale dune evolution—Analysis and modelling of the kennemer dunes in the Netherlands. Geomorphology 2019, 337, 94–110. [Google Scholar] [CrossRef]
  38. Soler, R.; Soler, J.R.; Araya, I. Subjects in the blended learning model design: Theoretical—Methodological elements. Procedia Soci. Behav. Sci. 2017, 237, 771–777. [Google Scholar] [CrossRef]
  39. Alegría, A.; Caro, S.; Bevilacqua, M.; Porcu, E.; Cerda, J.C.D.L. Estimating covariance functions of multivariate skew-gaussian random fields on the Sphere. Spat. Stat. 2017, 22, 388–402. [Google Scholar] [CrossRef] [Green Version]
  40. Goovaerts, P. Geostatistical modelling of uncertainty in soil science. Geoderma 2001, 103, 3–26. [Google Scholar] [CrossRef]
  41. Lyu, K.; Chen, K.; Zhang, H. Relationship between land tenure and soil quality: Evidence from China’s soil fertility analysis. Land Use Policy 2019, 80, 345–361. [Google Scholar] [CrossRef]
1
USD/RMB exchange rate was USD 1 = RMB1.49 in 1980; USD 1 = RMB 8.351 in 1995; USD 1 = RMB 8.2784 in 2000; USD 1 = RMB 6.7695 in 2010.
Figure 1. The theoretical analysis framework of the effects of households’ land-use behaviors on soil available potassium (AVK).
Land 09 00160 g001
Figure 2. Study area map and spatial distribution of soil sampling points in 1980, 2000, and 2010.
Land 09 00160 g002
Figure 3. Spatial distribution of soil AVK content in the study area from 1980 to 2010. (a) Distribution of AVK in 1980 (b). Distribution of AVK in 2000 (c). Distribution of AVK in 2010 (d). Change trend of AVK in 1980–2000 (e). Change trend of AVK in 2000–2010 (f). Change trend of AVK in 1980–2010.
Land 09 00160 g003aLand 09 00160 g003b
Figure 4. Changes in planting area of grain crops and cash crops in the study area from 1980 to 2010.
Land 09 00160 g004
Figure 5. Change of economic crop planting area from 1980 to 2010.
Land 09 00160 g005
Figure 6. Change of the multiple cropping index of Sujiatun District from 1980 to 2010.
Land 09 00160 g006
Figure 7. Change of application of potash fertilizer and compound fertilizer from 1980 to 2010.
Land 09 00160 g007
Figure 8. Trends of GDP per capita and primary industry employment ratio from 1980 to 2010.
Land 09 00160 g008
Table 1. Statistics on the area of AVK in various levels from 1980 to 2010.
RegionLevelContentIn 1980In 2000In 2010
Area (ha)Ratio (%)Area (ha)Ratio (%)Area (ha)Ratio (%)
Linhu
Street
I≥1801831.6————————
II160–180192317.1————————
III140–1606846.1————————
IV120–1401471.3340.35595.0
V100–1201641.510379.2231420.6
VI<100660.6209718.72952.6
Wanggangbao
Township
I≥1803433.1————————
II160–180197617.6————350.3
III140–160114610.2————7786.9
IV120–1401171.01231.1213519.0
V100–120————167314.96345.7
VI<100————178515.9————
Yongle
Township
I≥180————————————
II160–180————————4924.4
III140–160193017.2————287925.7
IV120–140254222.76996.29768.7
V100–120————261923.31241.1
VI<100————115410.3————
TotalI≥1805264.7————————
II160–180389934.7————5224.7
III140–160376033.5————366332.6
IV120–140280625.08567.6367032.7
V100–1201641.5532947.5307027.4
VI<100660.6503644.92952.6
Table 2. Distribution of AVK content in cropland soil.
PeriodArea and ProportionRange of Content Various (mg/kg)
< −60−60–−30−30–00–30>30
2010–1980Area (ha)159533342721351257
Proportion (%)14.22%29.72%24.25%31.30%0.51%
2000–1980Area (ha)45083843282643-
proportion (%)40.17%34.25%25.19%0.39%-
2010–2000Area (ha)--34050925788
proportion (%)--3.03%45.38%51.59%
Table 3. Land-use behavior of households in the study area.
Land–Use BehaviorClassificationLinhu StreetWanggangbao TownshipYongle TownshipTotal
ObsProportion %ObsProportion %ObsProportion %ObsProportion %
GCCGrain crops only7493.72329.522.511548.3
Both grain crops and cash crops11.33544.93138.35021.0
Cash crops only45.102025.64859.27330.7
MCI1.07493.73950.022.511548.3
1.0–1.533.82633.32227.25121.4
1.5–2.00056.43239.53715.6
2.0–2.50033.91214.8156.3
2.5–3.022.556.41316.0208.4
LIIself–employed (day per mu)0–105670.92937.21923.510443.7
10–201924.14051.32632.18535.7
20–3022.556.41113.6187.6
>3022.545.12530.83113.0
employment (day per mu)04759.96380.8911.111950.0
1–103038.067.72125.95723.9
11–2022.556.42328.43012.6
>2000.045.12834.63213.5
capital investment (Yuan per mu) a¥0–500 ($0–74)7291.13848.7911.111950.0
¥500–1000 ($74–128)67.61721.878.63012.6
¥1000–1500 ($128–222)11.31620.5911.12610.9
>¥1500(>$222) 0079.05669.16326.5
Note: a The value in brackets is US dollars. USD/RMB exchange rate was USD 1 = RMB 6.7695 in 2010.
Table 4. Estimation results.
Linhu StreetWanggangbao TownshipYongle Township
Bt-valueBetaBt-valueBetaBt-valueBeta
GCC 61.205 ***2.7020.399
MCI−15.469 *−1.817−0.282
LII 0.009 *1.5090.0730.037 *1.8840.225
Note: *, **, *** denote statistical significance at 10%, 5%, and 1%. The factor corresponding to the parameter is blank, which means that the model has not reached a significant level. B value is the coefficient of the regression equation. The positive value of the coefficient indicates that the explained variable increases correspondingly when the explanatory variable increases by one unit value, while the negative value indicates that the explained variable decreases correspondingly when the unit value is increased. Beta value is expressed as the relative weight of each explanatory variable in the model. The larger the absolute value, the greater the effect of the factor.

