Did Government Expenditure on the Grain for Green Project Help the Forest Carbon Sequestration Increase in Yunnan, China?


Abstract
1. Introduction
2. Data Source and Model Establishment
2.1. Overview of the Study Area
2.2. Model Building
2.3. Variable Selection and Description
2.3.1. Estimation of Forest Carbon Sequestration
2.3.2. Government Expenditure on the GFG
2.3.3. Control Variables
3. Results
3.1. Changes in Government Expenditure
3.2. Changes in Forest Carbon Sequestration
3.3. Model Estimation Results
4. Discussion
5. Conclusions
Author Contributions
Funding
Acknowledgments
Conflicts of Interest
Appendix A
References
- Esquivel-Muelbert, A.; Baker, T.R.; Dexter, K.G.; Lewis, S.L.; Brienen, R.J.W.; Feldpausch, T.R.; Lloyd, J.; Monteagudo-Mendoza, A.; Arroyo, L.; Álvarez-Dávila, E.; et al. Compositional response of Amazon forests to climate change. Glob. Chang. Biol. 2019, 25, 39–56. [Google Scholar] [CrossRef] [PubMed]
- Pulles, T. Will the world meet the climate change challenge? Carbon Manag. 2015, 6, 1–5. [Google Scholar] [CrossRef][Green Version]
- Xu, B.; Lin, B. Investigating the role of high-tech industry in reducing China’s CO2 emissions: A regional perspective. J. Clean. Prod. 2018, 177, 169–177. [Google Scholar] [CrossRef]
- Soleimani, A.; Hosseini, S.; Bavani, A.; Jafari, M.; Francaviglia, R. Influence of land use and land cover change on soil organic carbon and microbial activity in the forests of northern Iran. Catena 2019, 177, 227–237. [Google Scholar] [CrossRef]
- Lun, F.; Liu, Y.; He, L.; Yang, L.; Liu, M.; Li, W. Life cycle research on the carbon budget of the Larix principis-rupprechtii plantation forest ecosystem in North China. J. Clean. Prod. 2018, 177, 178–186. [Google Scholar] [CrossRef]
- Lee, S.; Yim, J.; Son, Y.; Son, Y.; Kim, R. Estimation of Forest Carbon Stocks for National Greenhouse Gas Inventory Reporting in South Korea. Forests 2018, 9, 625. [Google Scholar] [CrossRef]
- Lopez-Bellido, P.; Lopez-Bellido, L.; Fernandez-Garcia, P.; Munoz-Romero, V.; Lopez-Bellido, F. Assessment of carbon sequestration and the carbon footprint in olive groves in Southern Spain. Carbon Manag. 2016, 7, 161–170. [Google Scholar] [CrossRef]
- Hao, Y.; Xu, Y.; Zhang, J.; Hu, X.; Huang, J.; Chang, C.; Guo, Y. Relationship between forest resources and economic growth: Empirical evidence from China. J. Clean. Prod. 2019, 214, 848–859. [Google Scholar] [CrossRef]
- Pan, Y.; Birdsey, R.; Fang, J.; Houghton, R.; Kauppi, P.; Kurz, W.; Phillips, O.; Shvidenko, A.; Lewis, S.; Canadell, J.; et al. A large and persistent carbon sink in the world’s forests. Science 2011, 333, 988–993. [Google Scholar] [CrossRef]
- Xu, X.; Li, K. Biomass carbon sequestration by planted forests in China. Chin. Geogr. Sci. 2010, 20, 289–297. [Google Scholar] [CrossRef]
- Zhang, P.; He, J.; Hong, X.; Zhang, W.; Qin, C.; Pang, B.; Li, Y.; Liu, Y. Carbon sources/sinks analysis of land use changes in China based on data envelopment analysis. J. Clean. Prod. 2018, 204, 702–711. [Google Scholar] [CrossRef]
- Deng, L.; Liu, S.; Kim, D.G.; Peng, C.; Shangguan, Z. Past and future carbon sequestration benefits of China’s grain for green program. Glob. Environ. Chang. 2017, 17, 13–15. [Google Scholar] [CrossRef]
- Heimann, M.; Reichstein, M. Terrestrial ecosystem carbon dynamics and climate feedbacks. Nature 2008, 451, 289–292. [Google Scholar] [CrossRef]
- Chen, X.; Lupi, F.; Vina, A.; He, G.; Liu, J. Using cost-effective targeting to enhance the efficiency of conservation investments in payments for ecosystem services. Conserv. Biol. 2010, 24, 1469–1478. [Google Scholar] [CrossRef]
- Costedoat, S.; Corbera, E.; Ezzine-de-Blas, D.; Honey-Rosés, J.; Baylis, K.; Castillo-Santiago, M. How effective are biodiversity conservation payments in Mexico? PLoS ONE 2015, 10, e0119881. [Google Scholar] [CrossRef]
- Pufahl, A.; Weiss, C. Evaluating the effects of farm programmes: Results from propensity score matching. Eur. Rev. Agric. Econ. 2009, 36, 79–101. [Google Scholar] [CrossRef]
- Pagiola, S.; Honey-Rosés, J.; Freire-González, J. Evaluation of the permanence of land use change induced by payments for environmental services in Quindío, Colombia. PLoS ONE 2016, 11, e0147829. [Google Scholar] [CrossRef]
- Sims, K.; Alix-Garcia, J. Parks versus PES: Evaluating direct and incentive-based land conservation in Mexico. J. Environ. Econ. Manag. 2017, 86, 8–28. [Google Scholar] [CrossRef]
- Arriagada, R.; Sills, E.; Pattanayak, S.; Ferraro, P. Combining qualitative and quantitative methods to evaluate participation in Costa Rica’s program of payments for environmental services. J. Sustain. For. 2009, 28, 343–367. [Google Scholar] [CrossRef]
- Grima, N.; Singh, S.; Smetschka, B.; Ringhofer, L. Payment for Ecosystem Services (PES) in Latin America: Analysing the performance of 40 case studies. Ecosyst. Serv. 2016, 17, 24–32. [Google Scholar] [CrossRef]
- Sanchez Azofeifa, G.; Pfaff, A.; Robalino, J.A.; Boomhower, J.P. Costa Rica’s payment for environmental services program: Intention, implementation, and impact. Conserv. Biol. 2007, 21, 1165–1173. [Google Scholar] [CrossRef] [PubMed]
- Jayachandran, S.; De Laat, J.; Lambin, E.F.; Stanton, C.Y.; Audy, R.; Thomas, N.E. Cash for carbon: A randomized trial of payments for ecosystem services to reduce deforestation. Science 2017, 357, 267–273. [Google Scholar] [CrossRef] [PubMed]
- Zhang, D.; Xu, X.; Yao, S.; Chen, H.; Hou, X. Contribution of ecological policies to vegetation restoration: A case study from Wuqi County in Shaanxi Province, China. Land Use Policy 2018, 73, 400–411. [Google Scholar] [CrossRef]
- Scullion, J.; Thomas, C.W.; Vogt, K.A.; Pérez-Maqueo, O.; Logsdon, M.G. Evaluating the environmental impact of payments for ecosystem services in Coatepec (Mexico) using remote sensing and on-site interviews. Environ. Conserv. 2011, 38, 426–434. [Google Scholar] [CrossRef]
- Robalino, J.; Sandoval, C.; Barton, D.N.; Chacon, A.; Pfaff, A. Evaluating interactions of forest conservation policies on avoided deforestation. PLoS ONE 2015, 10, e0124910. [Google Scholar] [CrossRef]
- Börner, J.; Baylis, K.; Corbera, E.; Ezzine-de-Blas, D.; Honey-Rosés, J.; Persson, U.M.; Wunder, S. The effectiveness of payments for environmental services. World Dev. 2017, 96, 359–374. [Google Scholar] [CrossRef]
- Li, H.; Liu, Z. A Study and Path Optimization of Forestry Efficiency of Fund Utilization in China. Ecol. Econ. 2012, 7, 294–297. [Google Scholar]
- Zhou, L.; Chen, X.; Wen, Y.; Su, N.; Li, S. Appraising the Efficiency of Finance Expenditure of Grain for Green Project in Nanjiang County of Sichuan Province. J. Beijing For. Univ. Soc. Sci. 2009, 8, 126–132. [Google Scholar]
- Xu, D.; Gao, L. Research on the Influence of Forestry Carbon Storage Incremental from Forestry Investment in Fixed Assets in China. For. Econ. 2016, 38, 41–45. [Google Scholar]
- Wang, Z.; Wang, J.; Liu, J. Study on the Compensation Standard of Returning Farmland to Forest in Xiannangou Watershed from the Perspective of Carbon Sink. J. Nat. Resour. 2016, 31, 779–788. [Google Scholar]
- Kauppi, P.E. New, Low Estimate for Carbon Stock in Global Forest Vegetation Based on Inventory Data. J. Interv. Cardiol. 2003, 37, 451–457. [Google Scholar] [CrossRef]
- Ma, J.; Shugart, H.H.; Yan, X.; Cao, C.; Wu, S.; Fang, J. Evaluating carbon fluxes of global forest ecosystems by using an individual tree-based model FORCCHN. Sci. Total Environ. 2017, 586, 939–951. [Google Scholar] [CrossRef] [PubMed]
- Aryal, S.; Bhattarai, D.R.; Devkota, R.P. Comparison of Carbon Stocks Between Mixed and Pine-Dominated Forest Stands Within the Gwalinidaha Community Forest in Lalitpur District, Nepal. Small Scale For. 2013, 12, 659–666. [Google Scholar] [CrossRef]
- Lun, F.; Li, W.; Liu, Y. Complete forest carbon cycle and budget in China, 1999–2008. For. Ecol. Manag. 2012, 264, 0–89. [Google Scholar] [CrossRef]
- Ren, H.; Li, L.; Liu, Q.; Wang, X.; Li, Y.; Hui, D.; Jian, S.; Wang, J.; Yang, H.; Lu, H.; et al. Spatial and Temporal Patterns of Carbon Storage in Forest Ecosystems on Hainan Island, Southern China. PLoS ONE 2014, 9, e108163. [Google Scholar] [CrossRef]
- Zhao, Z.; Wang, H.; Du, J.; Bai, X.; Geng, S.; Wan, F. Spatial Distribution of Forest Carbon Based on GIS and Geostatistical Theory in a Small Earth-Rocky Mountainous Area of North China. J. Biobased Mater. Bioenergy 2016, 10, 90–99. [Google Scholar] [CrossRef]
- Wang, D.; Wang, B.; Niu, X. Forest carbon sequestration in China and its benefits. Scand. J. For. Res. 2014, 29, 51–59. [Google Scholar] [CrossRef]
- Yin, R.; Jin, Y.; Wei, X.; Wang, Y.; Yang, Y.; Hua, L.; Xiong, Y.; Xiang, N.; Song, X. Effects of rapid urban sprawl on urban forest carbon stocks: Integrating remotely sensed, GIS and forest inventory data. J. Environ. Manag. 2012, 113, 447–455. [Google Scholar]
- Chen, L.; Wang, S.; Wang, Q. Ecosystem carbon stocks in a forest chronosequence in Hunan Province, South China. Plant Soil 2016, 409, 217–228. [Google Scholar] [CrossRef]
- Wang, Y.; Liu, L.; Shangguan, Z.P. Dynamics of forest biomass carbon stocks from 1949 to 2008 in Henan Province, east-central China. J. For. Res. 2018, 29, 439–448. [Google Scholar] [CrossRef]
- Li, Q.; Tang, L.; Ren, Y. Temporal dynamics and spatial variations of forest vegetation carbon stock in Liaoning Province, China. J. For. Res. 2011, 22, 519–525. [Google Scholar] [CrossRef]
- Li, S.; Yang, C.; Wang, H.; Ge, L. Carbon storage of forest stands in Shandong Province estimated by forestry inventory data. Chin. J. Appl. Ecol. 2014, 25, 2215–2220. [Google Scholar]
- Goetz, S.; Dubayah, R. Advances in remote sensing technology and implications for measuring and monitoring forest carbon stocks and change. Carbon Manag. 2011, 2, 231–244. [Google Scholar] [CrossRef]
- Zheng, J.; Duan, G. Theoretical discussion on the Development of Urbanization in Mountainous Areas: A Case Study of Yunnan Province. Inq. Econ. Issues 2013, 34, 25–30. [Google Scholar]
- Ding, Z.; Yao, S. Research on the equilibrium pricing mechanism and theoretical framework of regional ecological compensation. China Popul. Resour. Environ. 2019, 29, 99–108. [Google Scholar]
- Chen, Q. Advanced Econometrics and Stata Applications, 2nd ed.; Higher Education Press: Beijing, China, 2014. [Google Scholar]
- He, C.; Zhang, D.; Huang, Q.; Zhao, Y. Assessing the potential impacts of urban expansion on regional carbon storage by linking the LUSD-urban and InVEST models. Environ. Model. Softw. 2016, 75, 44–58. [Google Scholar] [CrossRef]
- Liang, Y.; Liu, L.; Huang, J. Integrating the SD-CLUE-S and InVEST models into assessment of oasis carbon storage in northwestern China. PLoS ONE 2017, 12, e0172494. [Google Scholar] [CrossRef]
- Tao, Y.; Li, F.; Wang, R.S.; Zhao, D. Effects of land use and cover change on terrestrial carbon stocks in urbanized areas: A study from Changzhou, China. J. Clean. Prod. 2015, 103, 651–657. [Google Scholar] [CrossRef]
- Friedl, M.; Sulla-Menashe, D.; Tan, B.; Schneider, A.; Ramankutty, N.; Sibley, A.; Huang, X. MODIS Collection 5 global land cover: Algorithm refinements and characterization of new datasets. Remote Sens. Environ. 2010, 114, 168–182. [Google Scholar] [CrossRef]
- Sharp, R.; Tallis, H.; Ricketts, T.; Guerry, A.; Wood, S.; Chapin-Kramer, R.; Nelson, E.; Ennaanay, D.; Wolny, S.; Olwero, N.; et al. InVEST 3.2.0 User’s Guide; The Natural Capital Project; Stanford University, University of Minnesota, The Nature Conservancy, and World Wildlife Fund, 2015; Available online: https://www.docin.com/p-2129732985.html (accessed on 12 February 2020).
- Sun, X.Q. Evaluation of Ecosystem Services in Shangri-La Based on InVEST Model. Master’s Thesis, Yunnan Normal University, Yunnan, China, 2017. [Google Scholar]
- Jia, R.; Zhang, S. Chinese Provincial Capital Stock and Return to Capital. Stat. Res. 2014, 31, 35–42. [Google Scholar]
- Wu, S.N.; Li, Y.Q.; Yu, D.P.; Zhou, L.; Zhou, W.M.; Guo, Y.; Wang, X.Y.; Dai, L.M. Analysis of factors that influence forest vegetation carbon storage by using the VAR model: A case study in Shanxi Province. Acta Ecol. Sin. 2015, 35, 196–203. [Google Scholar]
- Aruhan; Dan, M.; Sudesuriguge; Asina. Analysis on land use carbon emissions and influencing factors in Duolun county, Inner Mongolia. J. Arid Land Resour. Environ. 2019, 33, 17–22. [Google Scholar]
- Dang, Y. The Impact of FDI and International Trade on CO2 Emissions in China—Panel ARDL Approach. China Business and Market. 2018, 32, 113–121. [Google Scholar]
- Smyth, R.; Inder, B. Is Chinese provincial real GDP per capita nonstationary? Evidence from multiple trend break unit root tests. Chin. Econ. Rev. 2004, 15, 1–24. [Google Scholar] [CrossRef]
- Yan, X. Government input and static and dynamic operational efficiency of medical and health institutions in different regions: Empirical analysis based on Data Envelopment Analysis and Tobit Estimation. Nankai Econ. Stud. 2018, 6, 93–111. [Google Scholar]
- Bai, J.; Liu, Y. Can Outward Foreign Direct Investment Improve the Resource Misallocation of China. China Ind. Econ. 2018, 1, 60–78. [Google Scholar]
- Dominik, T.; William, S. Stand structure drives disparities in carbon storage in northern hardwoodconifer forests. For. Ecol. Manag. 2019, 442, 10–20. [Google Scholar]
- Wang, H.; Ni, J.; Prentice, I.C. Sensitivity of potential natural vegetation in China to projected changes in temperature, precipitation and atmospheric CO2. Reg. Environ. Chang. 2011, 11, 715–727. [Google Scholar] [CrossRef]
- Lutz, D.; Shugart, H.; White, M. Sensitivity of Russian forest timber harvest and carbon storage to temperature increase. Forestry 2013, 86, 283–293. [Google Scholar] [CrossRef]
- Lenihan, J.; Drapek, R.; Bachelet, D.; Neilson, R. Climate change effects on vegetation distribution, carbon, and fire in California. Ecol. Appl. 2003, 13, 1667–1681. [Google Scholar] [CrossRef]
- Yang, Y.; Chen, Y.; Li, W.; Wang, Y. Effects of land use/cover change on soil organic carbon storage in the main stream of Tarim River. China Environ. Sci. 2016, 36, 2784–2790. [Google Scholar]
| 1 | Forestry and Grassland Administration of the People’s Republic of China, 2019. (http://www.forestry.gov.cn/main/225/20190905/163840772503997.html) |
| 2 | People’s Daily Online, 2018. (http://yn.people.com.cn/n2/2018/1211/c378439-32393113.html) |


| Vegetation Coverage Type | Land Cover Type | C_above | C_below | C_dead | C_soil |
|---|---|---|---|---|---|
| Coniferous Forest | Evergreen Needleleaf Forests | 51.87 | 15.03 | 4.10 | 21.84 |
| Deciduous Needleleaf Forests | |||||
| Evergreen Broadleaf Forest | Evergreen Broadleaf Forests | 36.85 | 7.37 | 2.80 | 32.30 |
| Deciduous Broadleaf Forest | Deciduous Broadleaf Forests | 48.85 | 9.77 | 1.90 | 11.7 |
| Mixed Forest | Mixed Forests | 30.63 | 6.91 | 1.80 | 22.91 |
| Shrubland | Closed Shrublands | 6.85 | 7.60 | 2.57 | 12.88 |
| Open Shrublands | |||||
| Woody Savannas |
| Variable | Symbol | Variable Description/Unit | Mean | Standard Deviation |
|---|---|---|---|---|
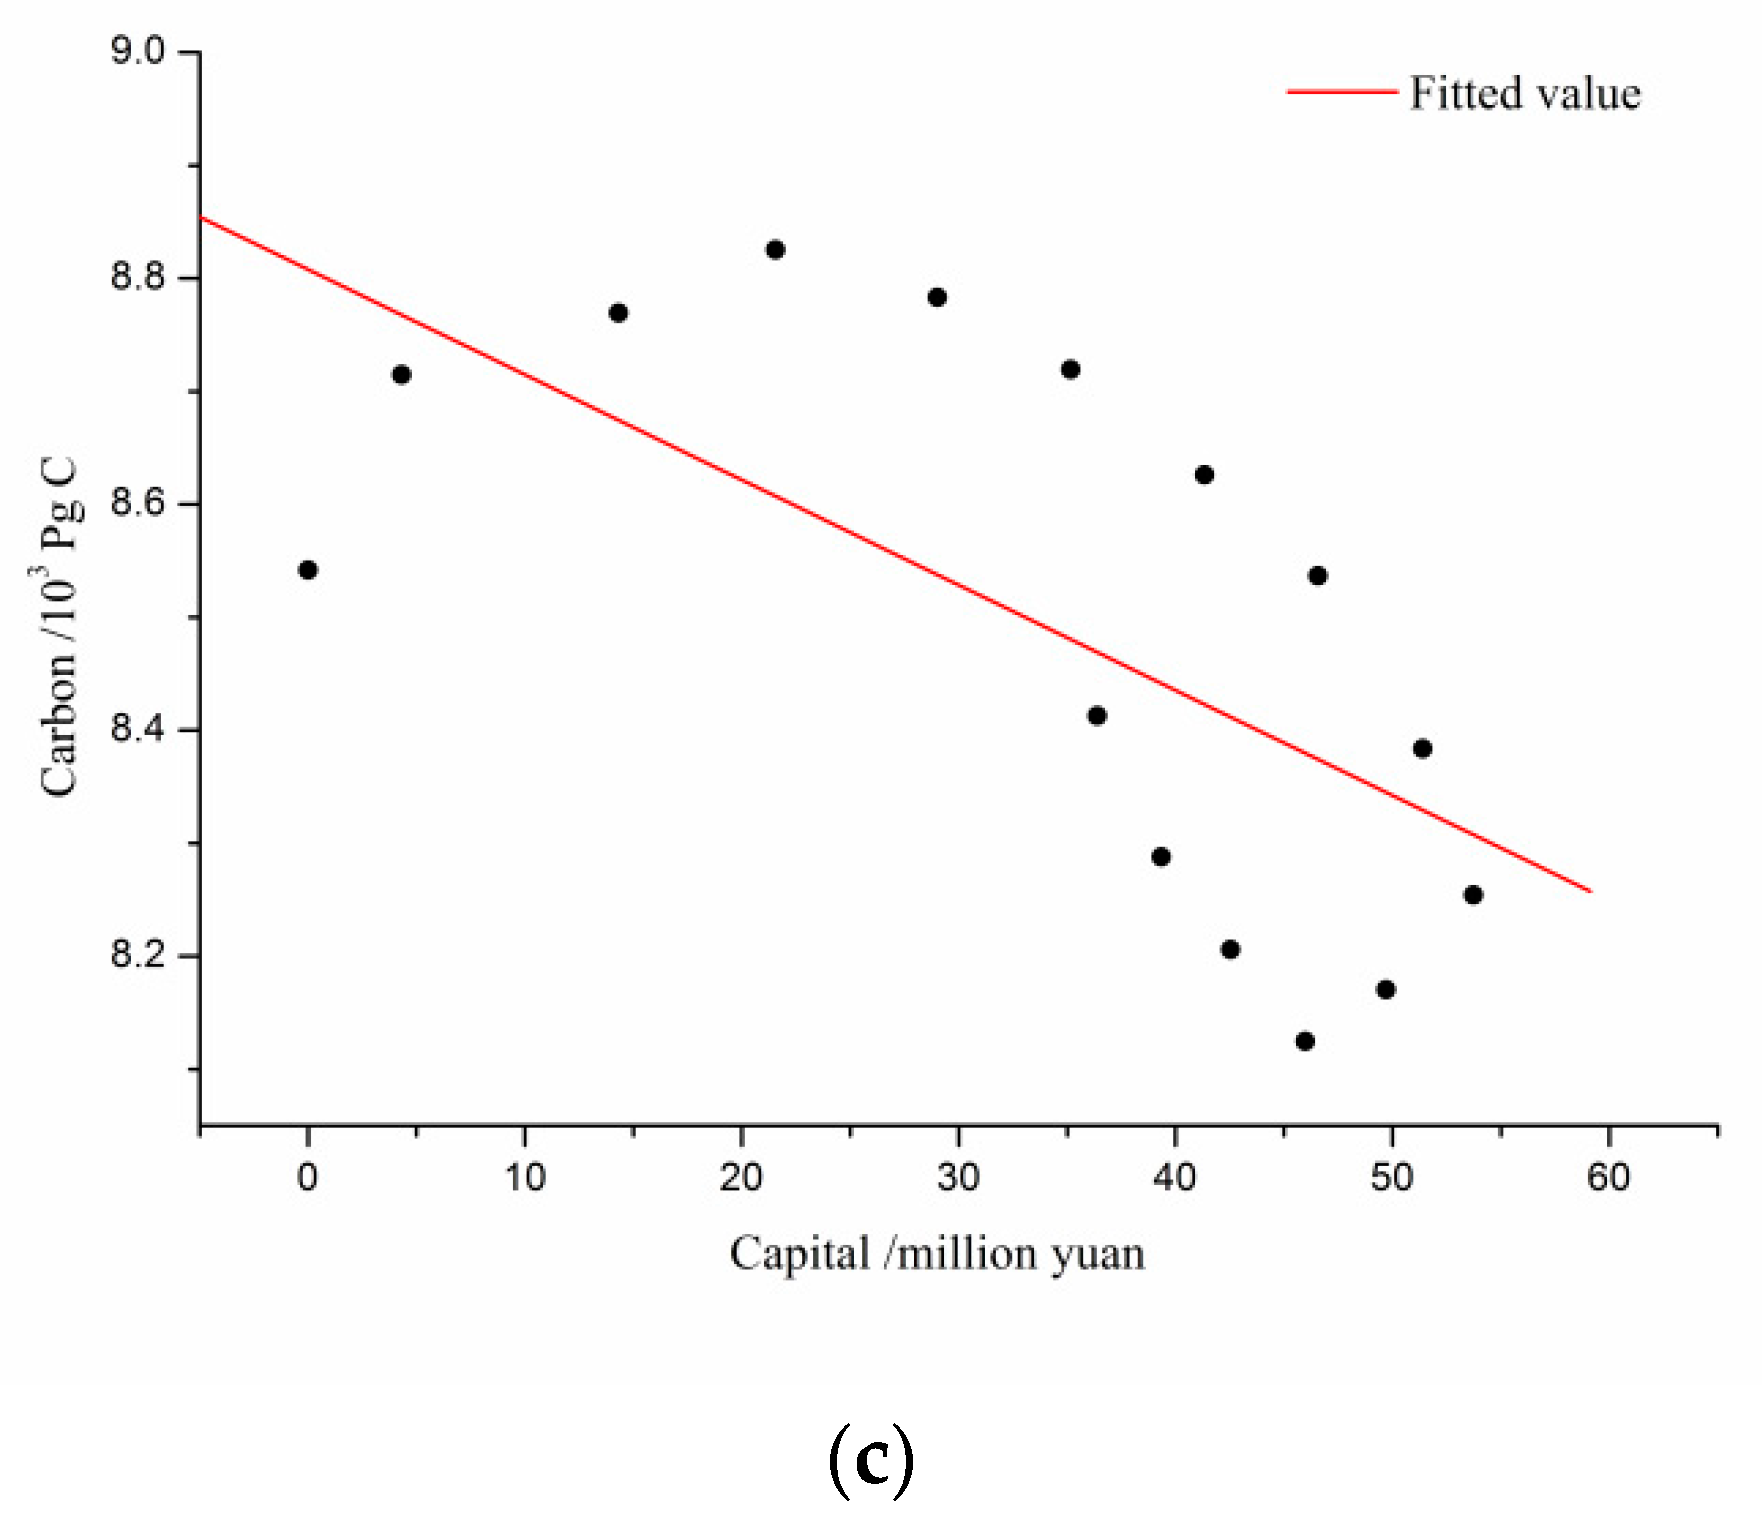
| Forest carbon sequestration | carbon | Calculation and Extraction/Pg C | 8.4535 | 9.1551 |
| Government expenditure on the GFG | capital | Yunnan Provincial Forestry Department/RMB 10,000 Yuan | 4323.1440 | 3289.0280 |
| Annual precipitation | Pre | Interpolation and Extraction/mm | 101.1543 | 25.5772 |
| Average annual temperature | Tem | Interpolation and Extraction/°C | 16.9494 | 2.2586 |
| Slope | Mslp | Data Extraction/° | 6.7381 | 2.7284 |
| Aspect | Asp | Data Extraction/° | −10.4058 | 8.1490 |
| The growth rate of per capita GDP | RGDP | (per capita GDPt − per capital GDPt−1)/ per capita GDPt−1/100% | 0.1247 | 0.2655 |
| Land urbanization rate | Pstr | Urban and built-up land area/county total area/100% | 0.0190 | 0.0432 |
| Variable | Model (1) | Model (2) | Model (3) |
|---|---|---|---|
| Llncarbon | — | — | 0.9040 *** (61.69) |
| lncapital | 0.0364 *** (9.56) | — | — |
| Pre | 0.0011 *** (7.37) | 0.0012 *** (9.31) | 0.0005 *** (11.58) |
| Tem | 0.0265 *** (5.34) | 0.0279 *** (7.21) | 0.0060 *** (4.11) |
| Mslp | 0.4937 *** (29.98) | 0.5442 *** (20.95) | 0.0520 *** (3.73) |
| Asp | 0.0843 *** (3.14) | 0.0600 (1.51) | −0.0049 (−0.28) |
| RGDP | −0.0042 (−0.45) | −0.0027 (−0.37) | 0.0001 (0.05) |
| Pstr | 3.6724 *** (2.72) | 3.7750 *** (2.92) | 0.4786 (1.59) |
| Control of the individual | YES | YES | YES |
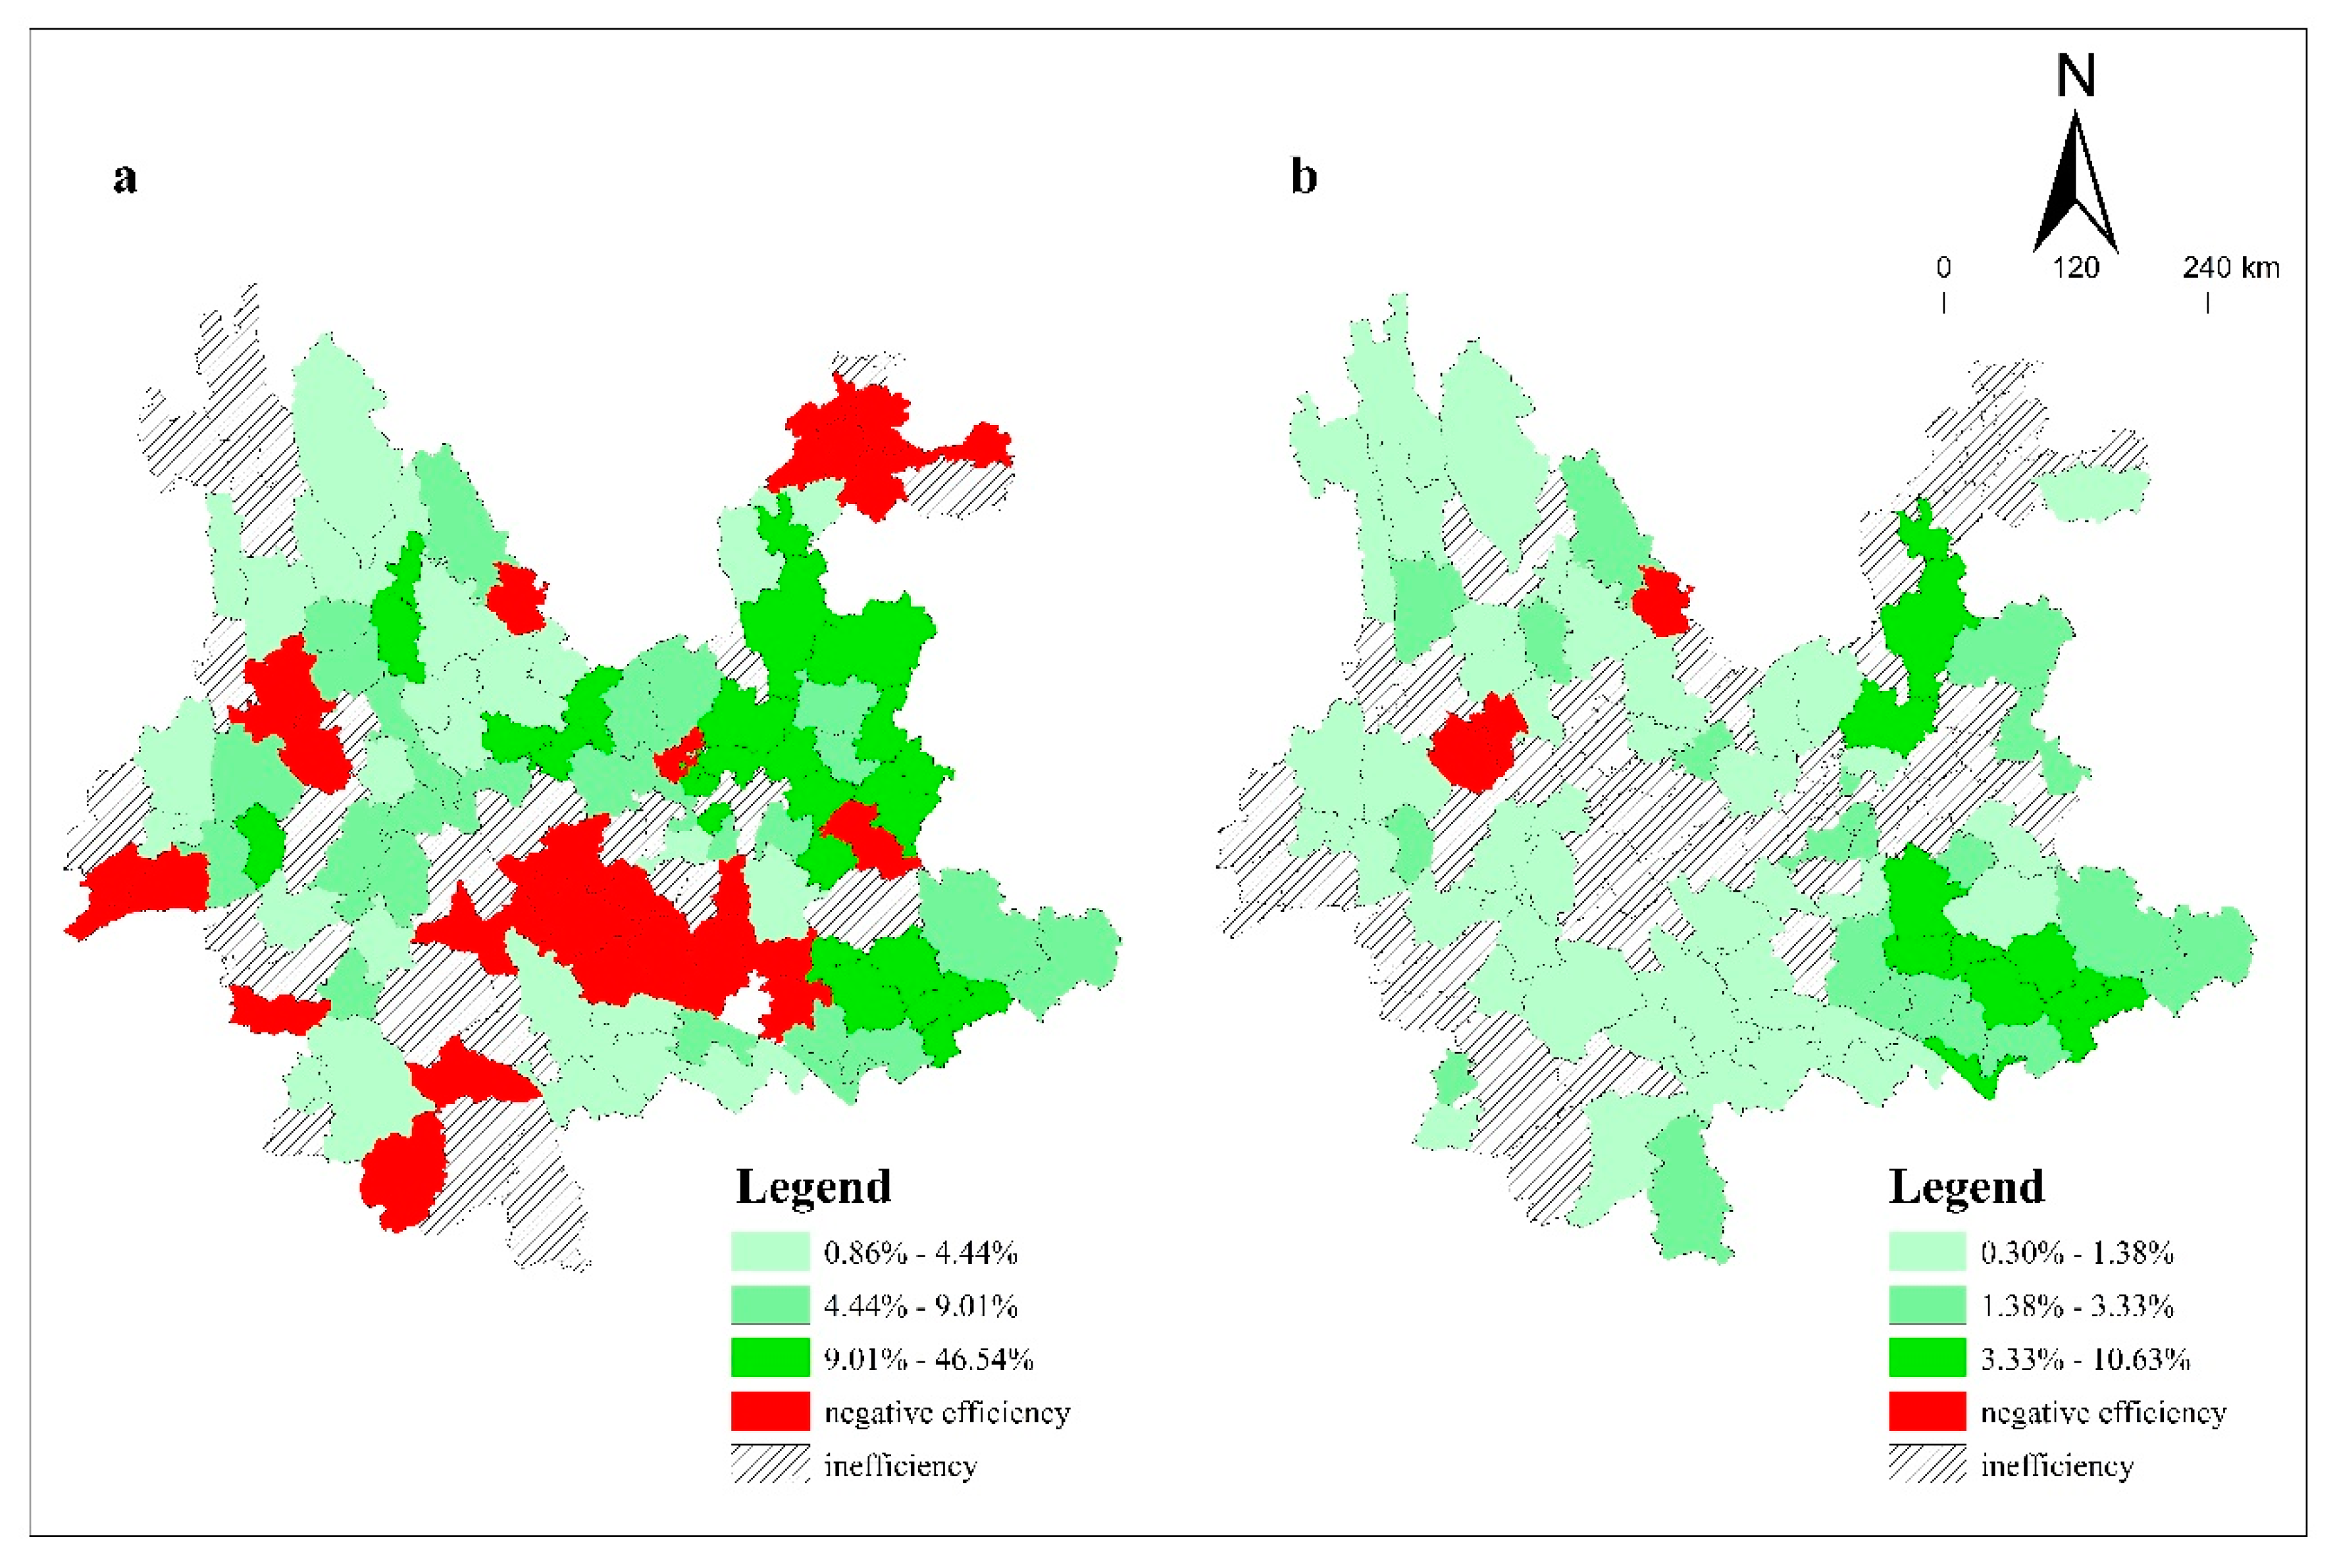
| Regional difference in efficiency | — | Figure 4a | Figure 4b |
| _cons | 12.5972 *** (222.09) | 12.4858 *** (58.30) | 1.0380 *** (4.83) |
| Observations | 1806 | 1806 | 1806 |
| R-squared | 0.9963 | 0.9981 | 0.9998 † |
© 2020 by the authors. Licensee MDPI, Basel, Switzerland. This article is an open access article distributed under the terms and conditions of the Creative Commons Attribution (CC BY) license (http://creativecommons.org/licenses/by/4.0/).
Share and Cite
Lu, Y.; Yao, S.; Ding, Z.; Deng, Y.; Hou, M. Did Government Expenditure on the Grain for Green Project Help the Forest Carbon Sequestration Increase in Yunnan, China? Land 2020, 9, 54. https://doi.org/10.3390/land9020054
Lu Y, Yao S, Ding Z, Deng Y, Hou M. Did Government Expenditure on the Grain for Green Project Help the Forest Carbon Sequestration Increase in Yunnan, China? Land. 2020; 9(2):54. https://doi.org/10.3390/land9020054
Chicago/Turabian StyleLu, Ya’nan, Shunbo Yao, Zhenmin Ding, Yuanjie Deng, and Mengyang Hou. 2020. "Did Government Expenditure on the Grain for Green Project Help the Forest Carbon Sequestration Increase in Yunnan, China?" Land 9, no. 2: 54. https://doi.org/10.3390/land9020054
APA StyleLu, Y., Yao, S., Ding, Z., Deng, Y., & Hou, M. (2020). Did Government Expenditure on the Grain for Green Project Help the Forest Carbon Sequestration Increase in Yunnan, China? Land, 9(2), 54. https://doi.org/10.3390/land9020054