VegeT: An Easy Tool to Classify and Facilitate the Management of Seminatural Grasslands and Dynamically Connected Vegetation of the Alps


1
Centre of Applied Studies for the Sustainable Management and Protection of Mountain Areas–CRC Ge.S.Di.Mont., University of Milan, Via Morino 8, 25048 Edolo (BS), Italy
2
Department of Agricultural and Environmental Sciences-Production, Landscape and Agroenergy-DiSAA, University of Milan, Via Celoria 2, 20133 Milan (MI), Italy
*
Author to whom correspondence should be addressed.
Land 2020, 9(12), 473; https://doi.org/10.3390/land9120473
Submission received: 17 September 2020
/
Revised: 21 November 2020
/
Accepted: 23 November 2020
/
Published: 24 November 2020
(This article belongs to the Special Issue Mountains under Pressure)
Abstract
:Alpine pastures and meadows are agroecosystems of biological, cultural-historical, and economic importance that are undergoing profound imbalances and which are in a rapid decline due to changes in management and/or abandonment. The European Union is making efforts to protect this heritage and resource. However, the dialog among the different professionals in charge of studying and managing these agroecosystems needs to be as easy and comprehensible as possible for grasslands conservation/restoration actions to be successful. This research introduces VegeT, an easy-to-use tool to facilitate information transfer between botanists and practitioners responsible for providing guidelines for the correct management of mountain grasslands. VegeT is a Microsoft Excel® worksheet that allows the classification of seminatural grasslands and dynamically connected vegetation (shrublands and forests) of the Alps employing two ecological indexes: the index of nutrients (N) and the index of mowing tolerance (MV). VegeT was elaborated upon the floristic-ecological analysis of the vegetation of Taleggio Valley (Italian Alps) performed applying multivariate analysis techniques. From the analyses, it emerged that N and MV are the main variables on which to base a classification system of alpine mountain grasslands and dynamically connected vegetation able to facilitate the interpretation of floristic-vegetation data and to return useful information for management decisions.
1. Introduction
Mountain meadows and pastures represent agroecosystems that are, other than an important economic and historical-cultural heritage, biodiversity hotspots and elements that contribute to landscape enrichment [1,2,3]. The diversification of management guarantees maximum biodiversity [2]. Meadows and pastures have connoted alpine landscapes for centuries, and the uniqueness of the alpine landscape is one of the keys to the success of its touristic appreciation [3]. These ecosystems, today, are nevertheless undergoing profound imbalances in the most industrialized areas of the planet and are in rapid decline [4] mainly due to the abandonment of mountain areas by man [5,6]. It is frequent to find the bottom of alpine valleys affected by severe urbanization rates due to the conversion of grasslands in other cropping systems or human settlements. This occurrence is accompanied by the total land abandonment in the upper fascia. This is a common circumstance that has been deeply investigated and highlighted by many authors [3].
Pastures and meadows are, in fact, seminatural systems whose origin goes back to Neolithic [7,8], and they require regular and periodical management by humans: grass-mowing, manuring, sometimes irrigation, domestic animal grazing and bush removal [9]. These management interventions induce a distinct floristic composition in the different typologies of mountain grasslands that is then strictly linked to the management practices [10,11] besides the bio-geographic area.
In the last decades, and even today, the European Alps have been subject to abandonment by population [12]. This anthropic process caused the progressive neglection of agricultural practices [13,14,15], and then the forest expansion in areas once occupied by mountain grasslands (meadows, pastures, and meadows-pastures) [16,17,18]. Forest expansion is a phenomenon following the timeline and the modalities of secondary plant succession: once the grasslands start to be unkempt, their plant communities are generally replaced by herbaceous plant communities (fringes) that afterward, passing the time, give way to shrublands (mantles) and, finally, to forest communities [19,20]. This phenomenon could have an impact on the qualitative and quantitative availability of forage for domestic animals [18] from a productive point of view. In addition, the forest expansion threatens the landscape richness [21] and the conservation of some species and habitats [22] from a naturalistic and landscape management point of view. Therefore, the neglect of mountain grasslands could also trigger socioeconomic effects as the reduction of high-quality agri-food from the dairy production chain [3] or beekeeping [23].
Due to their biological and landscaping importance, European Union included meadows and pastures among the ecosystems to safeguard under Habitats Directive (92/43/EEC) [24], which is the most important European legislation for nature conservation. Further, in the last years, many projects (at a local, national, or international level) focusing on safeguarding or restoring some alpine agroecosystems (among which mountain pastures and meadows) were launched. Some examples are the projects promoted by Rural Development Programs financed by the European Union (UE Regulation 1305/2013) [25]. In order to be successful, safeguarding and restoring projects need actions that require the involvement of actors with different roles and expertise who can be able to dialog in an agile and comprehensible way. Very often. The bodies managing the alpine resources (municipalities, parks, regions, etc.) do not have technically qualified staff able to analyze complex agroecosystems as mountain grasslands, so they turn towards experts/professionals as environmental scientists or botanists.
One of the most used and effective approaches to understanding grasslands characteristics is a floristic-vegetation analysis [26]. It is mainly operated by phytosociological, who collect data on the floristic composition of plant communities (performing phytosociological relevés) with the principal goal of defining “plant associations” and frame them in a hierarchical classification system (syntaxonomic scheme) by statistical analysis techniques as cluster analysis. The plant association is the base unit of phytosociology defined as: “a system of vegetal organisms with a floristic composition that is statistically repetitive; it is a range of different features such as the structure, the ecological value (significant for different environmental parameters) and the quality of the dynamic and catenal relationship that it has with other communities [27]. Especially pertinent for this definition and identification is the characteristic specific complex, consisting of the preferring plants which are particularly linked to it in statistical terms and that are biogeographically and ecologically differential compared to similar synvicariant or geosynvicariant associations” [27].
Technical-scientific reports produced by phytosociologists have a high technical level of information (floristic composition and species abundance of each plant community allocated in syntaxa: phytosociological classes, orders, alliances and associations). However, they are regrettably difficult to understand by a non-specialist in the field, such as land managers. In fact, they are widely descriptive and/or constructed on long tables (phytosociological tables) containing the abundance/dominance indices of each species of every phytosociological relevé divided in syntaxa [28]. This results in criticalities concerning their usage outside the circle of phytosociologists, among which the difficulty for land managers to interpret and use them for designing and realizing the appropriate practices for meadows management/protection. This could be overcome by building tools to simplify the information exchange among botanists and practitioners who, in the different alpine Macro-region countries [29], manage the agricultural and natural resources of the Alps. The land managers are often agronomists, foresters, geologists, architects or engineers and not botanists.
This research, supported by the Department for Regional Affairs and Autonomies (DARA) of the Italian Presidency of the Council of Ministers, has the goal to develop an easy-to-use tool able to translate the floristic-vegetation data collected by botanists into useful and comprehensible information for technicians in charge of providing guidelines for the preferred management/conservation/restoration of mountain grasslands of the Alps. The aim was to elaborate this tool by analyzing ecological and floristic characteristics of grasslands and other vegetation linked to them by dynamic-catenal relationships (shrublands and forests) [19], using a case study in Taleggio Valley (Southern Alps, Italy). Shrublands and forest species may be considered indicators of lack of management of the mountain grasslands since some young individuals of shrubs and trees may inhabit grasslands modifying the floristic composition (and then the vegetation typology) even before the physiognomy (aspect) changes.
2. Materials and Methods
2.1. Study Area
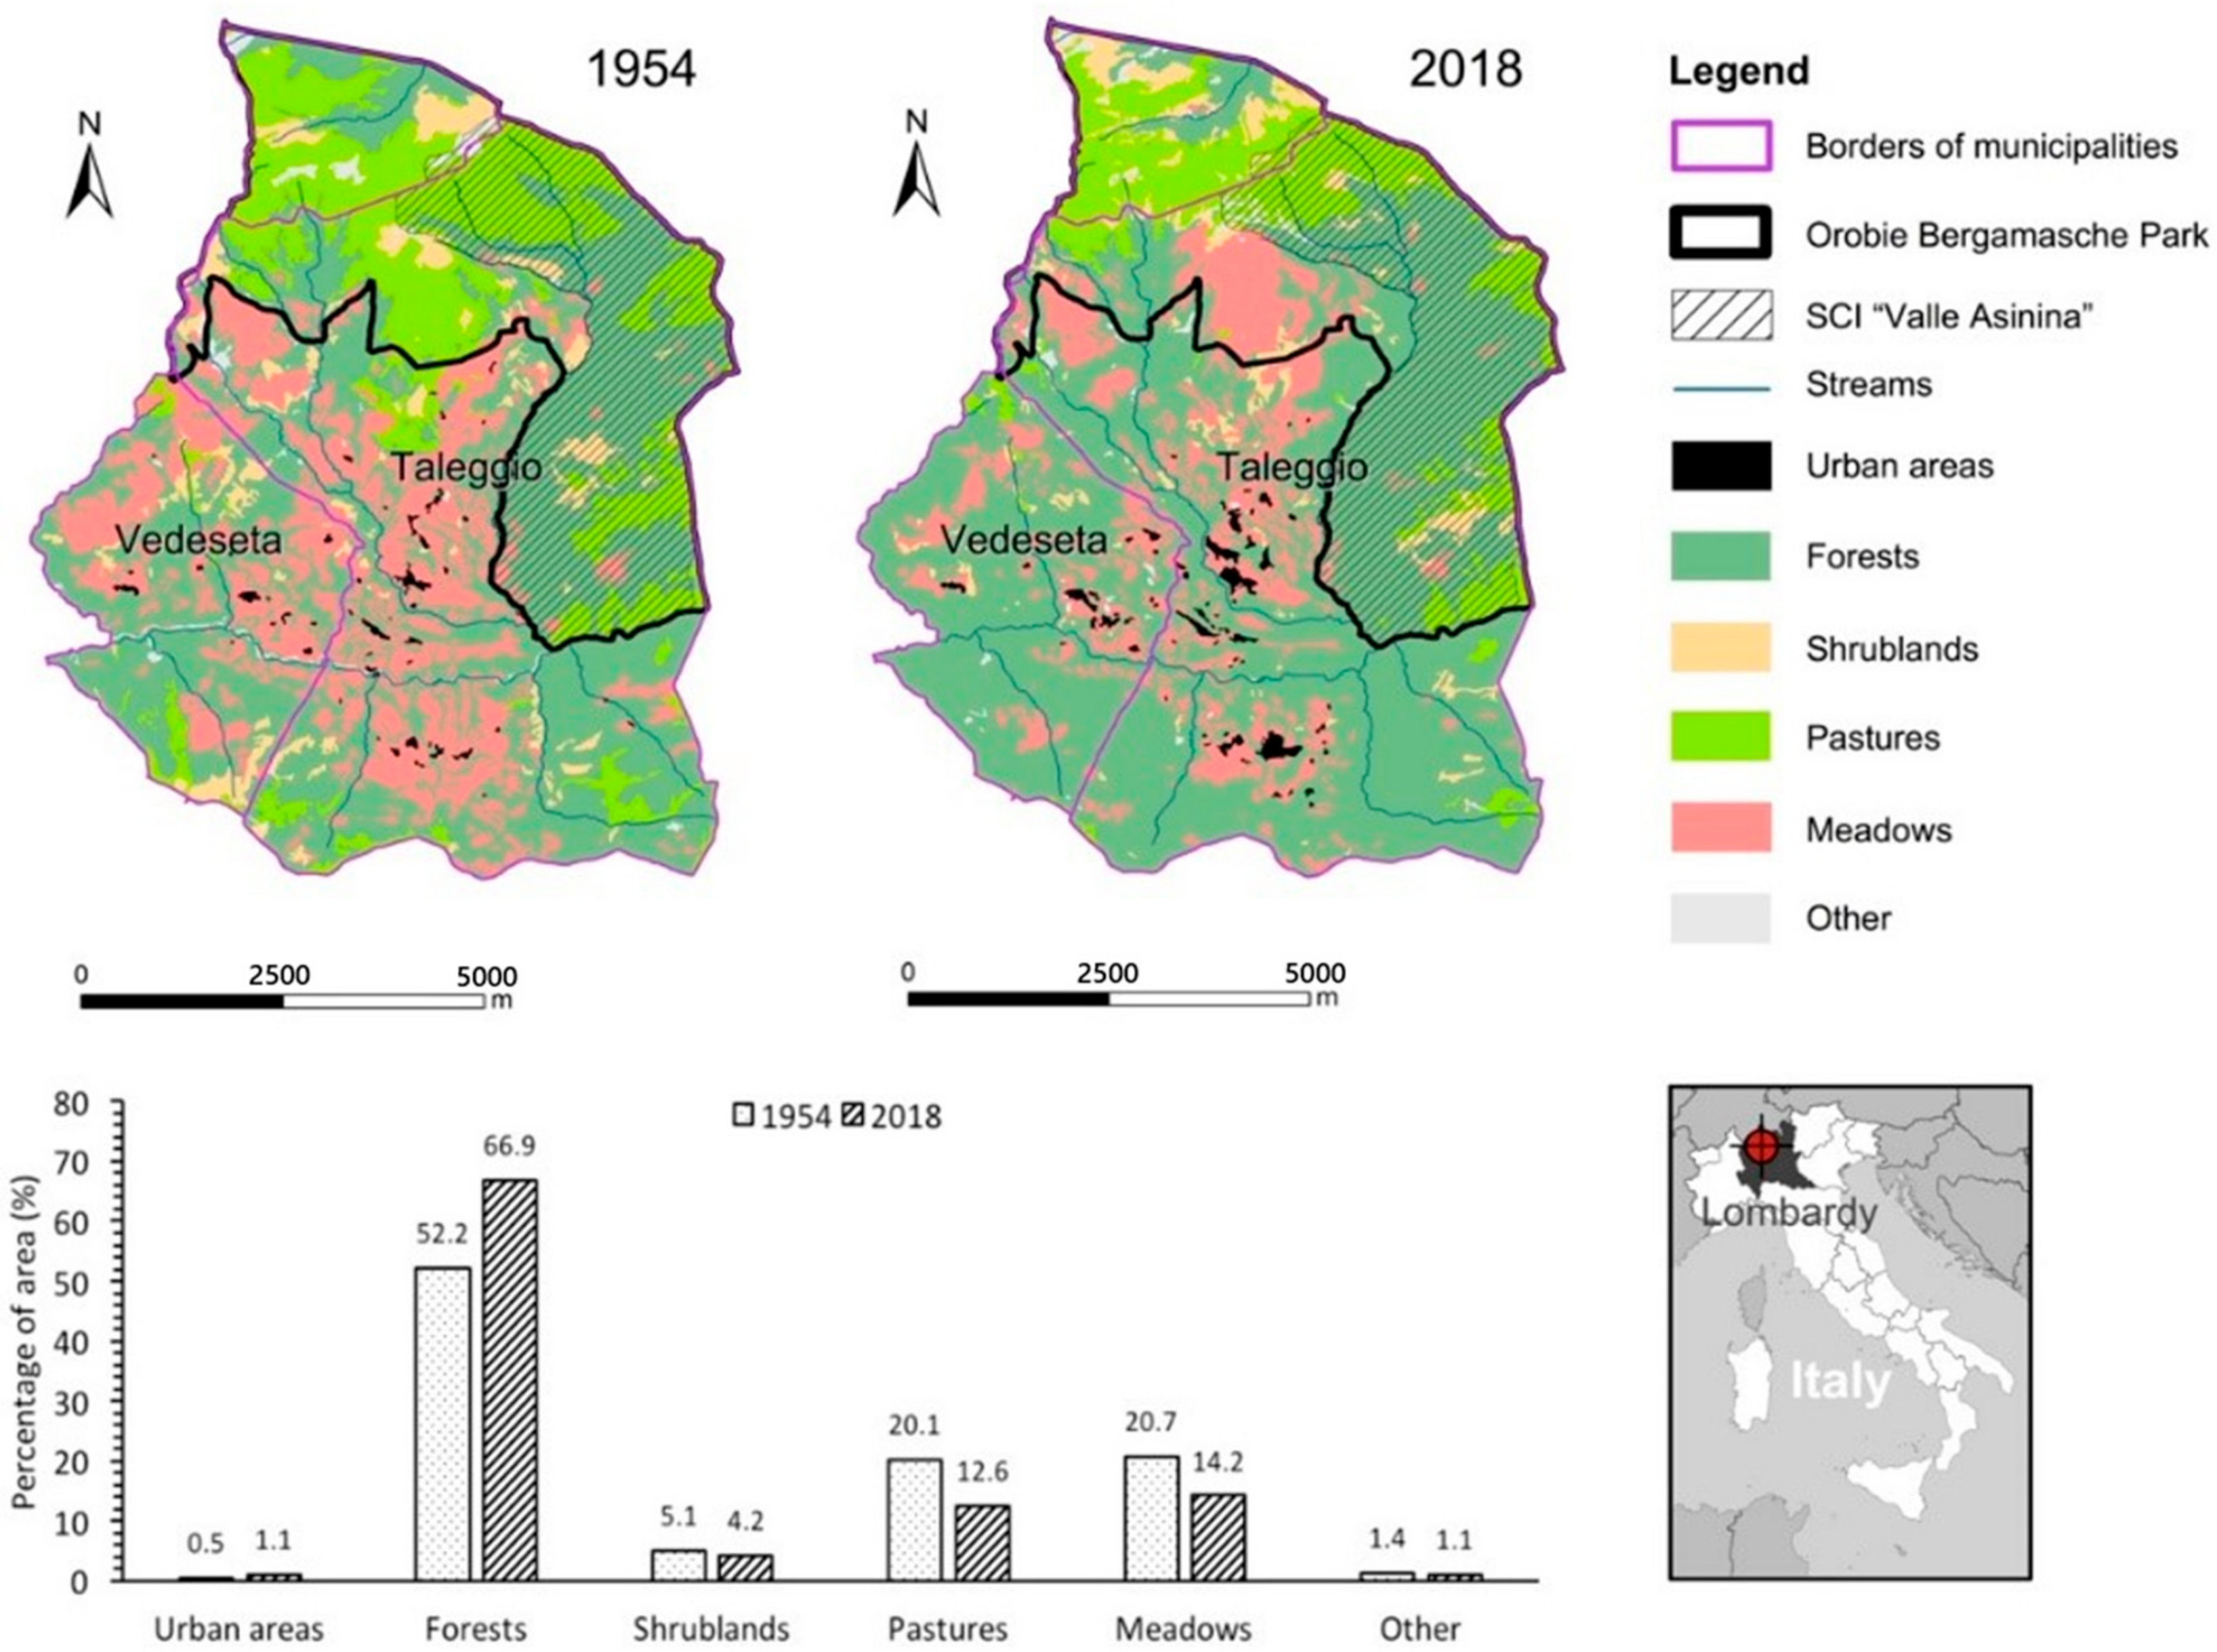
Taleggio Valley is an area of about 66 km2 situated in Northern Italy (Lombardy region, Bergamo province; latitude: 45°53′40″ N; longitude: 9°34′20″ E) in the Orobic pre-Alps (Figure 1). It is enclosed in Taleggio and Vedeseta municipalities, and it is partially enclosed in the Orobie Bergamasche Regional Park [30,31] and in “Valle Asinina” site of community importance (SCI IT2060007 managed by the Orobie Bergamasche Regional Park). The park was established in 1989 and protects endangered species (plants and animals) and habitats of community interest. Some human activities are allowed in the park, including grazing of cows/sheep/goats.
Taleggio Valley is a typical alpine valley characterized by a mainly mountainous territory (elevation range: 700–2050 m a.s.l.) and a low population density (11 inhabitants per km2) [32,33]. It develops mainly on calcareous-dolomitic rocks but also on terrestrial rocks of the Mesozoic Era (252–65 million years ago) [34]. From a climatic point of view, it is enclosed in the temperate oceanic bioclimate zone [35]. The annual rainfall of the Taleggio Valley is 1998 mm (with a winter minimum), while the average annual temperature is 10 °C (data source: Regazzoni R. climatic station, 1977–2011).
Figure 1.
Geographic location of the study area (Taleggio Valley) and land-use changes from 1954 to 2018 (data source: [33]). Orobie Bergamasche Regional Park was created in 1989.
Figure 1.
Geographic location of the study area (Taleggio Valley) and land-use changes from 1954 to 2018 (data source: [33]). Orobie Bergamasche Regional Park was created in 1989.

Taleggio Valley belongs to the Insubric district [36] of Central and Eastern Alps ecoregional section (alpine Province) [37]. The Central and Eastern Alps ecoregional section is 126,000 km2 wide, and it is constituted by alpine territories with similar climatic features, physiography (litho-structural regions and morpho-tectonic sectors), biogeography and vegetation (potential vegetation complex and flora). It includes a considerable amount of the alpine Province, and it is constituted by an oceanic temperate climate at the uppermost elevation and temperate continental in interior valleys: precipitations range from 570 mm up to 2600 mm (with winter or early spring minimum) while the mean annual temperature ranges between 2 °C and 14 °C [37].
The potential vegetation of the study area is composed by the forest of Tilio platyphylli–Acerion pseudoplatani phytosociological alliance in the valley bottom and by the forest of Aremonio agrimonioidis–Fagion sylvaticae alliance in the mountain belt [38,39], the latter being the dominant forest typology of the whole study area. Today, the Taleggio Valley forests cover 67% of the area, and the anthropogenic grasslands (meadows, meadows-pastures, and pastures) cover just 27% [33] (Figure 1). In the last decades and even today, due to the loss of population and consequently the reduction of agricultural activities (both inside and outside the Orobie Bergamasche Park), forests gradually expanded to the detriment of grasslands (Figure 1), which were replaced by shrublands and then forests, following the secondary plant successions processes [20,39]. This phenomenon is not exclusive to the studied area but is common to many marginal areas of the Alps [12,18].
2.2. Vegetation Sampling
The following vegetation types of the mountain belt (720–1710 m a.s.l.) of Taleggio Valley were considered in this research:
- A—meadows: grasslands regularly mowed (from one to three times a year) and manured once a year for the past 10 years or more;
- B—meadows-pastures: grasslands that have been managed as meadows (mowed and manured) or pastures (grazed by cattle) alternatively for at least five years or that are regularly mowed once a year (on May–June) and then grazed (August–September);
- C—pastures: grasslands, with the occasional presence of small shrubs that have been grazed by cattle for more than ten years;
- D—shrublands: areas dominated by shrubs grown where grasslands have not been managed for at least five years;
- E—forests: vegetation dominated by woody species (trees cover over 60%), Fagus sylvatica (beech) in particular, managed to produce firewood or unmanaged (current potential vegetation [27]).
The information about the territory management was gathered by interviewing 27 local farmers and extrapolated from maps on land use supplied by management bodies (municipality of Taleggio and Vedeseta). This preliminary work out allowed the individuation of 7 meadows, 6 meadows–pastures, 5 pastures, 7 shrublands and 7 forests included in the five types described (A, B, C, D and E).
Further, the local farmers provided the following guidelines concerning the meadows and pastures of Taleggio Valley management: meadows located under 1200 m a.s.l. are mowed at least twice a year while the ones at higher altitude are mowed just once a year; meadows are manured with ripe manure (by manure spreader and distributing an average 2 kg of ripe manure per square meter) once a year before winter; pastures are grazed by adult cattle or heifers of Italian Friesian and/or Brown Swiss, in a range from five to ten units per hectare; the most neglected pastures and meadows are those characterized by lack of accessibility or excessive slope (over 30%) making mechanized operations impossible.
Floristic data of these vegetation types were collected performing 48 phytosociological relevés in accordance with the method of Braun-Blanquet [40]: species of the plant communities were identified using the dichotomous keys of [41], and their coverage was estimated using the conventional abundance/dominance scale of Braun-Blanquet (Table 1). The relevés were performed in June–July 2018 and 2019 on a surface of 25 m2 (5 × 5 m) for meadows, meadows-pastures and pastures, and on a surface of 100 m2 (10 × 10 m) for shrublands, and 400 m2 (20 × 20 m) for forests. For each meadow (n = 13 relevés), meadows-pasture (n = 6 relevés), pasture (n = 7 relevés), shrubland (n = 14 relevés) and forest (n = 8 relevés), from 1 to 3 relevés were performed based on the dimension and heterogeneity of plant community.
2.3. Ecological Indices and Data Analysis
The conventional ecological indexes of Landolt [44,45] (T, temperature; K, continentality; L, light intensity; F, soil moisture; R, substrate reaction; N, nutrients; H, humus; D, aeration) and mowing tolerance index (MV), reported in tables published in [45] or in the software “Flora Indicativa” [45], were used to analyze the ecological characteristics of the different vegetation typologies. For every relevé, the average value of each index (weighted by the percentage of coverage of every single species) was calculated. To do this, “0” value was used instead of the symbol “-” (species not tolerating annual cut or grazing) of MV index and records identified with “x” symbol (species with a wide range of variation) were excluded. Average values of Landolt indexes of each relevé were calculated.
Detrended correspondence analysis (DCA) was performed on the matrix of the relevés to assess plot grouping in each vegetation type and to detect similarities in species composition. Further, a DCA considering floristic data and average values of ecological indexes of each relevés was performed in order to seek the relationships between vegetation types and environmental variables (Landolt indexes). These variables values were then analyzed by ANOVA test (once the assumptions of normality of group data and homogeneity of variances were verified using the Shapiro–Wilk test and Levene’s test, respectively) in order to validate significant differences (p < 0.01) among the five different vegetation typologies. When significant ecological differences were found among vegetation types, the Tukey post hoc test [46] was carried out to detect the difference between each pair of vegetation types. These statistical analyses were performed using R 3.5.2 [47] and considering first all vegetation types and then grassland types alone. To develop a classification system of grasslands and create a tool (VegeT) able to return useful information for management purposes, particular attention was devoted to the analyses of those indices able to give information regarding grasslands management. These indices were: N, which relates to the level of manuring of grasslands, and MV, which relates to the use intensity of the pasture or the frequency of mowing of the meadows [44,45]. The differences concerning the range of N and MV relating to the different grassland types were analyzed and used to calibrate the grasslands of Alps classification tool VegeT, elaborated using Microsoft Excel® software. Considering that few highly intensive grasslands can be found in Taleggio Valley, some relevés drawn from the scientific literature were used to improve the calibration of VegeT. In particular, six relevés of Rumex alpinus communities (Rumicetum alpini) [48] and one relevé performed in an overgrazed pasture [18] were used (Table S1).
3. Results and Discussion
3.1. Floristic and Ecological Features
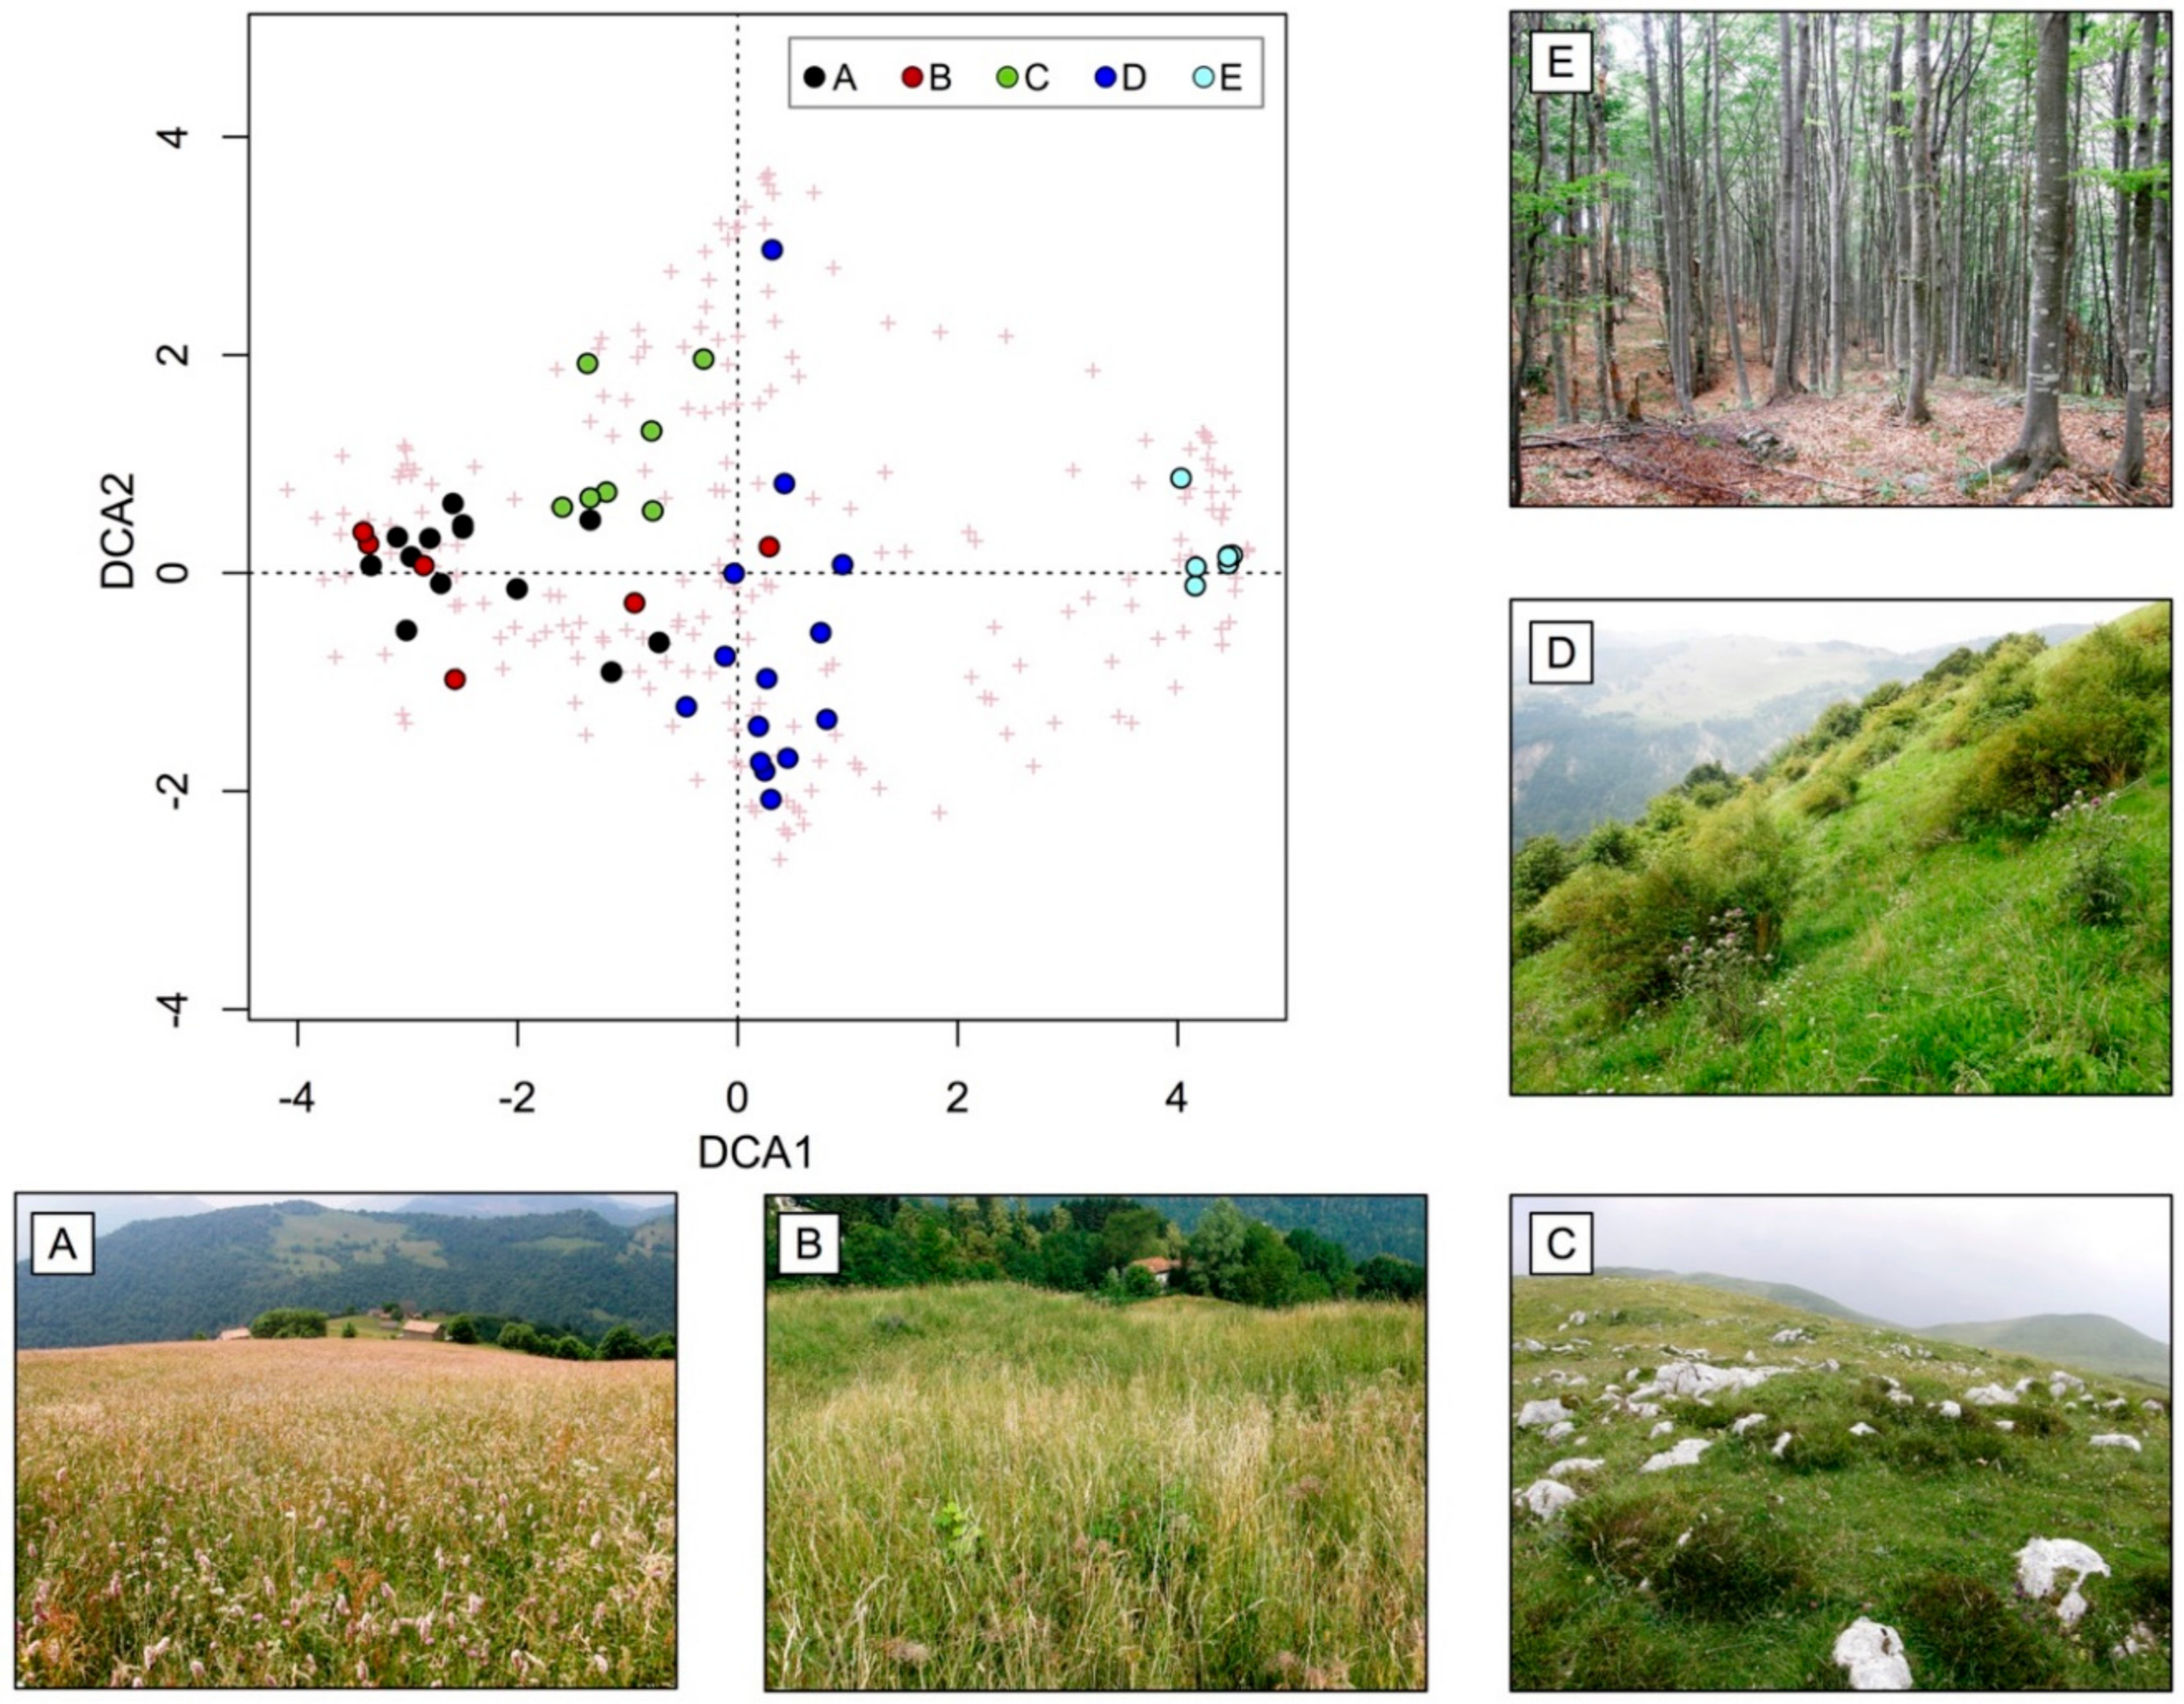
Two hundred sixty-one species were identified (Table S2) to be the most widespread in the alpine region [49,50] in management systems like the ones of Taleggio Valley. We found 98 species in meadows, 87 in meadow-pastures, 89 in pastures, 173 in shrublands and 84 in forests. DCA biplot (Figure 2) showed the floristic differences among the diverse vegetation typologies. Along the first axis (DCA1), forests were distinct from the other vegetation types thanks to the presence of some tree and herbaceous species of Fagetalia sylvaticae order [43,51] such as Fagus sylvatica, Helleborus niger, Hepatica nobilis, Cyclamen purpurascens and Euphorbia amygdaloides.
Along the first axis of the DCA biplot (Figure 2), grasslands (meadows, meadows-pastures and pastures) separated from shrublands which, although having some ecosystem-specific woody species (such as Rubus idaeus, Rosa canina, Salix caprea, Betula pendula and Laburnum alpinum) share some other species with grasslands (such as Achillea millefolium, Dactylis glomerata, Hypericum maculatum and Centaurea nigrescens). Meadows, meadows-pastures, and pastures have several species in common, but also some specific ones. In particular, meadows and meadows-pasture are characterized by the presence of species of Molinio–Arrhenatheretea class (such as Trisetum flavescens, Polygonum bistorta, Trifolium pratense, Rumex acetosa, Poa pratensis, P. alpina and Arrhenatherum elatius) while pastures are rich in species of Festuco–Seslerietea class (such as Sesleria varia, Horminum pyrenaicum, Primula glaucescens, Carex sempervirens and Anthyllis vulneraria), vegetation typologies common in all the alpine region [43,51,52,53].
One-way ANOVA test results (Table 2) showed that no significant differences were found among the different vegetation typologies regarding indexes F and R, while there were significant differences (p < 0.01) for MV, N, D, L, K and T.
From the floristic analysis of the mountain grasslands of the Taleggio Valley, it emerged that meadows, pastures and meadows-pasture are mainly constituted by species widespread in all the Alps, while from the ecological analysis, it emerged that the different vegetation types are significantly different in N and MV indices, those returning the most of the information regarding the management of the grassland. T, K, L and D highlighted instead of the differences among the grasslands and the other typologies considered. All the indices were useful for the vegetational framework of the area, but N and MV returned specific information for the management of grasslands. In fact, the L index made it possible to distinguish grasslands (composed mainly of heliophilous species) from forests (constituted by many sciaphilous species). At the same, T, D and K resulted significantly different for the various vegetation typologies (Table 2) due to the characteristics of climate (mainly dependent on elevation) and soils of the areas where the plant communities are localized, but they do not provide information on their management.
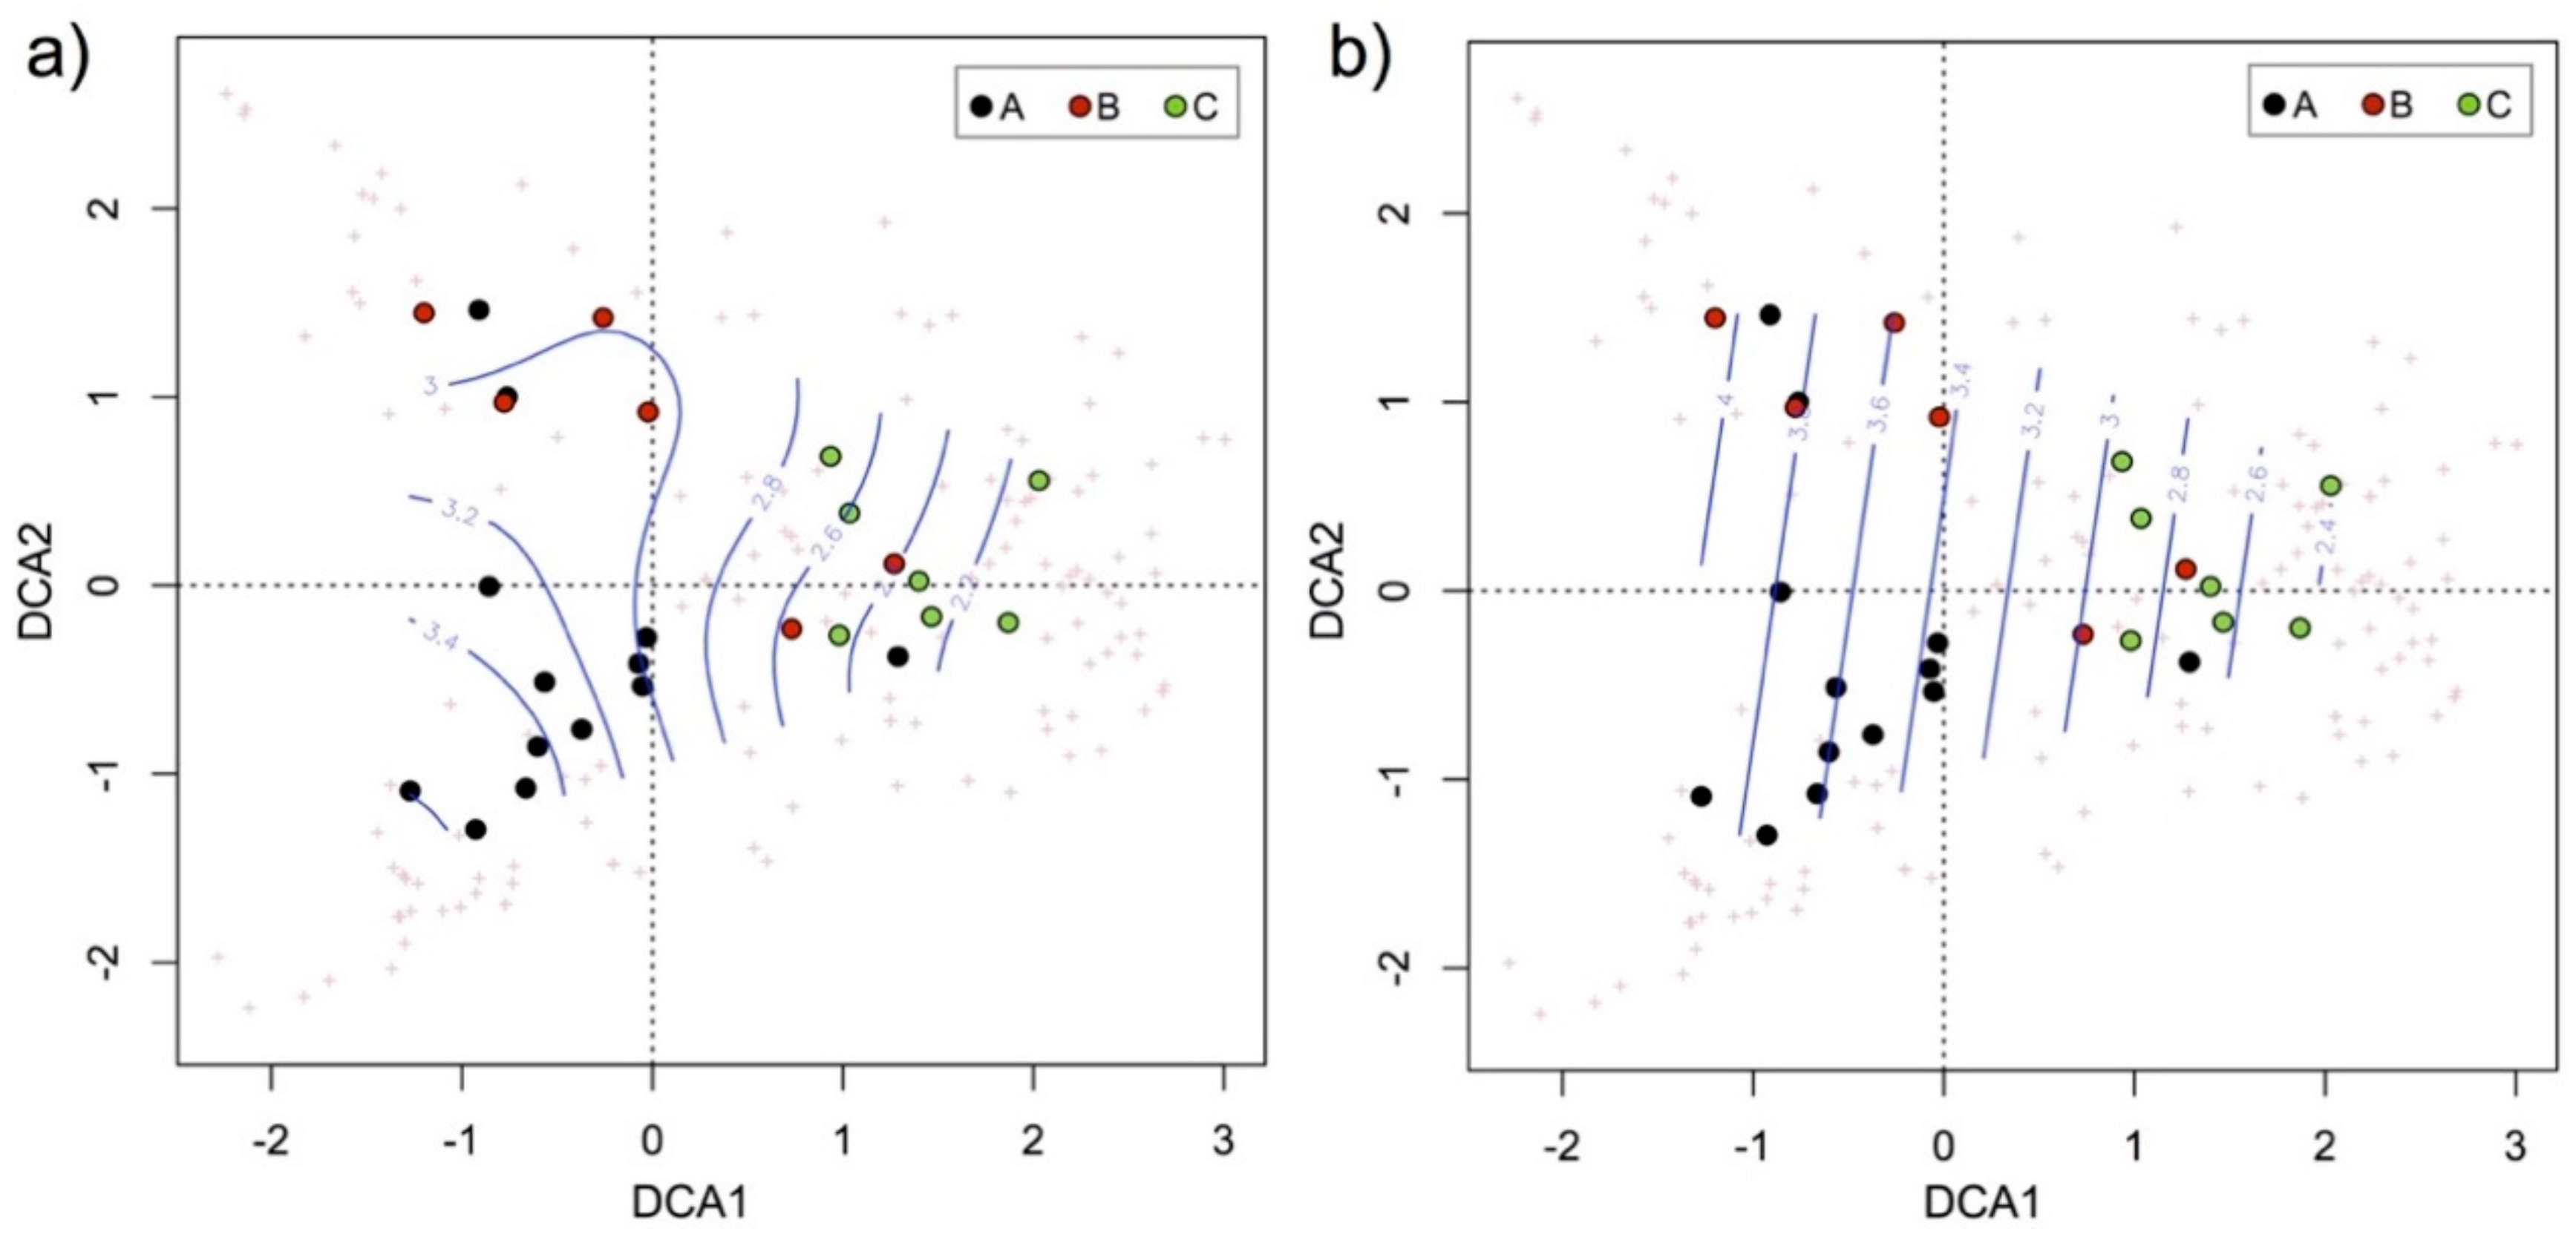
Figure 3 shows the two DCA biplots that display the relevés ordered according to their floristic composition and their values of ecological indexes, the trends of MV and N are also shown. Grasslands had high MV values while shrublands had values inferior to 2.5 and forests to 0.5. Concerning grasslands, the MV trend generally showed values higher for meadows and lower for pastures, although some overlapping was also observed. Value 3.2 of the N index returned a more noticeable distinction among meadows and pastures. From the graph of Figure 3b, in fact, it is possible to see that most of the meadows have N higher than 3.2, while most of the pasture has an N index lower than 3.3. Meadow-pastures had very variable values that follow both the trends of meadows and pastures. These results are also confirmed by the DCA performed, considering only the grasslands relevés (Figure A1).
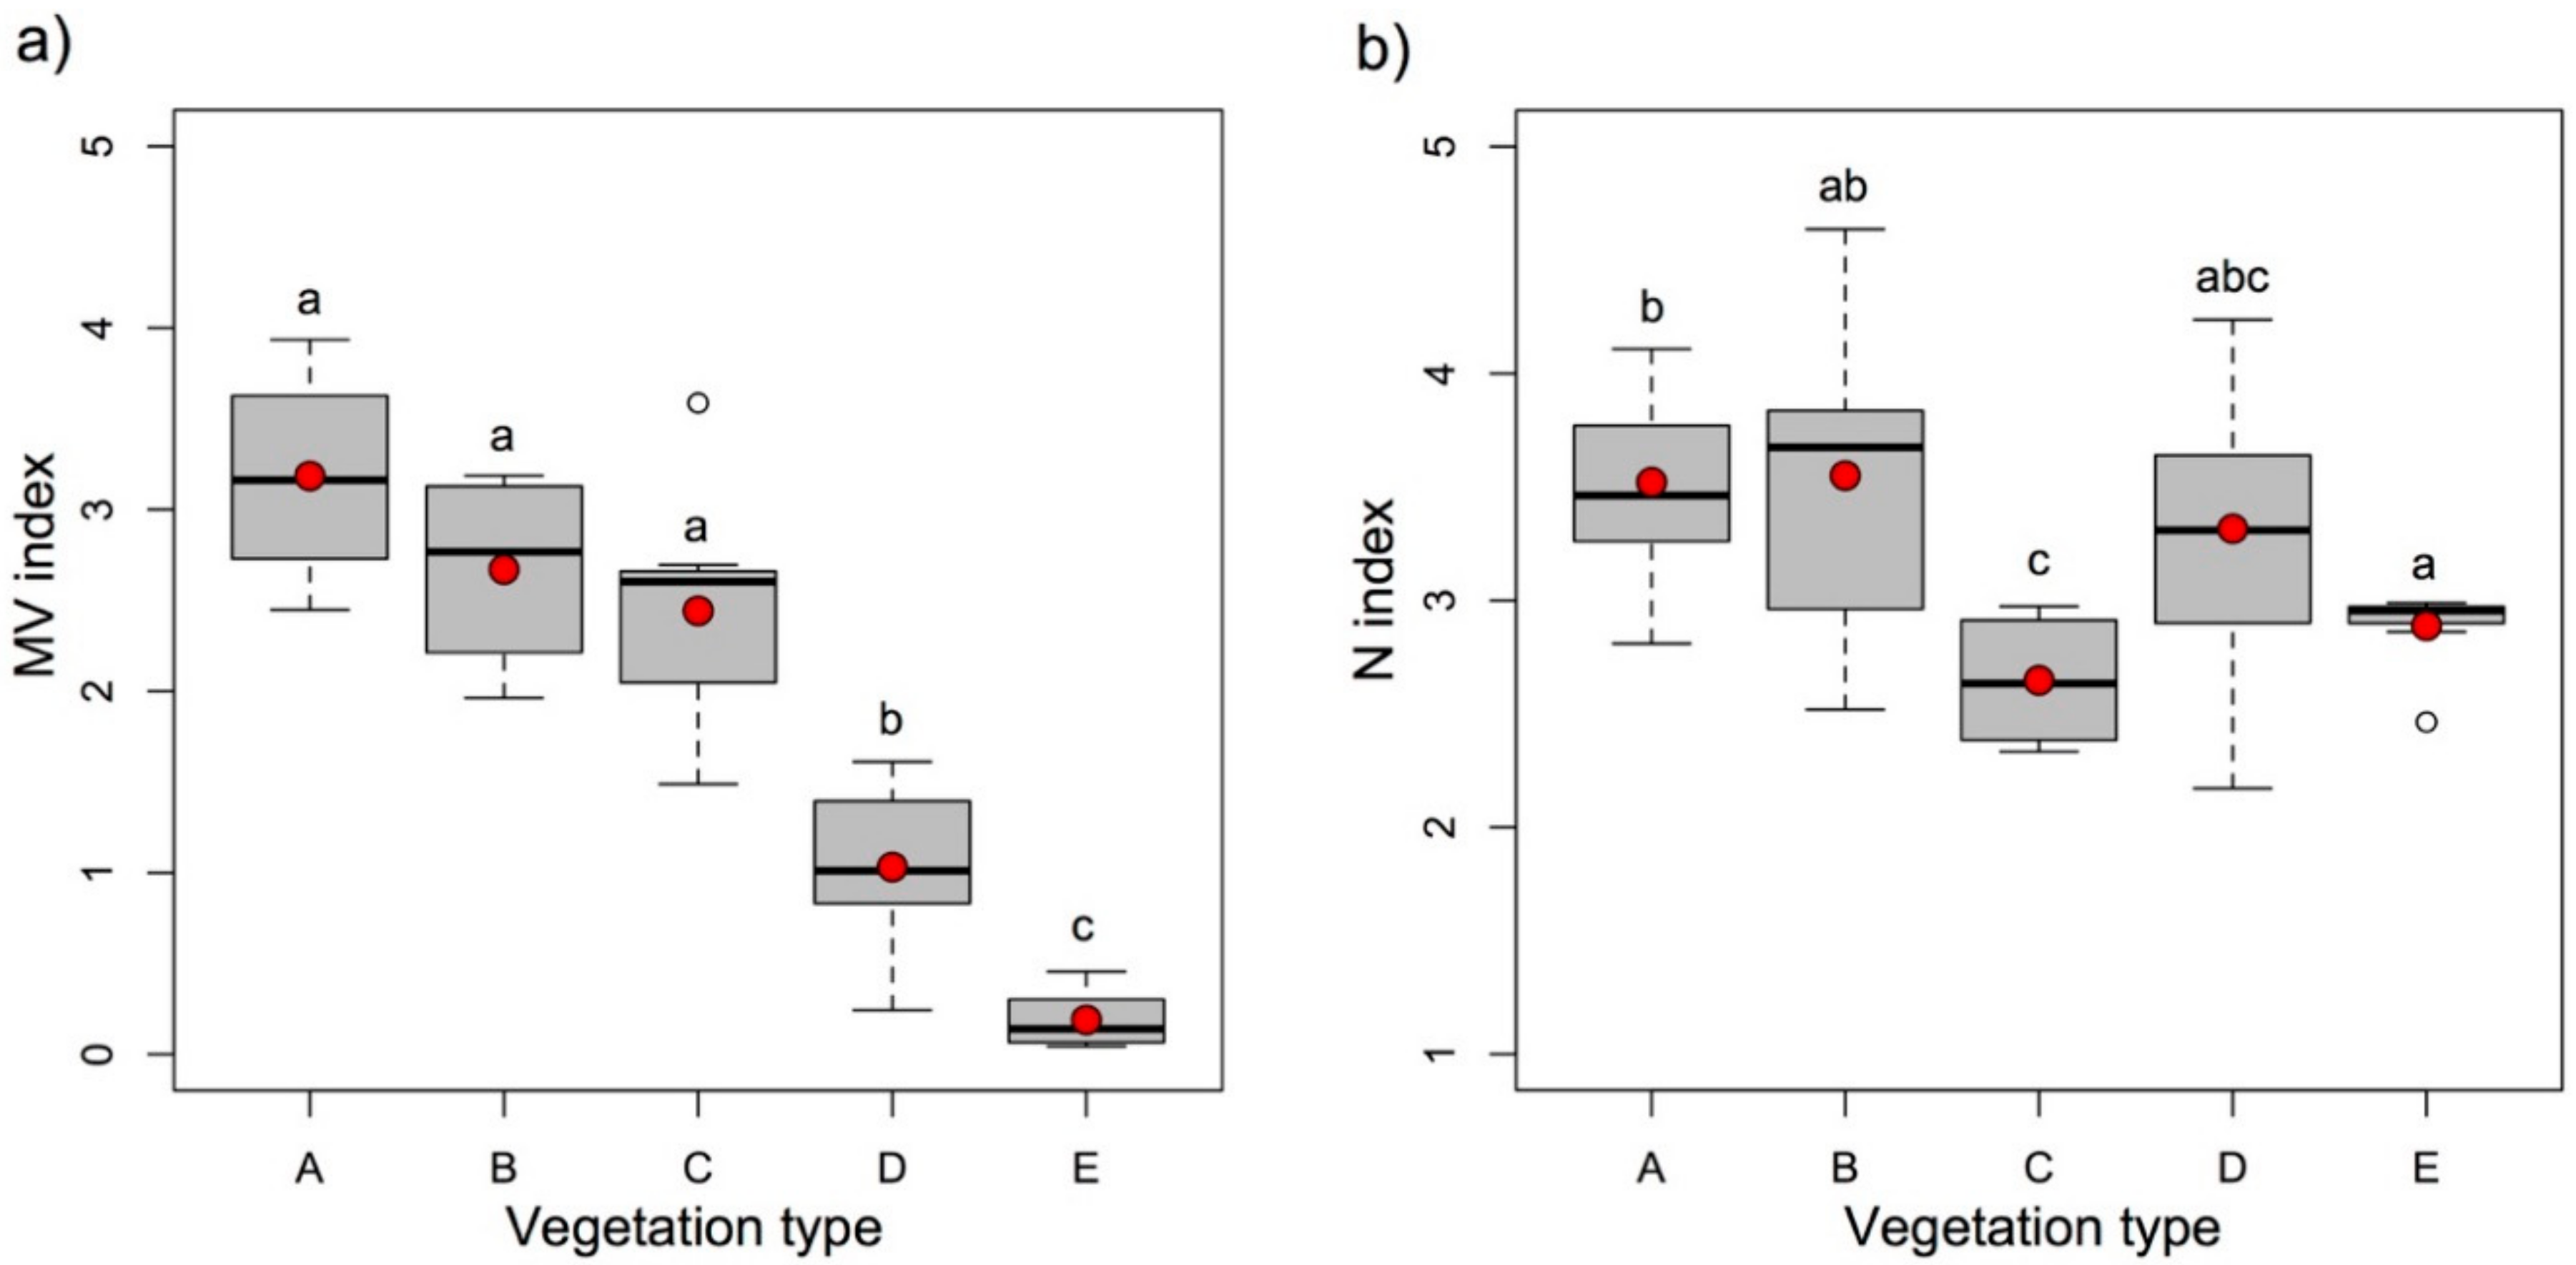
Figure 4 boxplots confirmed what was mentioned above and show Tukey’s test results evidencing the significant difference for MV (p < 0.01) among grasslands, shrublands and forests and showing that meadows and meadow-pastures are significantly different from pastures thanks to N values (lower in pastures).
Our results indicate that N and MV indexes are useful for creating a classification system of grasslands (and connected vegetation) based on their management. N index indicates whether the soil of the grassland considered is rich or poor in nutrients. This index is expected to be higher in meadows than in pastures as meadows are manured every year while pastures are not. In fact, meadows are generally colonized by less nitrophilous species [1,9]. This aspect also emerged in our study area, where pastures are inhabited by more oligotrophic species than meadows (Figure 4). Only in some cases, pastures or meadow-pastures can be characterized by a high presence of nitrophilous species (hyper-eutrophic pastures or meadows-pastures). This can happen in the plains where cattle were/are kept for milking and/or night rest (resting and milking areas). These areas are dominated by tall nitrophilous grass not palatable for cattle as Rumex alpinus and other of Rumicion alpini alliance [43], which grows abundantly where the animal excretions enrich excessively in nitrogen and other nutrients the soil [9,53]. This vegetation type, widespread on the entire alpine region, [18,43,48,51], is not widespread in the Taleggio Valley, where we only had one relevé (Table S2, relevé 9). N index values help define guidelines on the necessity of increasing or reducing the manure quantity distribution on a meadow or on diminishing the cattle stationing in a pasture or a meadow-pasture. For example, in oligotrophic or mesotrophic grasslands, manuring should be encouraged to preserve the presence of species requiring soils rich in nutrients, while fertilization should be reduced for nitrophilous grasslands such as those found in some alpine areas intensively managed [54]. For nitrophilous pastures or meadow-pastures, actions to reduce the nutrients input in the soil as refraining from manuring and/or not letting the cattle stationing too much should be considered. Although index N can return information on the nutrient quantity in the soil, manuring some particular kinds of oligotrophic pastures must be evaluated with attention. In fact, some oligotrophic pastures of Festuco–Seslerietea class (alpine and subalpine calcareous grasslands) are included in the Habitat Directive (92/43/EEC), and to preserve them in their original conditions, the enrichment of the soil with nutrients must be avoided [53].
While the N index helped distinguish meadows from pastures and also helped suggest management guidelines (increase/reduce nutrients), MV allowed for a clear separation between grasslands and other vegetation typologies (shrublands and forests). MV, compared to N, was elaborated only in 2010 [45]; it has not yet been widely used in plant ecology. It is based on [55,56] research and synthesizes the grass tolerance to three disturbance factors: mowing, trampling and grazing [45]. Briefly, this index allows distinguishing vegetation were shrubs or tree and/or grass not tolerating mowing/trampling are dominant from vegetation composed mainly of herbaceous species resilient to mowing, trampling and grazing. In our research, MV values decreased from meadows to pastures (Figure 4), and this was mainly due to the presence of small individuals of shrub species also in actively managed pastures (for example, Calluna vulgaris, Erica carnea, Vaccinium myrtillus, Thymus spp.) while such shrubs were never found in regularly mowed grasslands (meadows). This index also shows information about land abandonment or management changes requiring guidelines for the conservation/restoration of grasslands. In fact, grasslands without a high MV index are probably composed of plant communities with the presence of shrubs and/or grass not tolerant mowing, and this means that mowing is not correctly or regularly performed, and then the land is no longer managed as meadows. The same happens for pastures: those with a low MV value are not actively managed, and shrubs and/or trees are becoming increasingly abundant at the expense of herbaceous species characteristic of pastures. The information returned by the MV index seems very useful for territorial stakeholders, as it could help them identify which grasslands are undergoing (or underwent) management changes or abandonment and to help them in starting targeted actions to preserve/restore them. These actions are mowing/removing trees and/or shrubs to restore the pastures and regularly mowing to restore meadows.
3.2. VegeT
A classification system was elaborated and calibrated based on MV and N indexes (Figure 5). This activity was based on the results obtained from the ecological analysis and on the considerations concerning the information content (linked to the management of seminatural grasslands) of MV and N indexes. This system is constituted by 25 vegetation categories resulted from the combination of the five MV classes (forest, shrubland, pasture, meadow-pasture and meadow) and 5 N classes (hyper-eutrophic, eutrophic, mesotrophic, oligotrophic, hyper-oligotrophic). Figure 6 shows the 25 vegetational categories (and corresponding threshold value) and the location of the relevés. A large part of Taleggio Valley grasslands is eutrophic meadows and eutrophic/mesotrophic meadow-pastures, while pastures fall mainly in the categories: oligotrophic pastures and oligotrophic/mesotrophic meadows-pastures. The only relevé performed with high coverage of Rumex alpinus along with the relevés of Rumicetum alpinum and of the overgrazed pastures were used to define the hyper-eutrophic grasslands category.
“Hyper-oligotrophic” pastures were not found in Taleggio Valley. This result is explicable with the fact that value 1 of N index is ascribed only to those species growing on “very infertile” substrates [45] such as dolomitic-calcareous rocks that, even if present in alpine pastures, are rarely with a high cover percentage. The category “hyper-oligotrophic” was, however, preserved because some peculiar plant communities of the Alps could be included in this category, such as some grasslands of low fertile soils present where dry prairies are common as in the Dolomites massifs [57].
The classification system of Figure 5 was used to create VegeT (“Vege” = vegetation, “T” = type) (Spreadsheet S1), a classification tool of grasslands of the Alps and other vegetation types (forests and shrublands) with which very often grasslands are in a dynamic-catenal relationship [58]. VegeT is a Microsoft Excel® file constituted by spreadsheets: the first reports data-entry and data-exit forms (Figure 6), the two other sheets contain the numerical calculation and the vegetation classification formulas (Spreadsheet S1).
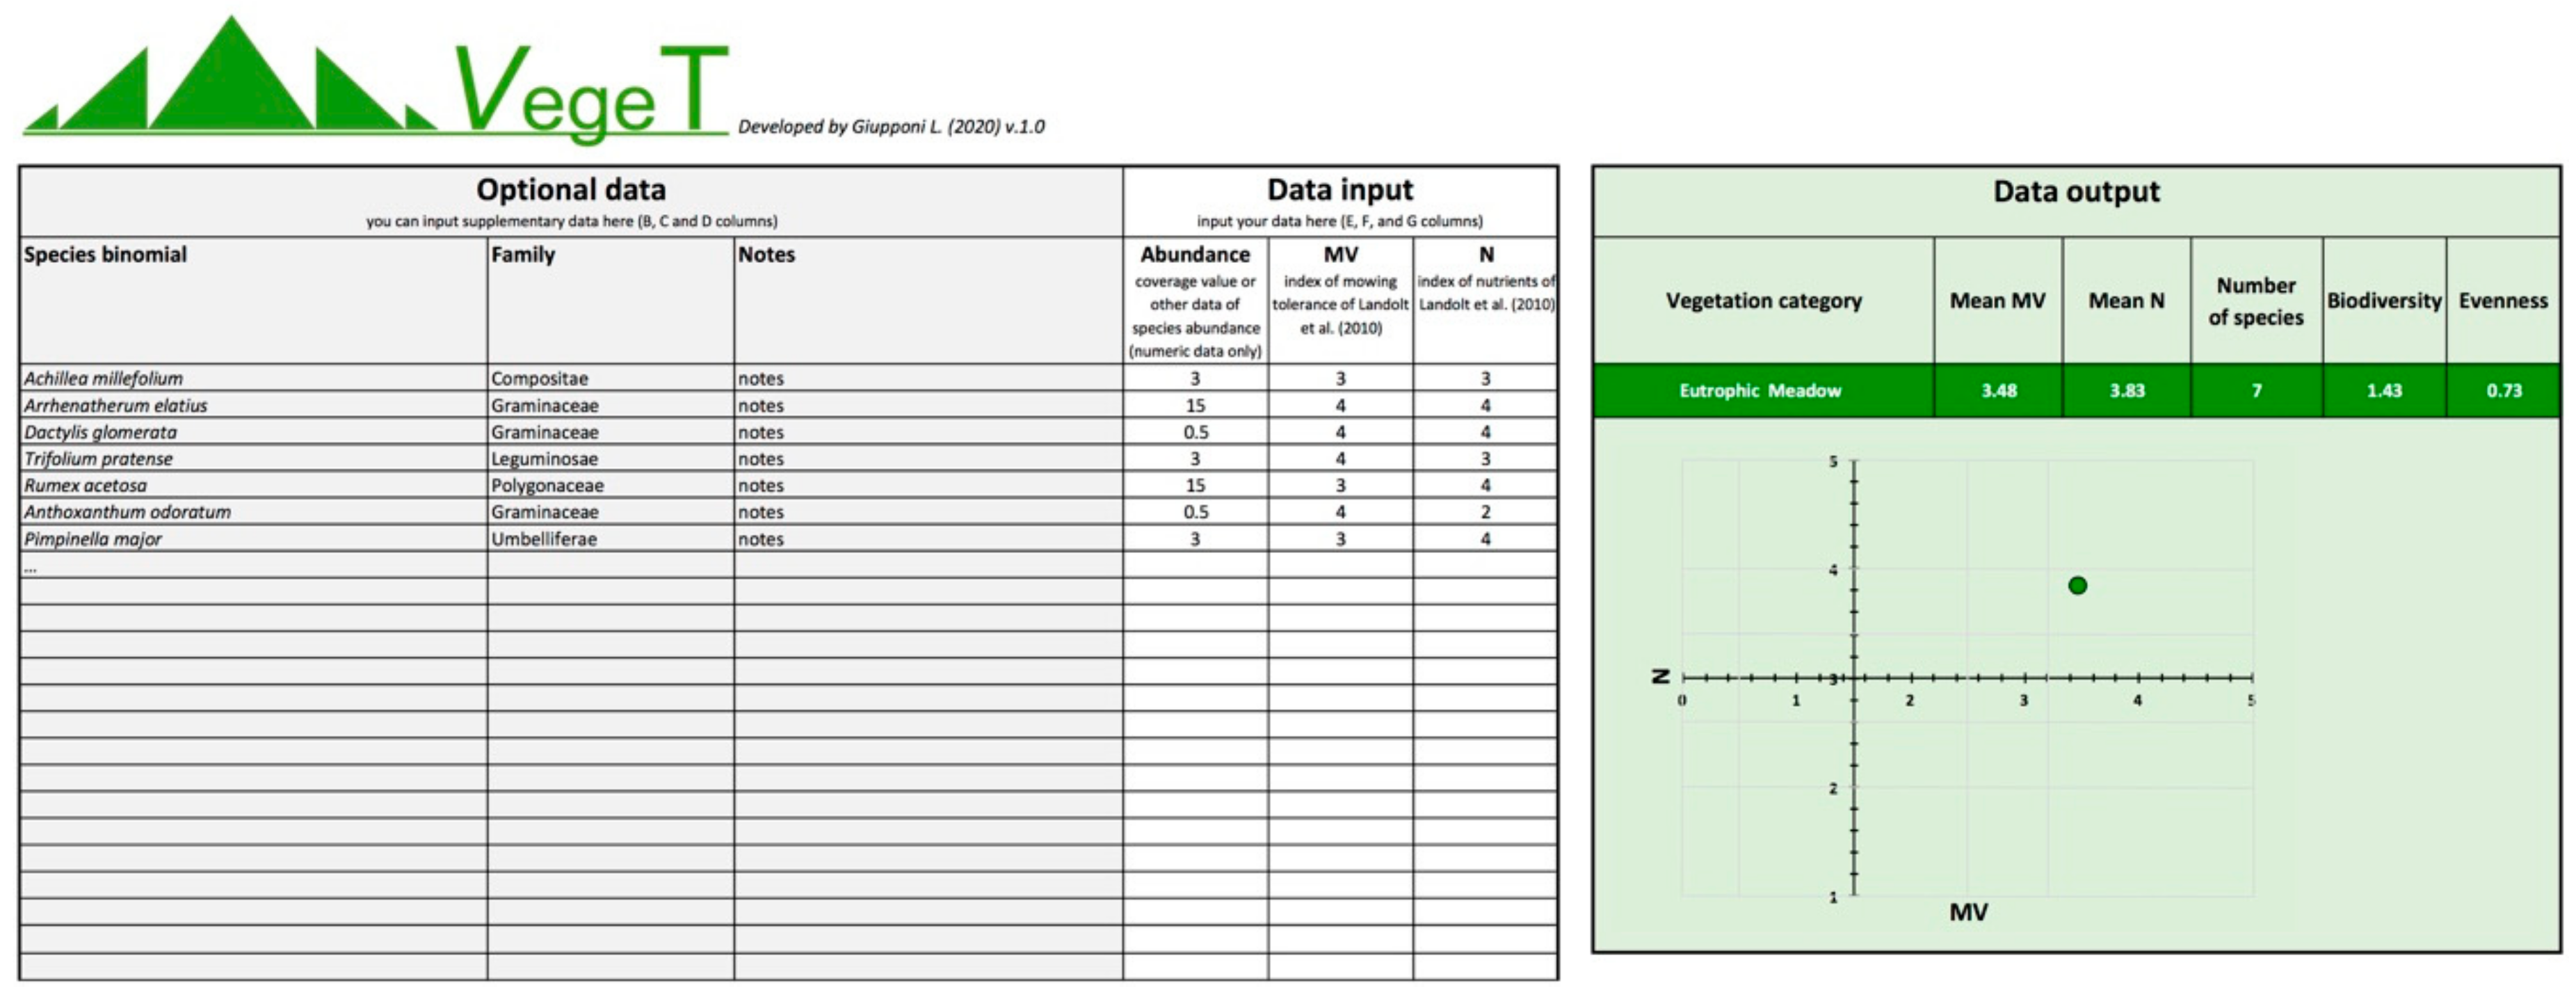
The data as input in VegeT to determine the vegetational categories are abundance, MV and N of each species of the plant community. While MV and N values are readily available in [45] or in the software “Flora Indicativa” (“Indicative Flora”) elaborated by the same authors [45], abundance values depend on the operator’s evaluation during the field observations. Generally, the abundance of a given species in a plant community can be evaluated with the application of abundance/dominance indices, which may be numeric or not. Numeric data are needed for VegeT; if this is not available, abundance/dominance scales must be converted to ordinal scales using the methods proposed by, e.g., [42,59,60]. VegeT also allows for optional data inclusion (not essential for calculation): species and family names and other notes, for example (Figure 6). The data output screenshot returns the vegetation category (one of the 25 defined previously), a graph similar to Figure 5, the mean values of MV and N and some parameters widely used in plant ecology useful for the description of the vegetation characteristics: the number of species composing the plant community (species richness), Shannon index (biodiversity) [61] and evenness (equitability) [62].
The uniqueness of VegeT, other than being based upon only two indexes able to provide information for management purposes, is being a user-friendly tool. The working software is, in fact, a spreadsheet Microsoft Excel®, a software widely used. In addition, the input–output interface is easy and comprehensible (Figure 6). It was considered appropriate to include other variables enabling better characterization of the plant communities in addition to the information concerning the vegetation category and the scatterplot showing MV and N values: the number of species, Shannon index and evenness. The first two can return information on the plant community richness and biodiversity, parameters widely used in ecological and nature conservation, which can help identify grasslands intensively managed [54]. Evenness (equitability) indicates if there are one or few dominant species in a plant community (in which case evenness values will be close to 0) or if species are equally represented (in which case evenness values will be close to 1) [62]. Some plant communities are dominated by few species (for example, Rumex alpinus or Nardus stricta in degraded pastures).
To elaborate on the classification, VegeT requires floristic composition and species abundance of plants constituting the plant communities. The greater the detail of the data input, the more reliable information VegeT can return.
Although the grassland classification on which VegeT is based has the benefit to go beyond the syntaxonomy [63] (commonly to other modern systems of classification of habitats [64,65]), this instrument has the limitation of being only operational in the Alps (and nearby areas) because N and MV indexes used were built on about 6500 species of Alps [45]. This limitation can be overcome with future studies that analyze the nutrients requirements in the soil and the mowing tolerance of species inhabiting other geographical areas so that N and MV indexes value can be determined. However, VegeT could potentially be used in areas with floristic biodiversity similar to the Alps (as Apennine, Pyrenees, Dinaric Alps and Carpathians) or rather where plant communities are mostly constituted by species with N and MV known values [45]. In this study, for example, the data of the relevés of Rumicion alpini (Figure 5) performed in Western Carpathians [48] were used, and just one species (Aconitum firmum) did not have known values of N and MV as reported in [45].
For Taleggio Valley, as for other mountain areas in the Alps, VegeT could be a useful instrument to improve the agro-food products from grasslands (for example, honey and cheese). In Taleggio Valley, in fact, cheeses of high quality and of protected origin are produced. The production regulations of these cheeses stipulate that the alimentation of cattle must rely on local forage for the most part of their diet, although this forage is becoming less available due to grassland abandonment (Figure 1). VegeT cannot substitute other tools/procedures to evaluate the forage quantity and quantity neither the biological values of grasslands [3,9,18,65,66,67,68]. However, it can be combined with other tools to facilitate the definition and planning of the best management practices for maintaining grasslands that, other than being a biodiversity heritage, could be excellent resources for agro-food production chains [69]. In addition, when using VegeT, it should be considered that this is a useful tool for the overall classification of grasslands, but specific cases must be considered for a correct interpretation when we want to preserve, for example, a condition of low fertility necessary to the survival of some specific protected species. Some plant communities, such as alpine and subalpine calcareous grasslands included in the Habitat Directive, must be identified as special cases and be managed carefully for their conservation values. In these occurrences, botanists’ competencies are needed because other than guaranteeing their recognition; they can direct land managers towards the best actions to manage/preserve these special habitats.
Finally, it must be highlighted that VegeT is the first edition of an instrument that can be improved and/or integrated (if needed) thanks to user (researchers, technicians and land managers) feedback. Greater usage in the next few years, including its application in different alpine areas and the consideration of different grasslands typologies [57], will contribute to the improvement of the tool.
4. Conclusions
This research enabled the development of a tool (VegeT) based on the floristic and ecological study of the vegetation of Taleggio Valley. The aim of this tool was to assist in the interpretation of the floristic-vegetation datasets (created by botanists) for practitioners in charge of providing guidelines for the appropriate management of mountain grasslands of the Alps. In fact, it returns outputs straightforwardly understandable and needs easy to use, simple, affordable and easy to find materials and methods: floristic-vegetation data provided by botanists, N and MV indexes of Landolt [45] and Microsoft Excel®. For these reasons, VegeT can become useful not only to facilitate and improve grasslands conservation/restoration projects but also to improve their management for productive purposes to promote the sustainable development of alpine areas as Taleggio Valley, that was in the past an important center of low input and sustainable agricultural activities as pastoralism.
Supplementary Materials
The following are available online at https://www.mdpi.com/2073-445X/9/12/473/s1, Spreadsheet S1: VegeT spreadsheet. Table S1: Table of relevés of Rumicetum alpini and overgrazed pasture. Table S2: Table of relevés performed in Taleggio Valley. Key: A, meadows; B, meadows-pastures; C, pastures; D, shrublands; E, forests. Cover indices refer to the Braun-Blanquet abundance/dominance scale. Table S3: Eigenvalues for the first four axes of DCAs.
Author Contributions
Conceptualization, L.G. and V.L.; methodology, L.G.; software, L.G.; validation, L.G. and V.L.; formal analysis, L.G.; investigation, L.G.; plant identification, L.G.; data curation, L.G. and V.L.; writing—original draft preparation, L.G. and V.L.; writing—review and editing, L.G. and V.L.; visualization, L.G. and V.L.; project administration, L.G.; funding acquisition, L.G. All authors have read and agreed to the published version of the manuscript.
Funding
This research was funded and realized within the “Italian Mountain Lab” project and by DARA-CRC Ge.S.Di.Mont. agreement.
Acknowledgments
The authors thank the Ministry of Education, University and Research (MIUR) and the Department for Regional Affairs and Autonomies (DARA) of the Italian Presidency of the Council of Ministers for the financial support, and the farmers and land managers of the Taleggio Valley for their field support.
Conflicts of Interest
The authors declare no conflict of interest.
Appendix A
Figure A1.
DCA ordination of grasslands relevés overlapped with the MV (mowing tolerance, (a) and N (index of nutrients, (b) contour lines. The points indicate the relevés: A, meadows; B, meadows-pastures; C, pastures. Eigenvalues for DCA axes are reported in Table S3.
Figure A1.
DCA ordination of grasslands relevés overlapped with the MV (mowing tolerance, (a) and N (index of nutrients, (b) contour lines. The points indicate the relevés: A, meadows; B, meadows-pastures; C, pastures. Eigenvalues for DCA axes are reported in Table S3.
References
- Körner, C. Alpine Plant Life: Functional Plant Ecology of High Mountain Ecosystems; Springer: Berlin, Germany, 2003. [Google Scholar]
- Bucher, R.; Andres, C.; Wedel, M.F.; Entling, M.H.; Nickel, H. Biodiversity in low-intensity pastures, straw meadows, and fallows of a fen area—A multitrophic comparison. Agric. Ecosyst. Environ. 2016, 219, 190–196. [Google Scholar] [CrossRef]
- Pierik, M.E.; Gusmeroli, F.; Della Marianna, G.; Tamburini, A.; Bocchi, S. Meadows species composition, biodiversity and forage value in an Alpine district: Relationships with environmental and dairy farm management variables. Agric. Ecosyst. Environ. 2017, 244, 14–21. [Google Scholar] [CrossRef]
- Ceballos, G.; Davidson, A.; List, R.; Pacheco, J.; Manzano-Fischer, P.; Santos-Barrera, G.; Cruzado, J. Rapid Decline of a Grassland System and Its Ecological and Conservation Implications. PLoS ONE 2010, 5, e8562. [Google Scholar] [CrossRef] [PubMed] [Green Version]
- Pruchniewicz, D. Abandonment of traditionally managed mesic mountain meadows affects plant species composition and diversity. Basic Appl. Ecol. 2017, 20, 10–18. [Google Scholar] [CrossRef]
- Tarolli, P.; Straffelini, E. Agriculture in Hilly and Mountainous Landscapes: Threats, Monitoring and Sustainable Management. Geogr. Sustain. 2020, 1, 70–76. [Google Scholar] [CrossRef]
- Körber-Grohne, U. Gramineen und Grünlandvegetation vom Neolithikum bis zum Mittelalter in Mitteleuropa. Bibl. Bot. 1990, 139, 1–105. [Google Scholar]
- Körber-Grohne, U. Urwiesen im Berg und Hügelland aus archäobotanischer Sicht. Diss. Bot. 1993, 196, 453–468. [Google Scholar]
- Gusmeroli, F. Prati, Pascoli e Paesaggio Alpino; SoZooAlp: San Michele all’Adige, Italy, 2012. [Google Scholar]
- Leuschner, C.; Ellenberg, H. Ecology of Central European Non-Forest Vegetation: Coastal to Alpine, Natural to Man-Made Habitats; Springer Science and Business Media LLC: Berlin/Heidelberg, Germany, 2017. [Google Scholar]
- Bouton, Y.; Leys, B.; Ferrez, Y.; Manneville, V.; Mouly, A.; Greffier, B.; Hennequin, C.; Bouton, Y.; Prévost-Bouré, N.C.; Gillet, F. Towards the assessment of biodiversity and management practices in mountain pastures using diagnostic species? Ecol. Indic. 2019, 107, 105584. [Google Scholar] [CrossRef]
- Nordregio. Mountain Areas in Europe: Analysis of Mountain Areas in EU Member States, Acceding and Other European Countries. Commissioned Report by the European Commission; DG Regional Policy: Brussels, Belgium, 2004. [Google Scholar]
- Macdonald, D.; Crabtree, J.; Wiesinger, G.; Dax, T.; Stamou, N.; Fleury, P.; Lazpita, J.G.; Gibon, A. Agricultural abandonment in mountain areas of Europe: Environmental consequences and policy response. J. Environ. Manag. 2000, 59, 47–69. [Google Scholar] [CrossRef]
- Keenleyside, C.; Tucker, G.M. Farmland Abandonment in the EU: An Assessment of Trends and Prospects Report Prepared for WWF; Institute for European Environmental Policy: London, UK, 2010. [Google Scholar]
- Terres, J.M.; Nisini, L.; Anguiano, E. Assessing the Risk of Farmland Abandonment in the EU. Final Report EUR 25783EN; Joint Research Centre of the European Commission: Brussels, Belgium, 2013.
- Targetti, S.; Staglianò, N.; Messeri, A.; Argenti, G. A state-and-transition approach to alpine grasslands under abandonment. iForest Biogeosci. For. 2010, 3, 44–51. [Google Scholar] [CrossRef] [Green Version]
- Monteiro, A.; Fava, F.; Hiltbrunner, E.; Della Marianna, G.; Bocchi, S. Assessment of land cover changes and spatial drivers behind loss of permanent meadows in the lowlands of Italian Alps. Landsc. Urban Plan. 2011, 100, 287–294. [Google Scholar] [CrossRef]
- Cislaghi, A.; Giupponi, L.; Tamburini, A.; Giorgi, A.; Bischetti, G.B. The effects of mountain grazing abandonment on plant community, forage value and soil properties: Observations and field measurements in an alpine area. Catena 2019, 181, 104086. [Google Scholar] [CrossRef]
- Loidi, J. Dynamism in vegetation. Vegetation changes on a short time scale. In The Vegetation of the Iberian Peninsula; Loidi, J., Ed.; Springer: Cham, Switzerland, 2017; pp. 81–99. [Google Scholar]
- Prach, K.; Walker, L.R. Differences between primary and secondary plant succession among biomes of the world. J. Ecol. 2018, 107, 510–516. [Google Scholar] [CrossRef]
- Tscharntke, T.; Klein, A.M.; Kruess, A.; Steffan-Dewenter, I.; Thies, C. Landscape perspectives on agricultural intensification and biodiversity †ecosystem service management. Ecol. Lett. 2005, 8, 857–874. [Google Scholar] [CrossRef]
- Niedrist, G.; Tasser, E.; Lüth, C.; Via, J.D.; Tappeiner, U. Plant diversity declines with recent land use changes in European Alps. Plant Ecol. 2009, 202, 195–210. [Google Scholar] [CrossRef]
- Chiesa, L.; Labella, G.; Giorgi, A.; Panseri, S.; Pavlovic, R.; Bonacci, S.; Arioli, F. The occurrence of pesticides and persistent organic pollutants in Italian organic honeys from different productive areas in relation to potential environmental pollution. Chemosphere 2016, 154, 482–490. [Google Scholar] [CrossRef]
- Lakner, S.; Zinngrebe, Y.; Koemle, D. Combining management plans and payment schemes for targeted grassland conservation within the Habitats Directive in Saxony, Eastern Germany. Land Use Policy 2020, 97, 104642. [Google Scholar] [CrossRef]
- Luoni, F.; Rossi, P.; Celada, C. Programmi di Sviluppo Rurale 2014–2020 Delle Regioni Lombardia e Piemonte e Biodiversità: Un Approccio Analitico. Lipu, WWF, Legambiente; FAI: Milan, Italy, 2018. [Google Scholar]
- Argenti, G.; Lombardi, G. The pasture-type approach for mountain pasture description and management. Ital. J. Agron. 2012, 7, 39. [Google Scholar] [CrossRef] [Green Version]
- Biondi, E. Phytosociology today: Methodological and conceptual evolution. Plant Biosyst. Int. J. Deal. Asp. Plant Biol. 2011, 145, 19–29. [Google Scholar] [CrossRef]
- Dengler, J.; Chytry, M.; Ewald, J. Phytosociology; Elsevier BV: Amsterdam, The Netherlands, 2008; pp. 2767–2779. [Google Scholar]
- Pagliacci, F.; Pavone, P.; Russo, M.; Giorgi, A. Regional structural heterogeneity: Evidence and policy implications for RIS3 in macro-regional strategies. Reg. Stud. 2019, 54, 765–775. [Google Scholar] [CrossRef]
- Giupponi, L.; Giorgi, A. Mount Cavallo Botanical Path: A proposal for the valorization of an area of the Orobie Bergamasche Regional Park (Southern Alps). Eco. Mont 2017, 9, 5–15. [Google Scholar] [CrossRef] [Green Version]
- Giupponi, L.; Giorgi, A. A contribution to the knowledge of Linaria tonzigii Lona, a steno-endemic species of the Orobie Bergamasche Regional Park (Italian Alps). Eco. Mont 2019, 11, 16–24. [Google Scholar] [CrossRef] [Green Version]
- ISTAT—National Institute of Statistics. Bilancio Demografico Anno 2018. Available online: http://demo.istat.it/bilmens2018gen/index.html (accessed on 20 August 2020).
- RGDB—Regional Geographical Database. Geographical Database of Regione Lombardia. 2018. Available online: http://www.geoportale.regione.lombardia.it (accessed on 20 August 2020).
- Bergamo Province. Carta Geologica Della Provincia di Bergamo; Grafica Monti s.n.c.: Bergamo, Italy, 2002. [Google Scholar]
- Rivas-Martínez, S.; Penas, A.; Díaz, T.E. Biogeographic map of Europe. 2004. Available online: http://www.globalbioclimatics.org/form/maps.htm (accessed on 20 August 2020).
- Andreis, C. I distretti geobotanici. In I Tipi Forestali della Lombardia; Del Favero, R., Ed.; Cierre: Verona, Italy, 2002; pp. 36–40. [Google Scholar]
- Di Blasi, C.; Capotorti, G.; Copiz, R.; Guida, D.; Mollo, B.; Smiraglia, D.; Zavattero, L. Classification and mapping of the ecoregions of Italy. Plant Biosyst. Int. J. Deal. Asp. Plant Biol. 2014, 148, 1255–1345. [Google Scholar] [CrossRef]
- Del Favero, R. I Tipi Forestali della Lombardia; Cierre: Verona, Italy, 2002. [Google Scholar]
- Verde, S.; Assini, S.; Andreis, C. Le serie di vegetazione della regione Lombardia. In La Vegetazione d’Italia; Blasi, C., Ed.; Palombi and Partner, S.r.l: Roma, Italy, 2010; pp. 181–203. [Google Scholar]
- Braun-Blanquet, J. Pflanzensoziologie; Springer Science and Business Media LLC: Berlin/Heidelberg, Germany, 1964. [Google Scholar]
- Pignatti, S. Flora d’Italia; Edagricole: Bologna, Italy, 2017. [Google Scholar]
- Canullo, R.; Allegrini, M.C.; Campetella, G. Reference field manual for vegetation surveys on the Conecofor Lii network, Italy (National Programme of Forest Ecosystems Control—Unece, ICP Forests). Braun-Blanquetia 2012, 48, 5–65. [Google Scholar]
- Biondi, E.; Blasi, C. Prodromo Della Vegetazione d’Italia. 2015. Available online: http://www.prodromo-vegetazione-italia.org (accessed on 20 August 2020).
- Landolt, E. Ökologische Zeigerwerte zur Schweizer Flora; Geobotanisch Institut ETH: Zurich, Switzerland, 1977. [Google Scholar]
- Landolt, E.; Bäumler, B.; Erhardt, A.; Hegg, O.; Klötzli, F.; Lämmle, R.W.; Nobis, M.; Rudmann-Maurer, K.; Schweingruber, F.H.; Theurillat, J.-P.; et al. Flora Indicative: Ecological Indicator Values and Biological Attributes of the Flora of Switzerland and the Alps; Haupt Verlag: Bern, Switzerland; Stuttgart, Germany; Wien, Austria, 2010. [Google Scholar]
- Tukey, J.W. On the Comparative Anatomy of Transformations. Ann. Math. Stat. 1957, 28, 602–632. [Google Scholar] [CrossRef]
- R Core Team. R: A Language and Environment for Statistical Computing; R Foundation for Statistical Computing: Vienna, Austria, 2018. [Google Scholar]
- Stachurska-Swakon, A. Synanthropic communities with Rumex alpinus in the Tatra National Park (Western Carpathians). Scr. Fac. Rerum Nat. Ostrav. 2008, 186, 321–330. [Google Scholar]
- Schmid, R.; Aeschimann, D.; Lauber, K.; Moser, D.M.; Theurillat, J.-P.; Price, M. Flora Alpina: Atlas des 4500 Plantes Vascularies des Alpes. TAXON 2005, 54, 843. [Google Scholar] [CrossRef]
- Giupponi, L.; Pentimalli, D.; Manzo, A.; Panseri, S.; Giorgi, A. Effectiveness of fine root fingerprinting as a tool to identify plants of the Alps: Results of a preliminary study. Plant Biosyst. Int. J. Deal. Asp. Plant Biol. 2017, 152, 464–473. [Google Scholar] [CrossRef]
- Mucina, L.; Grabherr, G.; Ellmauer, T.; Wallnöfer, S. Die Pfanzengesellschaften Österreichs; Gustav Fischer Verlag: Jena, Germany, 1993. [Google Scholar]
- Biondi, E.; Di Blasi, C.; Allegrezza, M.; Anzellotti, I.; Azzella, M.M.; Carli, E.; Casavecchia, S.; Copiz, R.; Del Vico, E.; Facioni, L.; et al. Plant communities of Italy: The Vegetation Prodrome. Plant Biosyst. Int. J. Deal. Asp. Plant Biol. 2014, 148, 728–814. [Google Scholar] [CrossRef] [Green Version]
- Pignatti, E.; Pignatti, S. Plant Life of the Dolomites; Springer Science and Business Media LLC: Berlin/Heidelberg, Germany, 2016. [Google Scholar]
- Scotton, M.; Sicher, L.; Kasal, A. Semi-natural grasslands of the Non Valley (Eastern Italian Alps): Agronomic and environmental value of traditional and new Alpine hay-meadow types. Agric. Ecosyst. Environ. 2014, 197, 243–254. [Google Scholar] [CrossRef]
- Briemble, G.; Ellenberg, H. Zur Mahdverträglichkeit von Grünlandpflanzen. Möglichkeiten der praktischen Anwendung von Zeigerwerten. Nat. Landsch. 1994, 69, 139–147. [Google Scholar]
- Briemble, G.; Nitsche, S.; Nitsche, L. Nutzungswertzahlen für gefässpflanzen des grünlandes. In Biolflor–Eine Datenbank Mit Biologisch-Ökologischen Merkmalen zur Flora von Deutschland; Klotz, S., Kuhn, I., Figa, B., Durka, W., Eds.; Landwirtschaftsverlag: Zurich, Switzerland, 2002; pp. 203–225. [Google Scholar]
- Argenti, G.; Staglianò, N.; Bellini, E.; Messeri, A.; Targetti, S. Environmental and management drivers of alpine grassland vegetation types. Ital. J. Agron. 2020, 15, 156–164. [Google Scholar] [CrossRef]
- Rivas-Martinez, S. Notions on dynamic-catenal phytosociology as a basis of landscape science. Plant Biosyst. Int. J. Deal. Asp. Plant Biol. 2005, 139, 135–144. [Google Scholar] [CrossRef]
- Van Der Maabel, E. Transformation of cover-abundance values in phytosociology and its effects on community similarity. Plant Ecol. 1979, 39, 97–114. [Google Scholar] [CrossRef]
- Van Der Maarel, E. Transformation of cover-abundance values for appropriate numerical treatment—Alternatives to the proposals by Podani. J. Veg. Sci. 2007, 18, 767–770. [Google Scholar] [CrossRef]
- Whittaker, R.H. Evolution and Measurement of Species Diversity. TAXON 1972, 21, 213–251. [Google Scholar] [CrossRef] [Green Version]
- Häupler, H. Evenness Als Ausdruck der Vielfalt in der Vegetation; Cramer: Vaduz, Liechtenstein, 1982. [Google Scholar]
- Ewald, J. A critique for phytosociology. J. Veg. Sci. 2003, 14, 291–296. [Google Scholar] [CrossRef]
- Chytrý, M.; Tichý, L.; Hennekens, S.M.; Knollová, I.; Janssen, J.A.M.; Rodwell, J.S.; Peterka, T.; Marcenò, C.; Landucci, F.; Danihelka, J.; et al. EUNIS Habitat Classification: Expert system, characteristic species combinations and distribution maps of European habitats. Appl. Veg. Sci. 2020, 1–28. [Google Scholar] [CrossRef]
- Rojo, M.P.R.; Font, X.; García-Mijangos, I.; Crespo, G.; Fernández-González, F. An expert system as an applied tool for the conservation of semi-natural grasslands on the Iberian Peninsula. Biodivers. Conserv. 2020, 29, 1977–1992. [Google Scholar] [CrossRef]
- Berauer, B.J.; Wilfahrt, P.A.; Reu, B.; Schuchardt, M.A.; Garcia-Franco, N.; Zistl-Schlingmann, M.; Dannenmann, M.; Kiese, R.; Kühnel, A.; Jentsch, A. Predicting forage quality of species-rich pasture grasslands using vis-NIRS to reveal effects of management intensity and climate change. Agric. Ecosyst. Environ. 2020, 296, 106929. [Google Scholar] [CrossRef]
- Gao, X.; Dong, S.; Li, S.; Xu, Y.; Liu, S.; Zhao, H.; Yeomans, J.; Li, Y.; Shen, H.; Wu, S.; et al. Using the random forest model and validated MODIS with the field spectrometer measurement promote the accuracy of estimating aboveground biomass and coverage of alpine grasslands on the Qinghai-Tibetan Plateau. Ecol. Indic. 2020, 112, 106114. [Google Scholar] [CrossRef]
- Lyu, X.; Li, X.; Dang, D.; Dou, H.; Xuan, X.; Liu, S.; Li, M.; Gong, J. A new method for grassland degradation monitoring by vegetation species composition using hyperspectral remote sensing. Ecol. Indic. 2020, 114, 106310. [Google Scholar] [CrossRef]
- Giorgi, A.; Scheurer, T. Alpine Resources: Assets for a Promising Future—Conclusions from the ForumAlpinum 2014. Mt. Res. Dev. 2015, 35, 414–415. [Google Scholar] [CrossRef]
Figure 2.
Detrended correspondence analysis (DCA) biplot of relevés. Capital letters indicate the five types of vegetation: (A) meadows (number of species: 98); (B) meadows-pastures (number of species: 87); (C) pastures (number of species: 89); (D) shrublands (number of species: 173); (E) forests (number of species: 84). Eigenvalues for the first four axes of DCA are reported in Table S3.

Figure 3.
DCA ordination of relevés overlapped with the MV (mowing tolerance, (a) and N (index of nutrients, (b) contour lines. The points indicate the relevés: A, meadows (number of species: 98); B, meadows-pastures (number of species: 87); C, pastures (number of species: 89); D, shrublands (number of species: 173); E, forests (number of species: 84). Landolt values (T, index of temperature; K, index of continentality; L, index of light intensity; F, soil moisture index; R, index of substrate reaction; N, index of nutrients; H, index of humus; D, aeration index; MV, mowing tolerance) and species (crosses) are plotted. Eigenvalues for the first four axes of DCA are reported in Table S3.
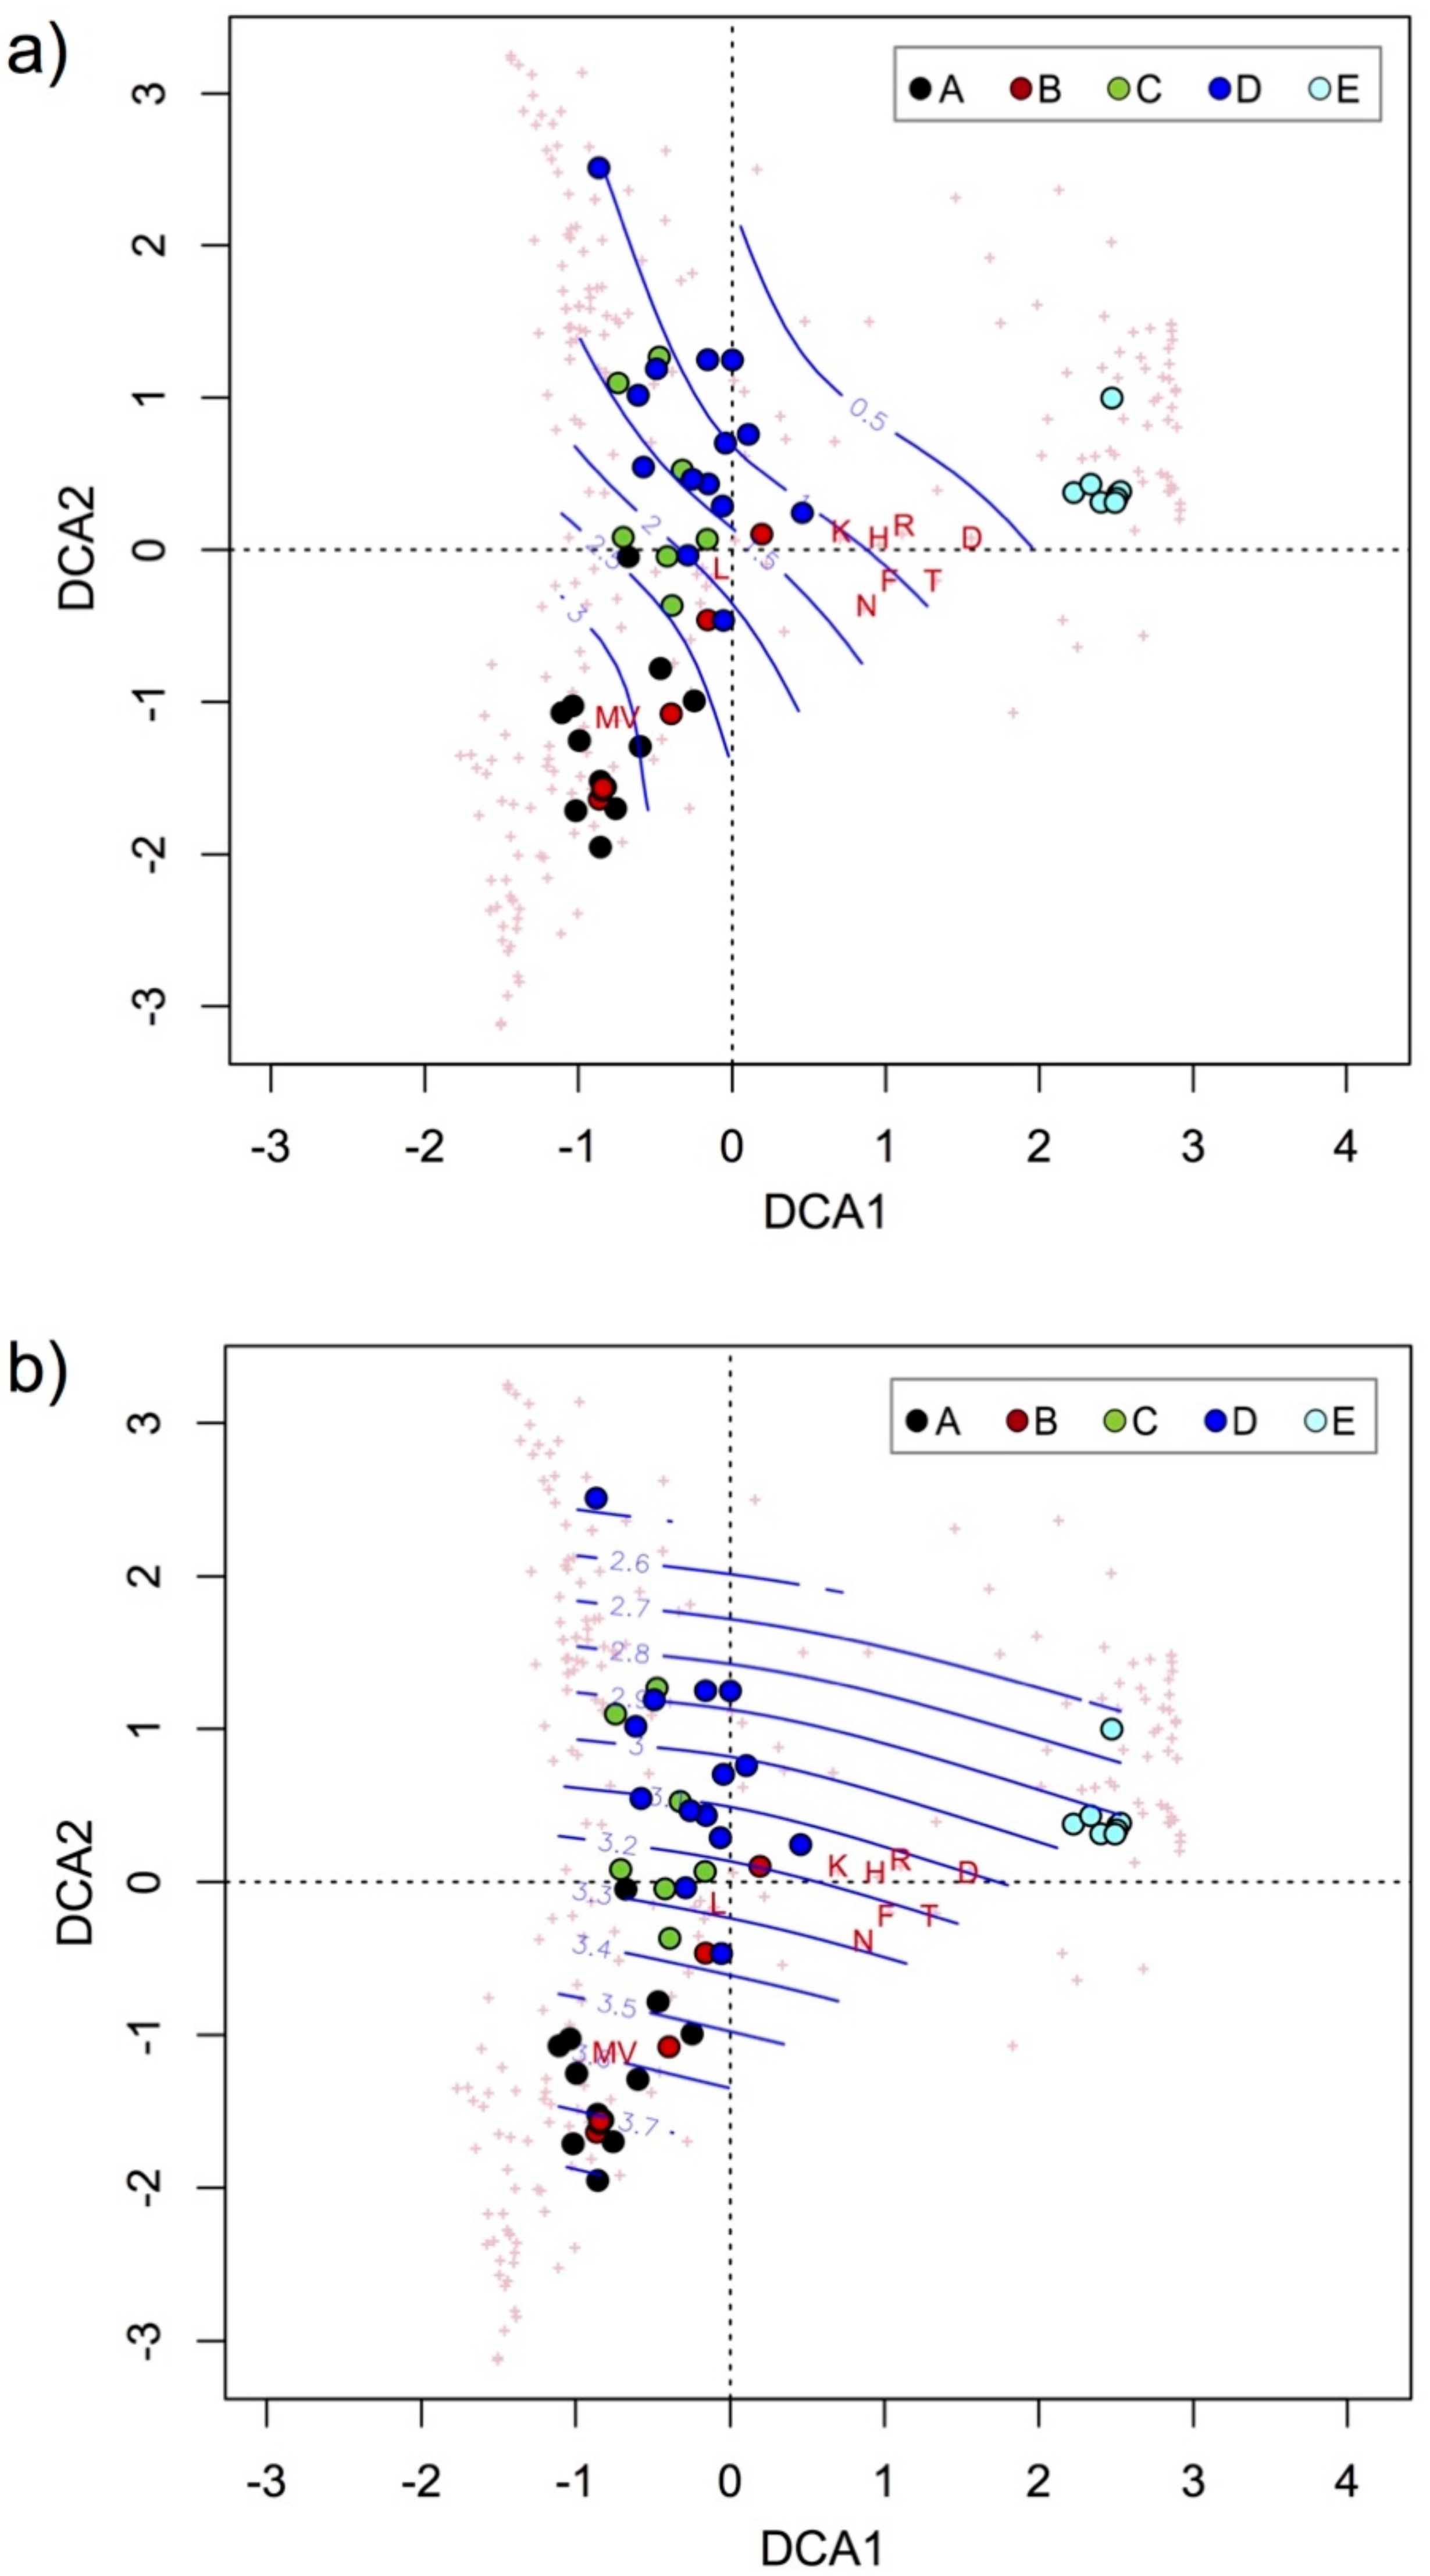
Figure 4.
Boxplots of the distribution of mowing tolerance index (MV) (a) and index of nutrients (N) (b) for each vegetation type (A, meadows; B, meadows-pastures; C, pastures; D, shrublands; E, forests). For each boxplot, mean (red dot) and median (black line) are highlighted. Different letters above the boxes indicate significant differences (p < 0.01) among vegetation types: A, meadows; B, meadows-pastures; C, pastures; D, shrublands; E, forests.

Figure 5.
Scatter plot of MV (mowing tolerance) and N (index of nutrients). The graph shows the relevés performed in Taleggio Valley (dots: A, meadows; B, meadows-pastures; C, pastures; D, shrublands; E, forests), the relevés of Rumicetum alpini [48] and the relevé of overgrazed pasture [18] (Table S1). The grid with the 25 vegetation categories and the respective threshold values are shown.
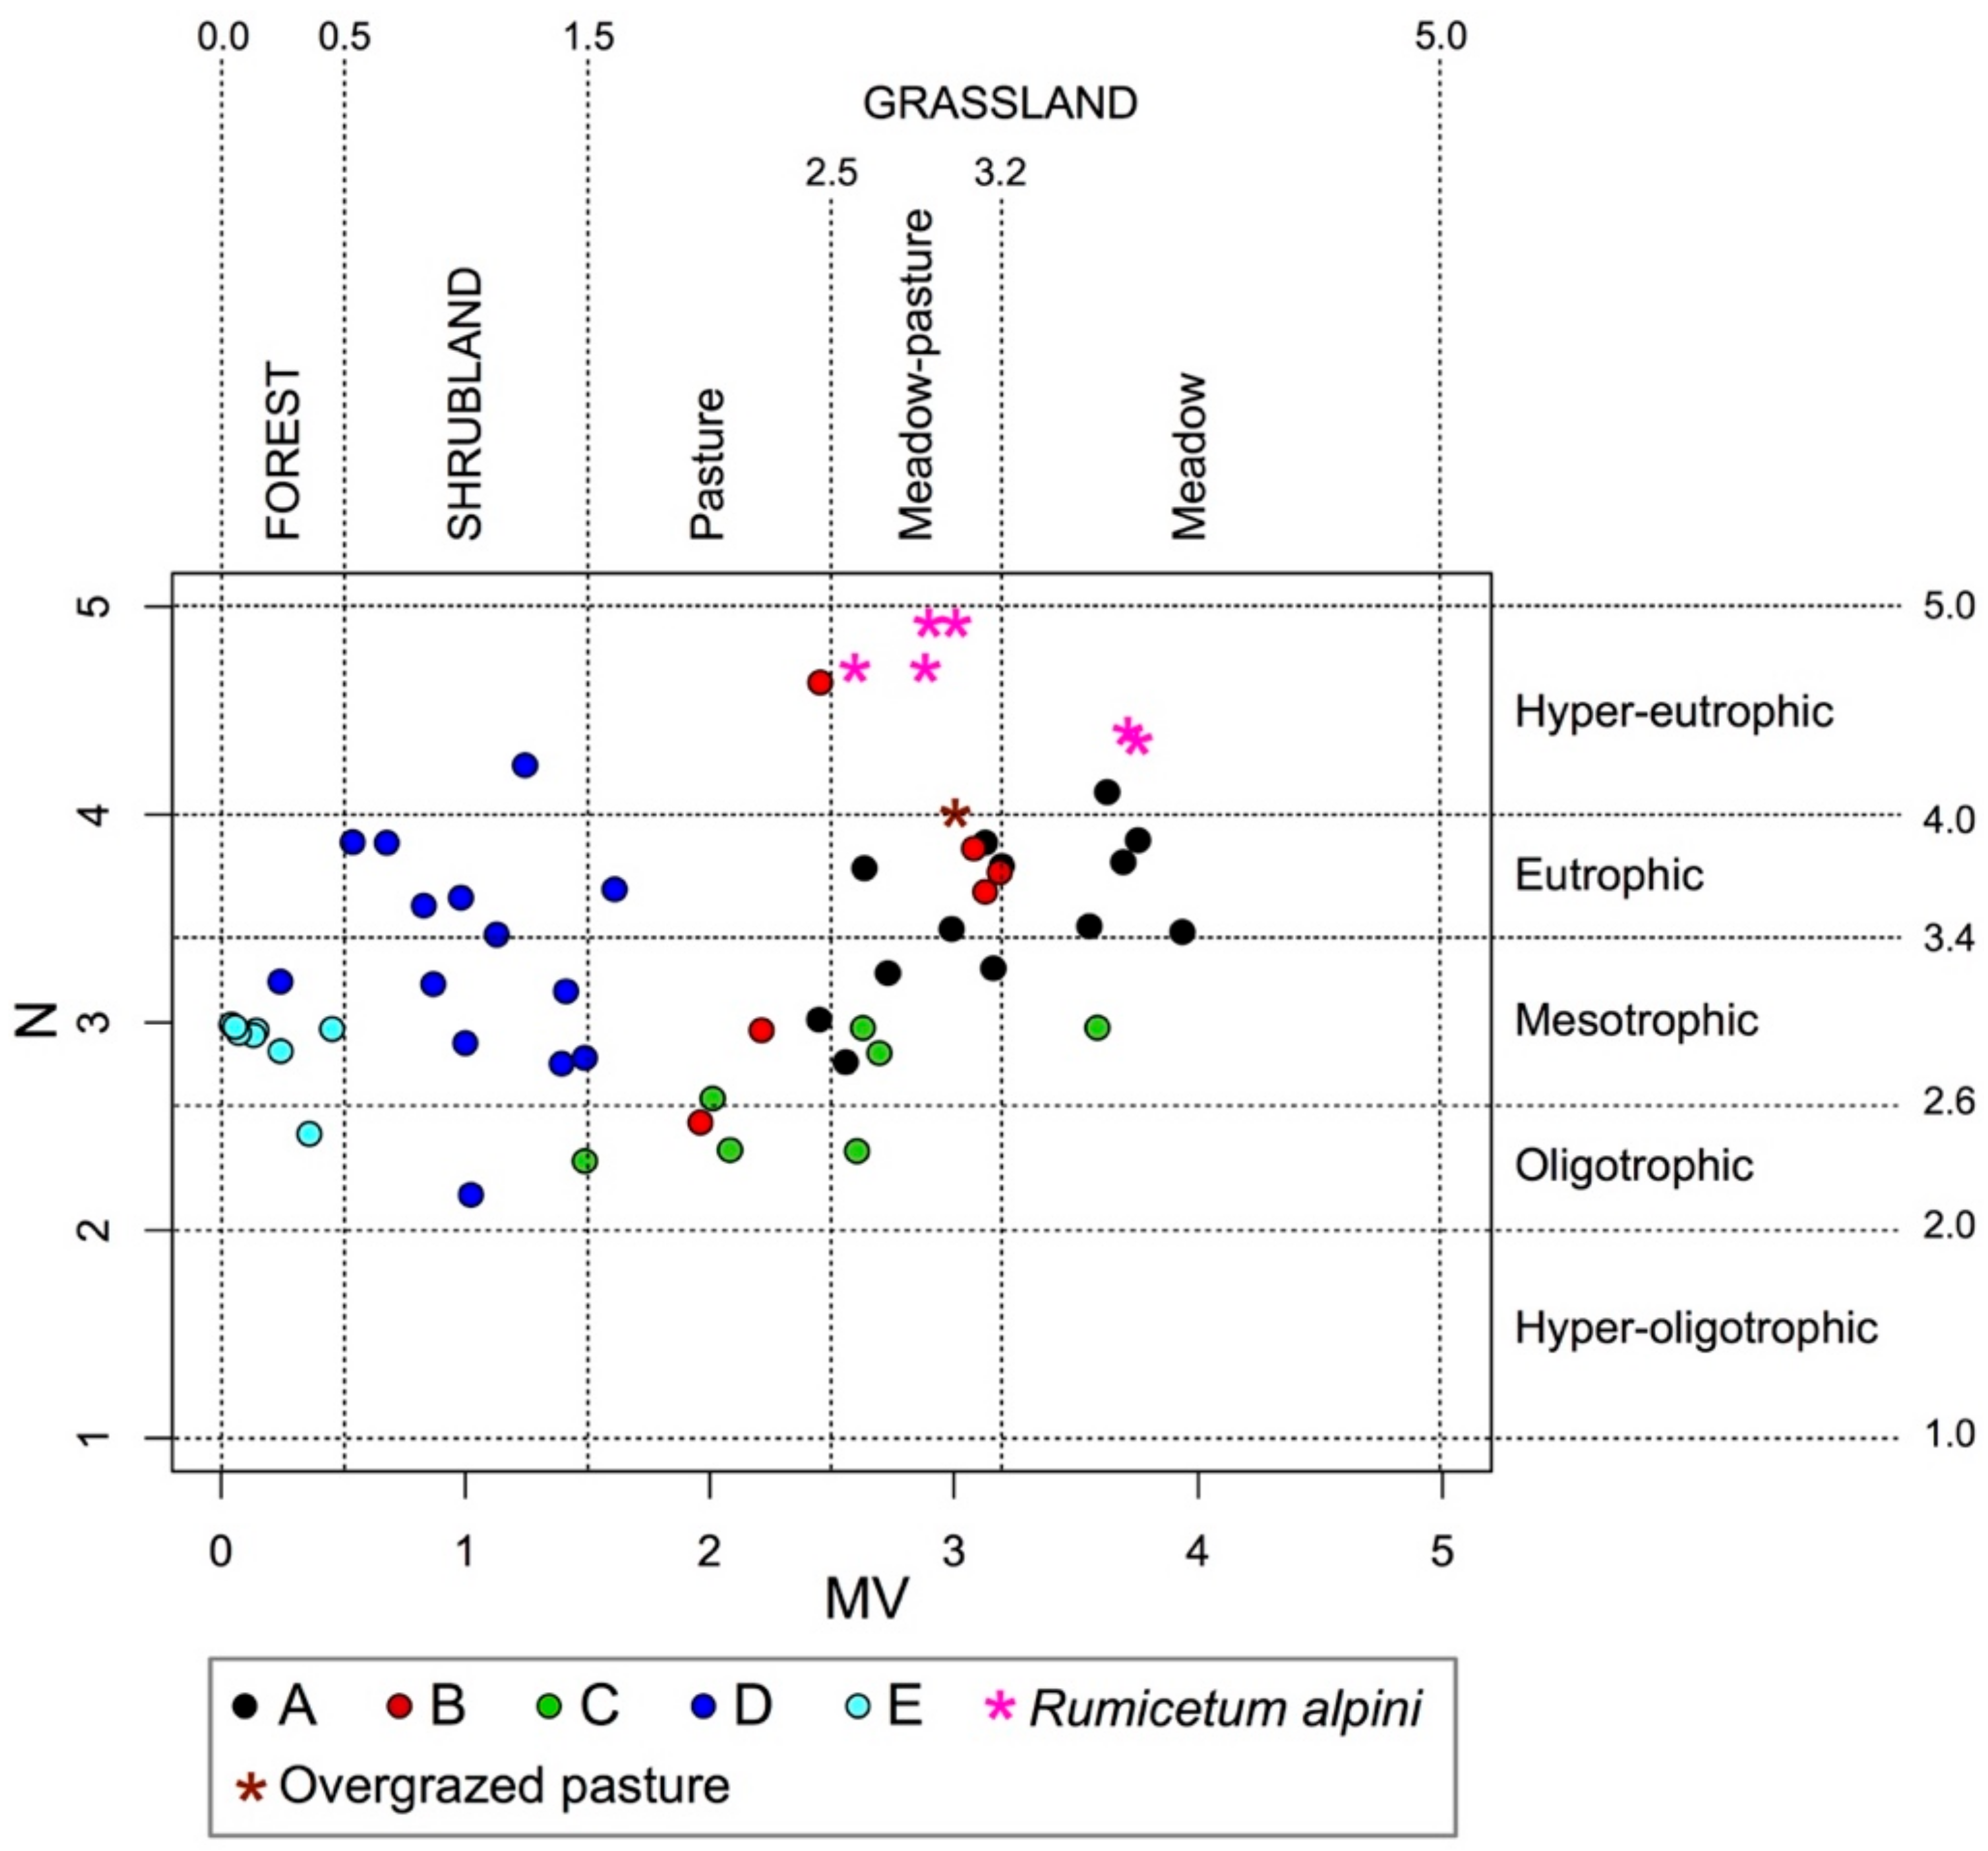
Figure 6.
Input–output interface data of VegeT spreadsheet.

Table 1.
Meaning of the abundance/dominance indexes of Braun-Blanquet [40] and transformation values proposed by [42].
| Abundance/Dominance Indexes of Braun-Blanquet | Plant Coverage | Transformation Values of Abundance/Dominance Indexes |
|---|---|---|
| r | rare species in the relevés | 0.01% |
| + | <1% | 0.50% |
| 1 | 1%–5% | 3.00% |
| 2 | 6%–25% | 15.00% |
| 3 | 26%–50% | 37.50% |
| 4 | 51%–75% | 62.50% |
| 5 | 76%–100% | 87.50% |
Table 2.
One-way ANOVA results of the effect of the vegetation type on ecological indices of Landolt [45]: T, index of temperature; K, index of continentality; L, index of light intensity; F, soil moisture index; R, index of substrate reaction; N, index of nutrients; H, index of humus; D, aeration index; MV, mowing tolerance. Key: *, significant (p < 0.01); ns, not significant.
| Source of Variance | Mean Square | F4,43 | p | |
|---|---|---|---|---|
| T | 0.55 | 14.99 | <0.01 | * |
| K | 0.71 | 7.91 | <0.01 | * |
| L | 7.71 | 54.56 | <0.01 | * |
| F | 0.11 | 1.73 | 0.16 | ns |
| R | 0.03 | 0.23 | 0.91 | ns |
| N | 1.06 | 4.67 | <0.01 | * |
| H | 0.16 | 1.14 | 0.35 | ns |
| D | 1.21 | 8.39 | <0.01 | * |
| MV | 14.63 | 54.01 | <0.01 | * |
Publisher’s Note: MDPI stays neutral with regard to jurisdictional claims in published maps and institutional affiliations. |
© 2020 by the authors. Licensee MDPI, Basel, Switzerland. This article is an open access article distributed under the terms and conditions of the Creative Commons Attribution (CC BY) license (http://creativecommons.org/licenses/by/4.0/).
Share and Cite
MDPI and ACS Style
Giupponi, L.; Leoni, V. VegeT: An Easy Tool to Classify and Facilitate the Management of Seminatural Grasslands and Dynamically Connected Vegetation of the Alps. Land 2020, 9, 473. https://doi.org/10.3390/land9120473
AMA Style
Giupponi L, Leoni V. VegeT: An Easy Tool to Classify and Facilitate the Management of Seminatural Grasslands and Dynamically Connected Vegetation of the Alps. Land. 2020; 9(12):473. https://doi.org/10.3390/land9120473
Chicago/Turabian StyleGiupponi, Luca, and Valeria Leoni. 2020. "VegeT: An Easy Tool to Classify and Facilitate the Management of Seminatural Grasslands and Dynamically Connected Vegetation of the Alps" Land 9, no. 12: 473. https://doi.org/10.3390/land9120473
Note that from the first issue of 2016, this journal uses article numbers instead of page numbers. See further details here.