Article

Planosol CO2 Respiration, Chemical and Physical Properties of Differently Tilled Faba Bean Cultivation

by
Rasa Kimbirauskienė
1,
Kęstutis Romaneckas
1,
Vilma Naujokienė
1,*,
Aušra Sinkevičienė
1,
Egidijus Šarauskis
1,
Sidona Buragienė
1 and
Stanisław Bielski
2
1
Agriculture Academy, Vytautas Magnus University, K. Donelaičio str. 58, 44248 Kaunas, Lithuania
2
Department of Agrotechnology, Agricultural Production Management and Agribusiness, University of Warmia and Mazury in Olsztyn, Oczapowskiego 8, 10–791 Olsztyn, Poland
*
Author to whom correspondence should be addressed.
Land 2020, 9(11), 456; https://doi.org/10.3390/land9110456
Submission received: 6 October 2020 / Revised: 6 November 2020 / Accepted: 13 November 2020 / Published: 17 November 2020
(This article belongs to the Special Issue Soil Tillage Systems and Conservative Agriculture)

Abstract

:
Soil tillage intensity influences the chemical composition of soil, the distribution of nutrients, and soil physical and mechanical properties, as well as gas flows. The impact of reduced tillage on these indices in faba bean cultivation is still insufficient and requires more analysis on a global scale. This study was carried out at Vytautas Magnus University, Agriculture Academy (Lithuania) in 2016–2018. The aim of the investigation was to establish the influence of the tillage systems on the soil chemical composition, temperature, moisture content, and CO2 respiration in faba bean cultivation limited by the semi-humid subarctic climate. On the basis of a long-term tillage experiment, five tillage systems were tested: deep and shallow moldboard plowing, deep cultivation-chiseling, shallow cultivation-disking, and no-tillage. Results showed that in conditions of plowless tillage systems, the content of precrops’ residues on the topsoil before the spring tillage was 5 to 15 times higher than in plowed plots. It undoubtedly was for the amount of available nutrients in the soil, soil temperature, and moisture content. Plowless and no-tillage systems could initiate an increase in the amount of available nutrients in soil. The highest concentration of chemical elements was found in no-tilled plots. So faba bean crops could largely increase the composition of potassium and total nitrogen and stabilized CO2 respiration from soil during one vegetative period.

Graphical Abstract

1. Introduction

An increase in greenhouse gases, such as CO2, activates the global process of climate change. CO2 emissions involve complex interaction between agro-technological factors, soil type and properties, and crops grown. Intensive tillage and unbalanced surplus fertilization instigate higher CO2 emissions into the atmosphere [1,2,3]). First of all, conventional tillage with intensive incorporation of crops’ residues rapidly increases the content of organic matter and changes the soil moisture content, temperature, aeration, and other soil physico-mechanical properties [4,5,6,7,8,9]. Later, aerobic conditions and additional organic matter stimulate microbial activity and activate respiration gases and CO2 losses from the soil [10,11,12].
It has been shown by publications of multiple scientific studies that intensive soil management and tillage initiated higher soil CO2 emissions from soil organic matter (SOM) mineralization compared with plowless tillage and no-tillage [13,14,15,16].
The CO2 emission rates strongly depend on the type of ecosystem and climate conditions, such as soil and air temperatures, soil moisture content, irradiation, and the type of crops [17]. The most valuable among legume crops, e.g., pea, faba bean, soya, and others, Jensen et al. [18] found that faba bean crops disseminated 4–5 times less N2O per vegetative season than alfalfa, soya, fertilized wheat, and maize, and approximately 10 times less than fertilized pasture. In the experiments of [19], faba bean crops biologically fixed from 118.5 to 193.9 kg ha−1 of total nitrogen. Karkanis et al. [20] summarized that faba bean crops reduced the use of mineral N fertilizers, controlled CO2 emissions, improved soil physical properties, and preserved soil fertility. These conclusions are more and more relevant given that the global use of nitrogen, phosphorus, and potassium fertilizers increased by 34%, 40%, and 45%, respectively, between 2002 and 2017 [21].
Even though the effect of plowless sustainable tillage on soil properties and productivity of many crops is well documented by different authors [1,2,3,13,14,15,16], there were only few studies for faba bean, which recently became more important. For example, the global production of faba bean was 4.1 million tons in 2014, increasing approximately 21% since 1994 [22,23]. The EU Greening program requires increasing the biodiversity of farm fields and the percentage of ecologically sensitive areas in Europe. For this reason, farmers started to involve more leguminous crops in crop rotations since 2015. According to [24], faba bean tolerates low temperatures during germination and vegetation much better than most of the other grain legumes. Due to this, the area planted with faba bean has increased about 20 times in Lithuania from 2015 [25].
This research is limited by semi-humid cold climate conditions of northeastern Europe. It is designated to deepen the understanding of the interaction between the factors for future simulation of the climate change in agriculture. The question raised in this experiment is whether both sustainable and no-tillage systems and faba bean cultivation significantly improve the chemical composition of soil and stabilize the CO2 respiration from the soil. The aim of this study was to establish the influence of five tillage systems on the chemical composition, temperature, moisture content, and soil respiration during faba bean vegetation.

2. Materials and Methods

2.1. Site Description

A long-term stationary field experiment has been performed at the Experimental Station (54°52′ N, 23°49′ E) of Aleksandras Stulginskis University (since 2019, Vytautas Magnus University, Agriculture Academy), Lithuania, since 1988. This study analyzed the data of 2016–2018. The soil at the experimental site is a silty loam (45.6% sand, 41.7% silt, 12.7% clay) Planosol (Endohypogleyic-Eutric – Ple-gln-w), approximately neutral. Based on the amount of precipitation, this territory of Lithuania is in the zone of surplus moisture with an average annual precipitation of 600–650 mm and evaporation of about 500 mm. The vegetative period lasts about 150–180 days.
The meteorological conditions during faba bean vegetation are presented in Table 1.
Overall, in the spring of 2016 the humidity and temperature were often insufficient, while the weather in summer was characterized by lower temperatures and excess humidity. In 2017, during faba bean vegetation, the average daily air temperature was below the long-term average, except for September when it was 0.8 °C higher than usual. Precipitation was distributed very unevenly and, in most cases, it was in surplus or very often rained often but not exceptionally high.
In 2018, it was warmer and drier than the long-term average. According to [26], in Europe drought and heat are the main factors that can limit the productivity of faba bean and the content of seed production.

2.2. Experimental Design and Agricultural Practice

Crop rotation in the experiment was: winter, oilseed rape, winter wheat, faba bean; spring, barley. The experiment was performed with four replications for each tillage treatment, and a randomized complete block design (RCBD) was used (experiment location map presented in [27]. There was a total of 20 plots with the size of the plot being 14 × 9 m. Five primary tillage methods were applied in autumn: deep (22–25 cm) and shallow (12–15 cm) moldboard plowing (DP and SP), deep (25–30 cm) cultivation-chiselling (DC), shallow (10–12 cm) cultivation-disking (SC), and no-tillage (NT). After forecrop (winter wheat) harvesting, all experimental plots (except NT) were tilled with a Väderstad Carrier 300 disks harrow (Väderstad AB, Väderstad, Sweden). The John Deere 6620 tractor (Deere and Company, USA) was used. The primary tillage was performed between September and October. Soil was plowed with the moldboard plow Gamega PP-3-43 (Gamega Ltd., Garliava, Lithuania) with semi-screw shell boards. Chiseling was performed with the KRG-3.6 (Gamega Ltd., Garliava, Lithuania) ridge cultivator. SC plots were additionally disked with a Väderstad Carrier 300 disk harrow. In spring, before sowing, the soil was tilled with a Laumetris KLG-3.6 cultivator (Laumetris Ltd., Keleriškės village, Kėdainiai., Lithuania) (except NT). Faba bean was sown with Väderstad Rapid 300C Super XL sowing machine and fertilized locally (complex fertilizer 7:16:32, 300 kg ha-1) at the same time. Faba bean cultivation, additionally, was not fertilized. Pesticides were spread with spreader Amazone UF-901 [28,29]. Faba bean was sown at a rate of approximately 200–220 kg of grain per ha (40–45 seeds per m2). Sowing depth was 5–6 cm and distance between the rows was 25 cm. The faba bean variety “Fuego” was sown (Norddeutsche Pflanzenzucht Hans–Georg Lembke KG, Germany). The seeds were inoculated with a Rhizobium leguminosarum bacterial preparation (approximately 200 mL of preparation per 100 kg seeds). Pests (aphids) and diseases (Botrytis cinerea, B. fabae) were chemically controlled at the beginning of crop flowering and weeds, just after sowing. The agricultural technique of bean cultivations is also well described by [24].

2.3. Methods and Analysis

The projection coverage of the forecrop (winter wheat) residues was determined after the presowing tillage and sowing (5 May 2016, 15 May 2017, 4 May 2018). The 10-m length metal strip was used for measuring. The points of contact with plant residues (no less than 20-mm length) were set every 10 cm (100 times per plot) and expressed as percentage. Measurements were performed in two places of each plot. So, residue coverage was tested in 200 spots per plot or in 4000 spots per experiment.
The granulometric (texture) and chemical soil composition was determined by sampling it with an agrochemical auger at least in 15 randomized spots per each experimental plot (at least 300 samples per experiment). Sampling was done twice, before sowing and after harvesting. The sampling depth was 0–15 and 15–25 cm. A composite sample determining the levels of the main available macronutrients (N, P, K, and Mg) and soil pH based on laboratory analyses was prepared. Methods of analyses: pHkCl, ISO 10390 (potentiometric); P2O5, K2O, A-L method (P, spectrometric; K, atomic emission spectrometric); magnesium (Mg), LVP D–13: 2016, Issue 2; Ntotal, ISO 11261 (Kjeldahl). Samples were analyzed at the certificated laboratories of Lithuanian Research Centre for Agriculture and Forestry. Soil granulometric composition (texture) was determined by the method of laser diffraction with “Mastersizer 2000 Hydro 2000 MU” laser diffraction system in the laboratory of Vytautas Magnus University, Agriculture Academy.
The CO2 emission flux (e-flux) and CO2 concentration above the soil surface were tested by closed-chamber method. A portable infrared CO2 analyzer LiCor-6400 (ADC BioScientific Ltd., UK) attached to a data logger by the IRGA (infrared gas analyzer) method was used. A portable soil respirator system LI-8100A with camera 8100-103 was used. Soil surface moisture content was determined at the same time with CO2 respiration by device accessory 8100-204 and soil temperature, by 8100-203. The measurements were conducted between 9 a.m. and 2 p.m. For these measurements, no less than four 20-cm-diameter and 20-cm-height rings were hammered to the soil after the sowing of faba bean. Measurements (four replications per each ring) were made three times during faba bean vegetation: at the beginning (BBCH 25–30), in the middle (BBCH 60–65), and at the end of faba bean vegetation (BBCH 83–86).

Statistical Analysis

One-way analysis of variance (ANOVA) was used to assess the statistical significance of the results. Dispersion analysis was performed on the LSD test for mathematical statistics. It was identified as the significant difference margin of LSD05 and LSD01 at a probability level of 95% and 99%. The meanings of the columns marked with the same sign, such as an asterisk, are not statistically significant differences, with a confidence level 95% or 99%. Significantly different averages of the data were marked * at P ≤ 0.05 from the control (deep plowing, DP) within columns marked ** at P ≤ 0.01. The same marking was used for significance of correlation coefficients. A correlation analysis was performed with SigmaStat software. The analysis matrix included data of soil stability for water (at the depths of 0–15 and 15–25 cm), the content of precrop residues, soil chemical composition (at the depths of 0–15 and 15–25 cm), the soil temperature, moisture content (0–10 cm soil layer), CO2 e-flux, and its aboveground concentration.

3. Results and Discussion

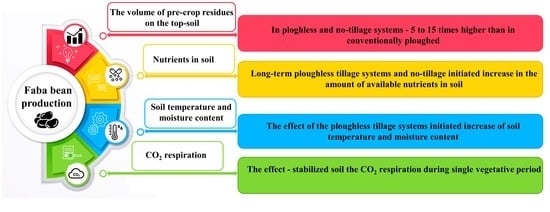
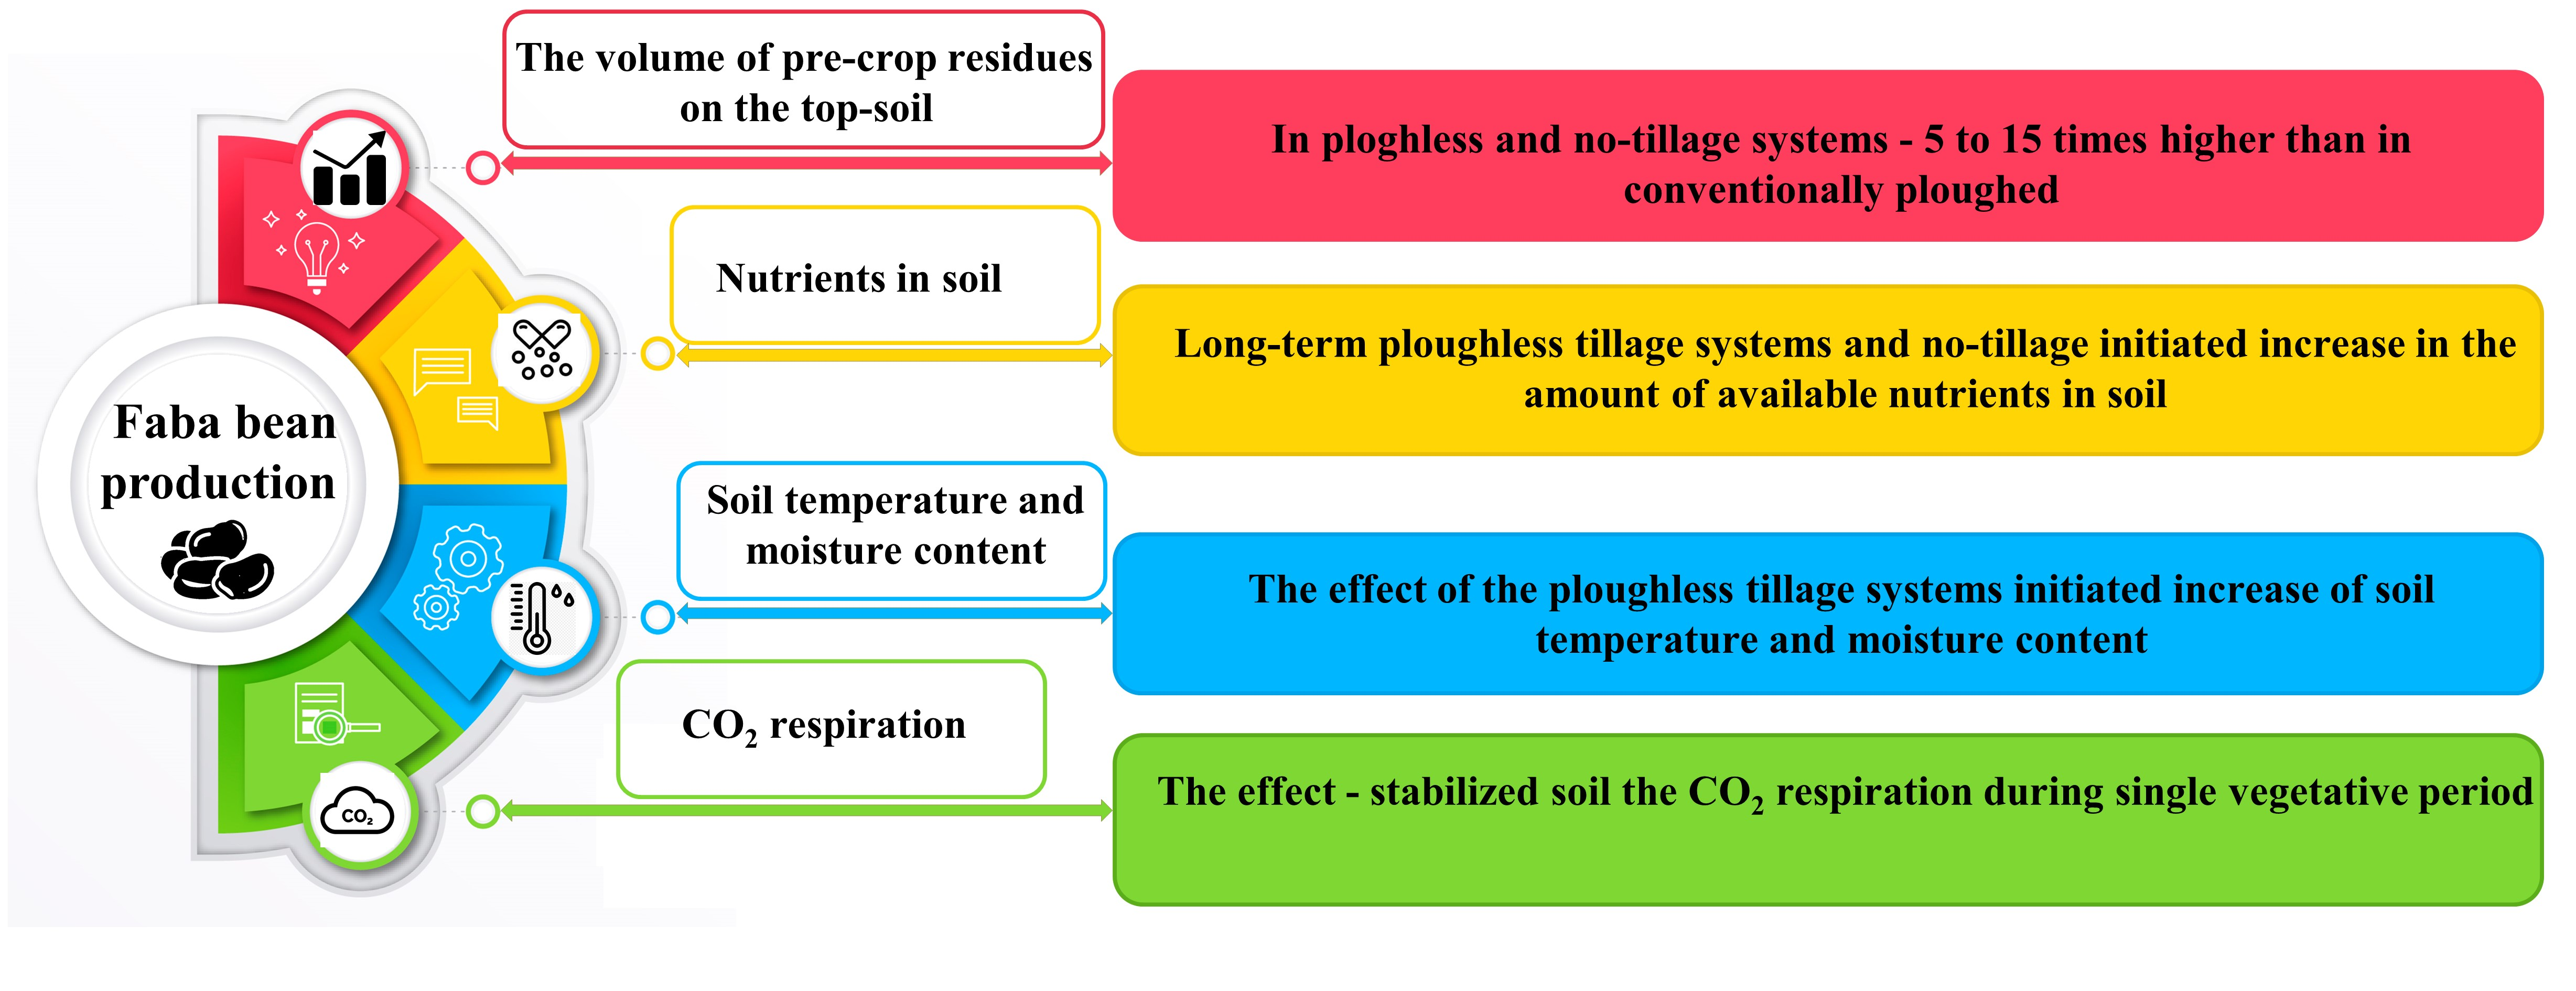
3.1. Topsoil Coverage by Precrop Residues

The quantity of crop residue remaining on the soil surface under each tillage technology is crucial, as it affects the quality of tillage and sowing, soil characteristics, the state of weed and disease and, finally, the productivity and quality of crops [11,12]. For example, we found a strong correlation between soil stability in water (at the depths of 0–15 and 15–25 cm) and the content of precrop residues (r = 0.897 and 0.906 at P ≤ 0.05) [26]. In this experiment the smallest amount of crop residues, both before and after the spring sowing, was found in plowed plots (Table 2).
In deeply and shallowly cultivated plots, the amount of plant residues on the topsoil was similar and decreased approximately twice during the tillage and sowing operations. On average, in no-tilled plots, the composition of stubble was higher than 50 percent. Differences of topsoil coverage depended on precrop growth, development, and harvesting conditions during vegetations. For example, if precrop winter wheat was laid down by wind or rain at the time of harvest, the combine shredded the straw poorly and their projection coverage was lower. Another reason is sparse precrop cultivation, especially in not-tilled plots.

3.2. Soil Chemical Composition

In 2016, before the tillage and faba bean sowing in spring, the soil pH of the soil was similar in all plots. The soil pH ranged from 6.7 to 7.4 at the depth of 0–15 cm and from 7.3 to 7.5 at the depth of 15–25 cm (Table 3 and Table 4). In [9] global meta-analysis, no-tillage reduced the soil pH on average by 2.8% compared to conventional tillage.
The content of available phosphorus was higher in the soil surface (0–15 cm) than in the deeper layer (15–25 cm), except for the plowed plots. In our earlier experiments we found a similar differentiation into an upper layer with higher concentrations of P and K and a bottom layer with lower concentrations of P and K. In the present experiment with faba bean, at the depth of 0–15 cm, most of the phosphorus was found in shallowly cultivated (disked) plots of soil but the differences were insignificant. At the depth of 15–25 cm, most of the phosphorus was found in plowed plots with no significant differences. Similar trends were observed when studying the availability of potassium, but the differences varied significantly. In the 0–15 cm soil layer, most of the available potassium was found in shallowly cultivated plots, while in the 15–25 cm layer it was found in plowed plots. The differences between the treatments were significant. More magnesium was also found in shallowly and deeply cultivated plots in the 0–15 cm soil layer but the differences were insignificant. Like for other macronutrients, higher content of magnesium was found in deeply and shallowly plowed plots at the depth of 15–25 cm. Before the experiment of growing the faba beans the content of soil nitrogen was not high. Essentially, most nitrogen was found in the 0–15 cm soil layer in no-tilled soil and in the 15–25 cm layer in deeply and shallowly plowed plots.
After the harvesting of faba bean, a tendency of soil alkalinity was observed at the depth of 0–15 cm, while at the depth of 15–25 cm the soil pH remained almost unchanged (Table 3 and Table 4). During the bean vegetation, available phosphorus increased at the depth of 0–15 cm in plowed and no-tilled plots, while in deeply cultivated plots it decreased. No significant differences were found between the treatments. The opposite tendencies were observed at the depth of 15–25 cm. Similar trends were observed for available potassium and magnesium, but the levels of available potassium remained almost unchanged at the depth of 15–25 cm in unplowed plots (treatments 3–5). Annual changes in total nitrogen during the faba bean vegetation were insignificant. In their experiment [30] showed that in a two-year period while faba bean was used in crop rotation, the total nitrogen in soil increased 1.3 times compared to the free rotation of faba bean.
In 2017, prior to spring tillage, the soil pH did not significantly differ. At the depth of 0–15 cm, the soil pH ranged from 7.1 to 7.4 and at the depth of 15–25 cm it ranged from 7.4 to 7.5 (Table 5 and Table 6). The amount of available phosphorus was higher in the surface (0–15 cm) than in the deeper layer. Most of phosphorus in the soil was found at the depth of 0– 15 cm in no-tilled and shallowly cultivated plots but there were no significant differences. At the depth of 15–25 cm, essentially most of the phosphorus was found in deeply and shallowly plowed plots. Similar trends were observed regarding available potassium. In the 0–15 cm soil layer, more magnesium was found in shallowly cultivated and no-tilled plots, but the differences were not significant. Unlike other macronutrients, magnesium at the depths of 15–25 cm was found in deeply cultivated and no-tilled plots. The soil nitrogen content was not high. In the 0–15 cm soil layer it varied from 0.120% to 0.149%. Deeply plowed plots contained the smallest content of nitrogen or significantly less than in the other plots of the experiment. In the 15–25 cm soil layer differences in soil nitrogen content were insignificant but most of the nitrogen (0.164%) was found in shallowly plowed soil.
It was found a strong correlation between soil chemical composition and the amount of plant residues. A positive strong correlation was found between the content of crop residues after sowing and the content of phosphorus, potassium, and magnesium in soil in the 0–15 cm soil layer (r = 0.882*, 0.852, 0.813).
Even though the pH of the 0–15 cm soil layer did not change significantly after harvesting, decreasing tendencies were observed (Table 3 and Table 4). The amount of available phosphorus decreased in most cases, except for deeply plowed plots. The content of available potassium increased during the faba bean vegetation in all the plots, especially in shallowly cultivated and no-tilled plots. The contents of magnesium varied, and the amounts of nitrogen increased significantly in cultivated plots compared to control.
At the depth of 15–25 cm the soil pH slightly decreased while the levels of phosphorus and potassium varied between the treatments. In deeply and shallowly cultivated plots, the amount of phosphorus and potassium increased in the soil during vegetation. The content of magnesium in the soil at the depth of 15–25 cm decreased in all the plots, although an increase in its content was observed in the 0–15 cm layer. Except for the control plots, the decrease in nitrogen was mostly insignificant.
The trends observed in 2018 were similar as in previous experimental years. However, at the depth of 0–15 cm, soil pH values were significantly different in no-tilled plots both at the beginning and at the end of vegetation. The amount of available potassium in no-tilled plots was essentially the highest and reached the average contents for this criterion (Table 3 and Table 4). The amount of magnesium in the soil increased mostly but not significantly during vegetation. The results of nitrogen testing were similar to those of 2016 and 2017, but more pronounced. Any of the tillage alternatives studied yielded significant amounts of nitrogen compared to control. The highest amounts of nitrogen were found in no-tilled plots.
At the depth of 15–25 cm, the elemental composition of soil tended to deteriorate during the vegetation period, with rare exceptions. Nitrogen increased only in plowed plots. In general, there was less nitrogen in the 15–25 cm layer than in the topsoil one.
Positive strong and moderate correlations were found between the content of precrop residues on topsoil and the contents of potassium and nitrogen in the 0–15 cm layer (r = 0.702, 0.535 at P ≥ 0.05). Similarly, refs. [30,31] concluded that the residue return increased the concentration and the stock of N in the soil. Other scientists established that addition of bacteria and/or melatonin significantly increased growth parameters and yield components, and that bacteria inoculation and melatonin application enhanced N, P, and K concentrations, the proline content, RWC%, and the K+/Na+ ratio when Na+ and Cl concentrations were decreased significantly in salt-stressed faba beans.

3.3. Soil Temperature and Moisture Content

Soil moisture content and temperature have a strong influence on gas emissions from soil [25]. The temperature of soil surface usually depends on the ambient temperature, but in spring the soil covered with more plant residues is warming up more slowly. In our experiment, in 2016, no-tilled soil warmed up more slowly and was significantly cooler than the tilled one (Table 5). Measurements in the middle and at the end of vegetation did not reveal any significant differences between the treatments.
In 2017, the differences between the surface temperatures of differently tilled soil were mostly insignificant but the temperature of deeply plowed soil was the highest. In 2018, the measurements revealed significantly lower soil temperature (4.2% to 5.6%) in shallowly cultivated and no-tilled plots. The highest soil temperatures were found in deeply plowed plots both at the beginning and in the middle of faba bean vegetation. During the whole vegetation period the lowest soil temperature was found in the no-tilled soil. In our experiment the temperature of soil surface (0–10 cm) layer at the beginning of vegetation was highly correlated with moisture content (r = –0.912 at P ≤ 0.05).
The moisture content in the topsoil layer is mostly dependent on the amount of precipitation, while in the deeper layer, on the rate of precipitation and capillary rising moisture from the groundwater. In our experiment, in the 0–15 cm topsoil layer in no-tilled plots, we found significantly higher (from 24% to 33%) moisture content compared to deeply plowed plots (data are not presented). These findings are similar to the results of our earlier investigations. At the time of the measurements of soil temperature, the CO2 e-flux, and concentration in 2016, the soil moisture did not significantly differ between the tillage systems (Table 5). Moisture content was highest at the end of vegetation because approximately 1.3 % usual precipitation rate fell in August. In 2017, as in 2016, there was no significant difference in the soil moisture content between the tillage systems. It was highest in July, with the precipitation rate about 20 mm above the norm. In 2018, at the beginning and in the middle of faba bean vegetation, all the reduced tillage systems tended to increase the soil moisture content (from 0.1% to 0.6%) compared to deep plowing. At the end of vegetation, the soil moisture content was similar and did not differ significantly. Higher differences between the soil moisture content in differently tilled soils were observed in the period between the sowing and germination of faba bean. Similarly, Li et al. [9] found that conservation tillage systems increased available water capacity in the soil.

3.4. Soil CO2 e-Flux and Concentration

In our experiment, in 2016, CO2 emission flux (e-flux) varied during the faba bean vegetation. It was the lowest at the beginning of vegetation and increased afterwards (Table 6). While the most active gas flow in plowed and shallowly cultivated soil was found in the middle of faba bean vegetation, the e-flux from deeply cultivated and no-tilled soil intensified at the end of vegetation. No significant differences between the tillage systems were found. [32] found that a sudden increase in the CO2 emission from the soil was caused by the destruction of soil structure during the tillage. It lasted approximately three hours after the tillage and the emission of the CO2 was compositional to the level of tillage intensity. The highest CO2 respiration was found in the deeply plowed soil. The CO2 emissions from no-tilled soil were consistently lower throughout the experiment. Conversely, [2] tested the CO2 emissions from the soil for 330 days after applying conventional tillage and no-tillage technologies and found no difference in the CO2 emissions for 41% of days. The CO2 emissions from conventionally tilled soil were higher for 6% of days and from no-tilled soil, for 53% of days. In our experiment, the measurement of the CO2 concentration above the soil surface showed that it was quite stable during the faba bean vegetation and did not differ significantly between the tillage treatments (Table 6). The reason for this is that July and August were cold and excessively humid. However, in general faba bean reduces the CO2 emissions [19].
In 2017, at the beginning and at the end of the faba bean vegetation, the e-flux of CO2 was the lowest, but it was higher in the middle of vegetation due to higher ambient temperatures. A similar situation was described by [3]. In our experiment, there were no significant differences between the treatments (except for exclusive cases). The CO2 concentration above the soil surface during the faba bean vegetation was relatively constant and there was little difference between the measurements. In the first half of vegetation, the concentration of CO2 above shallowly cultivated and no-tilled soil plots was generally significantly higher than above deeply plowed plots. This was not the case at the end of vegetation (Table 6). Correlation analysis showed that the concentration of CO2 at the beginning of vegetation make significantly effect for the density of the faba bean crop (r = 0.906 at P ≤ 0.05) and during the second half of the vegetation, on the content of precrop residues on topsoil in spring (r = 0.804 and –0.876 at P ≥ 0.05).
In 2018, during the vegetation period the CO2 emission from the soil varied depending on meteorological conditions and agricultural activity. The highest CO2 emission from the soil was found at the end of vegetation when the air temperature increased (Table 6). Higher temperatures promote the growth of microorganisms and increase enzymatic activity, organic matter decomposition, and plant root respiration [33,34]. In our experiment, at the beginning of faba bean vegetation, a very low CO2 emission was found in almost all the tillage systems. Similar trends were observed when determining the CO2 concentration from the soil surface by using shallow plowing and deep cultivation methods compared to conventional tillage. In other tillage systems, the distribution of CO2 was uneven throughout the vegetation period. Correlation analysis showed that CO2 e-flux in the middle of vegetation was for the temperature of soil surface (r = 0.792 at P ≥ 0.05), moisture content (r = 0.841 at P ≥ 0.05), and PAR (photosynthetic active radiation) conditions above the soil surface (r = 0.743 at P ≥ 0.05). At the end of vegetation period, CO2 e-flux was dependent on the topsoil temperature (r = 0.659 at P ≥ 0.05). Mikša et al. [35] found that the CO2 e-flux in agroecosystems (maize and oilseed rape) changed during the vegetation (June–August) and is correlated with temperature (r = 0.8) and soil moisture content (r = 0.6) as in our experiment.

4. Conclusions

The highest concentration of potassium and total nitrogen in the soil was determined in nonreversibly tilled plots, especially in no-tilled soil, so faba bean crop enriched the soil with these elements through vegetation. The strongest influence was observed in 2018. The precrop residues on the topsoil prevented rapid evaporation of moisture. Consequently, higher moisture content was found in the topsoil layer of minimally or no-tilled plots compared with the deeply plowed soil. At the beginning of faba bean vegetation, more humid no-tilled plots warmed up slightly more slowly than the cultivated ones because the temperature of the topsoil was negatively related with the moisture content (r = –0.912; P ≤ 0.01). The CO2 e-flux and its aboveground concentration in the faba bean cultivation were generally not significantly affected by different tillage systems. These indicators were more dependent on meteorological conditions such as temperature and rainfall (r = 0.792 and 0.841; P ≤ 0.01). In general, plowless tillage and no-tillage systems increased the amount of available nutrients (N, P, K, and M) in the soil. Faba bean crop largely increased the composition of potassium and total nitrogen and stabilized the soil CO2 respiration during a single vegetative period.

Author Contributions

Conceptualization, R.K., K.R., V.N., A.S., E.Š., S.B. (Sidona Buragienė) and S.B. (Stanisław Bielski); Methodology, K.R.; Software, R.K.; Formal Analysis, K.R.; Investigation, A.S. and S.B. (Sidona Buragienė); Data Curation, R.K.; Writing—Original Draft Preparation, E.Š., S.B. (Stanisław Bielski); Writing—Review & Editing, V.N.; Visualization, V.N. All authors have read and agreed to the published version of the manuscript.

Funding

This research received no external funding.

Acknowledgments

Investigations were supported by a grant (No. MT-16-8) from the Ministry of Agriculture of the Republic of Lithuania.

Conflicts of Interest

The authors declare no conflict of interest.

References

  1. Jarecki, M.K.; Lal, R. Compost and mulch effects on gaseous flux from an alfisol in Ohio. Soil Sci. 2006, 171, 249–260. [Google Scholar] [CrossRef]
  2. Oorts, K.; Merckx, R.; Gréhan, E.; Labreuche, J.; Nicolardot, B. Determinants of annual fluxes of CO2 and N2O in long-term no-tillage and conventional tillage systems in northern France. Soil Tillage Res. 2007, 95, 133–148. [Google Scholar] [CrossRef]
  3. Bilandzija, D.; Zgorelec, Z.; Kisic, I. Influence of Tillage Practices and Crop Type on Soil CO2 Emissions. Sustainability 2016, 8, 90. [Google Scholar] [CrossRef] [Green Version]
  4. Aikins, S.; Afuakwa, J. Effect of four different tillage practices on soil physical properties under cowpea. Agric. Biol. J. N. Am. 2012, 3, 17–24. [Google Scholar] [CrossRef]
  5. Celik, I.; Turgut, M.M.; Acir, N. Crop rotation and tillage effects on selected soil physical properties of a Typic Haploxerert in an irrigated semi-arid Mediterranean region. Int. J. Plant Prod. 2012, 6, 457–480. [Google Scholar]
  6. Kumar, A.; Chen, Y.; Sadek, A.; Rahman, S. Soil cone index in relation to soil texture, moisture content, and bulk density for no-tillage and conventional tillage. Agric. Eng. Int. CIGR J. 2012, 14, 26–37. [Google Scholar]
  7. Krol, A.; Lipiec, J.; Turski, M.; Kus, J. Effects of organic and conventional management on physical properties of soil aggregates. Int. Agrophys. 2013, 27, 15–21. [Google Scholar] [CrossRef]
  8. Lenka, N.K.; Lal, R. Soil aggregation and greenhouse gas flux after 15 years of wheat straw and fertilizer management in a no-till system. Soil Tillage Res. 2013, 126, 78–89. [Google Scholar] [CrossRef]
  9. Li, Y.; Li, Z.; Cui, S.; Jagadamma, S.; Zhang, Q. Residue retention and minimum tillage improve physical environment of the soil in croplands: A global meta-analysis. Soil Tillage Res. 2019, 194, 104292. [Google Scholar] [CrossRef]
  10. La Scala, N., Jr.; Lopes, Â.; Spokas, K.A.; Bolonhezi, D.; Archer, D.W.; Reicosky, D. Short-term temporal changes of soil carbon losses after tillage described by a first-order decay model. Soil Tillage Res. 2008, 99, 108–118. [Google Scholar] [CrossRef]
  11. Soares, D.D.S.; Ramos, M.L.G.; Marchao, R.L.; Maciel, G.A.; De Oliveira, A.D.; Malaquias, J.V.; De Carvalho, A.M. How diversity of crop residues in long-term no-tillage systems affect chemical and microbiological soil properties. Soil Tillage Res. 2019, 194, 104316. [Google Scholar] [CrossRef]
  12. Melman, D.A.; Kelly, C.; Schneekloth, J.; Calderón, F.; Fonte, S.J. Tillage and residue management drive rapid changes in soil macrofauna communities and soil properties in a semiarid cropping system of Eastern Colorado. Appl. Soil Ecol. 2019, 143, 98–106. [Google Scholar] [CrossRef]
  13. Ussiri, D.A.; Lal, R. Long-term tillage effects on soil carbon storage and carbon dioxide emissions in continuous corn cropping system from an alfisol in Ohio. Soil Tillage Res. 2009, 104, 39–47. [Google Scholar] [CrossRef]
  14. Regina, K.; Alakukku, L. Greenhouse gas fluxes in varying soils types under conventional and no-tillage practices. Soil Tillage Res. 2010, 109, 144–152. [Google Scholar] [CrossRef]
  15. Abdalla, M.; Hastings, A.; Helmy, M.; Prescher, A.; Osborne, B.; Lanigan, G.; Forristal, D.; Killi, D.; Maratha, P.; Williams, M.L.; et al. Assessing the combined use of reduced tillage and cover crops for mitigating greenhouse gas emissions from arable ecosystem. Geoderma 2014, 223–225, 9–20. [Google Scholar] [CrossRef]
  16. Taft, H.E.; Cross, P.A.; Edwards-Jones, G.; Moorhouse, E.R.; Jones, D.L. Greenhouse gas emissions from intensively managed peat soils in an arable production system. Agric. Ecosyst. Environ. 2017, 237, 162–172. [Google Scholar] [CrossRef] [Green Version]
  17. Maire, V.; Alvarez, G.; Colombet, J.; Comby, A.; Despinasse, R.; Dubreucq, E.; Joly, M.; Lehours, A.; Perrier, V.; Shahzad, T.; et al. An unknown oxidative metabolism substantially contributes to soil CO2 emissions. Biogeosciences 2013, 10, 1155–1167. [Google Scholar] [CrossRef] [Green Version]
  18. Jensen, E.S.; Peoples, M.B.; Boddey, R.M.; Gresshoff, P.M. Hauggaard-Nielsen, H.; Alves, B.; Morrison, M.J. Legumes for mitigation of climate change and the provision of feedstock for biofuels and bioreneries. A review. Agron. Sustain. Dev. 2012, 32, 329–364. [Google Scholar] [CrossRef] [Green Version]
  19. Ntatsi, G.; Karkanis, A.; Yfantopoulos, D.; Olle, M.; Travlos, I.; Thanopoulos, R.; Bilalis, D.; Bebeli, P.; Savvas, D. Impact of variety and farming practices on growth, yield, weed flora and symbiotic nitrogen fixation in faba bean cultivated for fresh seed production. Acta Agric. Scand. Sect. B-Plant Soil Sci. 2018, 68, 619–630. [Google Scholar] [CrossRef]
  20. Karkanis, A.; Ntatsi, G.; Lepse, L.; Fernández, J.A.; Vågen, I.M.; Rewald, B.; Alsiņa, I.; Kronberga, A.; Balliu, A.; Olle, M.; et al. Faba bean cultivation—Revealing novel managing practices for a more sustainable and competitiveness European cropping systems. Front. Plant Sci. 2018, 9, 1115. [Google Scholar] [CrossRef]
  21. Food and Agriculture Organization. World Food and Agriculture. Statistical Pocketbook. 2019. 2020. Available online: http://www.fao.org/3/ca6463en/ca6463en.pdf (accessed on 5 October 2020).
  22. United Nations. World Statistics Pocketbook 2017 Edition. 2017. Available online: https://unstats.un.org/unsd/publications/pocketbook/files/world-stats-pocketbook-2017.pdf (accessed on 5 October 2020).
  23. Rawal, V.; Navarro, D.K. (Eds.) The Global Economy of Pulses; FAO: Rome, Italy, 2019; Available online: http://www.fao.org/3/i7108en/I7108EN.pdf (accessed on 5 October 2020).
  24. Etemadi, F.; Hashemi, M.; Barker, A.V.; Zandvakili, O.R.; Liu, X. Agronomy, nutritional value, and medicinal application of Faba Bean (Vicia faba L.). Hortic. Plant J. 2019, 5, 170–182. [Google Scholar] [CrossRef]
  25. Statistics Lithuania. Official Statistics Portal: Agriculture. 2020. Available online: https://osp.stat.gov.lt/en_GB/zemes-ukis1 (accessed on 5 October 2020).
  26. Katerji, N.; Mastrorilli, M.; Lahmer, F.; Maalouf, F.; Oweis, T. Faba bean productivity in saline–drought conditions. Eur. J. Agron. 2011, 35, 2–12. [Google Scholar] [CrossRef]
  27. Buragienė, S.; Šarauskis, E.; Romaneckas, K.; Adamavičienė, A.; Kriaučiūnienė, Z.; Avižienytė, D.; Marozas, V.; Naujokienė, V. Relationship between CO2 emissions and soil properties of differently tilled soils. Sci. Total Environ. 2019, 662, 786–795. [Google Scholar] [CrossRef] [PubMed]
  28. Romaneckas, K.; Adamavičienė, A.; Sinkevičienė, A.; Kimbirauskienė, R.; Bogužas, V.; Šarauskis, E.; Butkus, V.; Jasinskas, A.; Buragienė, S.; Čekanauskas, S. Influence of five tillage patterns on faba bean productivity parameters. In Proceedings of 45 International Symposium on Agricultural Engineering. Actual Tasks on Agricultural Engineering.; University of Zagreb: Opatija, Croatia, 2017; pp. 183–190. [Google Scholar]
  29. Romaneckas, K.; Kimbirauskienė, R.; Adamavičienė, A.; Buragiene, S.; SINKEVIČIENĖ, A.; Sarauskis, E.; Jasinskas, A.; Minajeva, A. Impact of sustainable tillage on biophysical properties of Planosol and on faba bean yield. Agric. Food Sci. 2019, 28, 101–111. [Google Scholar] [CrossRef] [Green Version]
  30. Lenka, S.; Trivedi, P.; Singh, B.; Singh, B.P.; Pendall, E.; Bass, A.; Lenka, N.K. Effect of crop residue addition on soil organic carbon priming as influenced by temperature and soil properties. Geoderma 2019, 347, 70–79. [Google Scholar] [CrossRef] [Green Version]
  31. Aschi, A.; Aubert, M.; Riah-Anglet, W.; Nélieu, S.; Dubois, C.; Akpa-Vinceslas, M.; Trinsoutrot-Gattin, I. Introduction of Faba bean in crop rotation: Impacts on soil chemical and biological characteristics. Appl. Soil Ecol. 2017, 120, 219–228. [Google Scholar] [CrossRef]
  32. Abdalla, M.; Kumar, S.; Jones, M.; Burke, J.; Williams, M. Testing DNDC model for simulating soil respiration and assessing the effects of climate change on the CO2 gas flux from Irish agriculture. Glob. Planet. Chang. 2011, 78, 106–115. [Google Scholar] [CrossRef]
  33. Álvaro-Fuentes, J.; Cantero-Martínez, C.; López, M.V.; Arrúe, J. Soil carbon dioxide fluxes following tillage in semiarid Mediterranean agroecosystems. Soil Tillage Res. 2007, 96, 331–341. [Google Scholar] [CrossRef] [Green Version]
  34. Mu, X.; Zhao, Y.; Liu, K.; Ji, B.; Guo, H.; Xue, Z.; Li, C. Responses of soil properties, root growth and crop yield to tillage and crop residue management in a wheat–maize cropping system on the North China Plain. Eur. J. Agron. 2016, 78, 32–43. [Google Scholar] [CrossRef]
  35. Mikša, O.; Baležentienė, L.; Marozas, V.; Sasnauskienė, J. CO2 emission and climatic conditions rate during maize (Zea mays) and rapeseed (Brassica napus) in agro-ecosystems. In Proceedings of the 21th International Scientific-Practice Conference/Vytautas Magnus University, Kaunas, Lithuania, 22 May 2015; pp. 39–42. [Google Scholar]
Table 1. Meteorological conditions during the faba bean vegetation (Kaunas Meteorological Station).
Year/MonthAprilMayJuneJulyAugustSeptember
Average air temperature (°C)
20167.415.717.217.916.9-
20175.612.915.416.817.513.4
201810.217.217.520.119.2-
44 years average6.913.216.118.717.312.6
Precipitation rate (mm)
201641.236.483.9162.9114.9-
201773.710.580.279.655.087.1
201864.817.657.6137.566.2-
44 years average41.361.776.999.688.960.0
Table 2. The effect of the tillage systems on the content of precrop residues (%) on the topsoil.
Tillage System2016201720182016–2018 Average
Before SowingAfter SowingBefore SowingAfter SowingBefore SowingAfter SowingBefore SowingAfter Sowing
Deep ploughing2.80.54.51.32.10.83.10.9
Shallow ploughing2.80.34.31.34.44.23.81.9
Deep cultivation-chiselling42.5 **8.5 *25.3 **7.3 *51.0 **36.8 **39.6 *17.5
Shallow cultivation-disking43.5 **10.5 **24.8 **11.8 **50.0 **25.8 **39.4 *16.0
No-tillage87.0 **82.8 **21.5 **22.0 **47.2 **54.2 **51.9 **53.0 **
* Significantly different at P ≤ 0.05 from the control (deep plowing, DP) within columns; ** at P ≤ 0.01.
Table 3. The effect of the tillage systems on the soil chemical composition (0–15 cm soil layer).
Tillage SystemTimingSoil Chemical Composition
pHHCl, mol l-1P2O5, mg kg-1K2O, mg kg-1Mg, mg kg-1Ntotal, %
2016
Deep ploughingBS7.1231853600.131
AH7.42371044370.129
Shallow ploughingBS7248108 *3470.143
AH7.42571224340.139
Deep cultivation-chisellingBS7.4250120 **4460.142
AH7.31941013460.13
Shallow cultivation-diskingBS7.1284149 **4080.144
AH7.1284138 *3240.144
No-tillageBS6.7233116 **2740.168 **
AH72501193120.157 *
2017
Deep ploughingBS7.12461364260.12
AH72551444550.128
Shallow ploughingBS7.12451464890.148 **
AH72331584630.141
Deep cultivation-chisellingBS7.42421484810.131 **
AH6.82431654850.134
Shallow cultivation-diskingBS7.22701686340.149 **
AH72571806100.145
No-tillageBS7.12761666080.143 **
AH7.12682065440.146
2018
Deep ploughingBS7.33091232820.116
AH7.33221322980.115
Shallow ploughingBS6.93471503580.144 *
AH6.93471562690.164 *
Deep cultivation-chisellingBS6.63181322420.136 *
AH6.93001522860.148 *
Shallow cultivation-diskingBS6.83361472560.138 *
AH6.73761882680.161 *
No-tillageBS6.4 *384181 *2080.158 **
AH6.4 *355201 *1980.173 **
BS, before sowing; AH, after harvesting; * significantly different at P ≤ 0.05 from the control (deep plowing, DP) within columns; ** at P ≤ 0.01.
Table 4. The effect of the tillage systems on the soil chemical composition (15–25 cm soil layer).
Tillage SystemTimingSoil Chemical Composition
pHHCl, mol l-1P2O5, mg kg-1K2O, mg kg-1Mg, mg kg-1Ntotal, %
2016
Deep ploughingBS7.42661044190.135
AH7.5246984150.137
Shallow ploughingBS7.42511074280.14
AH7.5232974550.141
Deep cultivation-chisellingBS7.515467 *3070.12
AH7.413567 *3050.11
Shallow cultivation-diskingBS7.316265 *3060.013
AH7.416066 *3060.122
No-tillageBS7.416660 *2890.128
AH7.415058 *2910.135
2017
Deep ploughingBS7.42281444890.132
AH71981204240.142
Shallow ploughingBS7.42311314770.164
AH71901144270.15
Deep cultivation-chisellingBS7.4129 **76 **5010.123
AH7.21561143910.134
Shallow cultivation-diskingBS7.4129 **71 **4490.147
AH7.2148923710.133
No-tillageBS7.5171 **95 **6090.156
AH7.21641045470.132
2018
Deep ploughingBS7.33101302960.115
AH7.33011302560.137
Shallow ploughingBS6.93381322900.152
AH7.13251383680.144
Deep cultivation-chisellingBS6.620478 *2360.115
AH6.817372 *2140.112
Shallow cultivation-diskingBS6.721078 *2180.116
AH7.1217802140.126
No-tillageBS6.82541002340.125
AH7236962120.123
BS, before sowing; AH, after harvesting; * significantly different at P ≤ 0.05 from the control (deep plowing, DP) within columns; ** at P ≤ 0.01.
Table 5. The effect of the tillage systems on soil temperature and moisture content (0–10 cm soil layer).
Tillage SystemTemperature °CContenttric Moisture Content %
Beginning of VegetationMiddle of VegetationEnd of VegetationBeginning of VegetationMiddle of VegetationEnd of Vegetation
2016
Deep ploughing20.816.419.215.215.523.1
Shallow ploughing20.616.218.515.115.322.2
Deep cultivation-chiselling20.516.418.915.315.022.7
Shallow cultivation-disking20.616.318.515.215.522.0
No-tillage18.8 **16.118.516.215.122.4
2017
Deep ploughing20.514.813.311.818.612.7
Shallow ploughing19.315.313.311.417.412.6
Deep cultivation-chiselling19.814.713.211.617.712.7
Shallow cultivation-disking19.514.913.211.518.312.5
No-tillage19.716.213.411.318.412.6
2018
Deep ploughing21.518.921.512.318.027.0
Shallow ploughing21.418.521.812.718.326.2
Deep cultivation-chiselling20.718.721.912.618.127.8
Shallow cultivation-disking20.6 *18.821.512.718.526.3
No-tillage20.3 **18.521.112.618.627.8
* Significantly different at P ≤ 0.05 from the control (deep plowing, DP) within columns; ** at P ≤ 0.01.
Table 6. The effect of the tillage systems on the CO2 e-flux and the concentration above the ground.
Tillage SystemCO2 e-Flux Rate, μmol m−2 s−1CO2 Concentration Above the Ground, ppm
Beginning of VegetationMiddle of VegetationEnd of VegetationBeginning of VegetationMiddle of VegetationEnd of Vegetation
2016
Deep ploughing2.214.473.88389.7383.7394.2
Shallow ploughing2.903.813.27387.2409.5392.4
Deep cultivation-chiselling3.222.935.75387.1386.3393.7
Shallow cultivation-disking2.745.063.29391.0382.9390.9
No-tillage2.973.974.49386.9383.1394.6
2017
Deep ploughing3.193.432.00387.8391.8389.8
Shallow ploughing2.657.66 **2.93389.0406.1388.7
Deep cultivation-chiselling3.684.281.80388.0399.7388.0
Shallow cultivation-disking2.723.471.65387.2410.1 *387.5 *
No-tillage4.554.202.38390.8 **393.7387.4 *
2018
Deep ploughing3.575.022.32390.5395.2376.6
Shallow ploughing2.583.076.84 **387.4 *388.9391.1
Deep cultivation-chiselling2.823.129.75 **388.1388.1393.9
Shallow cultivation-disking4.333.515.68 *389.5388.9381.4
No-tillage2.463.155.54 *388.2397.0383.6
* Significantly different at P ≤ 0.05 from the control (deep plowing, DP) within columns; ** at P ≤ 0.01.
Publisher’s Note: MDPI stays neutral with regard to jurisdictional claims in published maps and institutional affiliations.

