Article

A Guide to Public Green Space Planning for Urban Ecosystem Services

1
Department of Landscape Architecture, University of Oregon, Eugene, OR 97403, USA
2
Environmental Studies Program, University of Oregon, Eugene, OR 97403, USA
*
Author to whom correspondence should be addressed.
Land 2020, 9(10), 391; https://doi.org/10.3390/land9100391
Submission received: 25 September 2020 / Revised: 11 October 2020 / Accepted: 12 October 2020 / Published: 14 October 2020
(This article belongs to the Special Issue Urban Ecosystem Services)

Abstract

:
Street trees, native plantings, bioswales, and other forms of green infrastructure alleviate urban air and water pollution, diminish flooding vulnerability, support pollinators, and provide other benefits critical to human well-being. Urban planners increasingly value such urban ecosystem services (ES), and effective methods for deciding among alternative planting regimes using urban ES criteria are under active development. In this effort, integrating stakeholder values and concerns with quantitative urban ES assessments is a central challenge; although it is widely recommended, specific approaches have yet to be explored. Here, we develop, apply, and evaluate such a method in the Friendly Area Neighborhood of Eugene, Oregon by investigating the potential for increased urban ES through the conversion of public lawn to alternative planting regimes that align with expressed stakeholder priorities. We first estimated current urban ES from green space mapping and published supply rates, finding lawn cover and associated ES to be dominant. Resident and expert priorities were then revealed through surveys and Delphi analyses; top priorities included air quality, stormwater quality, native plantings, and pollinator habitat, while concerns focused on cost and safety. Unexpectedly, most residents expressed a willingness to support urban ES improvements financially. This evidence then informed the development of planting regime alternatives among which we compared achievable future urban ES delivery, revealing clear differences among those that maximized stakeholder priorities, those that maximized quantitative urban ES delivery, and their integration. The resulting contribution is a straightforward method for identifying planting regimes with a high likelihood of success in delivering desired urban ES in specific local contexts.

1. Introduction

Dense networks of streets, buildings, industry, and transportation interfere with numerous ecosystem processes, affecting the local hydrology, quantity and biodiversity of native flora and fauna, biogeochemical cycling, and microclimate stability [1]. Urban ecosystem services (ES), the benefits humans derive from ecological processes in urban and peri-urban areas [2], are therefore often compromised in population centers, resulting in diminished air, water, and soil quality as well as intensified vulnerability to flooding and heatwaves [1,3,4]. As urban populations grow, the importance of urban ES is increasing: over four billion people now live in cities, a 20-fold increase since 1900 [5,6], and by 2050, urban residents are predicted to number six billion [6].
To strengthen urban ES, green infrastructure, or planned networks of urban vegetated land cover (“urban green space”), including parks, right-of-way planting strips, private yards, green roofs, wetlands, and other natural areas, may be deployed [7]. Urban forests, for example, reduce concentrations of air pollutants, including ozone, carbon monoxide, sulfur dioxide, nitrogen oxides, and particulate matter [8,9]; store atmospheric carbon [9,10]; intercept rainfall, thereby reducing stormwater runoff [11]; provide shade and air temperature regulation [12]; increase recreation value [13]; supply diverse nesting and foraging opportunities for birds; diminish soil erosion; and contribute to stormwater purification [14,15].
Recent biophysical, empirical, and GIS-based modeling methods now allow certain urban ES delivery rates to be quantified [16,17], and economic models allow their monetary value to be evaluated (e.g., [18]), facilitating estimation and comparison of urban green space contributions to air quality [9,19], stormwater runoff retention [20], air temperature regulation [21,22], and carbon sequestration [9,23,24]. For example, urban forests removed an estimated 27,000 metric tons of PM2.5, 523,000 metric tons of ozone, 68,000 metric tons of nitrogen dioxide, and 33,000 metric tons of sulfur dioxide from the U.S. urban air in 2010, providing an estimated $4.7 billion in annual health benefits [8]. Such urban ES quantification and valuation are then directly useful in deciding among urban land-use alternatives [14,16].
Currently, the lawn is the dominant green land cover type throughout urban and suburban areas of Europe, Canada, and the USA [25]; in 2005, lawn accounted for nearly half of all urban land cover in the USA [26], an area comparable to half of the total irrigated cropland in the USA [27,28]. Although lawns are relatively easy and inexpensive to maintain, enjoy widespread acceptance, and provide some urban ES, under typical management they consume extensive irrigation water [26] and are treated with fertilizers, pesticides, and herbicides that are harmful to fish, birds, and insects [29]. Additionally, lawns store limited carbon [30], and their mowing leads to both biogenic and fuel-related greenhouse gas emissions [31]. They also contribute less to stormwater retention, air purification, microclimate regulation, and recreation than other vegetative land-cover types [14,25,32,33].
In light of this evidence, urban land use planners face crucial decisions regarding the continuation of public lawn maintenance, complicated by pressures of cost, restrictive land-use codes, and uncertain public support, as well as limited land area with which to provide urban ES [34]. In these decisions, the perspectives of stakeholders such as policymakers, environmental managers, and affected residents are critical [2,16,35,36,37], revealing ES priorities, design preferences, and barriers to green infrastructure development [34,38,39,40,41,42,43]. The value of stakeholder input to ES planning was first emphasized by the Millennium Ecosystem Assessment in 2005, and the integration of urban ES quantification with stakeholder-expressed urban ES priorities emerged as a central urban environmental planning prescription [2,37].
The essential nature of stakeholder input in ensuring long-term green infrastructure success, combined with the characteristic urban ES provided by specific land cover types (e.g., woodland, trees, shrubs, native grasses, stormwater filtration facilities, etc.), require effective decision-making processes to integrate several lines of evidence. Specifically, quantitative urban ES delivery potential must be evaluated in the context of a possibly conflicting set of stakeholder perspectives [2,4,16,34,37,44], involving an approach that is widely advocated but has not, to our knowledge, been further investigated. To address this need, here we develop and evaluate such a method. We begin by establishing the urban ES currently provided in the study area and surveying diverse stakeholders to reveal their ES priorities. These data next inform the selection of alternative planting regimes that address individual stakeholder priorities and quantitative urban ES delivery, respectively. Comparison of priority ES delivery among these alternatives then guides their integration, yielding a composite regime that improves upon each initial alternative’s likelihood of local acceptance while increasing delivery of the desired ES. Notably, this integrated regime could not have been clearly identified by either stakeholder priorities or quantitative urban ES assessments alone.

2. Methods

2.1. Study Area

The City of Eugene (Figure 1; population 156,000; median income $44,859; area 113 km2) sits within the southern Willamette Valley in western Oregon [45], an area with a Mediterranean climate (Köppen Csb) of long cool rainy winters and warm dry summers. The valley surroundings promote winter temperature inversions and summer wildfire smoke collection, causing Eugene to rank among the twenty worst cities in the USA for short-term small particulate (PM2.5) air pollution [46]. The City of Eugene is also currently required by its National Pollution Discharge Elimination System (NPDES) permit to reduce the waterborne discharge of pollutants from the municipal system to the maximum extent possible [47]. The City of Eugene Park system possesses nearly 2000 ha of natural areas and open space, but their aggregation on the outskirts of town [48] limits their contributions to ES in urban neighborhoods.
Within the city, the Friendly Area Neighborhood (FAN; Figure 1; population 7000; area 3.7 km2) is zoned primarily (~75%) for low-density residential development (8–10 dwelling units/ha) and consists largely of single-detached units, with a median tax lot parcel area slightly below the USA median (0.073 ha vs. 0.083 ha) [45]. Nearly all streets in the neighborhood contain vegetated planting strips within city right-of-way easements, while sidewalks are intermittent. The FAN median annual household income ($46,300) is $7000 below state and $11,300 below national medians [49,50], but its access to public green space is above average, with >10% of its land devoted to public parks and schoolyards and ~95% of residents living within a five-min walking distance along roads (i.e., <400 m) of a public park or schoolyard (Figure S1); the neighborhood is therefore comparable to top cities in the United States for such access [51].

2.2. Public Green Space Mapping and Urban ES Quantification

Although privately owned land is important in providing urban ES [52,53], this study focuses on public green space in which urban ES delivery is managed by the City. To characterize this space, we used multiple mapping strategies to inventory five distinct vegetated land cover types in the neighborhood (Table S1). Each street was traversed on foot in 2017 to identify lawn within the public right-of-way, and lawn without tree canopy cover was geospatially located and measured using a Garmin GPSMAP 62S handheld Global Positioning System (Garmin Ltd., Olathe, KS, USA). In tax lot parcels without adjacent sidewalks, right-of-way boundaries were assumed to extend 3 m on either side of the roadway. The boundaries of woodlands, classified as clustered trees clearly distinguishable from the U.S. Department of Agriculture’s 2016 National Agriculture Imagery Program (NAIP) imagery, were assessed visually in ESRI ArcMap 10.7 (ESRI, Redlands, CA, USA) [54] and confirmed in the field. All other vegetation classifications (i.e., trees, tall shrubs, and short shrubs, as well as lawns located in parks) were made using normalized difference vegetation indices (NDVIs) and height; the NDVI was calculated on a continuum from −1 to +1 using the NAIP four-band imagery with 1 m resolution. The NDVI range for each vegetation class was determined by comparing NDVI and color composite images [55]. The minimum NDVI threshold for all vegetation classes was set at 0.25, with the exception of lawn, which was identified using a minimum NDVI threshold of 0.0 (Table S1). Vegetation height was derived from 2015 light detection and ranging (LiDAR) point-cloud data [56] that were used to generate digital elevation and digital surface models. Digital elevation model values were subtracted from the digital surface model to create a digital height model at 1 m resolution, and vegetation was classified by combining NDVI thresholds with height ranges determined by Derkzen et al. (Table S1) [14].
The accuracy of each NDVI/LiDAR-derived land cover classification was evaluated through a process in which four hundred points, or 100 for each of the four vegetation types classified using NDVIs and LiDAR, were randomly selected and validated visually with NAIP imagery. Air photo interpretation was used to determine land cover type for all points clearly and obviously identifiable from the air photo. Land cover types for all remaining unidentified points were confirmed in the field (Table S2). NDVI/LiDAR-derived public green space land cover quantities were adjusted using validation proportions from Table S2 (see Table S3 footnotes), and five urban ES were quantified from these adjusted spatial data using indicators and supply rates compiled by Derkzen et al. for each of the five green cover types—vegetative ground cover (i.e., lawn), short shrub, tall shrub, tree, and woodland (Table S1) [14].

2.3. Urban ES Supply Rates

For the existing land cover, supply rates of five urban ES (air purification, carbon storage, runoff retention, cooling fraction, and outdoor recreation) provided by the five green cover types described above were estimated according to Derkzen et al. [14], in which urban ES supply rates from numerous studies were integrated for the analogous Mediterranean (Csb) climate of Rotterdam, NL (Table S1). Although numerous modeling techniques exist for urban ES assessment [16], we chose this straightforward approach, consistent with recent recommendations and used by other case studies [57], as one that would be accessible to a wide range of urban planning practices.
In exploring potential future alternative planting regimes (Section 4.2.), we included stormwater filtration facilities (e.g., stormwater planters and rain gardens) that are not currently present in the neighborhood, estimating their stormwater reduction potential using the Simplified Approach described in Eugene’s Stormwater Management Manual [58]. Impervious surface area, a necessary input, was calculated for the neighborhood using image segmentation and supervised learning in ESRI ArcGIS Pro 2.6 (ESRI, Redlands, CA, USA) [59] based on infrared, red, and blue bands from 2016 NAIP four-band imagery. To assess the accuracy of impervious and pervious surface classification, 100 random points were selected for each land cover type, and every point was validated visually with the NAIP imagery. The overall accuracy of the supervised segmentation classification was 94.5% (Table S9).
Urban green space also has the potential to provide ecosystem disservices, including pollen production that exacerbates allergies; a volatile organic compound release that contributes to ground-level ozone formation in the presence of automobile exhaust; and growth of tree limbs that may interfere with electricity lines or fall during storms, causing property damage [60,61]. These may also be estimated quantitatively in some cases (e.g., [62]), but we have not included these considerations here.

2.4. Resident Surveys

Non-stratified random sample surveys were administered to residents of the FAN to determine their urban ES priorities for public green space and the potential for increased funding for green infrastructure development. A random sample of 500 residential tax lot parcels was selected using county tax lot parcel data for the FAN as a sampling frame. Each selected lot was visited once on a weekday between 5 and 7 PM, and 19.4% of these visits yielded a completed survey (n = 97). The majority of the recorded non-responses resulted from resident absences, suggesting that repeated visits could have increased the response rate, and homes with posted “Do Not Disturb” or “No Soliciting” signs were also recorded as non-responses. Among residents who answered their doors, over half agreed to participate. Surveys were conducted orally in a format approved by the University of Oregon’s Institutional Review Board. To minimize the survey’s perceived invasiveness, sociodemographic information was not collected, although it could have been informative.
Residents were asked to rate 17 randomly ordered urban ES according to their importance for public green space in their neighborhood using a five-point Likert scale from 1 (“very unimportant”) to 5 (“very important”) (detailed in Supplementary Materials Section S2). They were then asked whether they supported the management of public green space to increase urban ES delivery and whether they would be willing to support such efforts financially, through personal donations or taxes, and through direct contribution of volunteer time.
Resident priorities for public green space urban ES were evaluated using Pearson’s chi-square tests for both pairwise and aggregate comparisons, and chi-square tests were further used to compare priorities among urban ES classification types (i.e., provisioning, regulating, cultural, and supporting). Results for each urban ES classification type were tested for internal consistency using Cronbach’s alpha (α), and values above 0.7 were regarded as acceptable [63]. “Priority” urban ES were defined as those with Likert responses of 4 (“moderately important”) or 5 (“very important”), and Likert responses were reclassified as either priority (values 4 and 5) or non-priority (values 1–3) for data analysis. Descriptive statistics were used to compare residents’ willingness to support green infrastructure development. All statistical analyses were conducted in R [64].

2.5. Delphi Method

We used an iterative survey process, known as a Delphi analysis, to consult with a group of individuals with specific knowledge of the planning and management of public green space in Eugene [65,66]. Of the 34 people invited to participate on the basis of their expertise in public policy and green space management, 15 agreed, including nine members of the Eugene Public Works Department (including Parks and Open Space, Stormwater Management, and Urban Forestry), two City Planning and Development members, two local environmental non-profit representatives, one City Council member, and one University of Oregon Landscape Architecture faculty member.
In the first survey, participants ranked the 17 urban ES used in the resident survey in order of importance for public green space management in Eugene; those urban ES with mean and median rankings below the top 10 were eliminated from the second survey. In addition, seven open-ended questions asked participants to describe and explain their perspectives on urban ES opportunities and barriers further. In the second round, participants were asked to review the collective results and representative responses from the first round before again selecting the urban ES they considered to be priorities and expressing their levels of agreement with responses to the open-ended questions of the first round. To reflect differences in management, safety, and ecological benefit potential, these questions distinguished between parks and right-of-way planting strips (Supplementary Materials Section S3).
No particular proportion of agreement defines “consensus” in the Delphi method, and documented thresholds have varied from a simple majority to 95% [67,68,69,70]. Here, we chose a consensus threshold of two-thirds (67%), consistent with practices in many city governments [71,72].

3. Results

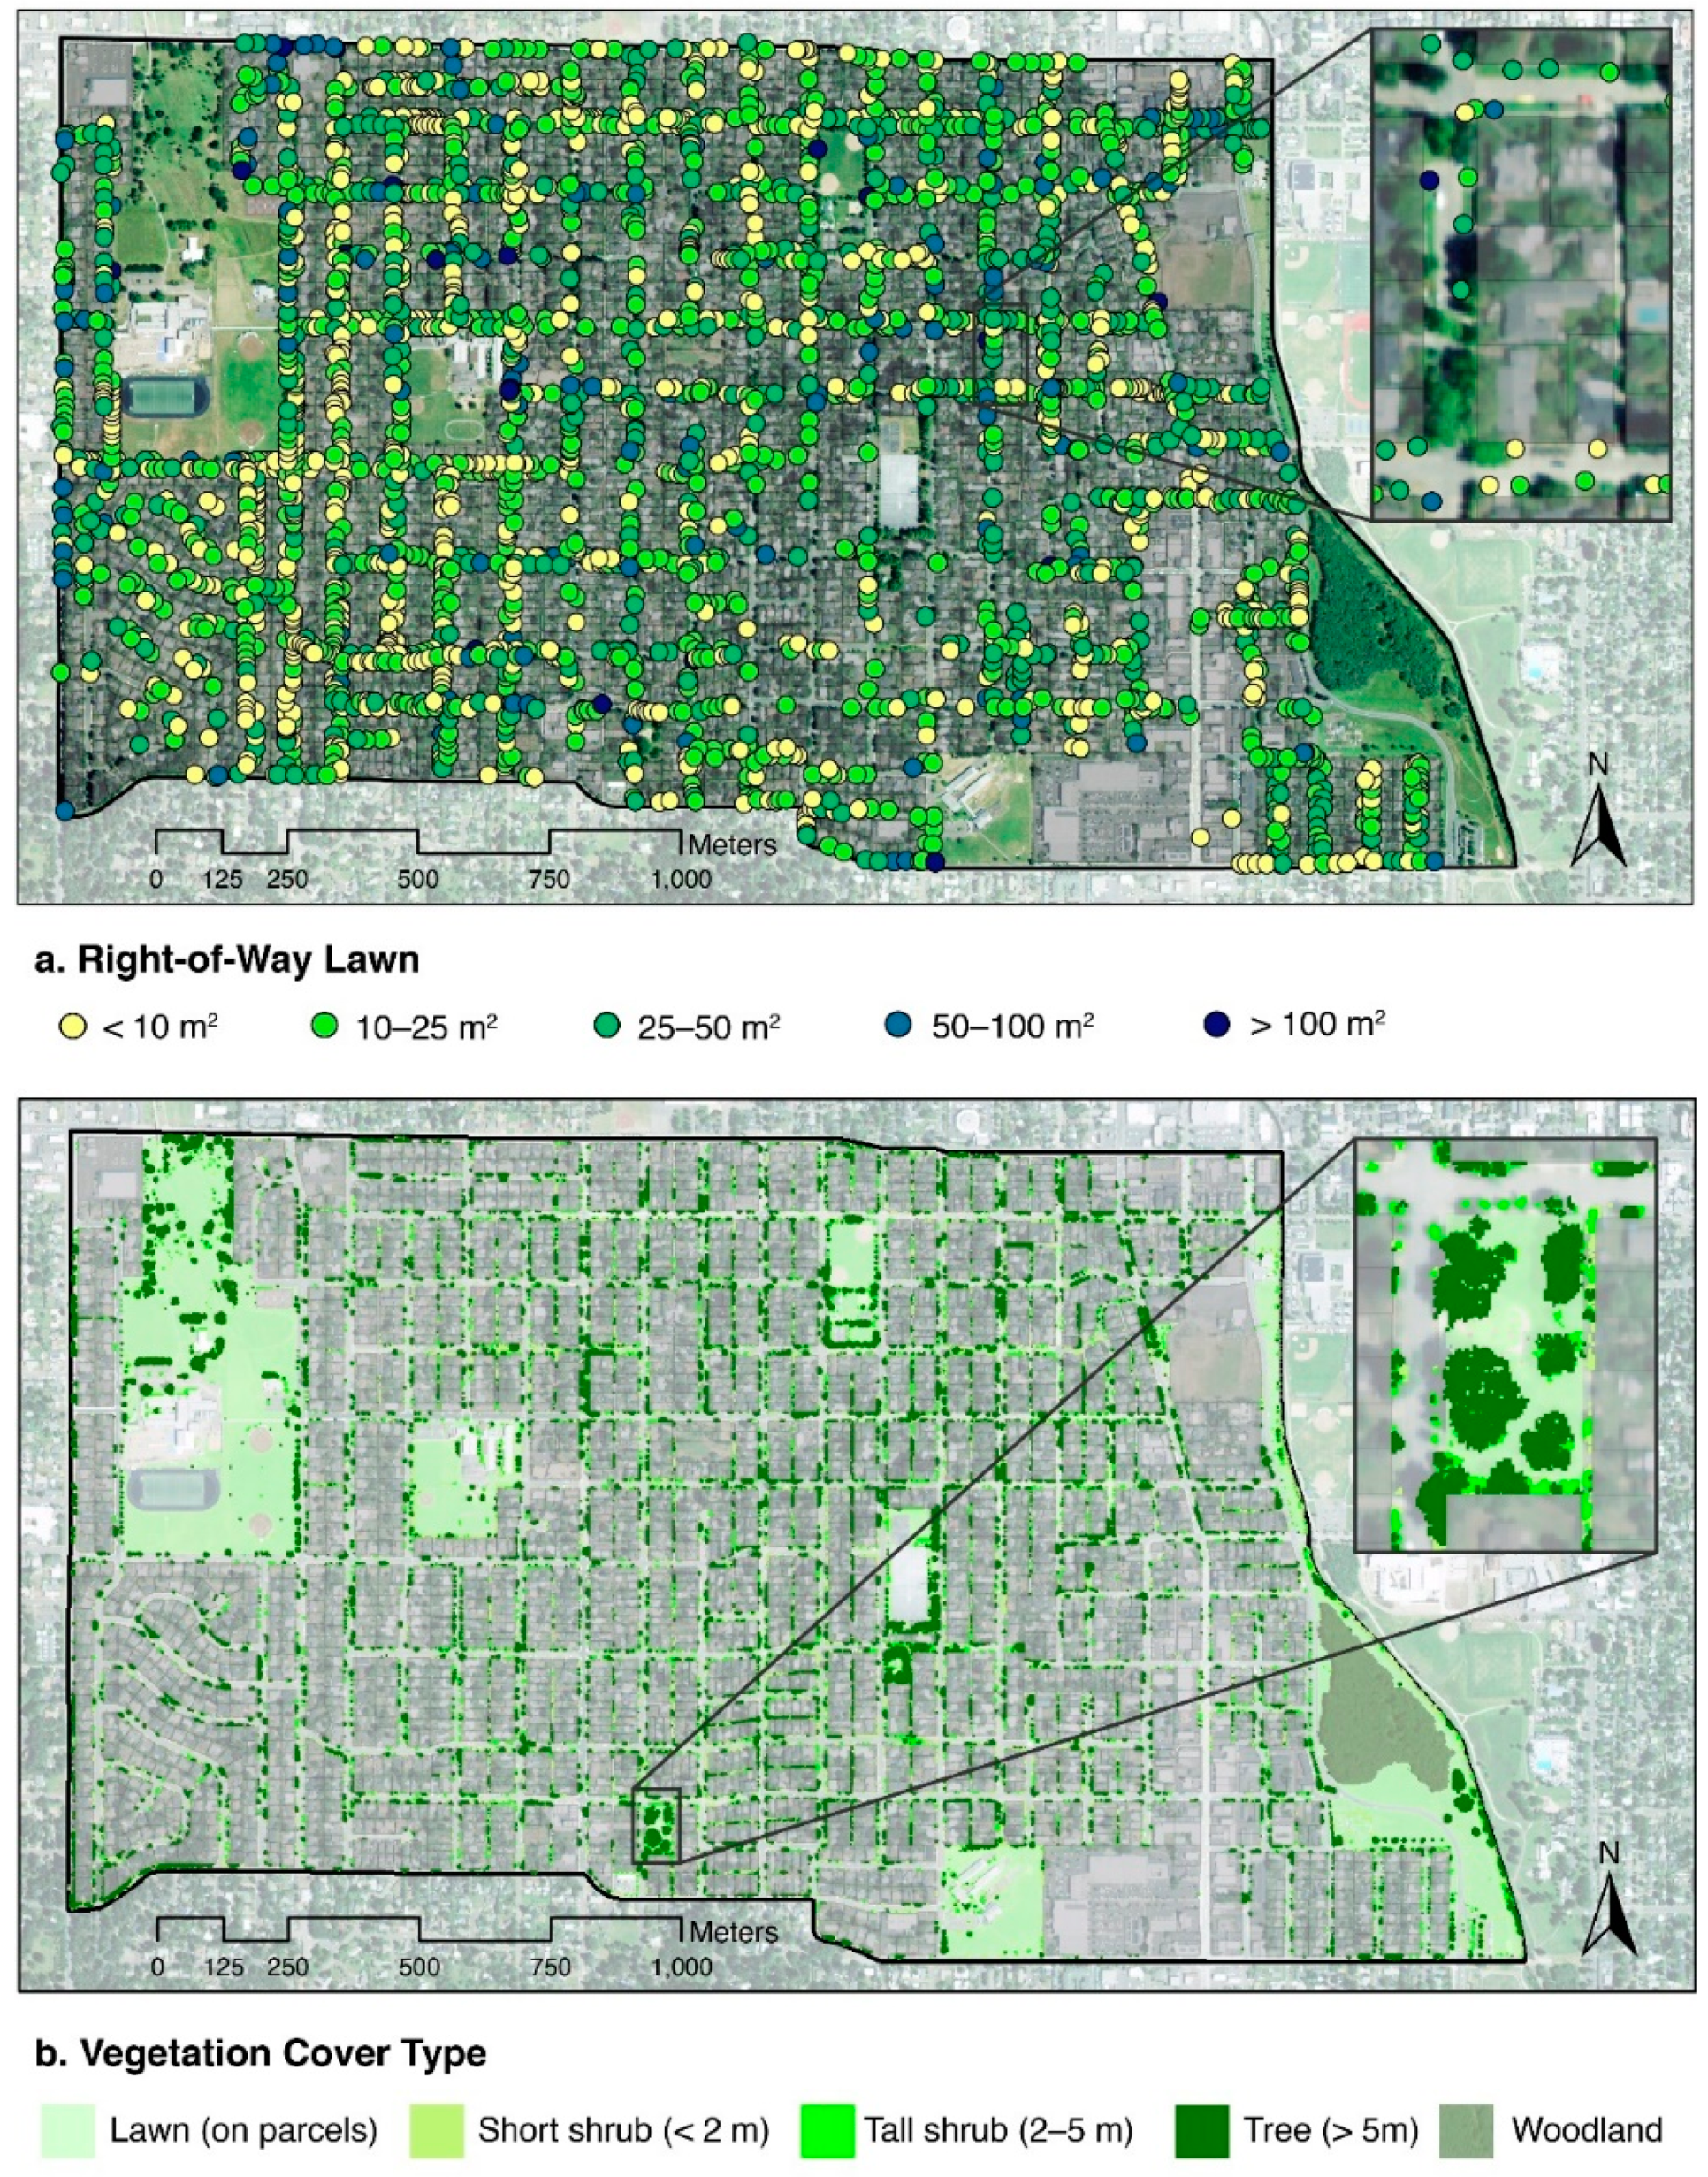
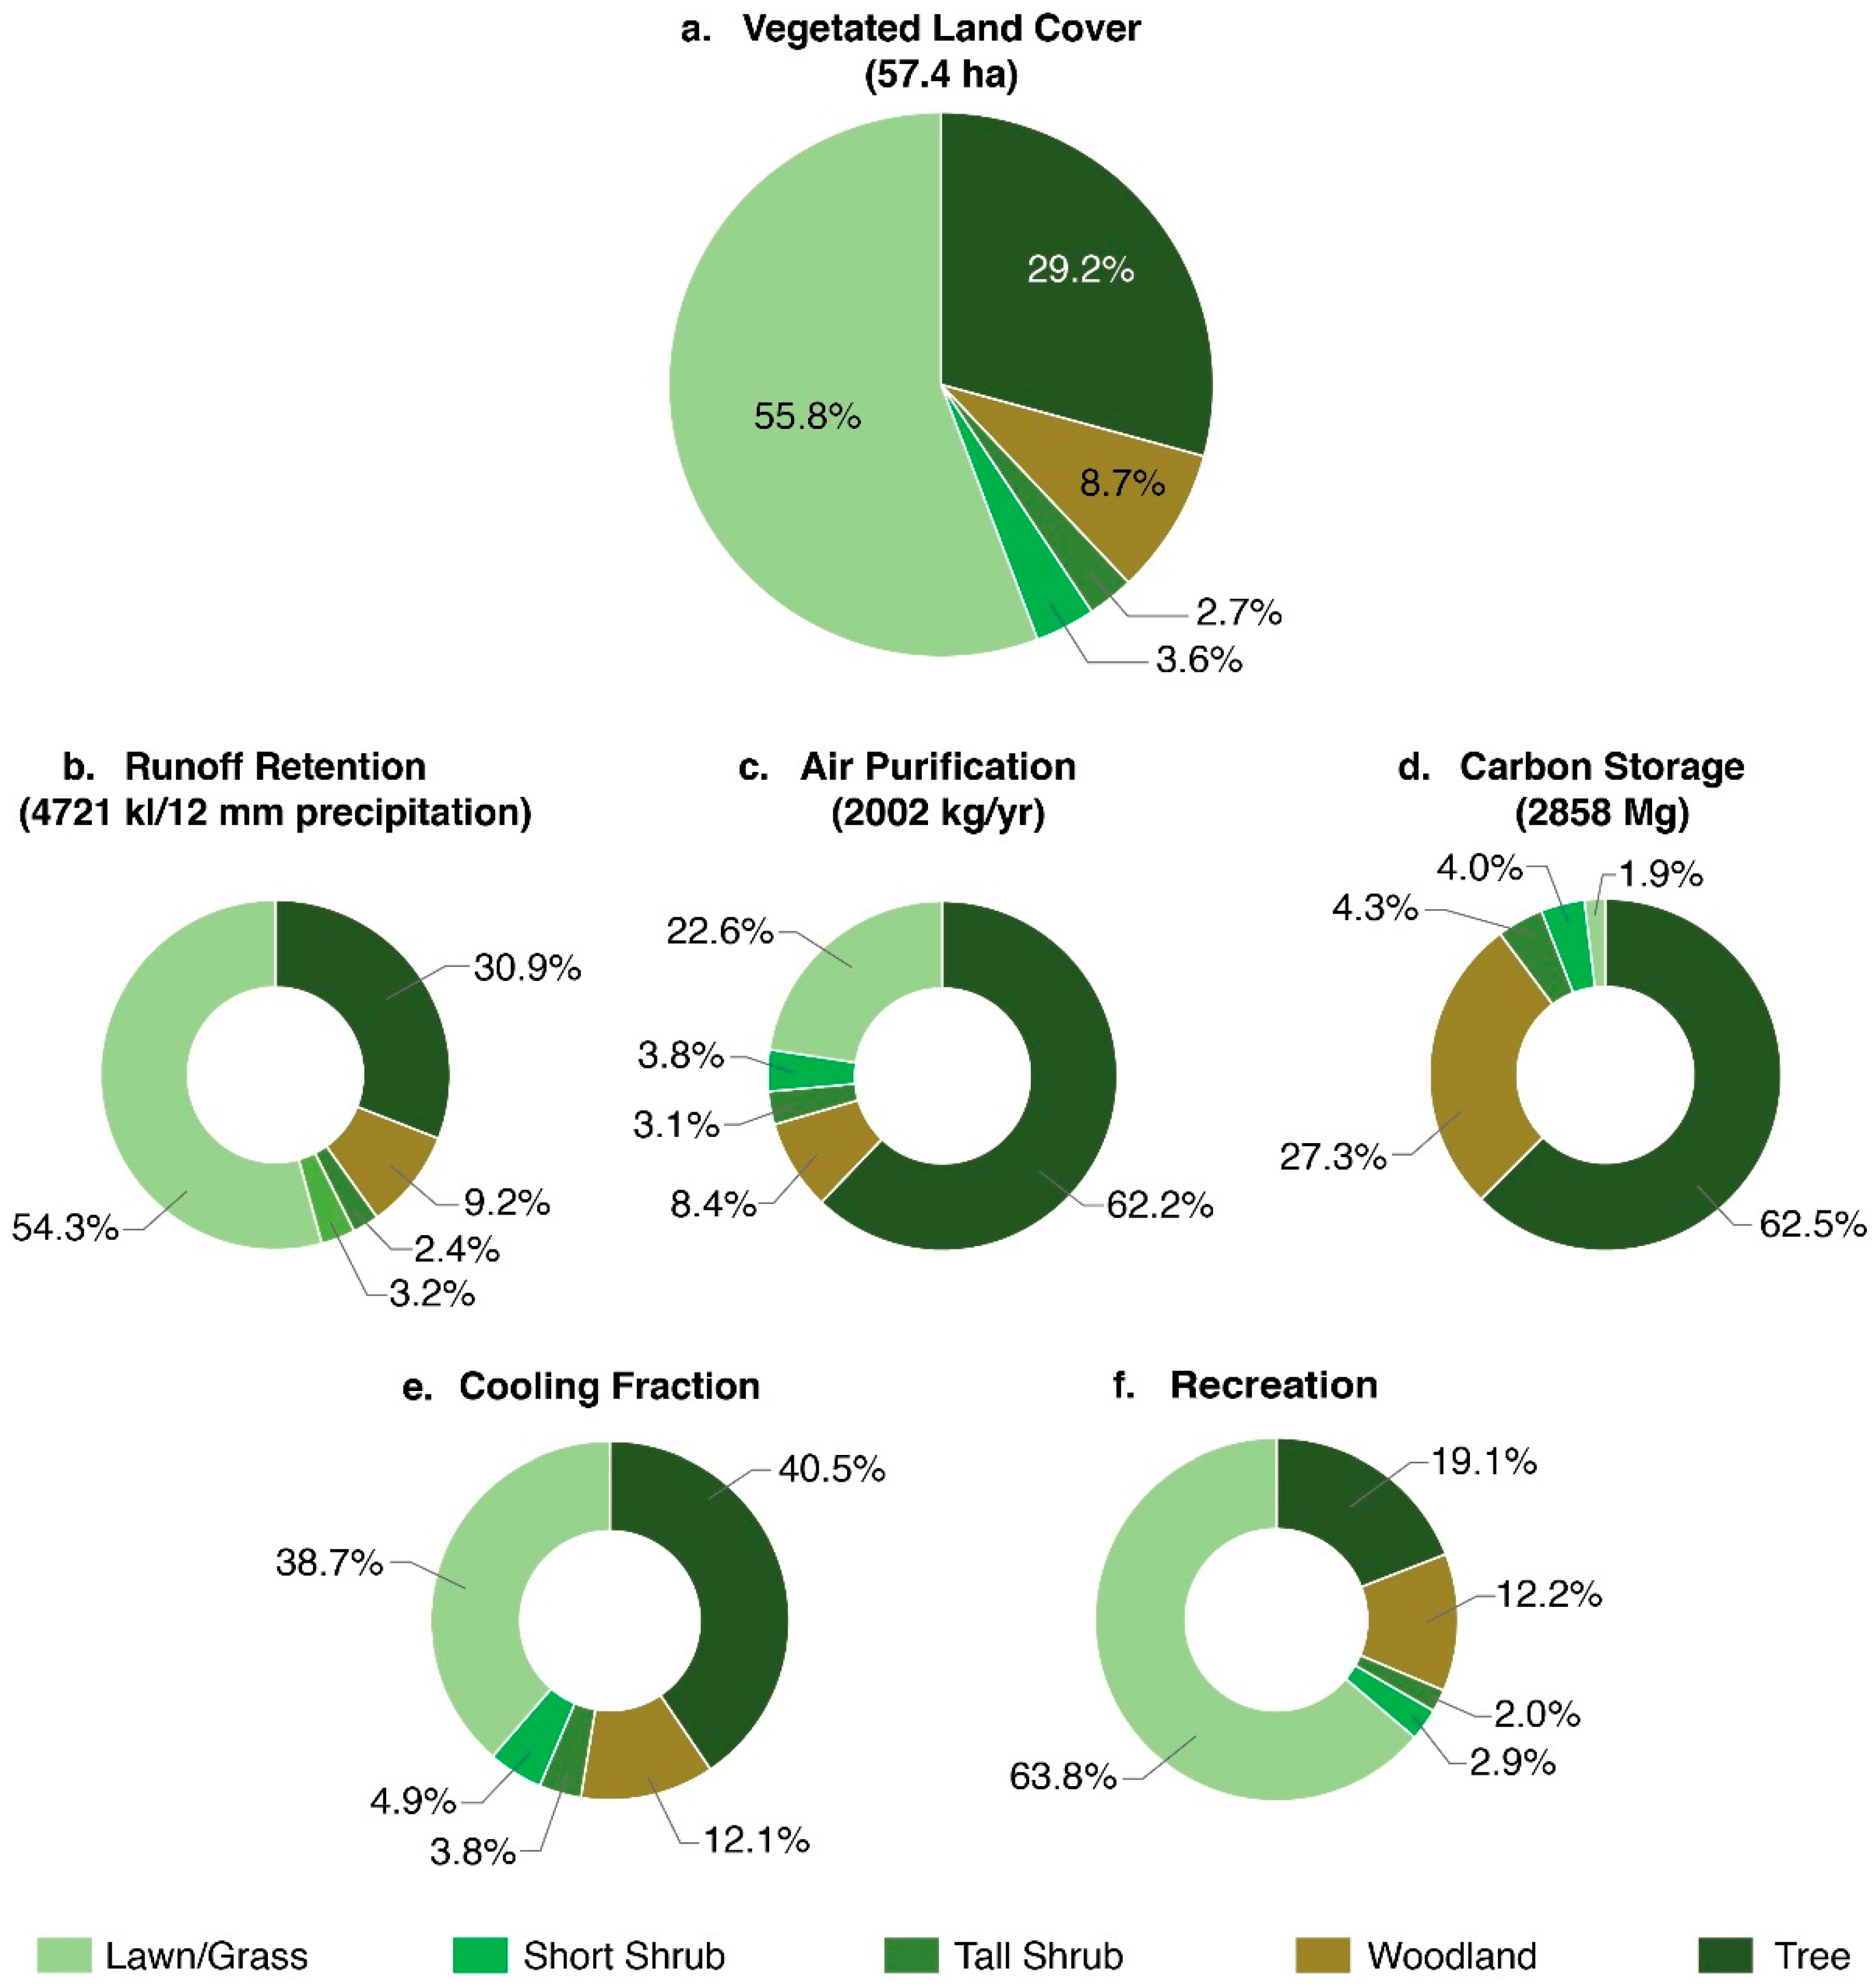
3.1. Public Green Space Inventory

To understand current urban ES delivery rates, we first inventoried public green space in the FAN through a combination of ground survey and NDVI/ LiDAR green cover assessment methods. These revealed that lawn was the dominant green cover type (Figure 2 and Figure 3; Tables S3 and S4), typical of low-density residential development [29]. Of the 57.4 ha of public green space, approximately 55% was covered by lawn without tree canopy, 30% by trees with unidentified understory, 9% by woodland, 4% by tall shrubs, and 3% by short shrubs (Figure 3; Table S4). All woodland and most lawn (>85%) were located in municipal parks and public schoolyards, while ~80% of all non-woodland tree canopy, short shrubs, and tall shrubs were located in right-of-way zones (Table S3).
The approach combining LiDAR and NDVI was most accurate in identifying tree cover and lawn (98% and 86% accuracy, respectively), while 66% of the area classified as “tall shrub” was found to be tree canopy cover, and 33% of the area classified as “short shrub” was found to be tall shrubs, lawn, or tree canopy cover (Table S2).
Using published supply rates [14] (Table S1), we next estimated that this public green space provides nearly 2900 metric tons of carbon storage, removes over 2000 kg per year of atmospheric particulate matter (PM10), and retains over 4.7 million liters of stormwater during each 12 mm storm event (Figure 3; Table S4). Lawn covers over 50% of the total public green space and provides more than half of the runoff retention and recreation value but less than one-quarter of the air purification services and 2% of the carbon storage (Figure 3; Table S4). By comparison, trees cover less than 30% of the total public green space but supply over half of all air purification and carbon storage, as well as over 40% of cooling services; trees provide runoff retention roughly proportional to their coverage area but only one-fifth of all recreation services. Woodland covers less than one-tenth of the total public green space yet provides over one-tenth of the recreation value and over one-quarter of the carbon storage, or more than 14× that provided by lawn. Tall and short shrubs, in comparison, cover the least area of the total public green space but provide urban ES approximately proportional to their coverage area.

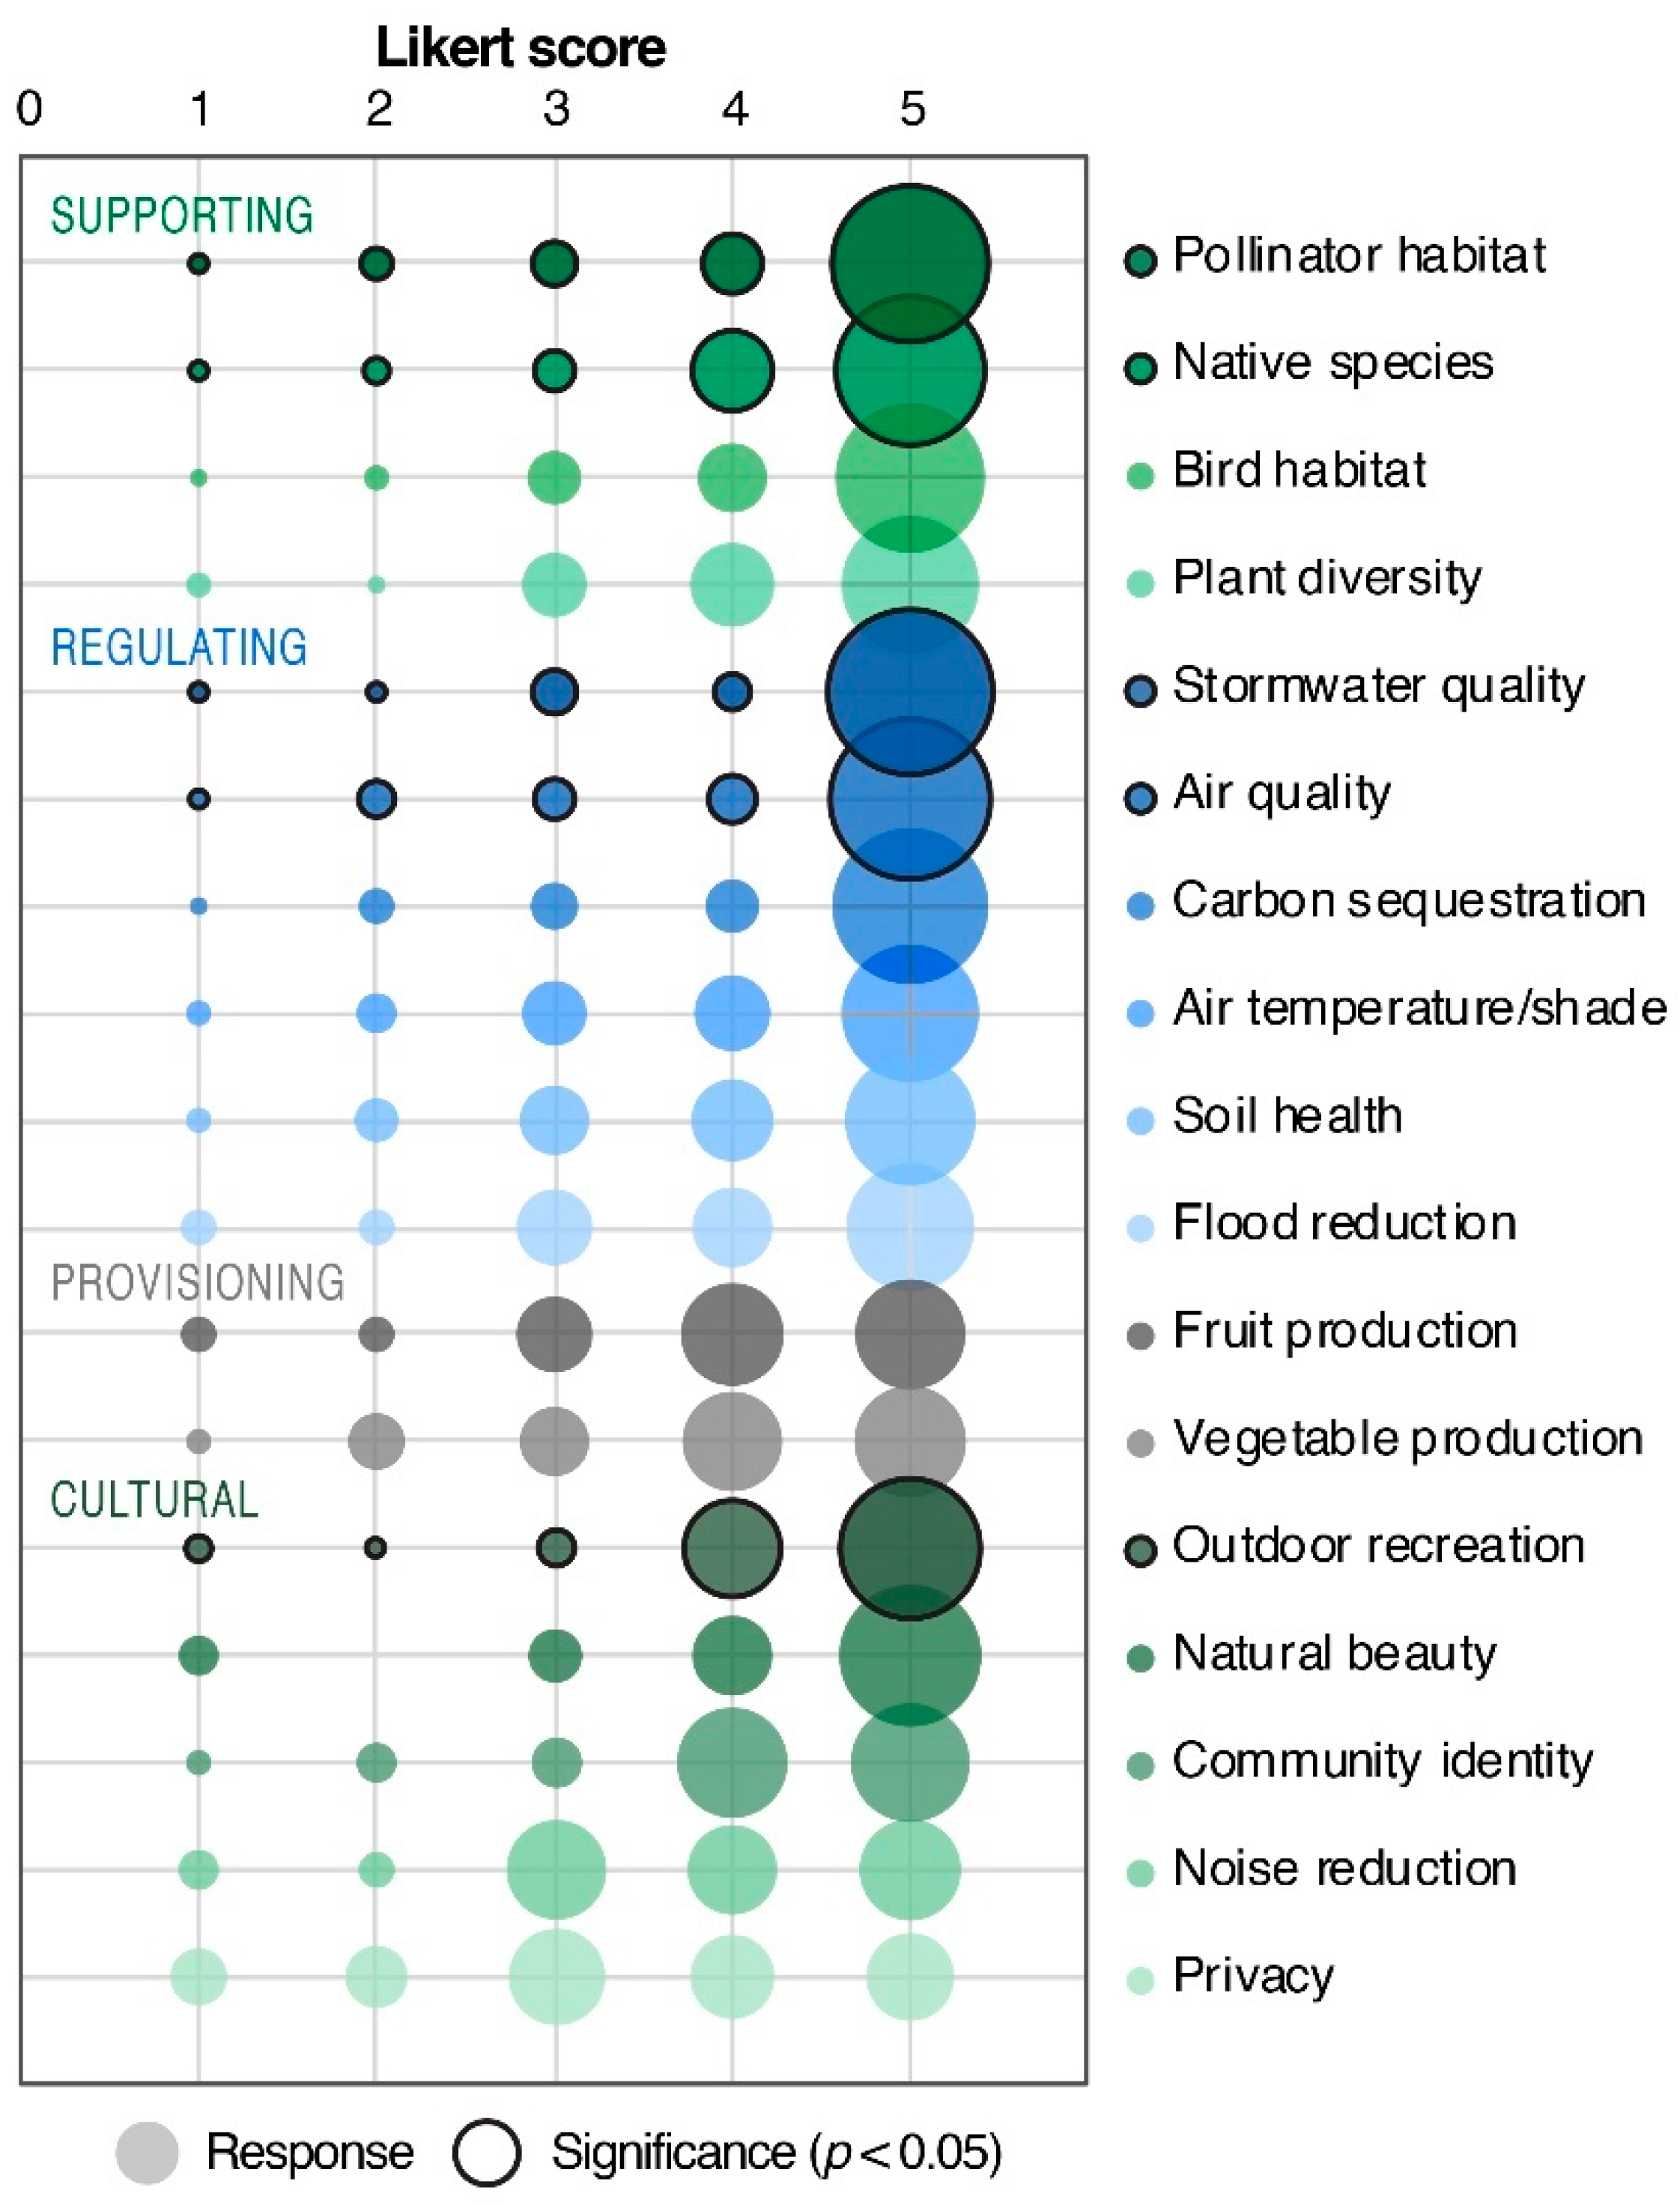
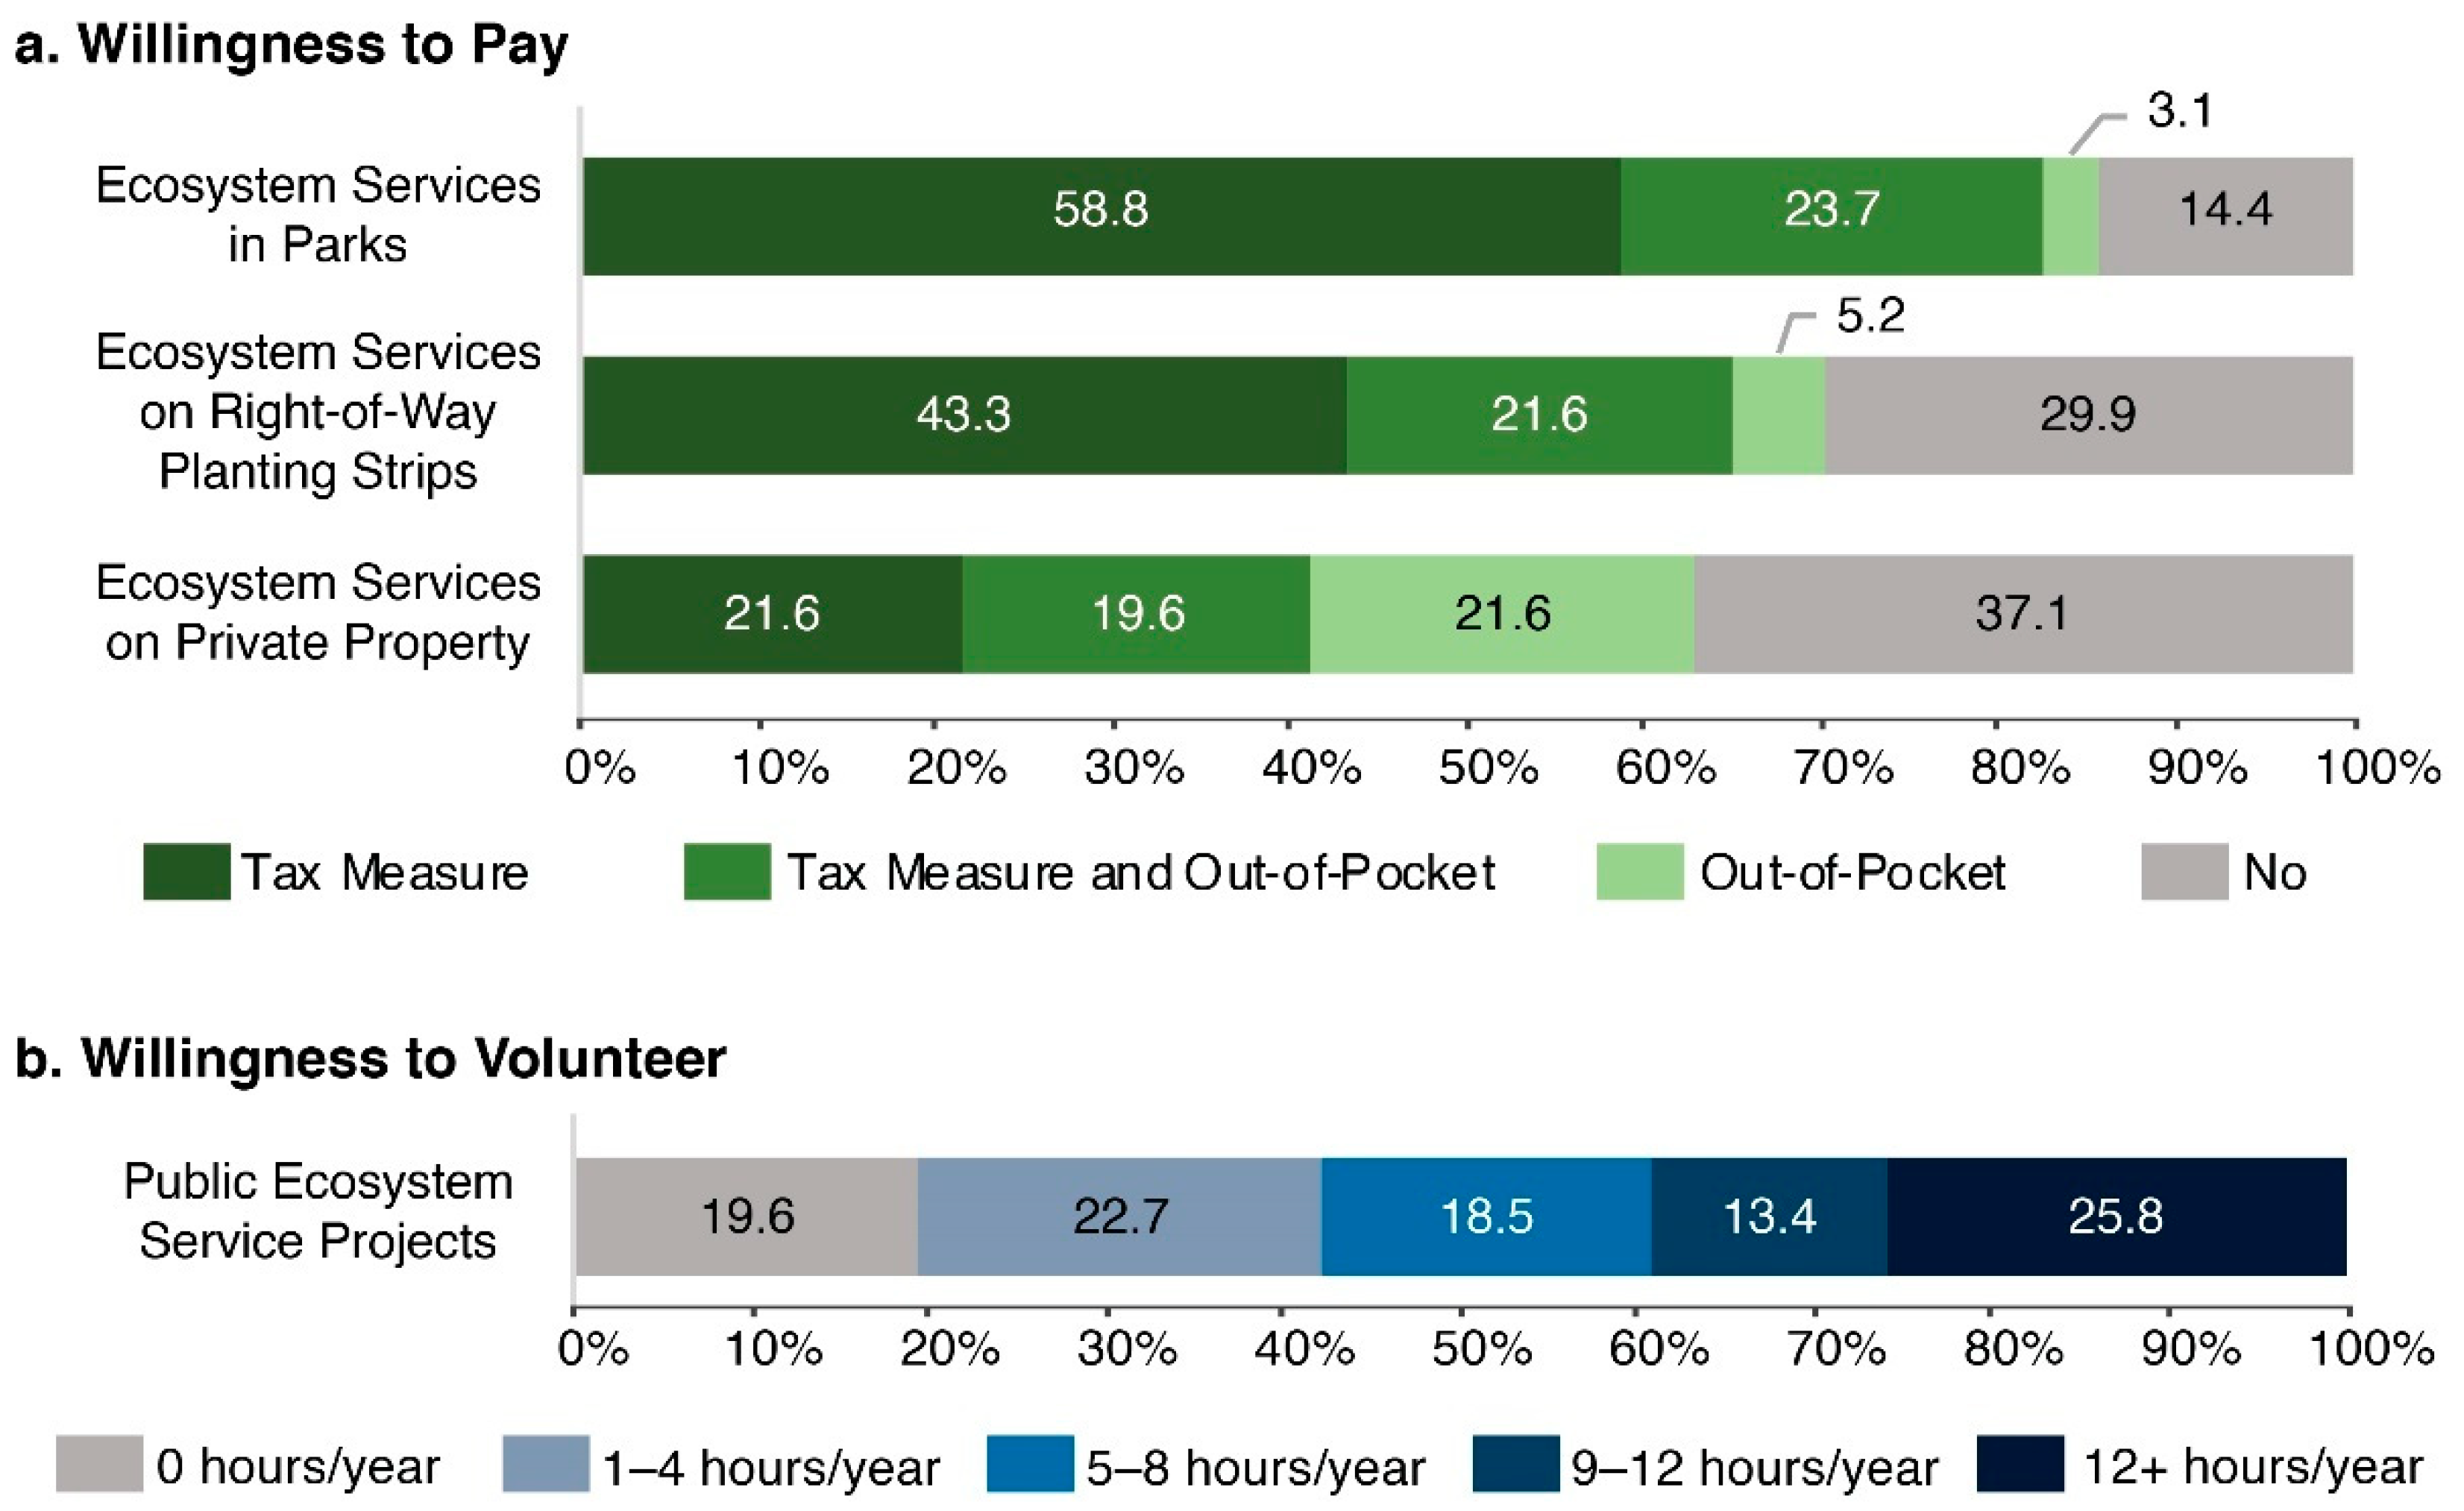
3.2. Resident Surveys—Urban ES Priorities

To understand residents’ urban ES priorities for public green space, we asked a random sample (n = 97) to rate 17 individual urban ES on a scale from 1 (“very unimportant”) to 5 (“very important”). Responses showed that outdoor recreation, stormwater quality, air quality, pollinator habitat, and native species were the top priorities (Figure 4; Table S5), showing a clear preference for supporting services; except for outdoor recreation, cultural and provisioning services were rated as relatively unimportant (Table S5).
This survey also investigated residents’ willingness to support public green infrastructure development for urban ES improvement through contributions of time and/or money. Unexpectedly, most respondents (>85%) expressed willingness to contribute financially to urban ES projects in parks, with over one-quarter supporting direct, “out-of-pocket” payments and over 80% supporting tax measures to fund public works projects (Figure 5; Table S6). Support for such projects on right-of-way strips was lower but still substantial, with over 70% stating willingness to contribute financially; again, over one-quarter supported direct payments, but in this case, only 65% supported corresponding tax measures. Additionally, a large majority (>80%) expressed the willingness to volunteer for green infrastructure projects in the neighborhood, and over half stated interest in contributing five or more hours per year (Figure 5; Table S7).

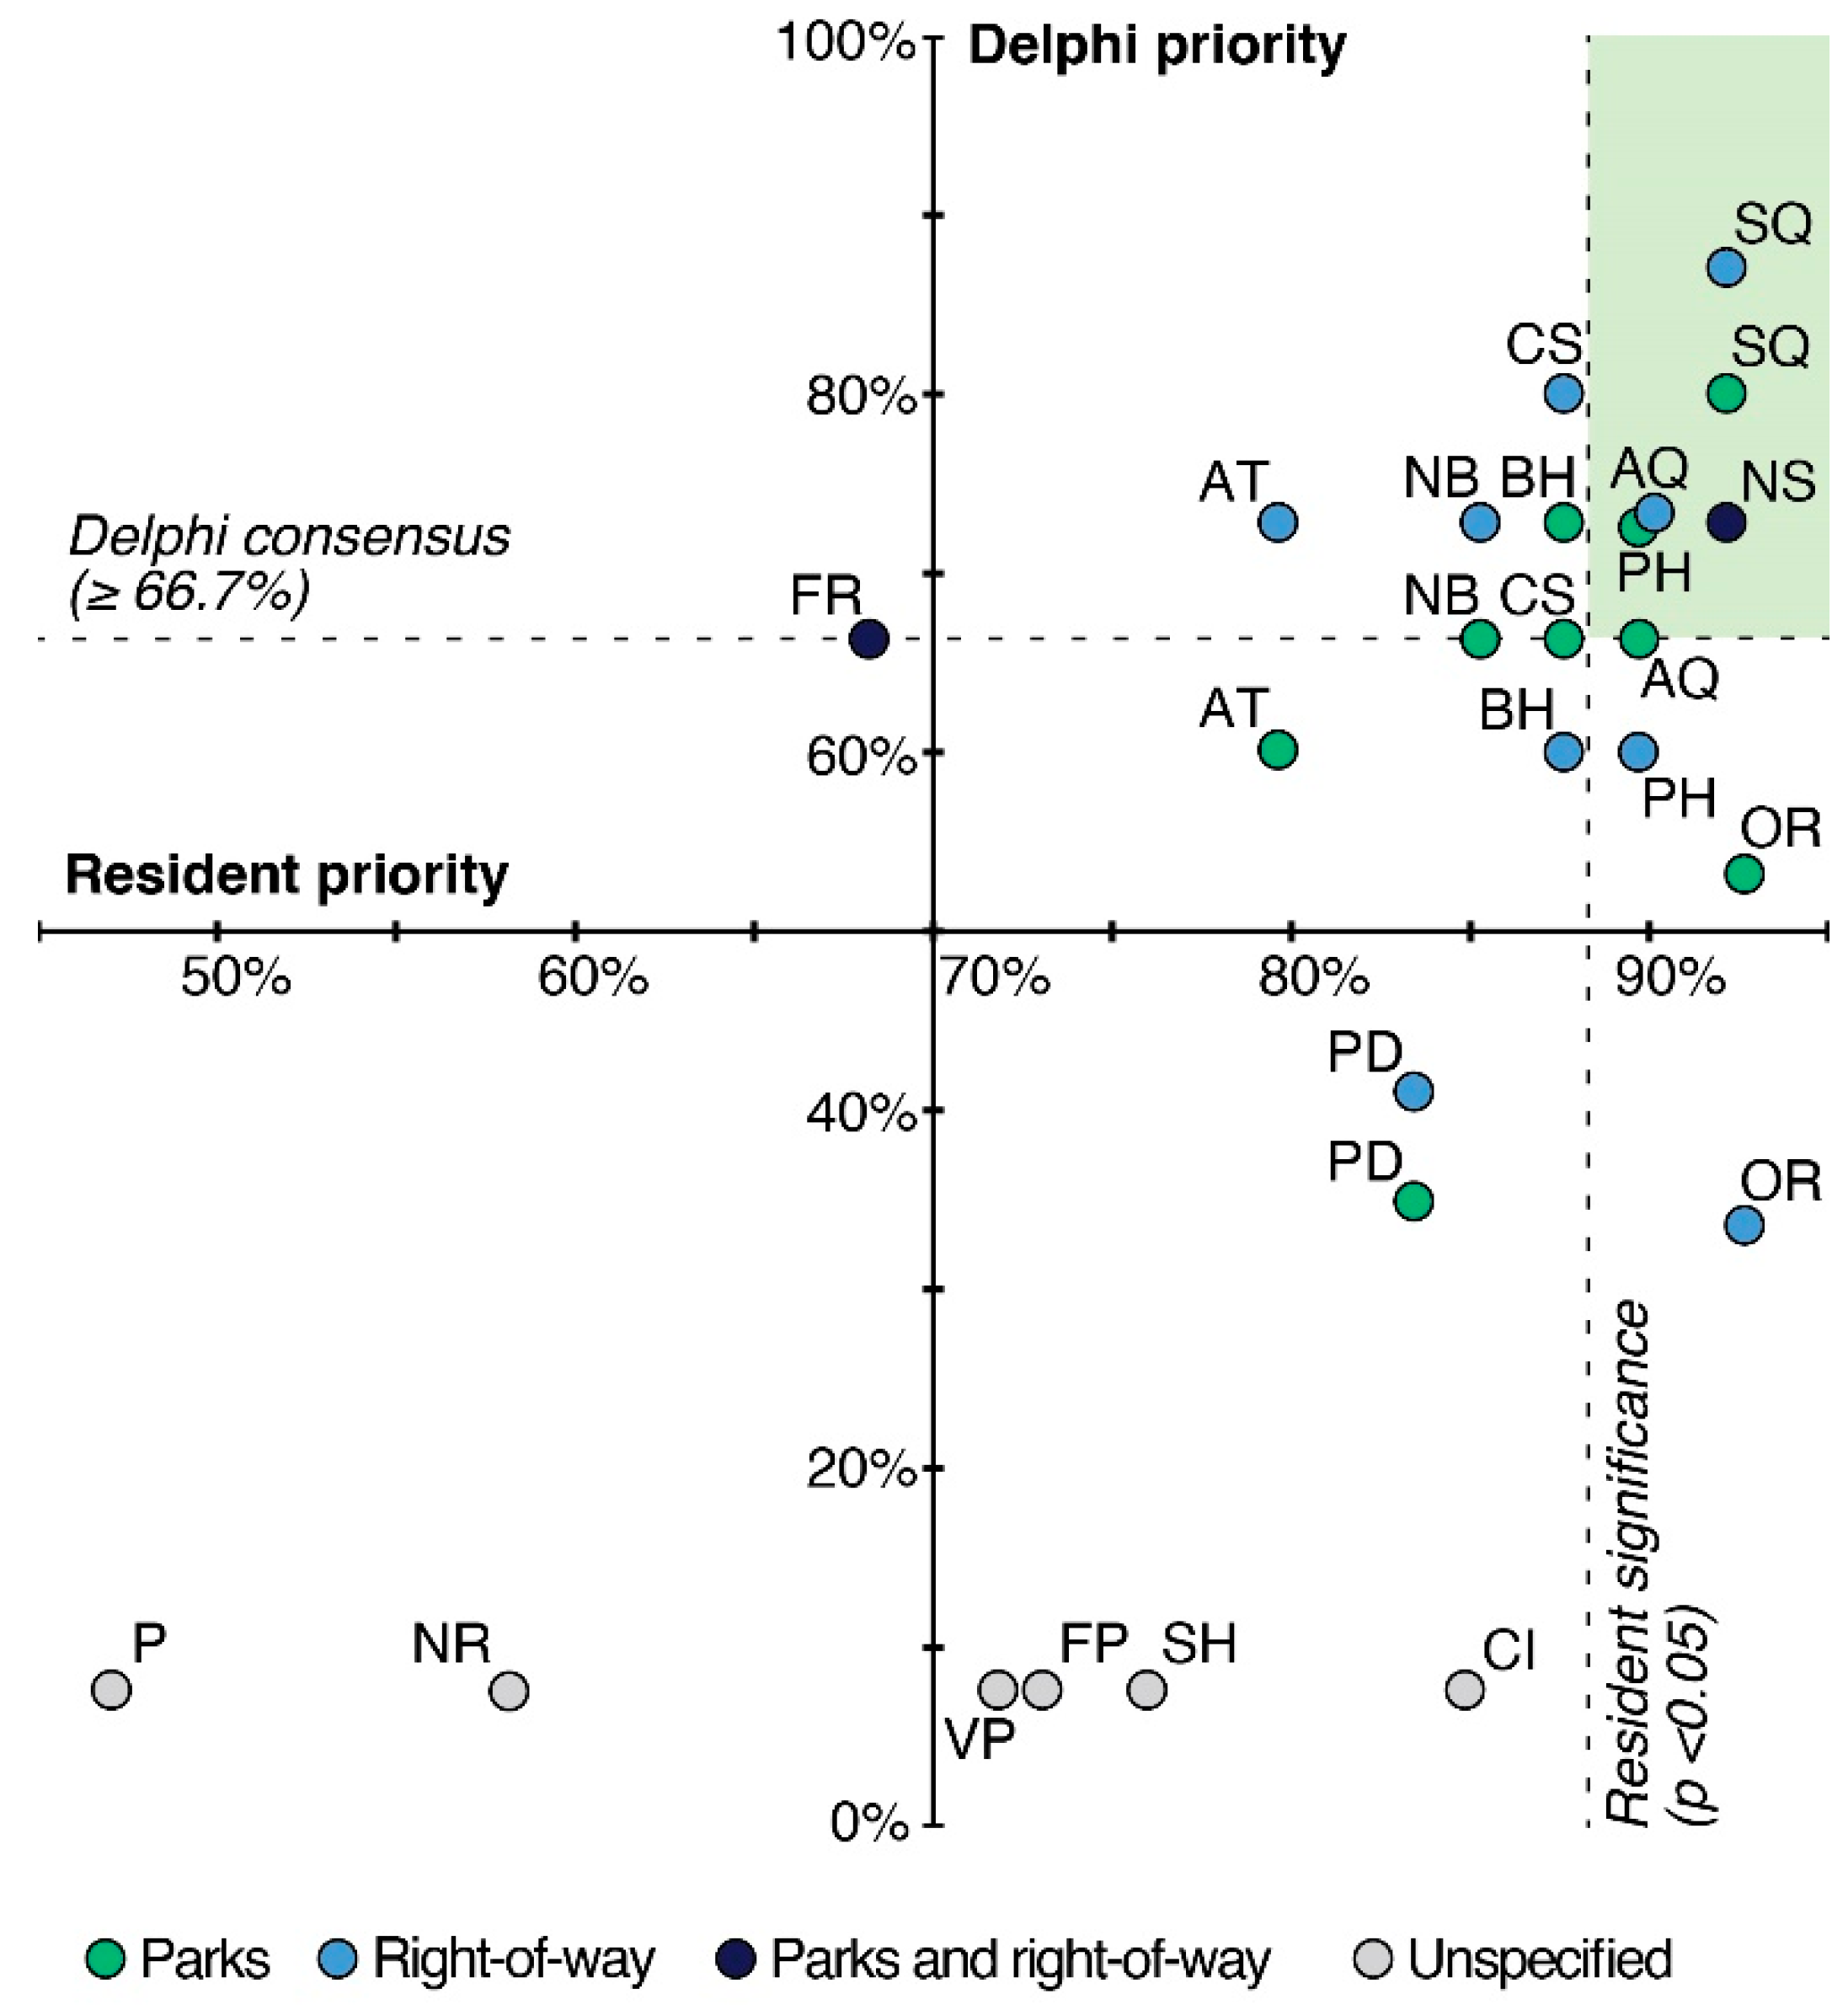
3.3. Delphi Analysis

To understand the perspectives of stakeholders involved in the planning, implementation, and management of public green space, with the potential to differ substantially from those of residents, we used a Delphi analysis to seek consensus (greater than two-thirds agreement) regarding urban ES priorities, perceived benefits of and concerns regarding lawn cover, benefits of and barriers to green infrastructure development, and strategies for overcoming these barriers. In the first-round survey, six urban ES—noise reduction, community identity, vegetable production, fruit production, improved soil health, and privacy—received sufficiently low rankings that they were excluded from the second round (Supplementary Materials Section S3). In the second-round survey, participants viewed the reduction of stormwater pollution as the top priority for both parks and for right-of-way planting strips, with over 80% agreement (Table 1; Figure 6; Figure S2). Improving air quality, supporting native species, increasing carbon sequestration, providing natural beauty, and reducing flooding were also consensus priorities for both parks and right-of-way planting strips. Providing shade for cooling was a strong priority for right-of-way strips but did not reach the consensus threshold in parks; instead, parks were most valued for providing habitat and educational opportunities. Outdoor recreation, plant diversity, erosion control, and physical and mental health benefits did not reach the two-thirds consensus threshold and were classified as non-priorities.
Participants viewed the primary benefits of public lawn in parks as providing recreational and gathering space (93% and 73% agreement, respectively) and ease of maintenance (67% agreement) (Table S8); on right-of-way strips, safety and sightlines were the only benefits that reached a consensus, with over 85% agreement. The principal concerns, in turn, both in parks and on right-of-way strips, were lawn’s limited ability to provide regulating services (i.e., air and water filtration, carbon sequestration, and flood reduction), irrigation requirements, and lack of biodiversity (Table S8). Additionally, two-thirds agreed that fertilizer, pesticide, and herbicide impacts were a concern for right-of-way planting strips (Table S8).
Accordingly, participants agreed that replacing lawn with alternative planting regimes could increase biodiversity and improve the habitat in parks while reducing stormwater runoff and improving aesthetics along right-of-way planting strips (Table S8). The possibility of impaired sightlines remained a safety concern, however, and emerged as the only consensus barrier to green infrastructure development on right-of-way planting strips (Table S8). While over half agreed that converting lawn to alternative planting regimes would increase maintenance time, complexity, and cost during the transition period, they did not reach a consensus regarding the importance of these barriers. Still, to address them, the consensus recommendation was to install attractive, easily maintained plantings and to implement educational and outreach efforts to promote support. Overall, a substantial majority (>85%) of participants supported the conversion of at least some lawn to alternative planting regimes both on right-of-way planting strips and in parks.

4. Integration of Stakeholder Priorities with Quantitative Urban ES Estimates

Although the dual values of stakeholder priorities and quantitative understanding of urban ES potential in municipal decision-making have been widely discussed [2,4,16,34,37], methods to accomplish their integration have not previously been explored. To undertake this integration, we considered a series of questions planners might ask in making urban ES-motivated vegetated land cover decisions; developed a set of alternative planting regimes that responds to these questions in the context of the FAN; and evaluated them according to the local evidence collected, yielding a single integrated result.

4.1. Planning Considerations

4.1.1. What Urban ES are Available from the Landscape?

Comprehensive ES assessments and contemporary literature addressing the location of interest are expected to reveal relevant urban ES for most locations; here, such resources (e.g., [3,37,38,39,40,41,73]) were used to identify the 17 urban ES considered in our survey (Figure 4). Since urban ES vary with climate and biome, however, analogous resources might emphasize very different services for other locations, potentially including insect or disease control, provision of raw materials, production of fresh drinking water, etc. [4,37].

4.1.2. What Land Cover Types Thrive in This Location?

Climate, soil, and existing land uses are expected to limit the land cover types eligible for consideration. Here, Eugene’s climate and the neighborhood’s existing land use and cover types (Figure 2) focused our exploration on combinations of woodlands, dispersed trees, tall shrubs, short shrubs, and grasses, including lawn.

4.1.3. What are the Urban ES Priorities of Multiple Stakeholder Groups?

Stakeholder perspectives can be revealed through interviews; in-person, mail, or online surveys; focus group discussions; and/or Delphi analyses, each with their own benefits and limitations (e.g., [74,75,76]). Here, we chose in-person surveys to reveal resident perspectives and to ensure a sufficiently large, random distribution of responses, despite the time-intensive nature of this approach, and we chose Delphi analyses to bring coherence to the input of diverse green space managers.

4.1.4. Which Urban ES can be Quantified According to Land Cover Type?

Quantitative evidence documenting the ES provided by different land cover types is growing rapidly (e.g., [14,16,77,78,79,80,81,82,83]), and where it exists, it can be used to inform decisions among alternatives. Additionally, urban ES delivery without published land cover supply rates may be evaluated qualitatively with guidance from locally or regionally available information (e.g., [84,85]), while others (e.g., natural beauty, pollinator habitat, and native plant species) may still be factored into design decisions, particularly through species choice. Here, the priorities of stormwater quality and air quality were among those with supply rates published by land cover type (e.g., [14,58]), allowing their urban ES to be quantified. Pollinator and native species habitat urban ES had not been similarly quantified, but local guidance existed in the form of a City resolution [86] and in regional lists of recommended native tree, shrub, vine, grass, and forb species (e.g., [87,88]). Using resources such as these, new plantings designed to meet quantifiable urban ES priorities may generally be chosen to meet non-quantifiable priorities as well.

4.1.5. What Barriers or Constraints Exist?

Finally, various barriers are expected to limit the resulting green infrastructure development options, particularly including lack of funds for establishment, expansion, or maintenance of green infrastructure; insufficient social support resulting from conflicting stakeholder desires; and safety or accessibility concerns (e.g., [89]). Here, Delphi participants expressed concerns consistent with those found elsewhere, focusing on cost and safety (Table 1).

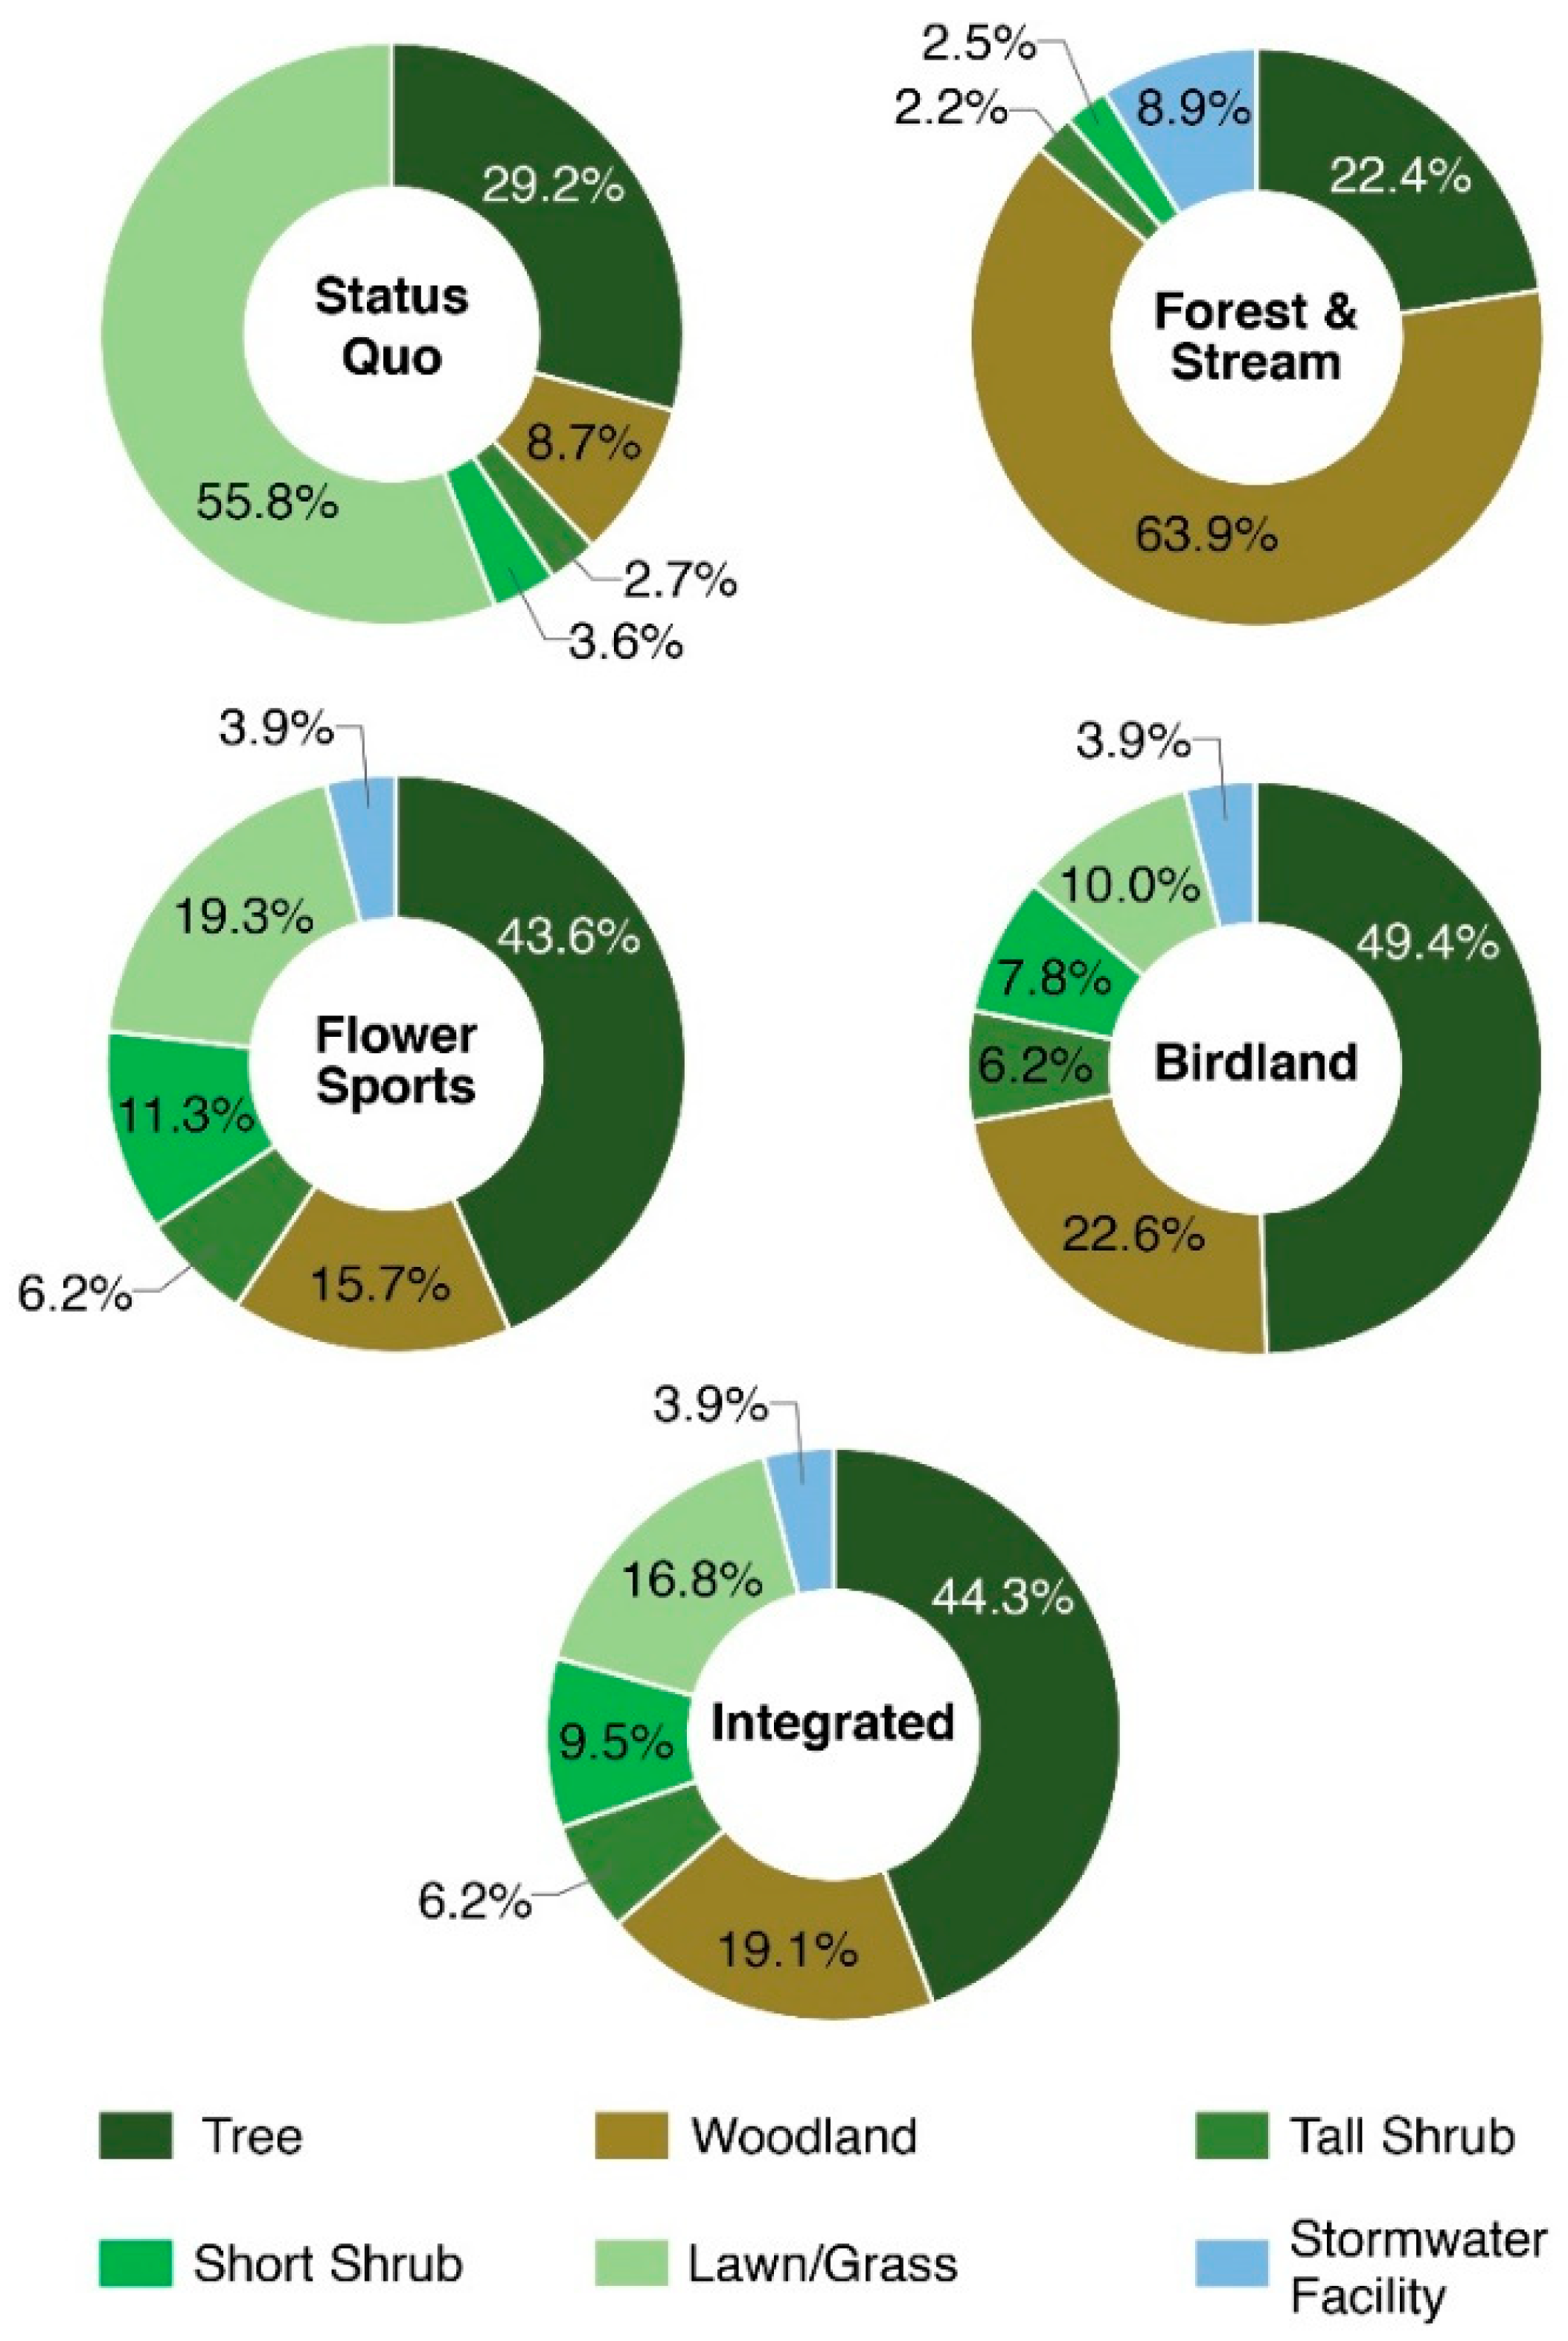
4.2. Alternative Planting Regimes

The considerations above guided the following investigation of alternative planting regimes with which to provide urban ES through the conversion of public lawn, illustrating the way in which integration of quantitative urban ES supply rates with stakeholder priorities leads to a different result than that obtained by reliance on any one line of evidence alone. The status quo, to which the others were compared, represents the result of current decision-making processes that have yielded lawn-dominated public spaces, with substantial outdoor playing field area as well as several hectares of dispersed trees and one prominent woodland park. The “Forest and Stream” alternative planting regime maximizes the provision of quantifiable, locally relevant urban ES in the study area, named to reflect the resulting emphasis on woodlands and stormwater filtration facilities. The “Birdland” regime, in contrast, represents Delphi priority urban ES, showing the value placed on bird habitat and air quality; “Flower Sports” represents resident priority urban ES, distinguished by an emphasis on pollinator habitat and outdoor recreation; and “Integration” capitalizes upon the multiple urban ES provided by individual land cover types to address both Delphi and resident priority urban ES with minimal compromise to either one. Urban ES supply rates expected of each alternative planting regime were estimated as described in Methods, with the inclusion of an additional “recreational lawn” metric reflecting the local importance of soccer and other playing fields [90].
The first alternative planting regime, Forest and Stream, maximizes the quantifiable, locally relevant urban ES of air quality, carbon storage, cooling, and runoff retention and purification, independent of stakeholder priorities. All park and schoolyard lawns are therefore converted to woodlands except for the 0.5 ha devoted to rain gardens, and nearly 4.6 ha of stormwater planters, as well as an additional 0.3 ha of trees, are added to right-of-way planting strips, sufficient to intercept stormwater runoff pollution from all public and private impervious surfaces in the neighborhood (Figure 7, Tables S10 and S11). Estimated from published supply rates [14,58], this regime would increase air purification by nearly 40%, carbon sequestration by over 150%, and runoff retention by 3.5%, as well as reduce runoff pollutant loading by 80% (Table 2). At the same time, Delphi responses suggest that the conversion of such a large area would encounter cost barriers as well as safety concerns associated with dense vegetation.
The second planting regime, Birdland, maximizes the response to the Delphi priorities of carbon storage, bird habitat in parks, air temperature regulation (i.e., cooling), and natural beauty, as well as the priorities held in common with residents (i.e., air quality, stormwater quality, and native species throughout the neighborhood, as well as pollinator habitat in parks). Clear sightlines for safety and moderate cost were prominent Delphi concerns, expressed in part as a desire to retain some existing lawn, and Birdland, therefore, converts only about one-quarter as much existing park lawn to woodland as Forest and Stream, or ~8 ha, envisioned as patches of native oak woodland and restoring native willow and ash woodland for bird habitat in the area designated as Westmoreland wetlands [91]. To address air quality and cooling priorities while maintaining ground-level openness, Birdland adds ~8 ha of dispersed trees to parks and schoolyards, capitalizing on the superior air pollutant removal rates of trees near roadways [14]. Like Forest and Stream, this regime adds 0.5 ha of rain gardens and ~5 ha of short and tall shrubs to parks, again removing all recreational lawn (i.e., softball fields) but leaving ~6 ha of other lawn intact, responding to Delphi safety concerns. On right-of-way planting strips, Birdland reduces the ~5 ha of stormwater planters proposed by Forest and Stream to ~2 ha, sufficient to manage the publicly-owned impervious area in the neighborhood (Table S10) and responding to Delphi participants’ cost concerns. The remaining ~3 ha of right-of-way lawn are then replaced with dispersed trees for air quality (Table 2). This conversion, involving ~5 fewer ha than Forest and Stream (Table S11), is estimated to increase existing air purification by over 40%, carbon storage by ~100%, and runoff retention by ~2%, as well as to provide pollutant filtration for about one-third of the neighborhood’s total stormwater runoff (Table 2).
The substantial conversion of playing-field lawn found in Forest and Stream and Birdland is reversed in the third planting regime, Flower Sports, which maximizes responses to resident priorities of outdoor recreation and pollinator habitat throughout the neighborhood, while accommodating the priorities of air and water quality held in common with Delphi respondents. A recent survey of Eugene residents showed that outdoor playing fields (i.e., recreational lawn areas) were in especially short supply compared to resident desires, providing specific, local evidence that superseded the outdoor recreation supply rates compiled by Derkzen et al. [14]. In parks and schoolyards, Flower Sports, therefore, converts only half as much lawn to native oak and ash woodland around the Westmoreland wetlands (4 ha) and ~15% less lawn (~7 ha) to dispersed trees as Birdland, while preserving the full 4 ha of existing sports fields (Table S11). Like Birdland, this regime adds 0.5 ha of rain gardens and ~5 ha of tall and short shrubs to parks, as well as ~2 ha of stormwater planters to the right-of-way, for stormwater purification; in contrast, however, it adds 2 ha of flowering shrubs to right-of-way plantings for additional pollinator habitat in place of dispersed trees. This regime converts ~5 fewer ha of lawn than Birdland but still increases air purification over the existing condition by about one-third and carbon storage by 70% while adding the ability to remove about one-third of the neighborhood’s stormwater runoff pollution.
The fourth planting regime, Integration, prioritizes the urban ES held in common by both resident and Delphi stakeholders (i.e., stormwater quality, air quality, park pollinator habitat, and native species), using quantitative supply rates to indicate the most effective land cover types for each priority and allowing other priorities to be addressed through species selection. Integration, therefore, converts an area of existing park lawn to woodland between those of Birdland and Flower Sports (6 ha), representing a significant compromise that diminishes the outdoor playing field area by one-quarter in the interest of greater air quality, cooling, bird habitat, carbon storage, and native species urban ES. Integration also includes less dispersed tree area in parks (~6 ha) than either stakeholder-driven scheme, accommodating both the outdoor playing field area prioritized by residents and woodland urban ES prioritized by Delphi participants. Like Birdland and Flower Sports, this scheme converts 0.5 ha of park lawn to rain gardens and ~5 ha to flowering shrubs. To compensate for tree loss in parks, Integration increases tree cover and diminishes flowering shrubs relative to Flower Sports on right-of-way strips; stormwater planters are maintained at the level of both stakeholder-driven schemes. Compared to Forest and Stream, which maximizes quantifiable urban ES, Integration converts ~30% less land area but provides 95% of its air quality improvement and over one-third of its stormwater pollutant filtration, while retaining over 3 ha of outdoor playing field area (Table 2). Integration also provides clear but unquantified increases in pollinator habitat and native species diversity through the inclusion of flowering shrubs and woodland, and it addresses concerns of cost and safety raised in the Delphi analysis by converting less total lawn and maintaining greater openness at ground level than Forest and Stream or even Birdland (Table S11).

5. Discussion

The investigation above addresses an emerging issue in urban ES development and planning: the integration of stakeholder perspectives with quantitative estimates of urban ES provision to inform decisions regarding future land cover [4,16,35,44]. The new method that results is then applied to an urban neighborhood through the evaluation of existing public green space and current urban ES supply rates, the collection of resident and city-wide stakeholder priorities, and the translation of these lines of evidence into a set of alternative planting regimes.

5.1. Public Green Space Inventory

The population density and land cover distribution in the study area is broadly representative of urban residential neighborhoods in the USA [92], with lawn as the dominant vegetated land cover type (Tables S3 and S4), consistent with other urban areas studied in the USA [29] and in Europe [93]. Approximately one-eighth of this area is covered by trees, again consistent with tree coverage of European research sites [93]. At the same time, resident access to public green space is substantially above the USA average [51] (Figure S1), an unusual situation in a neighborhood with below-median income [49,50] that may partly explain the high value residents placed on numerous urban ES (Figure 4). In the evaluation of existing vegetated land cover types, the combined LiDAR and NDVI-based analysis identified tree cover with high accuracy but was less accurate in identifying shrubs (Table S2); it also obscured the co-occurrence of tree cover over herbaceous ground cover and shrubs. We, therefore, recommend the incorporation of further image analysis rules and waveform LiDAR processing in future green cover analyses for the accurate distinction of these land cover types (e.g., [94,95]).
Currently, lawn provides the majority of runoff retention and recreation value in the neighborhood, while trees and woodlands provide the majority of air purification, carbon storage, and cooling, despite their much smaller area. As a result, the question faced by those responsible for increasing urban ES in Eugene (Section 5.2.) is whether existing public lawn in the neighborhood should be replaced, and if so, with what.

5.2. Stakeholder Priorities

Alignment with local values is known to be critical to the successful planning, development, and management of public urban green space [89,96], and because resident urban ES priorities are locally idiosyncratic (e.g., [40,41,42,97]), local input is necessary. Accordingly, Eugene’s Parks and Open Space Division surveyed thousands of residents and hundreds of city government and operations employees from 2015–2018, culminating in a vision and implementation plan for future green space development [48]. Although the plan focused on the recreational importance of public parks, responding to expressed desires for public gathering space and for additional sports fields [48,90], another prominent goal was to “further the parks and recreation system’s capacity to serve as critical infrastructure for clean air, clean water, flood control, carbon sequestration, and climate resilience” [48] (p. 42). Strategies to provide these urban ES have not yet been determined, but an economic assessment of current park value has been completed [98], and a $50 million tax bond was passed in 2018 to support park operations and development in preparation for future green infrastructure development to expand urban ES delivery [99], showing the timeliness and relevance of the decision-making process we contemplate here.

5.2.1. Resident Priorities

FAN residents valued urban ES highly overall, with most respondents rating 16 of the 17 listed urban ES as “moderately” to “very” important (Table S5). These primarily represented supporting or regulating services, showing the importance of ecological resilience as represented by native plant species, bird and pollinator habitat, stormwater purification, and carbon sequestration [3]. Similarly, the importance of human health and well-being was shown by the priority of air purification. These findings contrasted strongly, however, with results from Paris and Angers, France, and from Porto and Lisbon, Portugal, in which residents valued cultural and provisioning urban ES most highly [41]; Table S5. They also differed from the results of six cities in the USA, in which residents viewed native species and pollution mitigation as low priorities [100], and from results of Barcelona, Spain, in which pollination and biodiversity were low priorities as well [97]. Air purification, however, seems to be one of the few urban ES that shows consistently high priority among city dwellers globally, and the high priority of air quality found here is consistent with recent results from China, Portugal, Spain, France, and the Netherlands [39,40,41,101].
Outdoor recreation was the single cultural urban ES given high priority by FAN residents, consistent with the previous local survey [90] as well as with recent results from Finland and China [42,101]. In contrast, noise reduction and community identity were low priorities among FAN residents, consistent with findings in European cities [41] but unlike those of Guangzhou, China, in which residents ranked noise abatement as a high priority [101]. FAN residents also assigned a low priority to vegetable and fruit production, in contrast with results from cities such as Barcelona [97], revealing an unexpected lack of support given Eugene’s promotion of urban farming [102,103]. Still, this result may show that the numerous community and private gardens in the neighborhood have already met this need.

5.2.2. Delphi Analysis

The perspectives of stakeholders who would either be involved in making and influencing green infrastructure development decisions, or responsible for implementing and maintaining any changes, differed from each other substantially in the first round but partly converged during the second round, reflecting the exchange of ideas allowed by the Delphi procedure (Supplementary Materials Section S2; Table S8) and showing the promise of this method in reaching consensus among other diverse stakeholder groups. Among the consensus priorities, Delphi participants valued air and stormwater purification most highly, reflecting current urgent needs for these services at the city level (Section 2.1.). Although residential neighborhoods typically contribute fewer total suspended solids and other stormwater pollutants than do roads with heavy traffic [104], low-density development typically contributes greater runoff volume and affects more of its watershed than high-density development [105]. Delphi respondents also assigned high value to carbon sequestration, natural beauty, and native plant species (Table 1), but the prospect of dense vegetation raised safety concerns (Table S8), illustrating an internal conflict in the responses that would require eventual resolution.
In contemplating land cover changes, Delphi participants described the recreational and ease-of-maintenance benefits of lawn in neighborhood and city parks; one participant noted that city operations management is currently converting long-established landscape beds into lawn to realize these benefits, adding that lawn is viewed as “neat-looking”. These views, combined with the acknowledgment of lawn’s minimal delivery of regulating and supporting services, are consistent with those found among municipal land managers in three Swedish cities [106]; however, Delphi participants did not express concern about the costs and greenhouse gas emissions of mowing, as Swedish stakeholders did [106]. Instead, most Delphi participants viewed the “cost and complexity” associated with the installation and maintenance of alternative planting regimes as a greater set of barriers, although they did not elaborate (Table S8). Still, most Delphi participants (>85%) supported the conversion of some public lawn to alternative plantings to increase regulating and supporting services, agreeing that the primary limitation would be the preservation of sightlines along right-of-way planting strips.

5.2.3. Resident and Delphi Comparison

The differences between resident and Delphi urban ES priorities appear to have reflected their frames of reference: while Delphi participants contemplated the city scale, residents considered only their own neighborhood, as intended. Illustrating distinctly city-level concerns, one Delphi participant explained:
“What drives public agencies such as our Public Works Department is regulatory requirements—meeting the Federal Clean Water Act and our NPDES Permit requirements (e.g., reducing pollution into local waterways, reducing flooding, and improving air quality). Other items are secondary to the basic welfare and safety of the general public.”
Consistent with the diversity of stakeholder opinion found in related studies, the partial divergence among Delphi and resident priorities supports the inclusion of neighborhood-level input even in city-wide urban ES planning.
A notable discrepancy was found in the stakeholders’ view of cost barriers: while Delphi participants agreed that the cost of lawn conversion was an important barrier (Table S7), over 85% of residents expressed willingness to pay for green infrastructure development that would increase urban ES delivery through tax measures or private donations (Figure 5; Table S6). While stated willingness is not a guarantee of future payment, these findings are consistent with survey results regarding willingness to pay for urban ES in Palm Beach, FL, USA, involving biodiversity, outdoor recreation, and flood protection [107], as well as in Wuhan, Changsha, and Nanchang, China, involving climate regulation, cultural services, air quality, erosion prevention, and habitat services [108]. In each of these cases, the willingness to pay exceeded the expected cost per capita despite heterogeneity in the responses. In contrast, residents of Veneto, Italy expressed a willingness to pay for recreational services but felt that biodiversity conservation and landscape quality should be provided without taxes [109], illustrating the importance of personal history and the governmental context in such attitudes [110] and suggesting that urban planners survey their target neighborhoods before assuming particular cost barriers.

5.3. Integration of Stakeholder Priorities with Potential for Local Benefit

Recent studies have emphasized the need to integrate the ES priorities of multiple stakeholder groups with the quantitative and qualitative potential for the desired ES to be realized [2,16,35,37,44], but none have explored this further. Here, we found that such integration could be readily accomplished by evaluating questions typical of a green space planning process (Section 4.1.) in light of the corresponding stakeholder survey and urban ES supply rate evidence, yielding a set of alternative planting regimes representing each line of evidence. The ability of each vegetated land cover type to provide multiple urban ES then facilitated the creation of an integrated scheme with limited compromise to stakeholder priorities (Section 4.2.). Of central importance, the contrasts among the individual lines of evidence (i.e., quantitative considerations, resident priorities, and Delphi priorities) illustrated the value of consulting all three. In particular, safety and sightline concerns of Delphi participants moderated the extent of woodland required to maximize air and water quality services, while cost concerns limited stormwater planter area; likewise, residents’ outdoor recreation priorities limited the conversion of lawn-based playing fields and emphasized widespread inclusion of native flowering shrubs, carrying particular importance because of residents’ financial responsibility for any changes as well as their willingness to bear additional costs. As a result, the Integration planting regime is one that could not have been found by any one approach alone, adding strong support to previous recommendations that diverse stakeholder views and quantitative evidence should be considered together in developing urban ES delivery plans [37].

6. Conclusions

This study illustrates a straightforward approach for deciding among green infrastructure alternatives based on their quantitative and qualitative potential to provide urban ES of high priority to diverse stakeholders in a particular location. Here, investigating a neighborhood in Eugene, Oregon, we show how a combination of surveys, Delphi analyses, land-cover analysis, and urban ES quantification can be integrated to reveal a clear direction for urban green space development.
The importance of consulting multiple stakeholders was emphasized by the prominent areas of agreement as well as disagreement between residents and decision-makers, consistent with other studies that have queried multiple stakeholder types [111,112]. Since stakeholder support is essential to successful urban ES provision [36], and since these priorities are locally and regionally idiosyncratic (e.g., [38,40,41,101,113]), results here suggest that revealing these consensus priorities is a necessary first step and highlight the value of the Delphi technique as a method for finding consensus among diverse stakeholders. Subsequent evaluation of existing land cover and urban ES delivery showed that, despite the generally high value residents assigned to supporting and regulating urban ES, lawn currently dominates the neighborhood public green space, reflecting the priority that decision-makers have given to ease of maintenance, lawn-related outdoor recreation, and safety perceptions (Supplementary Materials Section S3; Table S8). While lawn prevalence is consistent with that found in other urban settings [29,93], the value residents placed on habitat and regulating urban ES differed from that of European residents, who generally prioritized cultural over environmental urban ES [41]. Additionally, the willingness residents expressed to support urban ES-related changes financially was unexpected, although others have documented similar results (e.g., [107]), showing that resident views should be explored before options are limited for financial reasons alone.
Evidence such as this, whether qualitative or quantitative, allows green space development to focus on the priority urban ES that can be meaningfully delivered by the land area of interest; here, air quality and stormwater quality were the clearest stakeholder priorities and had the highest potential for local delivery. Such urban ES priorities can then inform the development and evaluation of alternative planting regimes, as illustrated above (Section 4.2.), to reveal the relative benefits of each. Once large-scale land cover decisions are made, additional urban ES priorities can be addressed through species selection during green space design, as in the accommodation of pollinator habitat and native species coverage priorities above. Together, these steps provide a straightforward, flexible method suitable for widespread application in local planting decisions with the goal of increasing urban ES delivery on public land.

Supplementary Materials

The following are available online at https://www.mdpi.com/2073-445X/9/10/391/s1. Supplementary Materials, including Figures S1 and S2, Tables S1–S11, and related discussion are included in a separate file. Survey data, Delphi analysis responses, and green space quantification GIS data are available at doi:10.5281/zenodo.4044203. All other materials are available upon request.

Author Contributions

Conceptualization, E.E., A.R.R., C.E., and K.A.L.; methodology, E.E., A.R.R., C.E., and K.A.L.; formal analysis, E.E.; investigation, E.E., A.R.R., and C.E.; resources, A.R.R. and C.E.; data curation, E.E.; writing—original draft preparation, E.E. and A.R.R.; writing—review and editing, E.E., A.R.R., C.E., and K.A.L.; visualization, E.E., A.R.R., and C.E.; supervision, A.R.R., C.E., and K.A.L.; project administration, E.E., A.R.R., C.E., and K.A.L. All authors have read and agreed to the published version of the manuscript.

Funding

This research received no external funding.

Acknowledgments

We thank Peg Boulay for lending us the Garmin GPSMAP 62S for field data collection. We thank Scott Altenhoff and Justin Overdevest for early project conceptualization and for their help connecting us with Delphi participants. We also are appreciative of the Friendly Area Neighborhood residents who participated in the survey, as well as the individuals who put their time and effort into responding to the two rounds of Delphi surveys.

Conflicts of Interest

The authors declare no conflict of interest.

References

  1. Grimm, N.B.; Faeth, S.H.; Golubiewski, N.E.; Redman, C.L.; Wu, J.; Bai, X.; Briggs, J.M. Global change and the ecology of cities. Science 2008, 319, 756–760. [Google Scholar] [CrossRef] [PubMed] [Green Version]
  2. Luederitz, C.; Brink, E.; Gralla, F.; Hermelingmeier, V.; Meyer, M.; Niven, L.; Panzer, L.; Partelow, S.; Rau, A.-L.; Sasaki, R.; et al. A review of urban ecosystem services: Six key challenges for future research. Ecosyst. Serv. 2015, 14, 98–112. [Google Scholar] [CrossRef] [Green Version]
  3. Gómez-Baggethun, E.; Gren, Å.; Barton, D.N.; Langemeyer, J.; McPhearson, T.; O’Farrell, P.; Andersson, E.; Hamstead, Z.; Kremer, P. Urban Ecosystem Services. In Urbanization, Biodiversity and Ecosystem Services: Challenges and Opportunities; Springer: Dordrecht, The Netherlands, 2013; pp. 175–251. ISBN 978-94-007-7087-4. [Google Scholar]
  4. Millennium Ecosystem Assessment. Ecosystems and Human Well-Being; Island Press: Washington, DC, USA, 2005. [Google Scholar]
  5. United Nations. World Urbanization Prospects: The 2005 Revision; United Nations: New York, NY, USA, 2006. [Google Scholar]
  6. United Nations. World Urbanization Prospects: The 2014 Revision, Highlights; Department of Economic and Social Affairs: New York, NY, USA, 2014. [Google Scholar]
  7. Demuzere, M.; Orru, K.; Heidrich, O.; Olazabal, E.; Geneletti, D.; Orru, H.; Bhave, A.G.; Mittal, N.; Feliu, E.; Faehnle, M. Mitigating and adapting to climate change: Multi-functional and multi-scale assessment of green urban infrastructure. J. Environ. Manag. 2014, 146, 107–115. [Google Scholar] [CrossRef] [PubMed]
  8. Nowak, D.J.; Hirabayashi, S.; Bodine, A.; Greenfield, E. Tree and forest effects on air quality and human health in the United States. Environ. Pollut. 2014, 193, 119–129. [Google Scholar] [CrossRef] [PubMed] [Green Version]
  9. Nowak, D.J.; Dwyer, J.F. Understanding the Benefits and Costs of Urban Forest Ecosystems. In Urban and Community Forestry in the Northeast; Springer: Amsterdam, The Netherlands, 2007; pp. 25–46. ISBN 978-1-4020-4288-1. [Google Scholar]
  10. Nowak, D.J.; Greenfield, E.J.; Hoehn, R.E.; Lapoint, E. Carbon storage and sequestration by trees in urban and community areas of the United States. Environ. Pollut. 2013, 178, 229–236. [Google Scholar] [CrossRef] [Green Version]
  11. Xiao, Q.; McPherson, E.G. Rainfall interception by Santa Monica’s municipal urban forest. Urban Ecosyst. 2002, 6, 291–302. [Google Scholar] [CrossRef]
  12. Akbari, H.; Pomerantz, M.; Taha, H. Cool surfaces and shade trees to reduce energy use and improve air quality in urban areas. Sol. Energy 2001, 70, 295–310. [Google Scholar] [CrossRef]
  13. Jim, C.Y.; Chen, W.Y. Recreation–amenity use and contingent valuation of urban greenspaces in Guangzhou, China. Landsc. Urban Plan. 2006, 75, 81–96. [Google Scholar] [CrossRef]
  14. Derkzen, M.L.; van Teeffelen, A.J.A.; Verburg, P.H. Quantifying urban ecosystem services based on high-resolution data of urban green space: An assessment for Rotterdam, the Netherlands. J. Appl. Ecol. 2015, 52, 1020–1032. [Google Scholar] [CrossRef]
  15. Mexia, T.; Vieira, J.; Principe, A.; Anjos, A.; Silva, P.; Lopes, N.; Freitas, C.; Santos-Reis, M.; Correia, O.; Branquinho, C.; et al. Ecosystem services: Urban parks under a magnifying glass. Environ. Res. 2018, 160, 469–478. [Google Scholar] [CrossRef]
  16. Haase, D.; Larondelle, N.; Andersson, E.; Artmann, M.; Borgstrom, S.; Breuste, J.; Gomez-Baggethun, E.; Gren, A.; Hamstead, Z.; Hansen, R.; et al. A quantitative review of urban ecosystem service assessments: Concepts, models, and implementation. Ambio 2014, 43, 413–433. [Google Scholar] [CrossRef] [PubMed] [Green Version]
  17. Paulin, M.J.; Remme, R.P.; van der Hoek, D.C.J.; de Knegt, B.; Koopman, K.R.; Breure, A.M.; Rutgers, M.; de Nijs, T. Towards nationally harmonized mapping and quantification of ecosystem services. Sci. Total Environ. 2020, 703, 134973. [Google Scholar] [CrossRef] [PubMed]
  18. Elmqvist, T.; Setälä, H.; Handel, S.; van der Ploeg, S.; Aronson, J.; Blignaut, J.; Gómez-Baggethun, E.; Nowak, D.; Kronenberg, J.; de Groot, R. Benefits of restoring ecosystem services in urban areas. Curr. Opin. Environ. Sustain. 2015, 14, 101–108. [Google Scholar] [CrossRef] [Green Version]
  19. Jim, C.Y.; Chen, W.Y. Assessing the ecosystem service of air pollutant removal by urban trees in Guangzhou (China). J. Environ. Manag. 2008, 88, 665–676. [Google Scholar] [CrossRef] [PubMed]
  20. Tratalos, J.; Fuller, R.A.; Warren, P.H.; Davies, R.G.; Gaston, K.J. Urban form, biodiversity potential and ecosystem services. Landsc. Urban Plan. 2007, 83, 308–317. [Google Scholar] [CrossRef]
  21. Goldenberg, R.; Kalantari, Z.; Cvetkovic, V.; Mortberg, U.; Deal, B.; Destouni, G. Distinction, quantification and mapping of potential and realized supply-demand of flow-dependent ecosystem services. Sci. Total Environ. 2017, 593–594, 599–609. [Google Scholar] [CrossRef] [PubMed]
  22. Wang, Y.; Akbari, H. The effects of street tree planting on Urban Heat Island mitigation in Montreal. Sustain. Cities Soc. 2016, 27, 122–128. [Google Scholar] [CrossRef]
  23. Nowak, D.J.; Stevens, J.C.; Sisinni, S.M.; Luley, C.J. Effects of Urban Tree Management and Species Selection on Atmospheric Carbon Dioxide. J. Arboric. 2002, 28, 113–122. [Google Scholar]
  24. Townsend-Small, A.; Czimczik, C.I. Carbon sequestration and greenhouse gas emissions in urban turf. Geophys. Res. Lett. 2010, 37. [Google Scholar] [CrossRef] [Green Version]
  25. Ignatieva, M.; Ahrné, K.; Wissman, J.; Eriksson, T.; Tidåker, P.; Hedblom, M.; Kätterer, T.; Marstorp, H.; Berg, P.; Eriksson, T.; et al. Lawn as a cultural and ecological phenomenon: A conceptual framework for transdisciplinary research. Urban For. Urban Green. 2015, 14, 383–387. [Google Scholar] [CrossRef] [Green Version]
  26. Milesi, C.; Running, S.W.; Elvidge, C.D.; Dietz, J.B.; Tuttle, B.T.; Nemani, R.R. Mapping and modeling the biogeochemical cycling of turf grasses in the United States. Environ. Manag. 2005, 36, 426–438. [Google Scholar] [CrossRef] [PubMed]
  27. United States Department of Agriculture. 2018 Irrigation and Water Management Survey; 2017 Census of Agriculture; US Department of Agriculture: Washington, DC, USA, 2019.
  28. United States Department of Agriculture. Land Use and Land Cover Estimates for the United States. Available online: https://www.ers.usda.gov/about-ers/partnerships/strengthening-statistics-through-the-icars/land-use-and-land-cover-estimates-for-the-united-states/#d (accessed on 27 May 2020).
  29. Robbins, P.; Birkenholtz, T. Turfgrass revolution: Measuring the expansion of the American lawn. Land Use Policy 2003, 20, 181–194. [Google Scholar] [CrossRef]
  30. Qian, Y.; Follett, R.F.; Kimble, J.M. Soil Organic Carbon Input from Urban Turfgrasses. Soil Sci. Soc. Am. J. 2010, 74. [Google Scholar] [CrossRef]
  31. Lerman, S.B.; Contosta, A.R. Lawn mowing frequency and its effects on biogenic and anthropogenic carbon dioxide emissions. Landsc. Urban Plan. 2019, 182, 114–123. [Google Scholar] [CrossRef]
  32. Monteiro, J.A. Ecosystem services from turfgrass landscapes. Urban For. Urban Green. 2017, 26, 151–157. [Google Scholar] [CrossRef]
  33. Nowak, D.J.; Heisler, G.M. Air Quality Effects of Urban Trees and Parks; National Recreation and Park Association: Ashburn, VA, USA, 2010. [Google Scholar]
  34. Matthews, T.; Lo, A.Y.; Byrne, J.A. Reconceptualizing green infrastructure for climate change adaptation: Barriers to adoption and drivers for uptake by spatial planners. Landsc. Urban Plan. 2015, 138, 155–163. [Google Scholar] [CrossRef]
  35. De Groot, R.S.; Fisher, B.; Christie, M.; Aronson, J.; Braat, L.; Gowdy, J.; Haines-Young, R.; Maltby, E.; Neuville, A.; Polasky, S.; et al. Integrating the Ecological and Economic Dimensions in Biodiversity and Ecosystem Service Valuation. In The Economics of Ecosystems and Biodiversity: Ecological and Economic Foundations; Kumar, P., Ed.; Routledge: Abingdon-on-Thames, UK, 2010; pp. 9–40. [Google Scholar]
  36. Menzel, S.; Teng, J. Ecosystem services as a stakeholder-driven concept for conservation science. Conserv. Biol. 2010, 24, 907–909. [Google Scholar] [CrossRef]
  37. TEEB. TEEB Manual for Cities—Ecosystem Services in Urban Management; TEEB: Geneva, Switzerland, 2011. [Google Scholar]
  38. Castro, A.J.; Martín-López, B.; García-Llorente, M.; Aguilera, P.A.; López, E.; Cabello, J. Social preferences regarding the delivery of ecosystem services in a semiarid Mediterranean region. J. Arid Environ. 2011, 75, 1201–1208. [Google Scholar] [CrossRef]
  39. Castro, A.J.; Verburg, P.H.; Martín-López, B.; Garcia-Llorente, M.; Cabello, J.; Vaughn, C.C.; López, E. Ecosystem service trade-offs from supply to social demand: A landscape-scale spatial analysis. Landsc. Urban Plan. 2014, 132, 102–110. [Google Scholar] [CrossRef]
  40. Derkzen, M.L.; van Teeffelen, A.J.A.; Verburg, P.H. Green infrastructure for urban climate adaptation: How do residents’ views on climate impacts and green infrastructure shape adaptation preferences? Landsc. Urban Plan. 2017, 157, 106–130. [Google Scholar] [CrossRef]
  41. Madureira, H.; Nunes, F.; Oliveira, J.V.; Cormier, L.; Madureira, T. Urban residents’ beliefs concerning green space benefits in four cities in France and Portugal. Urban For. Urban Green. 2015, 14, 56–64. [Google Scholar] [CrossRef]
  42. Tyrväinen, L.; Mäkinen, K.; Schipperijn, J. Tools for mapping social values of urban woodlands and other green areas. Landsc. Urban Plan. 2007, 79, 5–19. [Google Scholar] [CrossRef]
  43. Young, R.F. Managing municipal green space for ecosystem services. Urban For. Urban Green. 2010, 9, 313–321. [Google Scholar] [CrossRef]
  44. Müller, F.; De Groot, R.; Willemen, L. Ecosystem Services at the Landscape Scale: The Need for Integrative Approaches. LO 2010, 23, 1–11. [Google Scholar] [CrossRef]
  45. US Census Bureau. Oregon: 2010 Population and Housing Unit Counts; U.S. Department of Commerce: Washington, DC, USA, 2012.
  46. American Lung Association. State of the Air 2019; American Lung Association: Chicago, IL, USA, 2019. [Google Scholar]
  47. Benninghoff, B. NPDES Municipal Separate Storm Sewer System Permit: Evaluation and Fact Sheet; Oregon Department of Environmental Quality: Portland, OR, USA, 2010.
  48. City of Eugene. Picture. Plan. Play. A Vision and Implementation Plan for Eugene’s Parks and Recreation System; City of Eugene: Eugene, OR, USA, 2018.
  49. Diebel, J.; Norda, J.; Kretchmer, O. Overview of Friendly Area, Eugene, Oregon. Available online: https://statisticalatlas.com/neighborhood/Oregon/Eugene/Friendly-Area/Overview (accessed on 8 January 2019).
  50. U.S. Census Bureau. U.S. Census Bureau QuickFacts. Available online: https://www.census.gov/quickfacts/fact/table/US/PST045219 (accessed on 14 August 2020).
  51. The Trust for Public Land ParkScore index: The most comprehensive evaluation of park access and quality in the 100 largest U.S. cities. Available online: https://www.tpl.org/parkscore (accessed on 13 October 2020).
  52. Davies, Z.G.; Edmondson, J.L.; Heinemeyer, A.; Leake, J.R.; Gaston, K.J. Mapping an urban ecosystem service: Quantifying above-ground carbon storage at a city-wide scale. J. Appl. Ecol. 2011, 48, 1125–1134. [Google Scholar] [CrossRef] [Green Version]
  53. Zulian, G.; Liekens, I.; Broekx, S.; Kabisch, N.; Kopperoinen, L.; Geneletti, D. Mapping Urban Ecosystem Services. In Mapping Ecosystem Services; Burkhard, B., Maes, J., Eds.; Pensoft Publishers: Sofia, Bulgaria, 2017; pp. 312–318. [Google Scholar]
  54. ESRI. ArcMap 10.7; Environmental Systems Research Institute: Redlands, CA, USA, 2019. [Google Scholar]
  55. Senanayake, I.P.; Welivitiya, W.D.D.P.; Nadeeka, P.M. Urban green spaces analysis for development planning in Colombo, Sri Lanka, utilizing THEOS satellite imagery—A remote sensing and GIS approach. Urban For. Urban Green. 2013, 12, 307–314. [Google Scholar] [CrossRef]
  56. Oregon Department of Geology and Mineral Industries. OLC Middle Fork Willamette River 2015 Lidar Project Lidar QC Report; Oregon Department of Geology and Mineral Industries: Portland, OR, USA, 2017.
  57. Geneletti, D.; Cortinovis, C.; Zardo, L.; Esmail, B.A. Planning for Ecosystem Services in Cities; SpringerBriefs in Environmental Science; Springer International Publishing: Cham, Switzerland, 2020; ISBN 978-3-030-20023-7. [Google Scholar]
  58. City of Eugene. Stormwater Management Manual; City of Eugene: Eugene, OR, USA, 2014.
  59. ESRI. ArcGIS Pro 2.6; Environmental Systems Research Institute: Redlands, CA, USA, 2020. [Google Scholar]
  60. Cariñanos, P.; Calaza-Martínez, P.; O’Brien, L.; Calfapietra, C. The Cost of Greening: Disservices of Urban Trees. In The Urban Forest; Pearlmutter, D., Calfapietra, C., Samson, R., O’Brien, L., Krajter Ostoić, S., Sanesi, G., Alonso del Amo, R., Eds.; Future City; Springer International Publishing: Cham, Switzerland, 2017; Volume 7, pp. 79–87. ISBN 978-3-319-50279-3. [Google Scholar]
  61. Escobedo, F.J.; Kroeger, T.; Wagner, J.E. Urban forests and pollution mitigation: Analyzing ecosystem services and disservices. Environ. Pollut. 2011, 159, 2078–2087. [Google Scholar] [CrossRef]
  62. Juanita, A.-D.; Ignacio, P.; Jorgelina, G.-A.; Cecilia, A.-S.; Carlos, M.; Francisco, N. Assessing the effects of past and future land cover changes in ecosystem services, disservices and biodiversity: A case study in Barranquilla Metropolitan Area (BMA), Colombia. Ecosyst. Serv. 2019, 37, 100915. [Google Scholar] [CrossRef]
  63. Loewenthal, K. An Introduction to Psychological Tests and Scales; Taylor & Francis Inc.: New York, NY, USA, 2001; Volume 42. [Google Scholar]
  64. R Core Team. R: A Language and Environment for Statistical Computing; R Foundation for Statistical Computing: Vienna, Austria, 2019. [Google Scholar]
  65. Dalkey, N.C. The Delphi Method: An Experimental Study of Group Opinion; The RAND Corporation: Santa Monica, CA, USA, 1969. [Google Scholar]
  66. Thrall, G.I.; McCartney, J.W. Keeping the Gardbage Out: Using Delphi Method for GIS Criteria. Geogr. Inf. Syst. 1991, 1, 46–52. [Google Scholar]
  67. Loughlin, K.G.; Moore, L.F. Using Delphi to achieve congruent objectives and activities in a pediatrics department. Acad. Med. 1979, 54, 101–106. [Google Scholar] [CrossRef]
  68. Putnam, J.W.; Spiegel, A.N.; Bruininks, R.H. Future Directions in Education and Inclusion of Students with Disabilities: A Delphi Investigation. Except. Child. 2016, 61, 553–576. [Google Scholar] [CrossRef]
  69. Stewart, J.; O’Halloran, C.; Harrigan, P.; Spencer, J.A.; Barton, J.R.; Singleton, S.J. Identifying appropriate tasks for the preregistration year: Modified Delphi technique. BMJ 1999, 319, 224–229. [Google Scholar] [CrossRef] [PubMed] [Green Version]
  70. Von der Gracht, H.A. Consensus measurement in Delphi studies. Technol. Forecast. Soc. Chang. 2012, 79, 1525–1536. [Google Scholar] [CrossRef]
  71. City of Eugene. Eugene Charter; City of Eugene: Eugene, OR, USA, 2002.
  72. City of Ashland. City Charter; City of Ashland: Ashland, OR, USA, 2007.
  73. De Groot, R.S.; Wilson, M.A.; Boumans, R.M.J. A typology for the classification, description and valuation of ecosystem functions, goods and services. Ecol. Econ. 2002, 41, 393–408. [Google Scholar] [CrossRef] [Green Version]
  74. Bidegain, I.; Cerda, C.; Catalán, E.; Tironi, A.; López-Santiago, C. Social preferences for ecosystem services in a biodiversity hotspot in South America. PLoS ONE 2019, 14, e0215715. [Google Scholar] [CrossRef]
  75. Schmidt, K.; Walz, A.; Martín-López, B.; Sachse, R. Testing socio-cultural valuation methods of ecosystem services to explain land use preferences. Ecosyst. Serv. 2017, 26, 270–288. [Google Scholar] [CrossRef]
  76. Stålhammar, S.; Pedersen, E. Recreational cultural ecosystem services: How do people describe the value? Ecosyst. Serv. 2017, 26, 1–9. [Google Scholar] [CrossRef]
  77. Costanza, R.; d’Arge, R.; de Groot, R.; Farber, S.; Grasso, M.; Hannon, B.; Limburg, K.; Naeem, S.; O’Neill, R.V.; Paruelo, J.; et al. The value of the world’s ecosystem services and natural capital. Nature 1997, 387, 253–260. [Google Scholar] [CrossRef]
  78. Hardelin, J.; Lankoski, J. Land use and ecosystem services; OECD Food, Agriculture and Fisheries Papers; OECD Publishing: Paris, France, 2018; Volume 114. [Google Scholar]
  79. Hasan, S.; Shi, W.; Zhu, X. Impact of land use land cover changes on ecosystem service value—A case study of Guangdong, Hong Kong, and Macao in South China. PLoS ONE 2020, 15, e0231259. [Google Scholar] [CrossRef] [Green Version]
  80. Kreuter, U.P.; Harris, H.G.; Matlock, M.D.; Lacey, R.E. Change in ecosystem service values in the San Antonio area, Texas. Ecol. Econ. 2001, 39, 333–346. [Google Scholar] [CrossRef]
  81. Lopes, L.F.G.; dos Santos Bento, J.M.R.; Arede Correia Cristovão, A.F.; Baptista, F.O. Exploring the effect of land use on ecosystem services: The distributive issues. Land Use Policy 2015, 45, 141–149. [Google Scholar] [CrossRef] [Green Version]
  82. Martínez-Harms, M.J.; Balvanera, P. Methods for mapping ecosystem service supply: A review. Int. J. Biodivers. Sci. Ecosyst. Serv. Manag. 2012, 8, 17–25. [Google Scholar] [CrossRef]
  83. Zardo, L.; Geneletti, D.; Pérez-Soba, M.; Van Eupen, M. Estimating the cooling capacity of green infrastructures to support urban planning. Ecosyst. Serv. 2017, 26, 225–235. [Google Scholar] [CrossRef]
  84. Lee-Mäder, E.; Fowler, J.; Vento, J.; Hopwood, J. 100 Plants to Feed the Bees: Provide a Healthy Habitat to Help Pollinators Thrive; Storey Publishing: North Adams, MA, USA, 2016; ISBN 978-1-61212-701-9. [Google Scholar]
  85. Attracting Native Pollinators: Protecting North America’s Bees and Butterflies: The Xerces Society Guide; Lee-Mäder, E.; Xerces Society (Eds.) Storey Pub: North Adams, MA, USA, 2011; ISBN 978-1-60342-695-4. [Google Scholar]
  86. City of Eugene. Council Resolution No. 5240: A Resolution Designating Eugene as a Bee City USA Affiliate; City of Eugene: Eugene, OR, USA, 2018.
  87. Adamson, N.L.; Borders, B.; Cruz, J.K.; Jordan, S.F.; Gill, K.; Hopwood, J.; Lee-Mäder, E.; Minnerath, A.; Vaughan, M. Pollinator Plants: Maritime Northwest Region; The Xerces Society: Portland, OR, USA, 2017. [Google Scholar]
  88. Metro. Native plants for Willamette Valley yards booklet. Available online: https://www.oregonmetro.gov/native-plants-willamette-valley-yards-booklet (accessed on 15 May 2020).
  89. Biernacka, M.; Kronenberg, J. Classification of institutional barriers affecting the availability, accessibility and attractiveness of urban green spaces. Urban For. Urban Green. 2018, 36, 22–33. [Google Scholar] [CrossRef]
  90. City of Eugene. Parks and Recreation System Needs Assessment Report; City of Eugene: Eugene, OR, USA, 2016.
  91. City of Eugene. Water Resource Conservation Maps. Available online: https://www.eugene-or.gov/808/Water-Resource-Conservation-Maps (accessed on 4 August 2020).
  92. Romem, I. Can U.S. Cities Compensate for Curbing Sprawl by Growing Denser? Buildzoom: San Francisco, CA, USA, 2016. [Google Scholar]
  93. Hedblom, M.; Lindberg, F.; Vogel, E.; Wissman, J.; Ahrné, K. Estimating urban lawn cover in space and time: Case studies in three Swedish cities. Urban Ecosyst. 2017, 20, 1109–1119. [Google Scholar] [CrossRef] [Green Version]
  94. Casalegno, S.; Anderson, K.; Hancock, S.; Gaston, K.J. Improving models of urban greenspace: From vegetation surface cover to volumetric survey, using waveform laser scanning. Methods Ecol. Evol. 2017, 8, 1443–1452. [Google Scholar] [CrossRef]
  95. Parent, J.R.; Volin, J.C.; Civco, D.L. A fully-automated approach to land cover mapping with airborne LiDAR and high resolution multispectral imagery in a forested suburban landscape. ISPRS J. Photogramm. Remote Sens. 2015, 104, 18–29. [Google Scholar] [CrossRef]
  96. Faehnle, M.; Bäcklund, P.; Tyrväinen, L. Looking for the role of nature experiences in planning and decision making: A perspective from the Helsinki Metropolitan Area. Sustain. Sci. Pract. Policy 2011, 7, 45–55. [Google Scholar] [CrossRef]
  97. Camps-Calvet, M.; Langemeyer, J.; Calvet-Mir, L.; Gómez-Baggethun, E. Ecosystem services provided by urban gardens in Barcelona, Spain: Insights for policy and planning. Environ. Sci. Policy 2016, 62, 14–23. [Google Scholar] [CrossRef]
  98. Earth Economics. Nature’s Value; An Economic View of Eugene’s Parks, Natural Areas and Urban Forest; City of Eugene: Eugene, OR, USA, 2014.
  99. City of Eugene. Eugene Parks & Recreation Ballot Measures 2018; City of Eugene: Eugene, OR, USA, 2018.
  100. Larson, K.L.; Nelson, K.C.; Samples, S.R.; Hall, S.J.; Bettez, N.; Cavender-Bares, J.; Groffman, P.M.; Grove, M.; Heffernan, J.B.; Hobbie, S.E.; et al. Ecosystem services in managing residential landscapes: Priorities, value dimensions, and cross-regional patterns. Urban Ecosyst. 2015, 19, 95–113. [Google Scholar] [CrossRef] [Green Version]
  101. Jim, C.Y.; Chen, W.Y. Perception and Attitude of Residents Toward Urban Green Spaces in Guangzhou (China). Environ. Manag. 2006, 38, 338–349. [Google Scholar] [CrossRef] [PubMed]
  102. City of Eugene. Community Gardens: Gardener’s Manual. Available online: https://www.eugene-or.gov/DocumentCenter/View/31611/Community-Gardens-Spring-2017-Manual?bidId= (accessed on 14 August 2020).
  103. City of Eugene Friendly Area Neighbors. Available online: https://www.eugene-or.gov/1374/Friendly-Area-Neighbors (accessed on 21 May 2020).
  104. Wang, S.; He, Q.; Ai, H.; Wang, Z.; Zhang, Q. Pollutant concentrations and pollution loads in stormwater runoff from different land uses in Chongqing. J. Environ. Sci. 2013, 25, 502–510. [Google Scholar] [CrossRef]
  105. Richards, L. Protecting Water Resources with Higher-Density Development; Environmental Protection Agency: Washington, DC, USA, 2006.
  106. Ignatieva, M.; Eriksson, F.; Eriksson, T.; Berg, P.; Hedblom, M. The lawn as a social and cultural phenomenon in Sweden. Urban For. Urban Green. 2017, 21, 213–223. [Google Scholar] [CrossRef]
  107. Pienaar, E.F.; Soto, J.R.; Lai, J.H.; Adams, D.C. Would County Residents Vote for an Increase in Their Taxes to Conserve Native Habitat and Ecosystem Services? Funding Conservation in Palm Beach County, Florida. Ecol. Econ. 2019, 159, 24–34. [Google Scholar] [CrossRef]
  108. Tian, Y.; Wu, H.; Zhang, G.; Wang, L.; Zheng, D.; Li, S. Perceptions of ecosystem services, disservices and willingness-to-pay for urban green space conservation. J. Environ. Manag. 2020, 260, 110140. [Google Scholar] [CrossRef]
  109. Gatto, P.; Vidale, E.; Secco, L.; Pettenella, D. Exploring the willingness to pay for forest ecosystem services by residents of the Veneto Region. Bio-Based Appl. Econ. 2013, 21–43. [Google Scholar] [CrossRef]
  110. Sato, M.; Ushimaru, A.; Minamoto, T. Effect of different personal histories on valuation for forest ecosystem services in urban areas: A case study of Mt. Rokko, Kobe, Japan. Urban For. Urban Green. 2017, 28, 110–117. [Google Scholar] [CrossRef]
  111. McNally, C.G.; Gold, A.J.; Pollnac, R.B.; Kiwango, H.R. Stakeholder perceptions of ecosystem services of the Wami River and Estuary. ES 2016, 21, art34. [Google Scholar] [CrossRef] [Green Version]
  112. Zoderer, B.M.; Tasser, E.; Carver, S.; Tappeiner, U. Stakeholder perspectives on ecosystem service supply and ecosystem service demand bundles. Ecosyst. Serv. 2019, 37, 100938. [Google Scholar] [CrossRef]
  113. Larson, L.R.; Jennings, V.; Cloutier, S.A. Public Parks and Wellbeing in Urban Areas of the United States. PLoS ONE 2016, 11, e0153211. [Google Scholar] [CrossRef]
Figure 1. Location of the Friendly Area Neighborhood in Eugene, Oregon.
Land 09 00391 g001
Figure 2. Land cover type and distribution. (a) Lawn size and distribution in right-of-way zones in the Friendly Area Neighborhood, evaluated by ground measurement, and (b) vegetation classes and distributions on all public lands in the neighborhood identified using NDVI and LiDAR data.
Land 09 00391 g002
Figure 3. Urban ecosystem services (ES) provided by existing vegetated land cover. Existing vegetated land cover distribution (a), detailed in Figure 2, and the corresponding provision of urban ES by vegetated land cover type: (b) runoff retention; (c) air purification; (d) carbon storage; (e) cooling fraction; and (f) recreation, as evaluated by supply rates compiled by Derkzen et al. [14], summarized in Table S4.
Land 09 00391 g003
Figure 4. Ratings by Friendly Area Neighborhood residents (n = 97), from 1 (very unimportant) to 5 (very important), of 17 urban ecosystem services (ES). Colors designate urban ES categories (green: supporting; blue: regulating; brown: provisioning; olive: cultural); bubble size designates frequency of the indicated response; outer black line indicates significance (p < 0.05) according to chi-square tests in which responses of 1–3 and 4–5 were binned to compare each individual urban ES to overall urban ES. Data, including Cronbach’s alpha values for each urban ES domain, are tabulated in Table S5.
Land 09 00391 g004
Figure 5. (a) Residents’ stated willingness by in-person survey (n = 97) to financially support green infrastructure development in parks, in the public right-of-way, and on private property that increases urban ecosystem services (ES) through tax measures alone; tax measures combined with personal contributions; personal contributions alone; or none of the above. (b) Residents’ stated willingness by in-person survey (n = 97) to volunteer time toward the development of public urban ES projects from 0 to 12+ h per year. Data are provided in Tables S6 and S7.
Land 09 00391 g005
Figure 6. Comparison of Delphi stakeholder responses in favor of each urban ecosystem service (ES; vertical axis), detailed in Figure S2, with resident priorities (horizontal axis), detailed in Figure 4 and Table S5. Delphi stakeholder priority was defined as two-thirds or greater consensus approval; residential priority was established by significance of Fisher’s exact test at the p < 0.05 level (n = 97); green shaded region represents urban ES prioritized by both stakeholder groups. AQ = air quality; AT = air temperature; BH = bird habitat; CI = community identity; CS = carbon sequestration; FP = fruit production; FR = flood reduction; NB = natural beauty; NS = native species; OR = outdoor recreation; P = privacy; PD = plant diversity; PH = pollinator habitat; SH = soil health; SQ = stormwater quality; VP = vegetable production.
Land 09 00391 g006
Figure 7. Land cover distributions for alternative planting regimes. Proportions of public green space (57.4 ha total) devoted to dispersed trees, woodland, tall shrubs, short shrubs, lawn or grass, and stormwater facilities, respectively. Status Quo describes the existing condition in the neighborhood (Section 3.1.); Forest and Stream maximizes locally-relevant, quantifiable urban ecosystem services (ES); Birdland maximizes delivery of Delphi respondents’ priority urban ES; Flower Sports maximizes delivery of residents’ priority urban ES; and Integration maximizes delivery of the urban ES prioritized by both Delphi respondents and residents.
Land 09 00391 g007
Table 1. Urban ecosystem services that generated consensus a among Delphi participants (n = 15).
Priority Ecosystem ServicesFirst SurveySecond Survey c
Ranking Mean bRanking Median bPriority for Right-of-Way (%)Priority for Parks (%)
Stormwater Purification3.22.086.780.0
Carbon Sequestration6.14.066.780.0
Air Purification3.93.073.366.7
Native Species6.67.573.373.3
Aesthetic/Natural Beauty7.78.073.366.7
Flood Reduction7.96.066.766.7
Air Temperature Regulation5.44.573.3- d
Habitat for Birds/Pollinators8.07.0- d73.3
Educational OpportunitiesN/AN/A- d66.7
a Consensus was defined as a ≥66.7% agreement. b 1 = highest; 17 = lowest. c Data are shown graphically in Figure S2. d Consensus was not reached.
Table 2. Urban ecosystem service delivery associated with alternative planting regimes.
Alternative Planting RegimeArea Converted haAir Purification Tonnes yr−1
(% change)
Carbon Storage Tonnes
(% change)
Runoff Retention b kL/12 mm storm event (% change)Stormwater Pollutant Filtration c (%)
Status Quo a0 2.0 (0%)2860 (0%)4720 (0%)(0%)
Forest and Stream32.02.8 (+38.5%)7570 (+164.9%)4960 (+3.5%)(80%)
Birdland26.32.9 (+44.2%)5710 (+99.9%)4810 (+1.9%)(33.2%)
Flower Sports21.02.7 (+33.4%)4860 (+70.0%)4750 (+0.5%)(33.2%)
Integration22.42.7 (+36.7%)5160 (+80.5%)4770 (+1.0%)(33.2%)
a Supply rates were calculated according to Derkzen et al. [14] unless otherwise specified. b Retention by woodlands, trees, tall shrubs, short shrubs, and lawn only. c Filtration by stormwater facilities, calculated using the Simplified Approach as described in the City of Eugene Stormwater Manual [58]; accounts for stormwater pollutants from impervious surfaces removed by stormwater planters and rain gardens on both publicly—and privately—owned land (see Table S10).
Publisher’s Note: MDPI stays neutral with regard to jurisdictional claims in published maps and institutional affiliations.

