Integrating Participatory Methods and Remote Sensing to Enhance Understanding of Ecosystem Service Dynamics Across Scales
Abstract
1. Introduction
1.1. Mapping Ecosystem Services
“top down “technology-based” approaches (e.g., conventional geographic information systems (GIS) and remote sensing) when applied to indigenous territories may delegitimize Traditional Ecological Knowledge and, in extreme cases, may cause indigenous people to lose control over management of their natural resources” [38:94]
2. Materials and Methods
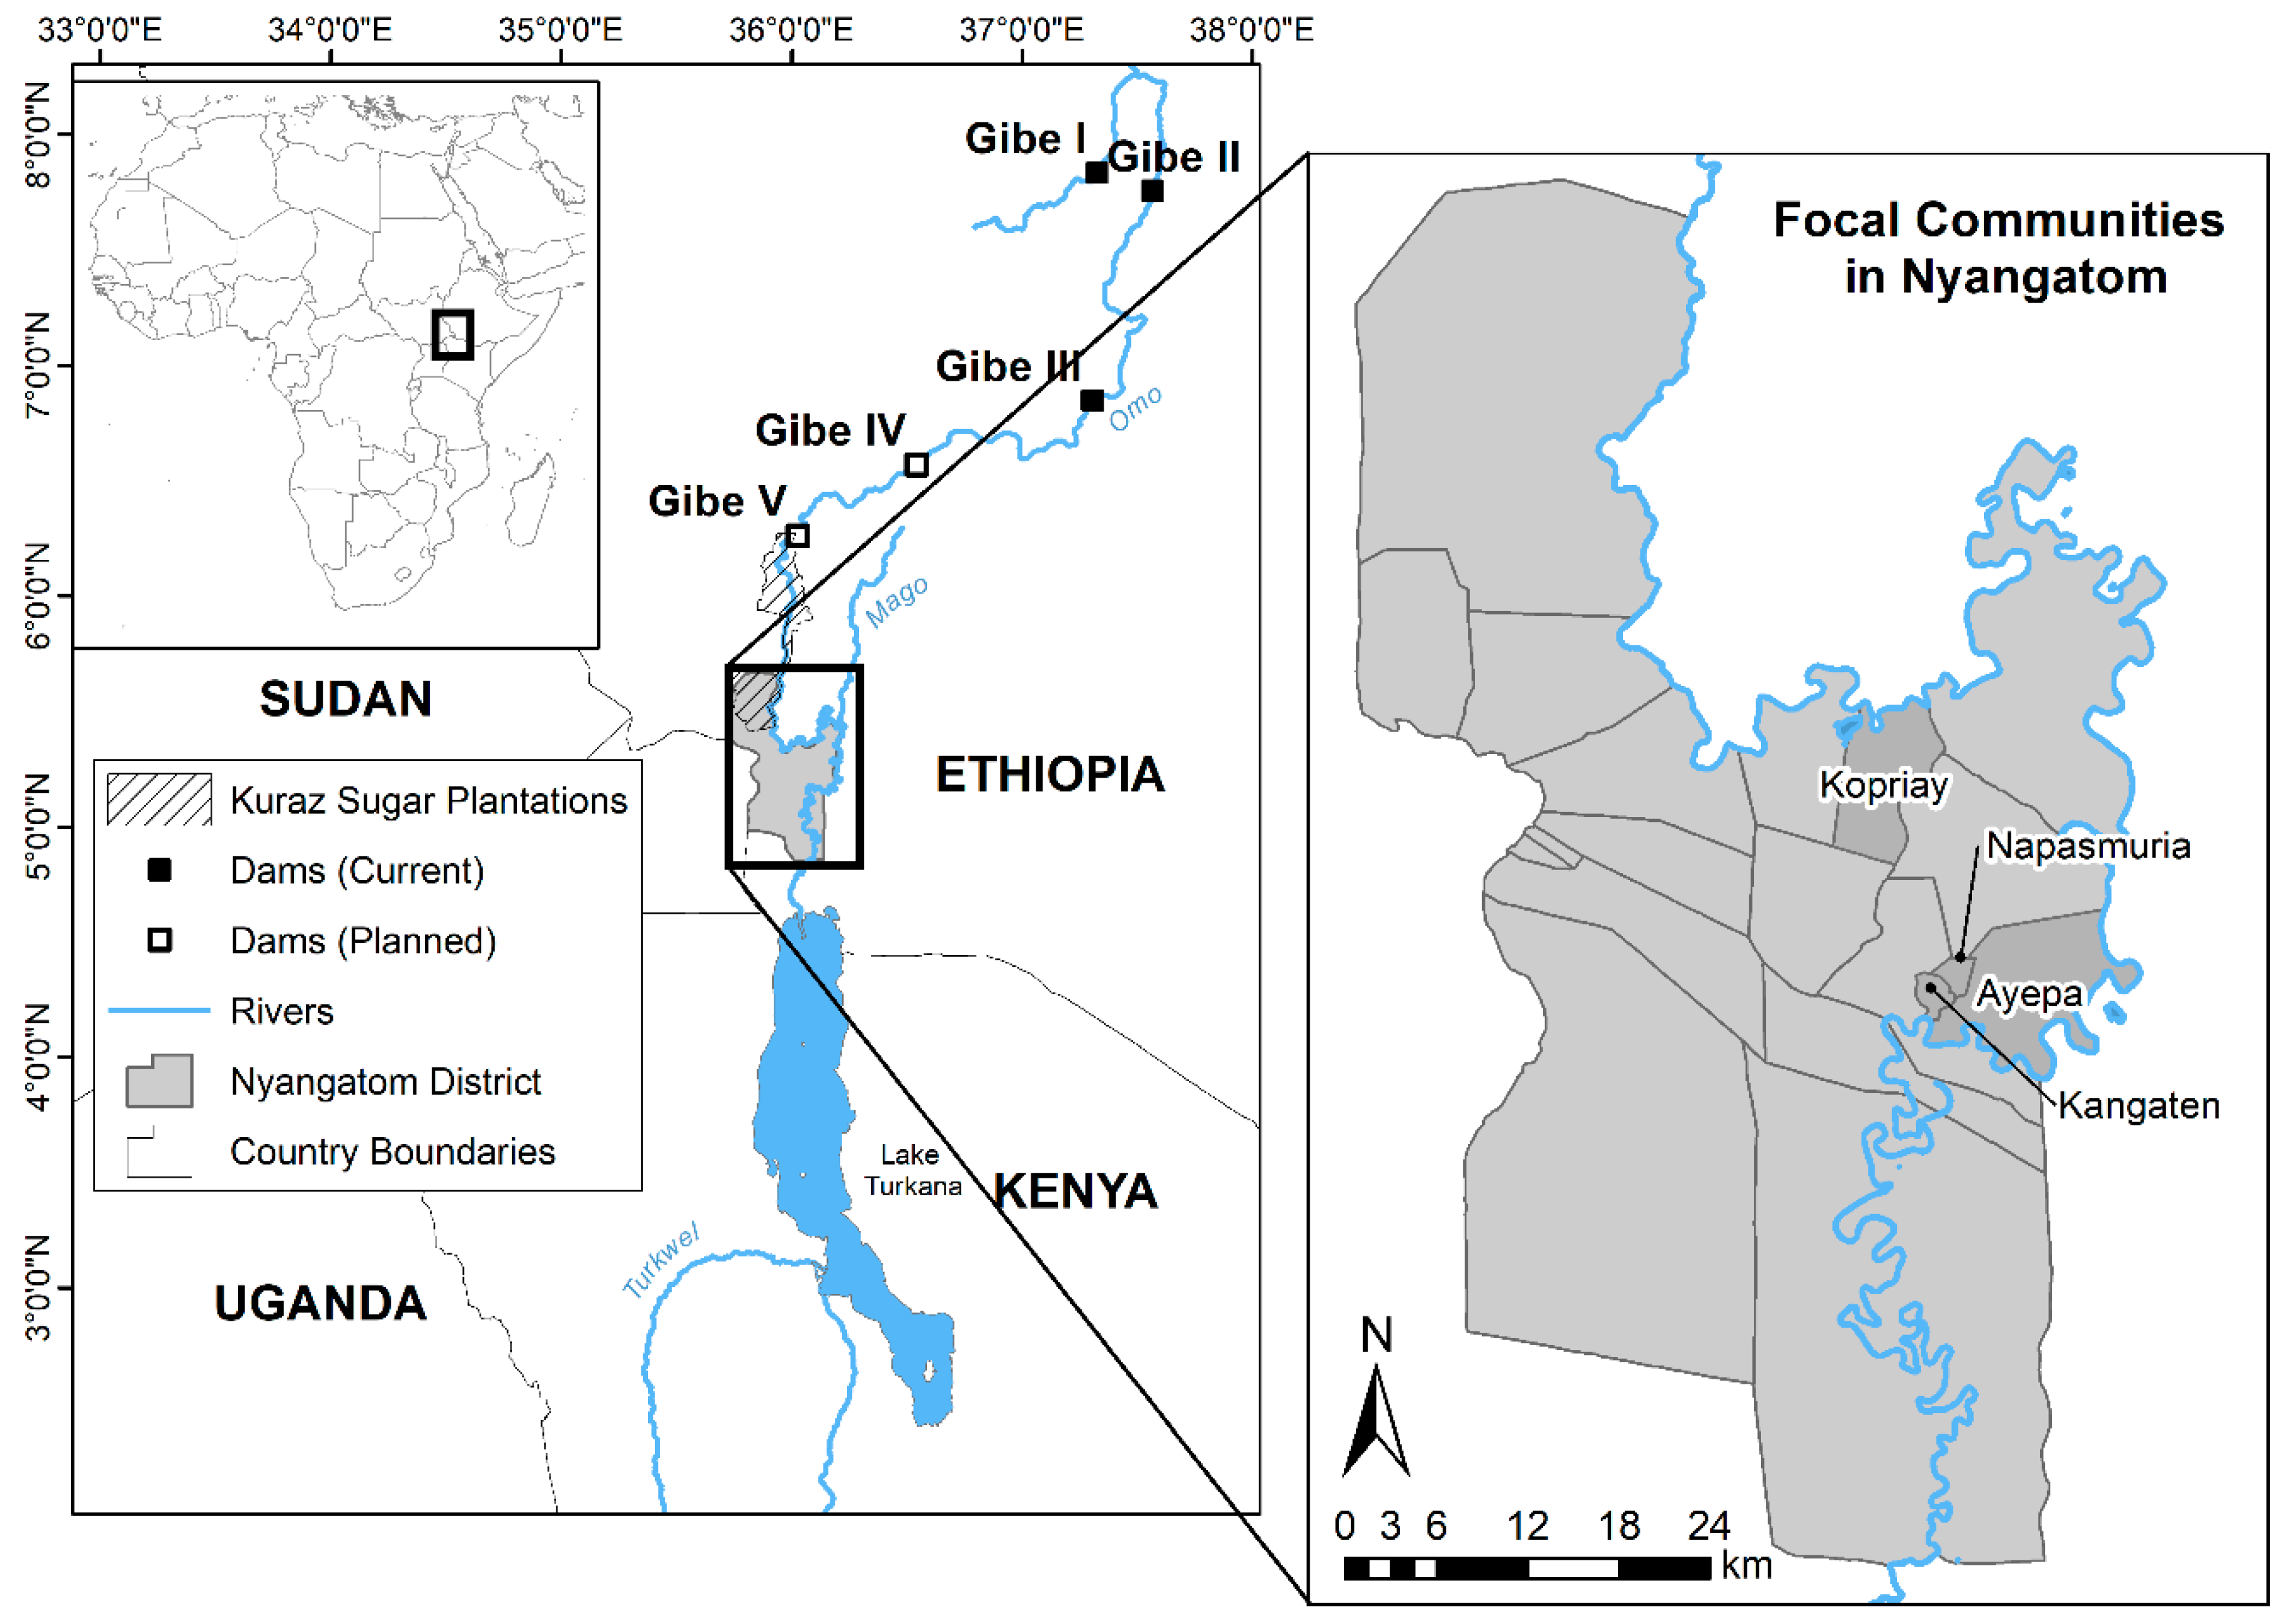
2.1. Study Site
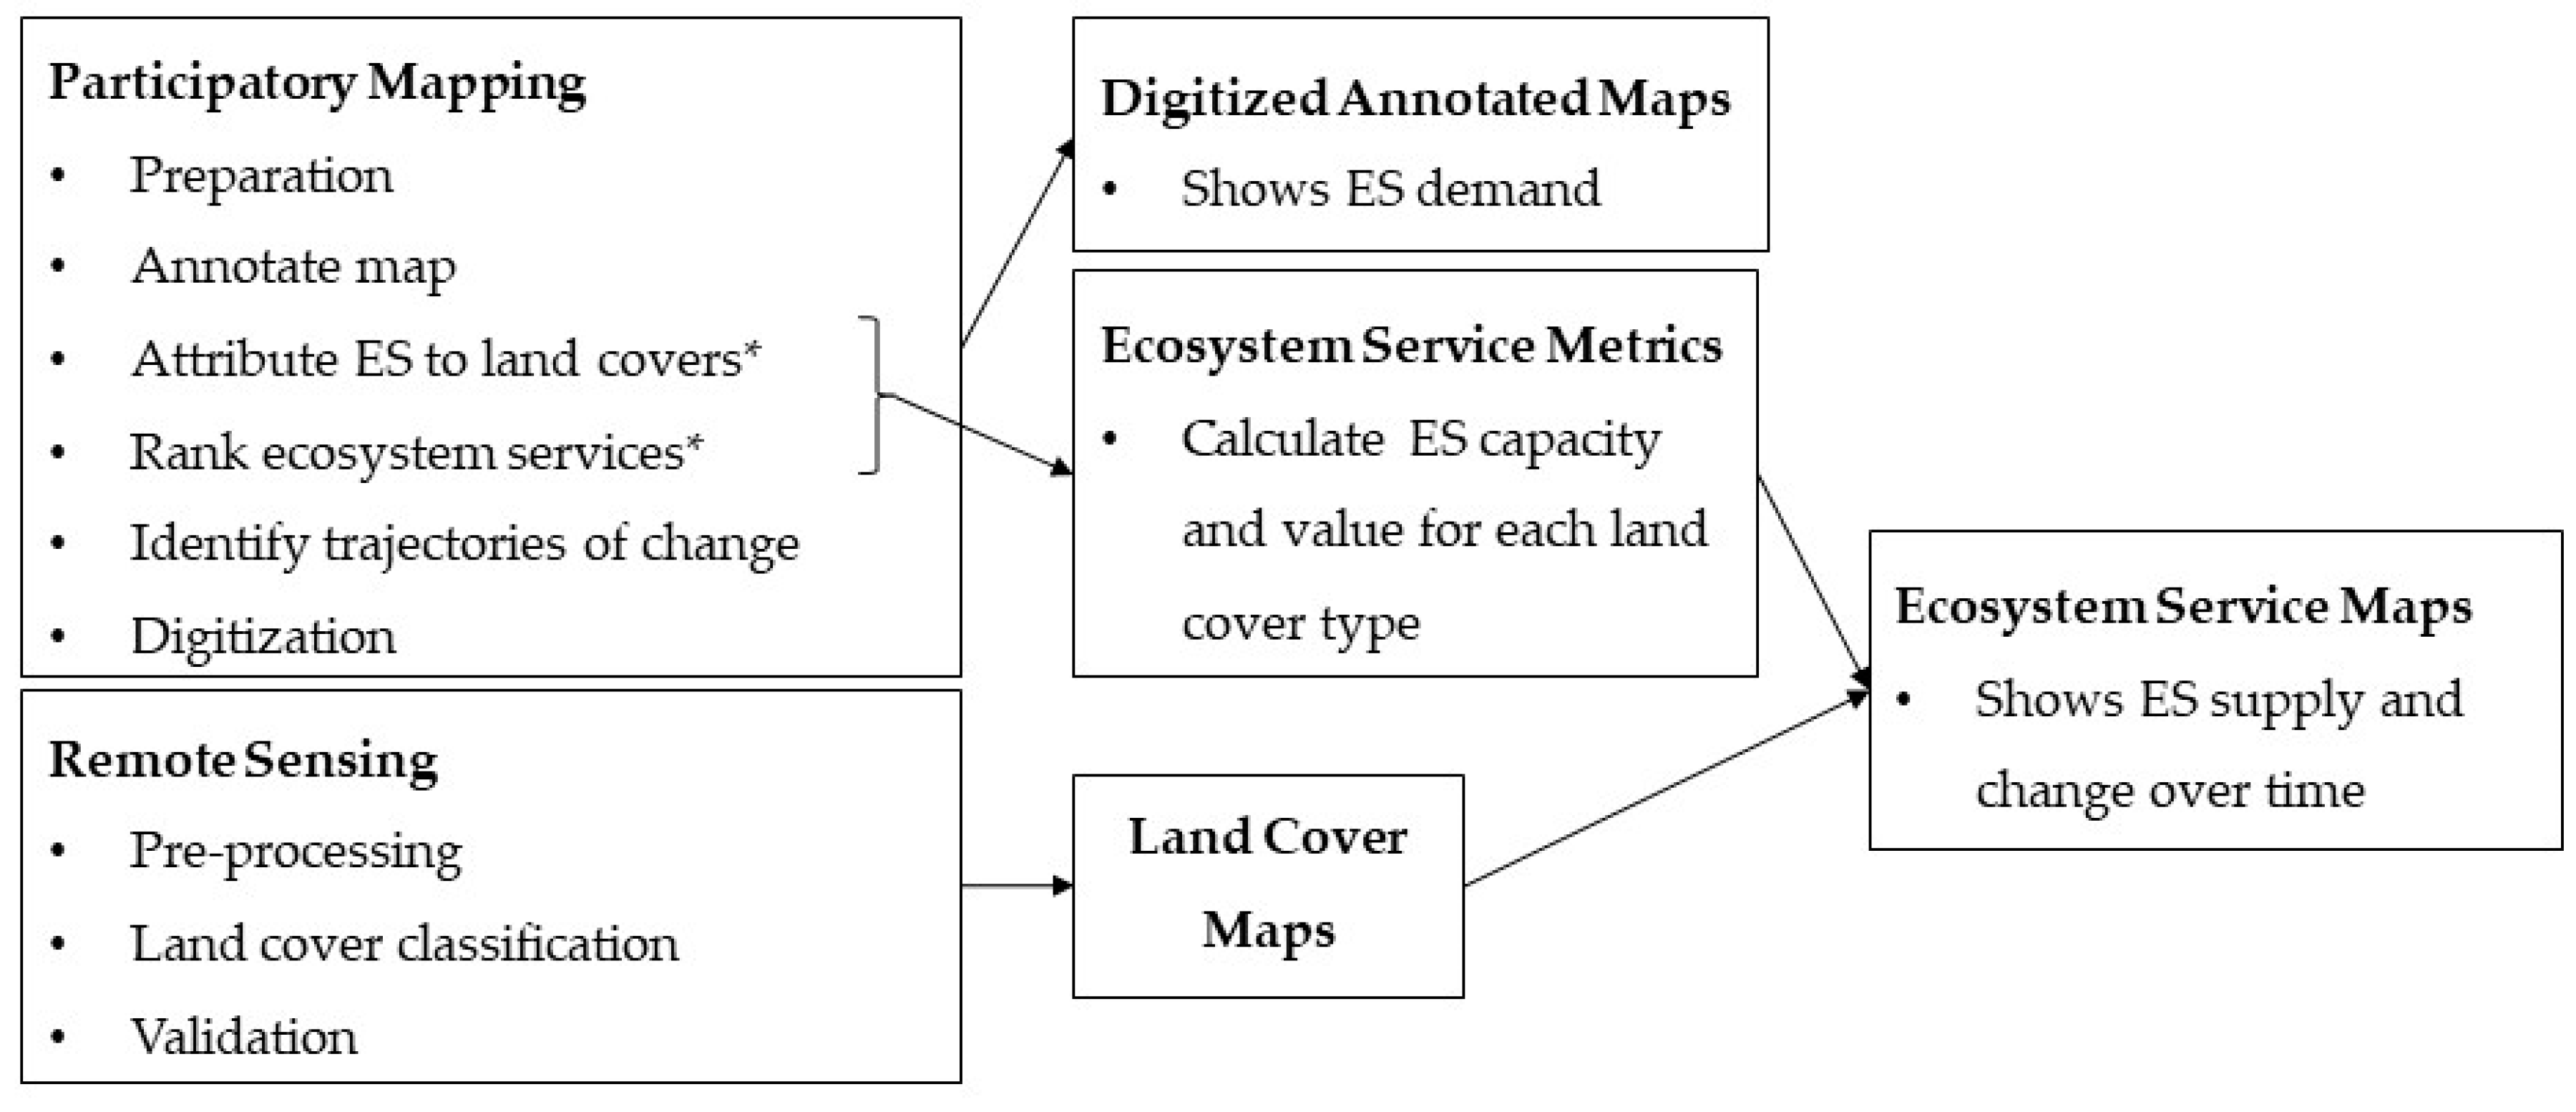
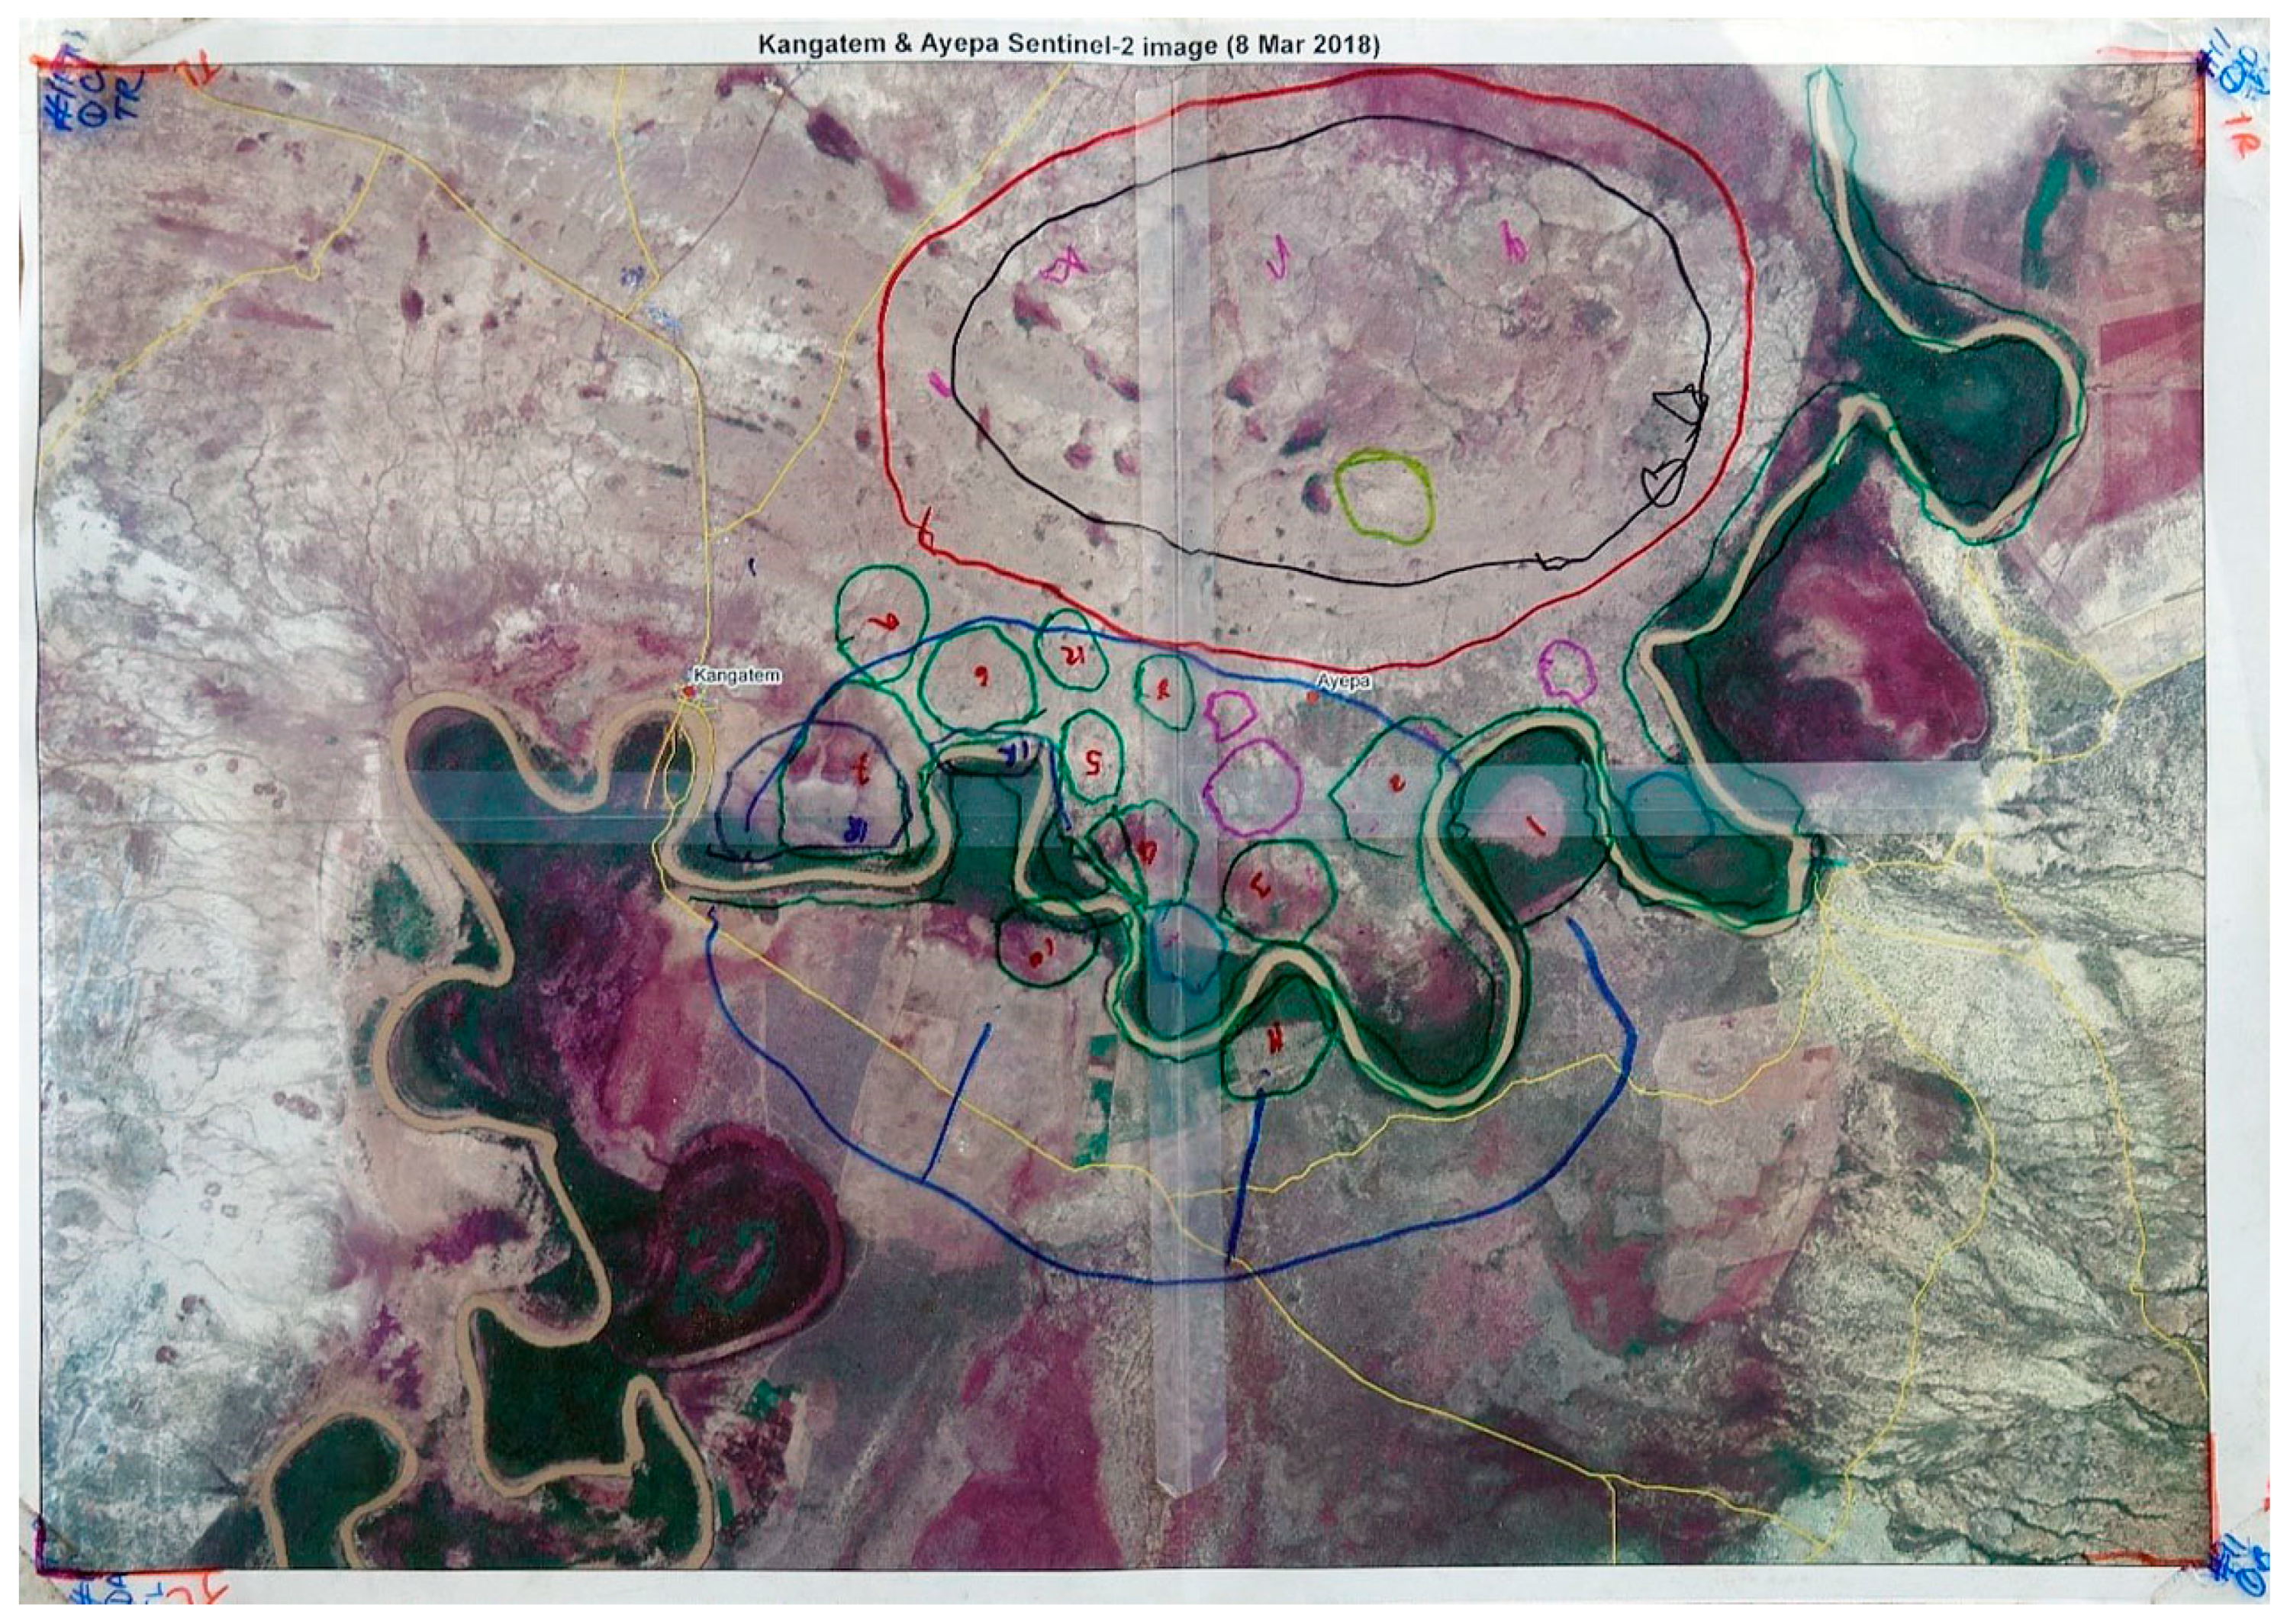
2.2. Participatory Mapping
- Kopriay—historically more reliant on pastoralism with larger cattle herds, N = 1,094, 217 households;
- Ayepa—historically more reliant on flood-retreat agriculture, N = 1,275, 241 households;
- Napasmuria—largely poor households who have been subject to the wider regional conflict, generally resulting in their loss of animals and resettlement in a more urban context, and higher dependency on state resources such as safety net programs, N = 2,110, 418 households [63].
2.3. Remote Sensing
2.4. Deriving ES Metrics for Each Land Cover Type
2.5. Integrating Traditional Ecological Knowledge with Satellite Data to Map Ecosystem Services
3. Results
3.1. Participatory Mapping
3.1.1. Annotated Maps
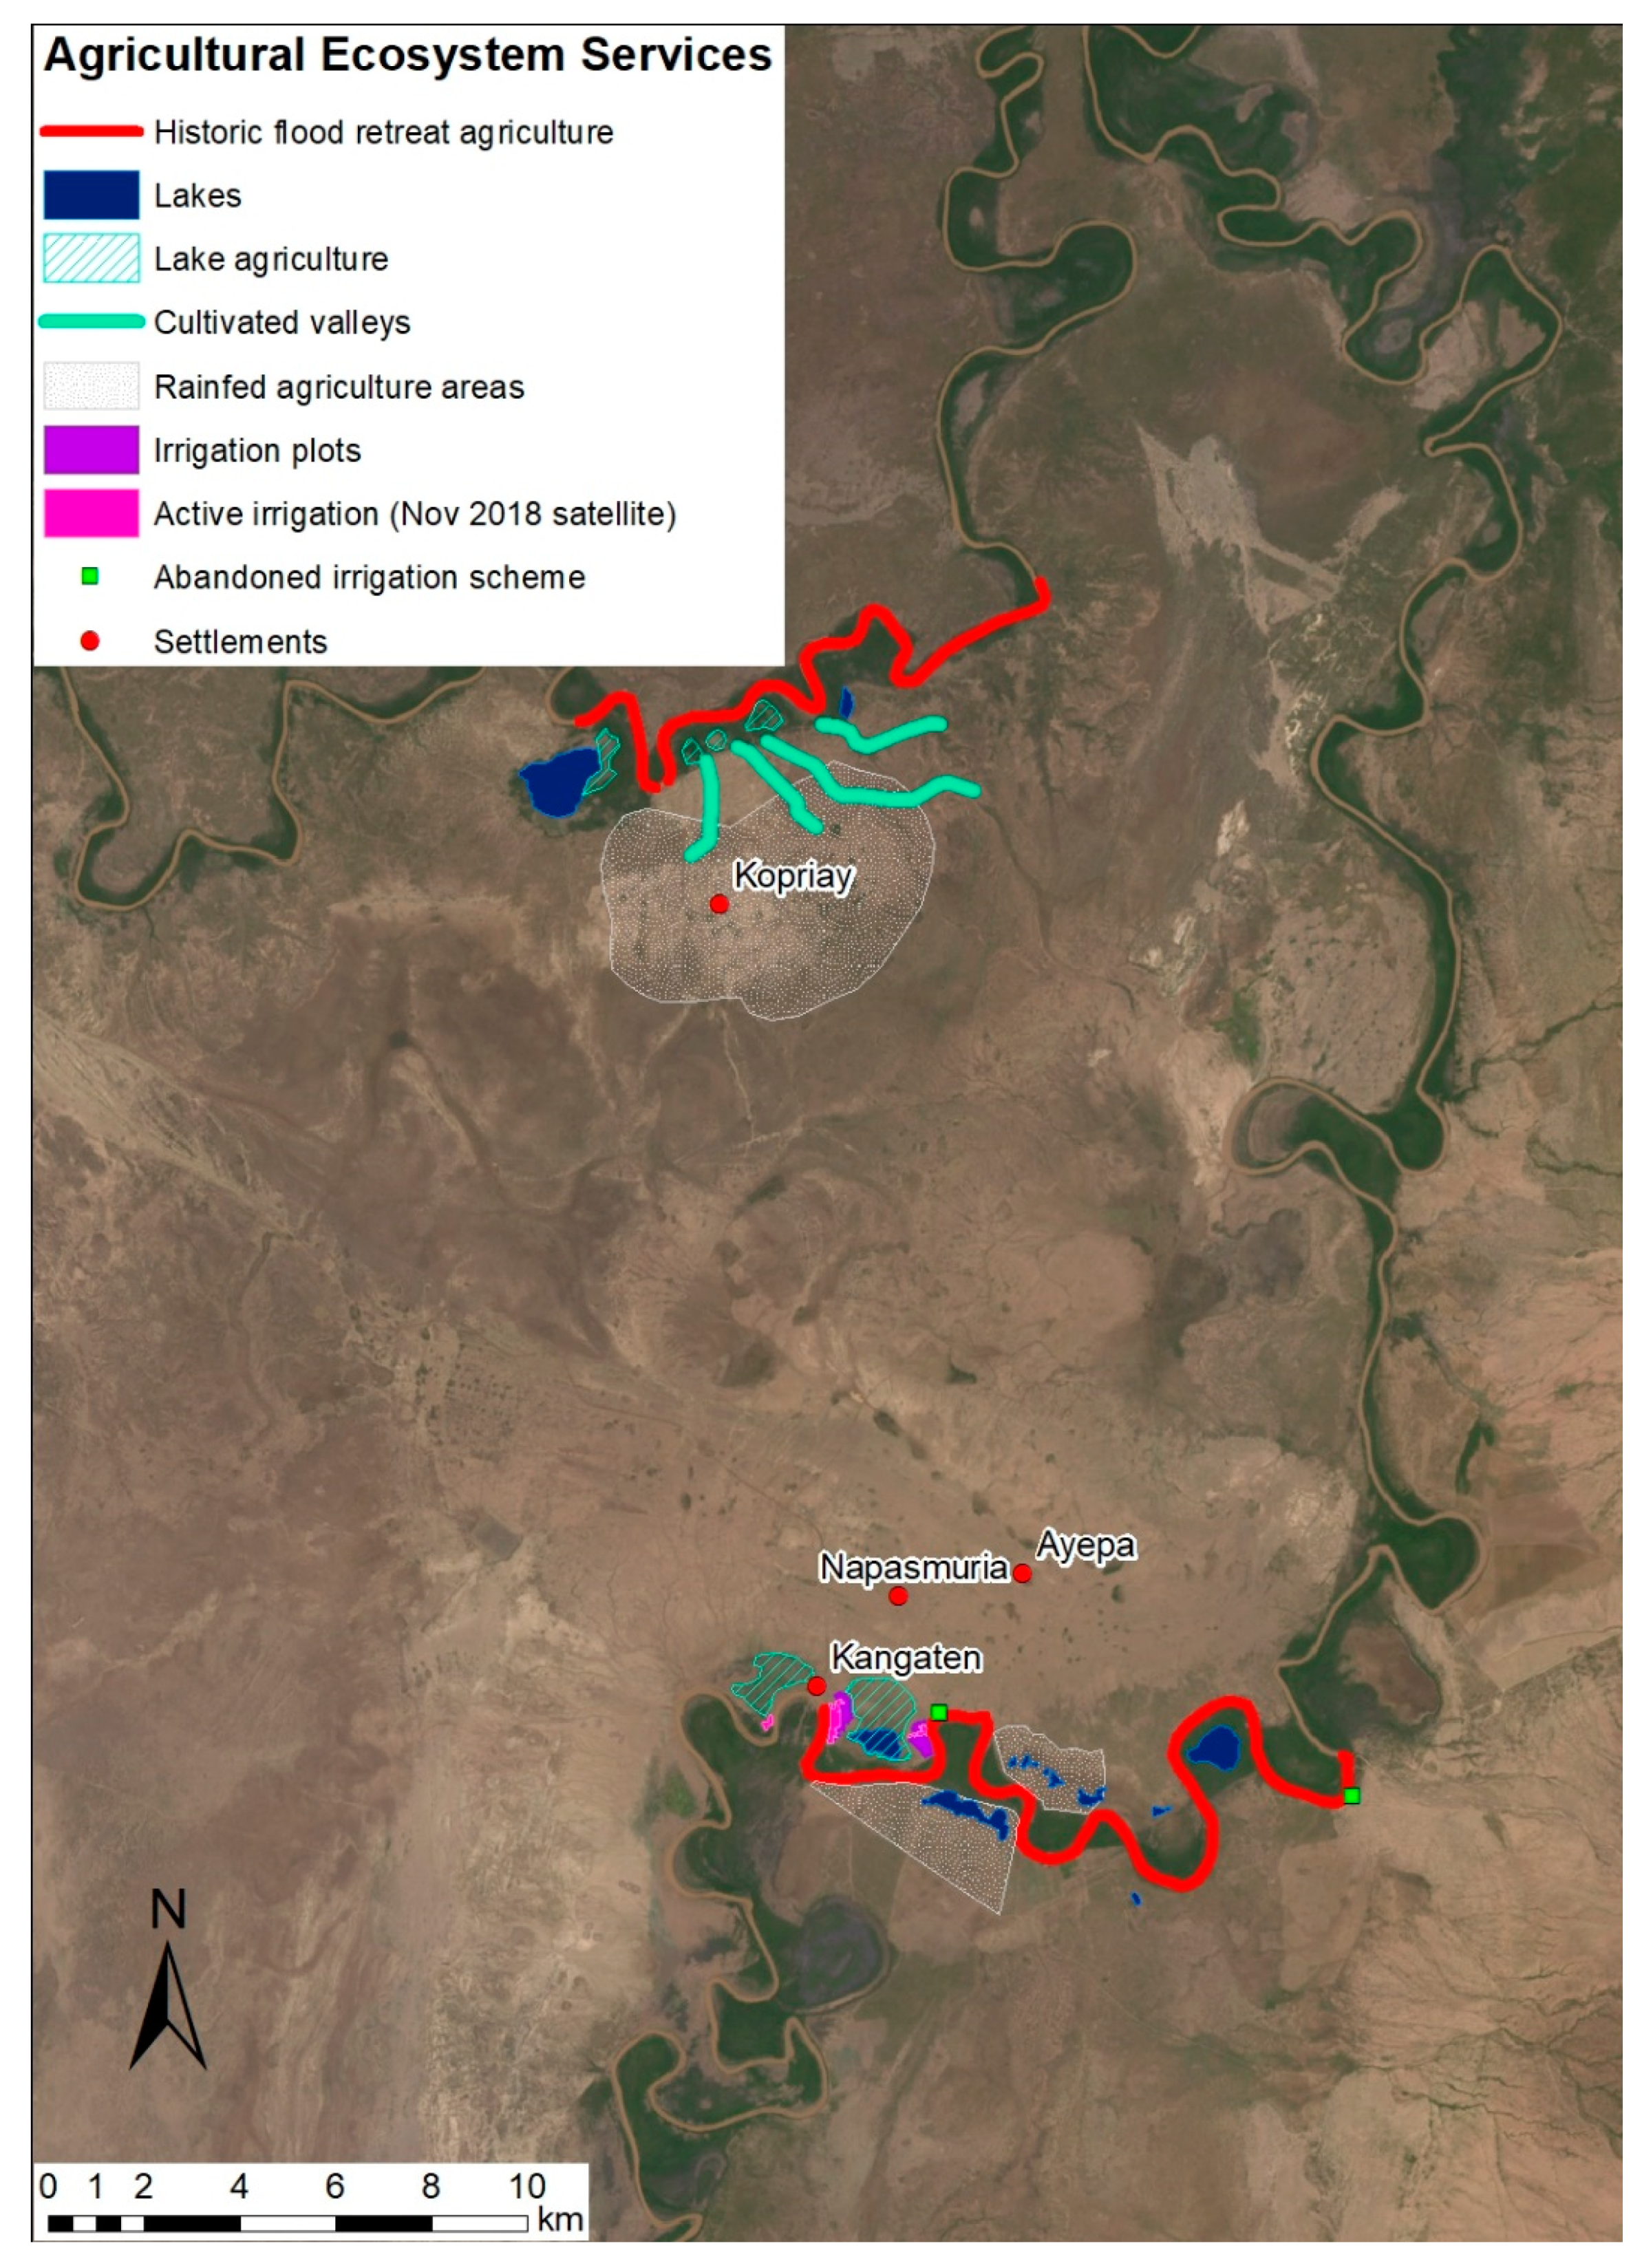
- Lake cultivation (hatched turquoise areas on Figure 4): at peak flood, the Omo River would fill large bodies of water between meanders of the river, in which cultivation would be carried out as it receded. Participants relayed that due to the loss of the flood, these are now only rainfed, but still defined as lakes by the community, in contrast to:
- Pond cultivation (grey-dotted areas on Figure 4): temporary rain-fed ponds that form during the wet-season, in which cultivation is carried out as it receded.
- Valley cultivation (turquoise lines on Figure 4): between Kopriay and the river there are valleys that can be cultivated during the wet season.
- Irrigation (pink areas on Figure 4): some irrigation is supported by the woreda near Kangaten, currently for cultivation of grass for fodder programs. The green dots represent historic irrigation sites, established by the Swedish Philadelphia Church Mission (SPCM) and active between the early 1970s until the early 2000s.
- Fishing, in the river and large lakes. Fishing in the river was traditionally a man’s task, with fish often consumed at the river immediately. According to an Ayepa woman “Why are you asking us about the fish? It’s the men’s work… Most of the time, we women do not eat the fish. Fish is for men. They eat there and if they like it they sell it there. If they wish to bring home, it’s according to their will; it’s not a must.”
- Hunting and trapping. Again, a gendered activity, with men hunting larger animals, often for cultural reasons as well as for food. Women and children trap smaller animals nearer to their settlements.
- Wild fruits, collected in the shrubland and forests around Ayepa and Napasmuria.
- Timber, fuel, and fiber, collected in the riverine forests.
- Water for livestock, accessed at ponds and lakes. The grazing ES map (Figure S1 in the supplementary material) also shows some waterholes for livestock by the river.
- Amokat, a salty soil, mixed with tobacco as a flavor enhancer and smoked.
3.1.2. Attribute Ecosystem Services to Land Covers and Rank Ecosystem Services
“Water is life…. Water is also future. The animals also drink water. The grains also use water. The wild food/fruit also use water. The sun also needs water. When the rain rains, the sun comes out. The bees also drink water, that’s why it is producing the honey. The materials for building house and firewood, even they require water. The fish is also drinking water and taking shower in the water. Wildlife also use water for drinking. The cattle also drink water. After drinking water, they produce milk and butter and meat, produce skin for sleeping.”
“Because honey is not available at every time. Also, honey cannot be eaten like food. You have to eat it slowly with other foods.” [Ayepa man].
“Honey is used to sell and buy cattle and goats. Honey is also used for alcohol.” [Kopriay woman].
3.1.3. Identify Trajectories of Change
“We need pumps for irrigation, taps for drinking water, food, as well as new school construction”.
3.1.4. Changing Cultivation
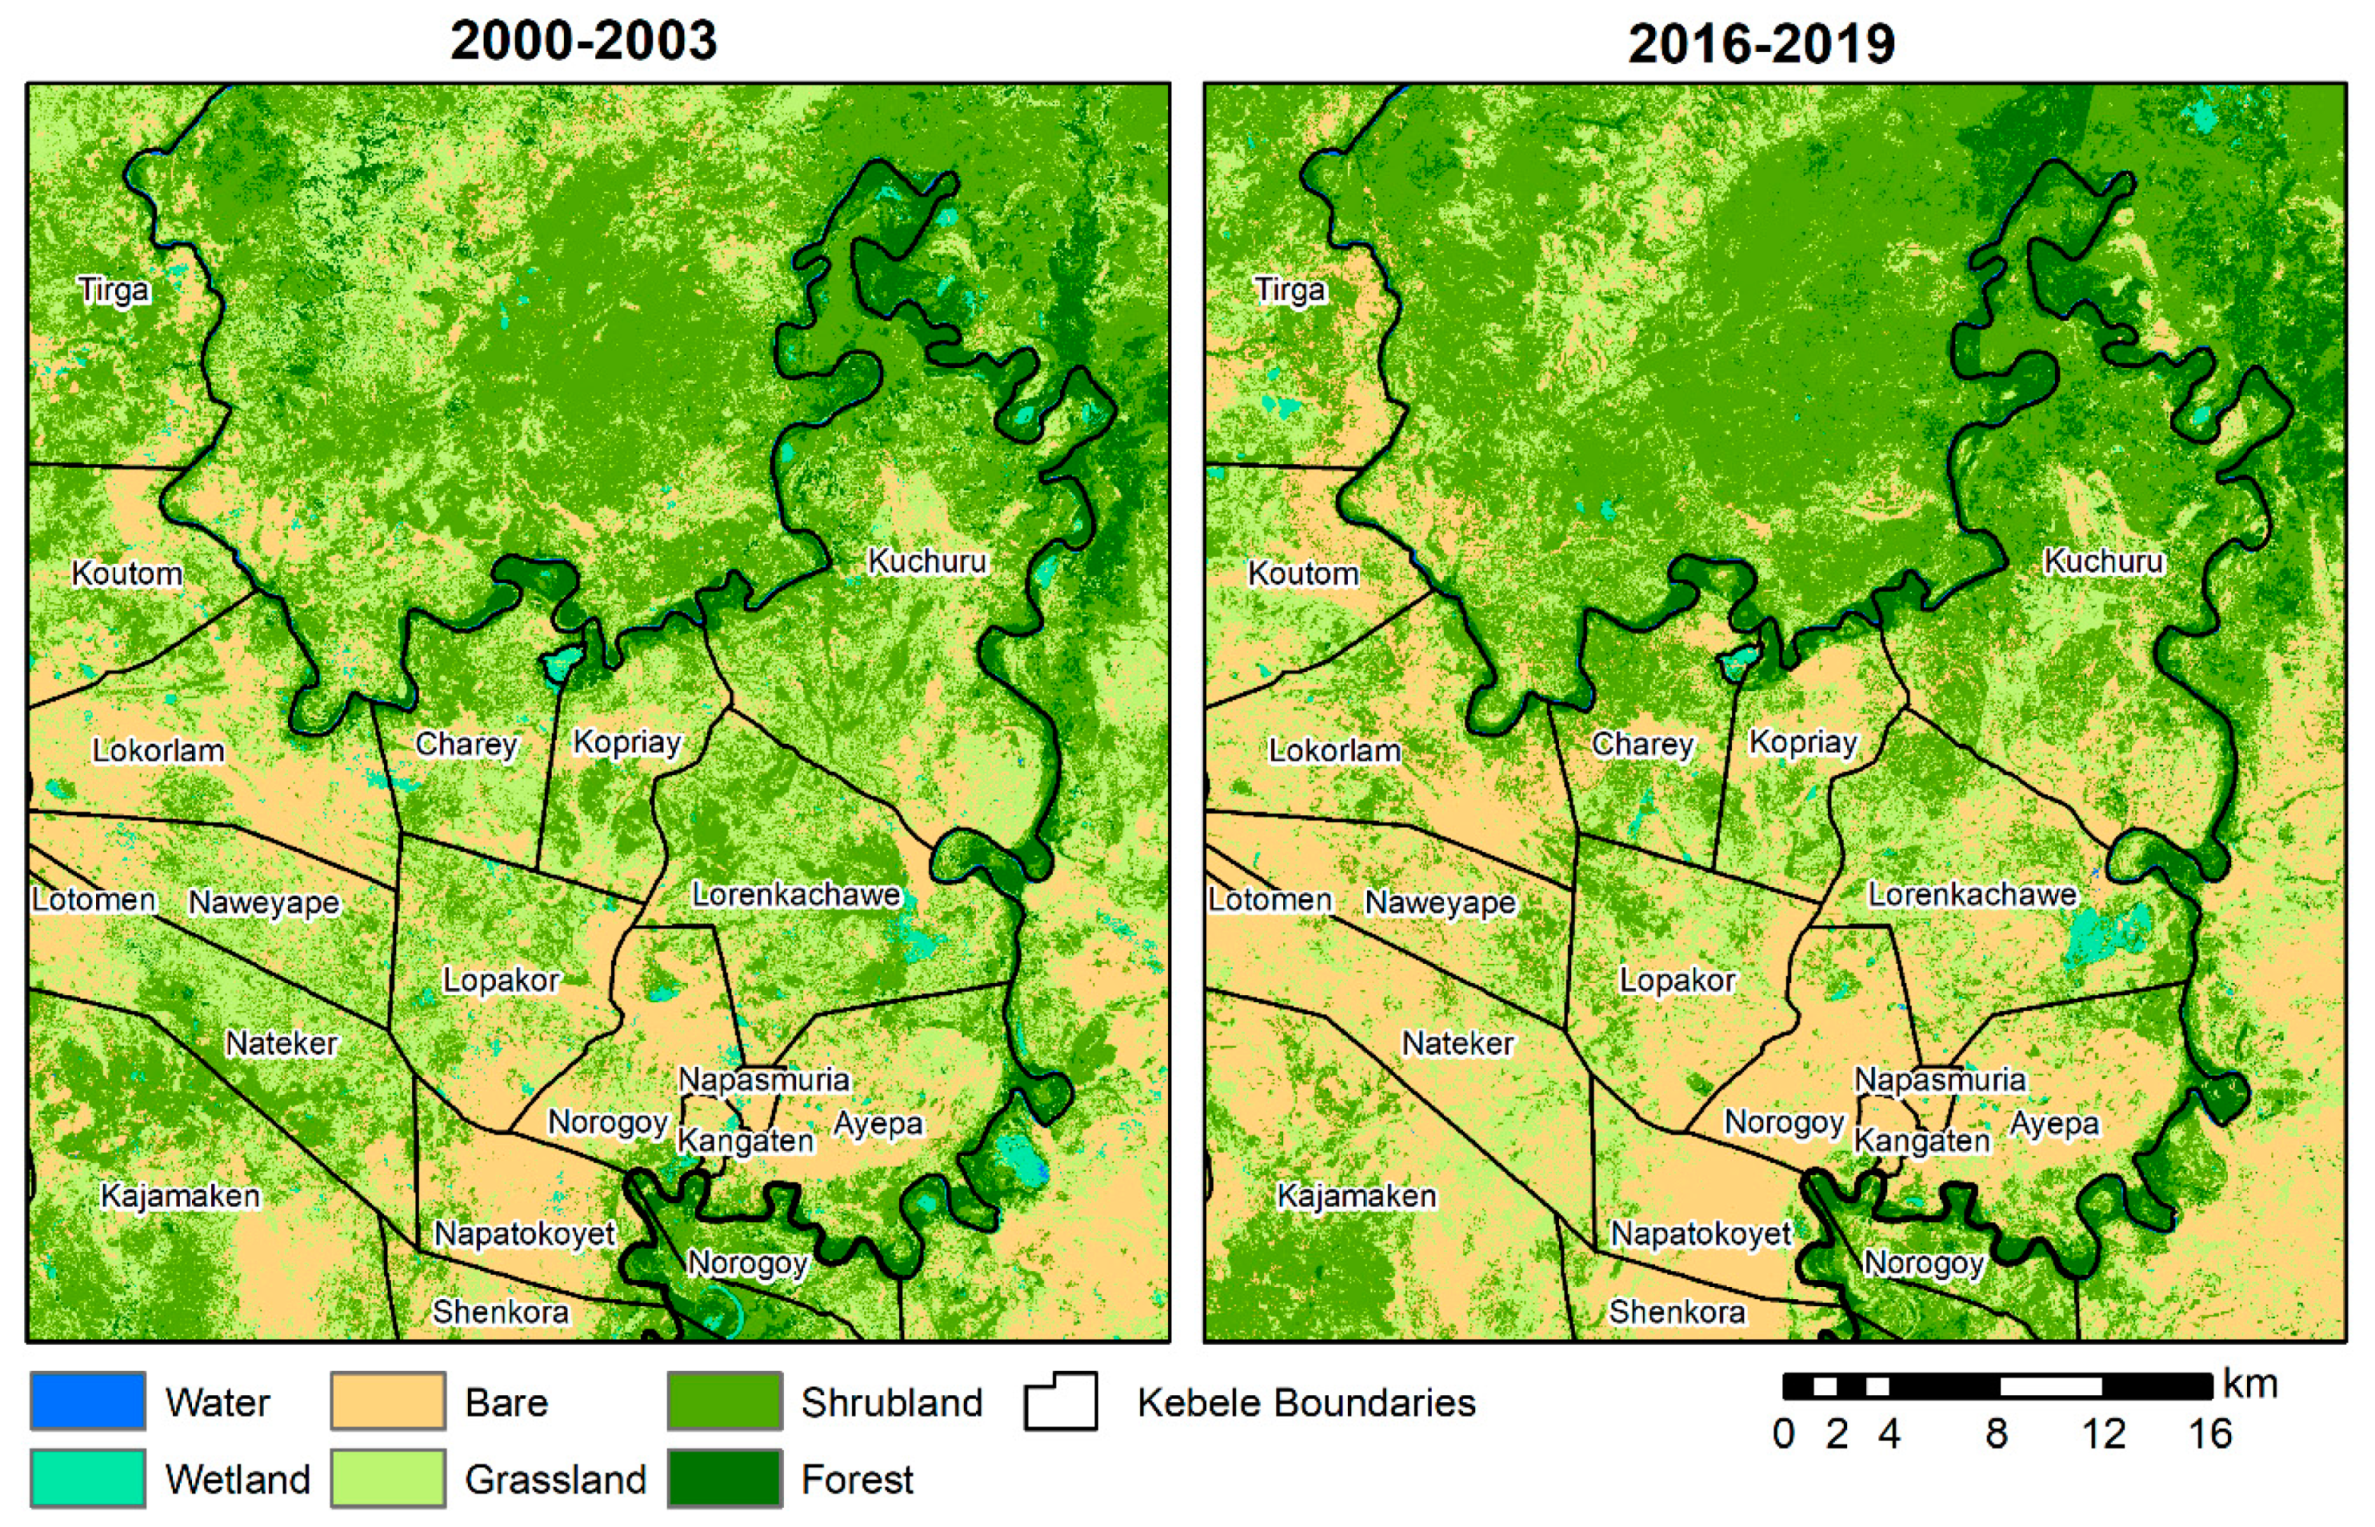
3.2. Land Cover Mapping
3.3. ES Metrics
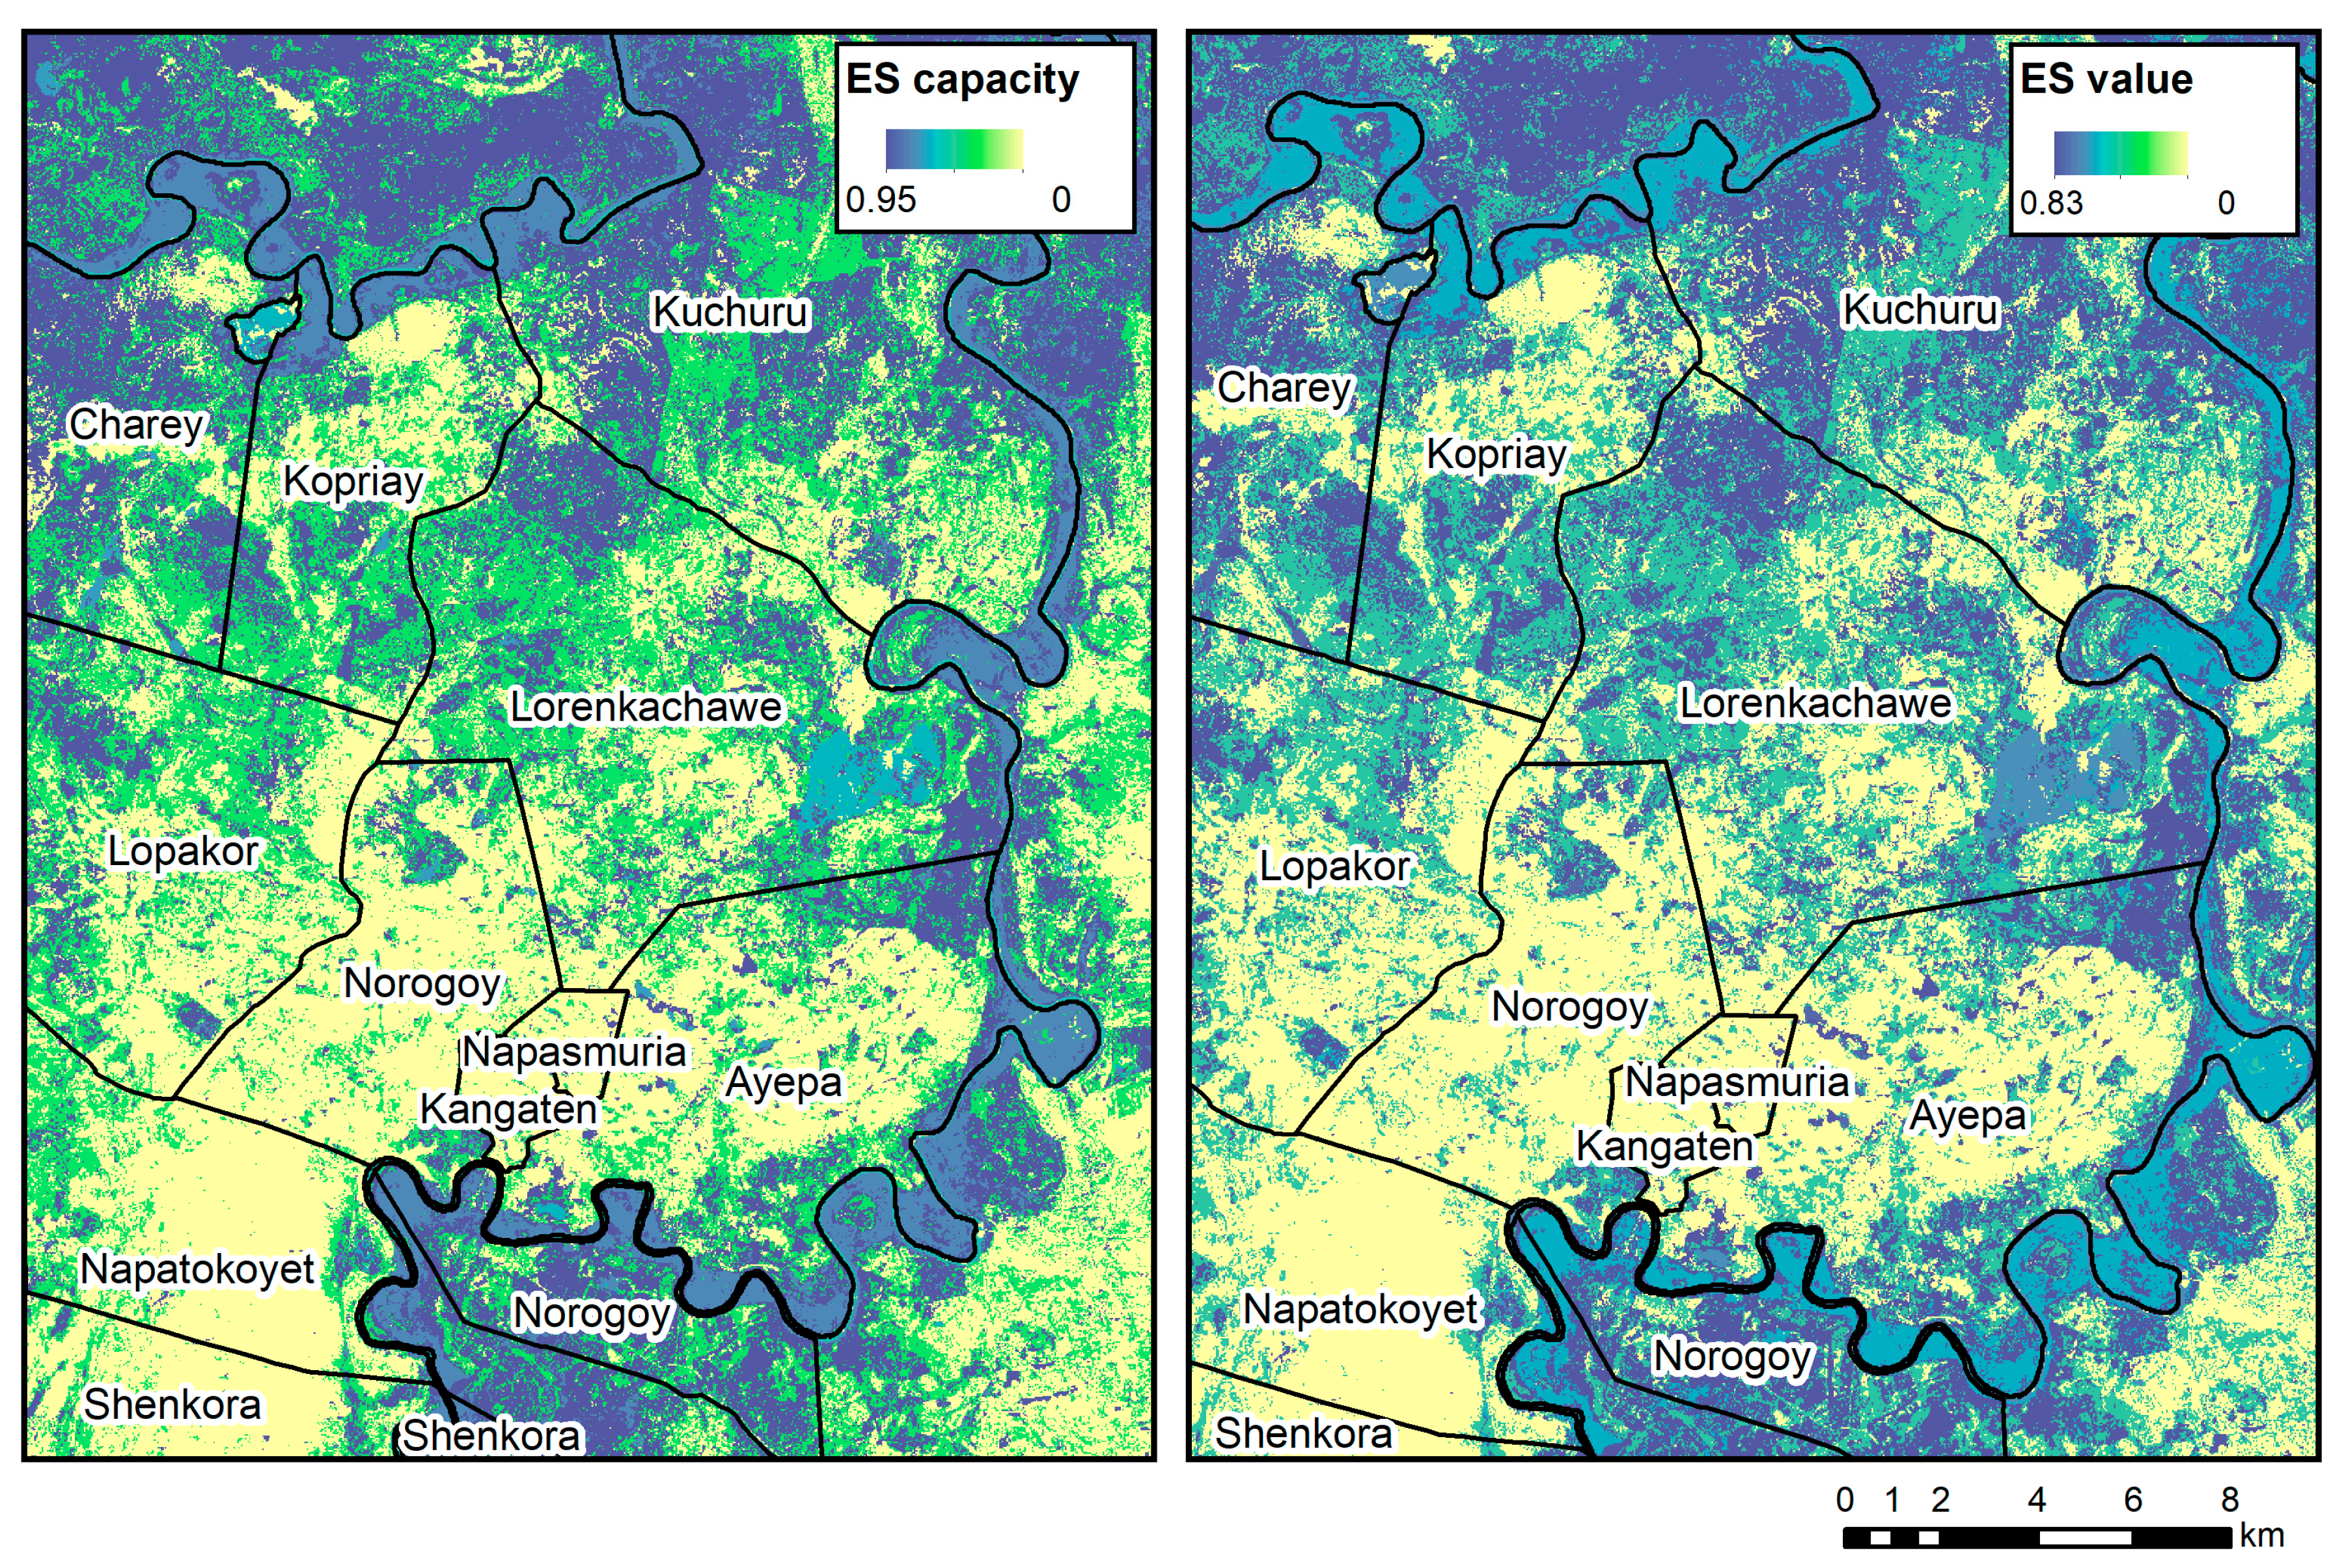
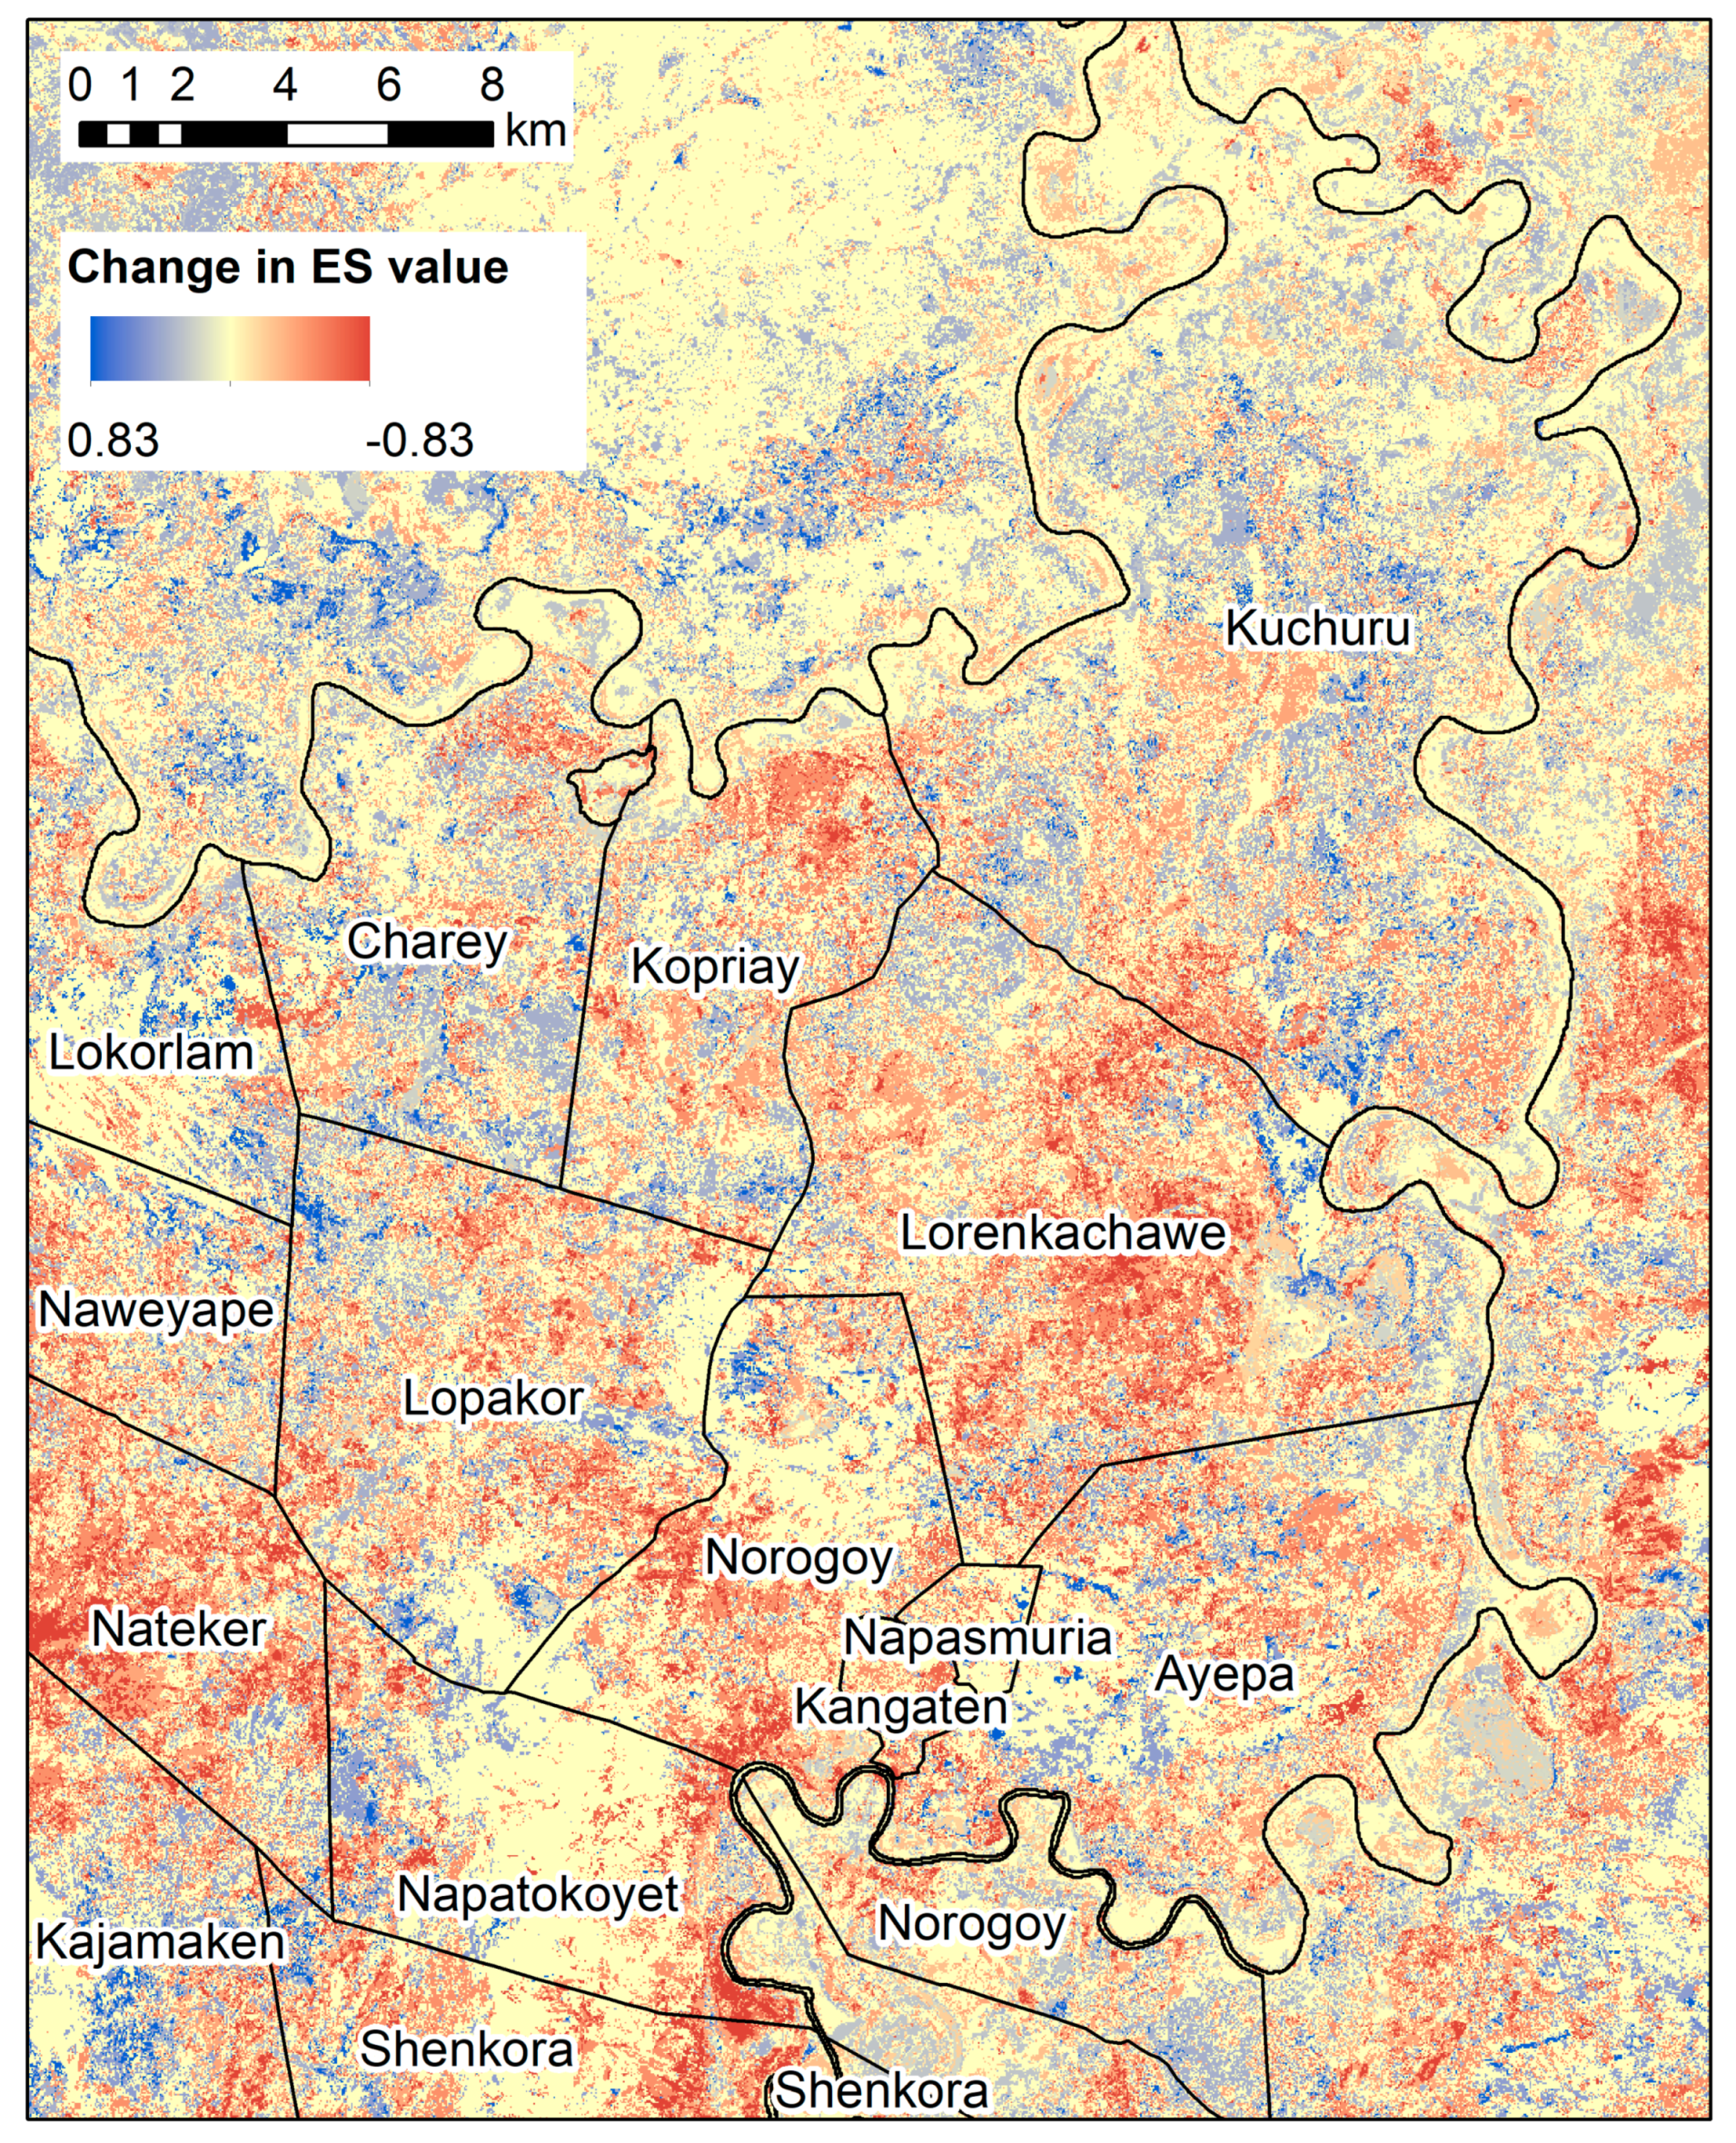
3.4. Integrated ES Maps
4. Discussion
4.1. ES Change in the Lower Omo
4.2. Methodological Contributions to the Literature
4.2.1. Limitations and Areas for Further Work
- Limitations of participatory mapping: Challenges with time availability, literacy levels of participants, and language barriers meant we had to simplify the classifications for ES importance (using high/medium/low/none, instead of an ideal scale from 0 to 10), and using prompts regarding how often the service is used or whether the household depends on it daily, seasonally or for special occasions. An observation from the importance classifications recorded in Table S1 for each focus group compared to the tile ranking was that when ranking was not enforced (i.e., in the original mapping activity with classifications of high/medium/low/none), higher values were prescribed to a broader range of services. We hypothesize this is because of the broad range of services being utilized in the present day, compared to pre-Gibe III, when elements like wild fruits and fish were more seasonal and not relied on as heavily. The consistently high classifications made it difficult to distinguish between ES, so for the ES metrics analysis importance classifications from the mapping activity (as recorded in Table S1 for each focus group) were not used in the analysis and the tile rankings were. Future work is needed to help us to find a more detailed way of quantifying importance.Additionally, further work is required on the methodology for mapping cultural and regulating ES. The absence of these from the results does not mean there was no articulated value of these ES, but that our approach to the participatory mapping elicited either very specific (i.e. individual trees that were hard to identify on the map) or very broad (i.e., a service provided by the whole territory, such as biodiversity) extents which participants were hesitant to map (as seen in Table S5). Given the known limitations of producing satellite measurements of more subjective values related to societal wellbeing and cultural perceptions [16], this remains an important area to address within the participatory mapping. Further work is also needed to elicit better probes for regulating services, given these were the least mapped.
- Limitations of satellite mapping: Given the relatively small enclosures and highly variable cultivation and rainfall seasonality, it was difficult to map croplands. Instead, croplands would have been incorporated into bare land, grassland, or shrubland. Future work could address this by digitizing cropland in high resolution aerial imagery or using new satellite sensors (e.g., Senintel-2) which offer improved capabilities for mapping cropland, i.e., high spatial, temporal and spectral resolution. This would help with challenges such as the valley cultivation around Kopriay, which are likely areas of grassland or shrubland that have been cleared to grow crops, thus potentially being classed as bare ground in the 2016–2019 maps, as our land cover classification was unable to discriminate between these. Indeed, Kopriay participants indicated these were important areas for cultivation. Additionally, this limitation meant we were not able to map and quantify the loss of flood-retreat agriculture (one of the main changes reported in focus groups). In a future paper, we will combine flood-retreat cultivation yields from survey data with timeseries of flood extent from satellite imagery to estimate loss of riverine crop production.Our approach was also limited by the assumption that each landcover type has a fixed ES capacity. While many studies also take this approach [16,83], in reality, there will be considerable spatial heterogeneity within classes as well as variation over time. For example, the capacity of shrubland to provide services will vary depending on factors such as percentage shrub cover and Net Primary Productivity (NPP). To overcome this, some ESS assessments combine land cover data with other satellite products. Thus, future work should explore the integration of remotely-sensed biophysically variables (such as NPP estimated from NDVI imagery [84]) with participatory methods to improve representation of spatio-temporal variability in ES capacity at the landscape level.
- Limitations of integration: Both past and present weightings need to be considered for future work. For example, we collected ES capacity and value data about the present, and lakes had both a relatively high ES capacity and value. However, the loss of lakes is likely to have a higher impact than suggested by our method because lakes previously had higher capacities, particularly when compared to ponds. Similarly, the river was given a modest capacity score that would be significantly higher pre-Gibe III, which would influence the weighting of both the river and associated cropland.
5. Conclusions
Supplementary Materials
Author Contributions
Funding
Acknowledgments
Conflicts of Interest
References
- TEEB. The Economics of Ecosystems and Biodiversity: Mainstreaming the Economics of Nature: A Synthesis of the Approach, Conclusions and Recommendations of TEEB; United Nations Environment Programme (UNEP): Geneva, Switzerland, 2010. [Google Scholar]
- United Nations Sustainable Development Goals. Available online: http://www.un.org/sustainabledevelopment/sustainable-development-goals/ (accessed on 13 January 2018).
- Walker, B.H.; Holling, C.S.; Carpenter, S.R.; Kinzig, A. Resilience, adaptability and transformability in social-ecological systems. Ecol. Soc. 2004, 9, 5. [Google Scholar] [CrossRef]
- Holling, C.S. Engineering Resilience versus Ecological Resilience. In Engineering without Ecological Constraints; Schultz, P.C., Ed.; National Academy Press: Washington DC, USA, 1996. [Google Scholar]
- Biggs, R.; Schlüter, M.; Schoon, M. Principles for Building Resilience: Sustaining Ecosystem Services in Social-Ecological Systems; Cambridge University Press: Cambridge, UK, 2015. [Google Scholar]
- Englund, O.; Berndes, G.; Cederberg, C. How to analyse ecosystem services in landscapes—A systematic review. Ecol. Indic. 2017, 73, 492–504. [Google Scholar] [CrossRef]
- Syrbe, R.; Schr, M.; Centre, G.; Biodiversity, I.; Urban, E.; Urban, E.; Dresd, W. What to Map? In Mapping Ecosystem Services; Burkhard, B., Maes, J., Eds.; Advanced Books: Sofia, Bulgaria, 2017. [Google Scholar] [CrossRef]
- Bryan, B.A.; Raymond, C.M.; Crossman, N.D.; Macdonald, D.H. Targeting the management of ecosystem services based on social values: Where, what, and how? Landsc. Urban Plan. 2010, 97, 111–122. [Google Scholar] [CrossRef]
- Paudyal, K.; Baral, H.; Bhandari, S.P.; Keenan, R.J. Participatory assessment and mapping of ecosystem services in a data-poor region: Case study of community-managed forests in central Nepal. Ecosyst. Serv. 2015, 13, 81–92. [Google Scholar] [CrossRef]
- Malinga, R.; Gordon, L.J.; Jewitt, G.; Lindborg, R. Mapping ecosystem services across scales and continents—A review. Ecosyst. Serv. 2015, 13, 57–63. [Google Scholar] [CrossRef]
- Burkhard, B.; Kroll, F.; Müller, F.; Windhorst, W. Landscapes’ capacities to provide ecosystem services–a concept for land-cover based assessments. Landsc. Online 2009, 15, 1–22. [Google Scholar] [CrossRef]
- Palomo, I.; Martín-López, B.; Potschin, M.; Haines-Young, R.; Montes, C. National Parks, buffer zones and surrounding lands: Mapping ecosystem service flows. Ecosyst. Serv. 2013, 4, 104–116. [Google Scholar] [CrossRef]
- Raymond, C.M.; Bryan, B.A.; MacDonald, D.H.; Cast, A.; Strathearn, S.; Grandgirard, A.; Kalivas, T. Mapping community values for natural capital and ecosystem services. Ecol. Econ. 2009, 68, 1301–1315. [Google Scholar] [CrossRef]
- Niraula, R.R.; Gilani, H.; Pokharel, B.K.; Qamer, F.M. Measuring impacts of community forestry program through repeat photography and satellite remote sensing in the Dolakha district of Nepal. J. Environ. Manag. 2013, 126, 20–29. [Google Scholar] [CrossRef]
- Brown, G.; Montag, J.M.; Lyon, K. Public Participation GIS: A Method for Identifying Ecosystem Services. Soc. Nat. Resour. 2012. [Google Scholar] [CrossRef]
- De Araujo Barbosa, C.C.; Atkinson, P.M.; Dearing, J.A. Remote sensing of ecosystem services: A systematic review. Ecol. Indic. 2015, 52, 430–443. [Google Scholar] [CrossRef]
- Delgado-Aguilar, M.J.; Hinojosa, L.; Schmitt, C.B. Combining remote sensing techniques and participatory mapping to understand the relations between forest degradation and ecosystems services in a tropical rainforest. Appl. Geogr. 2019. [Google Scholar] [CrossRef]
- Crossman, N.D.; Burkhard, B.; Willemen, L.; Palomo, I.; Drakou, E.G.; Martín-Lopez, B.; McPhearson, T.; Boyanova, K.; Egoh, B.; Dunbar, M.B.; et al. A blueprint for mapping and modelling ecosystem services. Ecosyst. Serv. 2013, 4, 4–14. [Google Scholar] [CrossRef]
- Ives, C.D.; Biggs, D.; Hardy, M.J.; Lechner, A.M.; Wolnicki, M.; Raymond, C.M. Using social data in strategic environmental assessment to conserve biodiversity. Land Use Policy 2015. [Google Scholar] [CrossRef]
- Mueller-Warrant, G.W.; Whittaker, G.W.; Banowetz, G.M.; Griffith, S.M.; Barnhart, B.L. Methods for improving accuracy and extending results beyond periods covered by traditional ground-truth in remote sensing classification of a complex landscape. Int. J. Appl. Earth Obs. Geoinf. 2015. [Google Scholar] [CrossRef]
- Ghazi, H.; Messouli, M.; Yacoubi Khebiza, M.; Egoh, B.N. Mapping regulating services in Marrakesh Safi region - Morocco. J. Arid Environ. 2018. [Google Scholar] [CrossRef]
- Yang, Z.; Dong, J.; Qin, Y.; Ni, W.; Zhao, G.; Chen, W.; Chen, B.; Kou, W.; Wang, J.; Xiao, X. Integrated analyses of PALSAR and Landsat imagery reveal more agroforests in a typical agricultural production region, North China Plain. Remote Sens. 2018, 10, 1323. [Google Scholar] [CrossRef]
- Krueger, T.; Page, T.; Hubacek, K.; Smith, L.; Hiscock, K. The role of expert opinion in environmental modelling. Environ. Model. Softw. 2012, 36, 4–18. [Google Scholar] [CrossRef]
- Jacobs, S.; Burkhard, B.; Van Daele, T.; Staes, J.; Schneiders, A. “The Matrix Reloaded”: A review of expert knowledge use for mapping ecosystem services. Ecol. Modell. 2015, 295, 21–30. [Google Scholar] [CrossRef]
- Corbett, J. Good Practices in Participatory Mapping: A Review Prepared for the International Fund for Agricultural Development (IFAD); IFAD: Rome, Italy, 2009. [Google Scholar]
- Cronkleton, P.; Albornoz, M.A.; Barnes, G.; Evans, K.; de Jong, W. Social Geomatics: Participatory Forest Mapping to Mediate Resource Conflict in the Bolivian Amazon. Hum. Ecol. 2010, 38, 65–76. [Google Scholar] [CrossRef]
- Berkes, F. Sacred Ecology; Routledge: New York, NY, USA; Abingdon, UK, 2012; ISBN 9780203123843. [Google Scholar]
- Wangai, P.W.; Burkhard, B.; Müller, F. A review of studies on ecosystem services in Africa. Int. J. Sustain. Built Environ. 2016, 5, 225–245. [Google Scholar] [CrossRef]
- Pert, P.L.; Hill, R.; Maclean, K.; Dale, A.; Rist, P.; Schmider, J.; Talbot, L.; Tawake, L. Mapping cultural ecosystem services with rainforest aboriginal peoples: Integrating biocultural diversity, governance and social variation. Ecosyst. Serv. 2015, 13, 41–56. [Google Scholar] [CrossRef]
- Ayanu, Y.Z.; Conrad, C.; Nauss, T.; Wegmann, M.; Koellner, T. Quantifying and Mapping Ecosystem Services Supplies and Demands: A Review of Remote Sensing Applications. Environ. Sci. Technol. 2012, 46, 8529–8541. [Google Scholar] [CrossRef] [PubMed]
- Brown, G.; Strickland-Munro, J.; Kobryn, H.; Moore, S.A. Mixed methods participatory GIS: An evaluation of the validity of qualitative and quantitative mapping methods. Appl. Geogr. 2017. [Google Scholar] [CrossRef]
- Brown, G.; Fagerholm, N. Empirical PPGIS/PGIS mapping of ecosystem services: A review and evaluation. Ecosyst. Serv. 2015, 13, 119–133. [Google Scholar] [CrossRef]
- Reilly, K.; Adamowski, J.; John, K. Participatory mapping of ecosystem services to understand stakeholders’ perceptions of the future of the Mactaquac Dam, Canada. Ecosyst. Serv. 2018, 30, 107–123. [Google Scholar] [CrossRef]
- Chen, Y.; Yu, Z.; Li, X.; Li, P. How agricultural multiple ecosystem services respond to socioeconomic factors in Mengyin County, China. Sci. Total Environ. 2018. [Google Scholar] [CrossRef]
- Renard, D.; Rhemtulla, J.M.; Bennett, E.M. Historical dynamics in ecosystem service bundles. Proc. Natl. Acad. Sci. USA 2015. [Google Scholar] [CrossRef]
- Feltham, H.; Park, K.; Minderman, J.; Goulson, D. Experimental evidence that wildflower strips increase pollinator visits to crops. Ecol. Evol. 2015. [Google Scholar] [CrossRef]
- Muhamad, D.; Okubo, S.; Harashina, K.; Parikesit; Gunawan, B.; Takeuchi, K. Living close to forests enhances people[U+05F3]s perception of ecosystem services in a forest-agricultural landscape of West Java, Indonesia. Ecosyst. Serv. 2014. [Google Scholar] [CrossRef]
- Torralba, M.; Fagerholm, N.; Burgess, P.J.; Moreno, G.; Plieninger, T. Do European agroforestry systems enhance biodiversity and ecosystem services? A meta-analysis. Agric. Ecosyst. Environ. 2016, 230, 150–161. [Google Scholar] [CrossRef]
- Onaindia, M.; Peña, L.; de Manuel, B.F.; Rodríguez-Loinaz, G.; Madariaga, I.; Palacios-Agúndez, I.; Ametzaga-Arregi, I. Land use efficiency through analysis of agrological capacity and ecosystem services in an industrialized region (Biscay, Spain). Land Use Policy 2018. [Google Scholar] [CrossRef]
- Haase, D.; Larondelle, N.; Andersson, E.; Artmann, M.; Borgström, S.; Breuste, J.; Gomez-Baggethun, E.; Gren, Å.; Hamstead, Z.; Hansen, R.; et al. A quantitative review of urban ecosystem service assessments: Concepts, models, and implementation. Ambio 2014, 43, 413–433. [Google Scholar] [CrossRef] [PubMed]
- Rasmussen, L.V.; Mertz, O.; Christensen, A.E.; Danielsen, F.; Dawson, N.; Xaydongvanh, P. A combination of methods needed to assess the actual use of provisioning ecosystem services. Ecosyst. Serv. 2016. [Google Scholar] [CrossRef]
- Sugar Corporation Kuraz Sugar Development Project. Available online: http://www.etsugar.gov.et/en/projects/item/26-kuraz-sugar-development-project (accessed on 12 February 2013).
- Avery, S. Hydrological Impacts of Ethiopia’s Omo Basin on Kenya’s Lake Turkana Water Levels and Fisheries; African Development Bank: Nairobi, Kenya, 2010. [Google Scholar]
- Avery, S. Lake Turkana & the Lower Omo: Hydrological Impacts of Major Dam & Irrigation Development: Volume I—Report; African Studies Centre, the University of Oxford: Oxford, UK, 2012. [Google Scholar]
- Carr, C.J. River Basin Development and Human Rights in Eastern Africa: A Policy Crossroads; Springer: Washington, DC, USA, 2016; ISBN 9783319284781. [Google Scholar]
- Hodbod, J.; Stevenson, E.G.J.; Akall, G.; Akuja, T.; Angelei, I.; Bedasso, E.A.; Buffavand, L.; Derbyshire, S.; Eulenberger, I.; Gownaris, N.; et al. Social-ecological change in the Omo-Turkana basin: A synthesis of current developments. Ambio 2019, 1–17. [Google Scholar] [CrossRef] [PubMed]
- Avery, S.; Tebbs, E. Lake Turkana, major Omo River developments, associated hydrologicycle change and consequent lake physical and ecological change. J. Gt. Lakes Res. 2018, 44, 1164–1182. [Google Scholar] [CrossRef]
- Stevenson, E.G.J.; Buffavand, L. “Do our bodies know their ways?” Villagization, food insecurity, and ill-being in Ethiopia’s Lower Omo Valley. Afr. Stud. Rev. 2018, 61, 109–133. [Google Scholar] [CrossRef]
- Buffavand, L. ‘The land does not like them’: Contesting dispossession in cosmological terms in Mela, south-west Ethiopia. J. East. Afr. Stud. 2016, 10, 476–493. [Google Scholar] [CrossRef]
- Zhu, X.; Pfueller, S.; Whitelaw, P.; Winter, C. Spatial differentiation of landscape values in the Murray river region of Victoria, Australia. Environ. Manag. 2010, 45, 896–911. [Google Scholar] [CrossRef]
- Feibel, C.S. A Geological History of the Turkana Basin. Evol. Anthropol. Issues News Rev. 2011, 20, 206–216. [Google Scholar] [CrossRef]
- Butzer, K.W. Contemporary Depositional Environments of the Omo Delta. Nature 1970, 226, 425–430. [Google Scholar] [CrossRef] [PubMed]
- Hopson, A.J. Lake Turkana: A Report on the Findings of the Lake Turkana Project, 1972–1975, 1972–1975, Volumes 1-6, Funded by the Government of Kenya and the Ministry of Overseas Development; Overseas Development Administration: London, UK; The University of Stirling: Stirling, UK, 1982. [Google Scholar]
- Carr, C.J. Humanitarian Catastrophe and Regional Armed Conflict Brewing in the Transborder Region of Ethiopia, Kenya and South Sudan: The Proposed Gibe III Dam in Ethiopia; Africa Resources Working Group (ARWG): Berkeley, CA, USA, 2012. [Google Scholar]
- Turton, D. The Downstream Impact, Unpublished Paper Given at the School of Oriental and African Studies; University of London: Oxford, UK, 2010. [Google Scholar]
- Matsuda, H. Riverbank Cultivation in the Lower Omo Valley: The intensive farming system of the Kara, Southwestern Ethiopia. In Essays in Northeast African Studies. Senri Ethnological Studies 43; Sato, S., Kurimoto, E., Eds.; National Museum of Ethnology: Osaka, Japan, 1996; pp. 1–28. [Google Scholar]
- Tornay, S. The Nyangatom: An outline of their ecology and social organization. In Peoples and Cultures of the Ethio-Sudan Borderlands; Bender, M.L., Ed.; African Studies Center, Michigan State University: East Lansing, MI, USA, 1981; pp. 137–178. [Google Scholar]
- Central Statistical Agency. Summary and Statistical Report of the 2007 Population and Housing Census; Central Statistical Agency: Addis Ababa, Ethiopia, 2008. [Google Scholar]
- Blau, J.; Blau Philine, J. Making Sense of Past, Present and Future. Images of Modern and Past Pastoralism among Nyangatom Herders in South Omo, Ethiopia. Land 2018, 7, 54. [Google Scholar] [CrossRef]
- Glowacki, L.; Wrangham, R. Warfare and reproductive success in a tribal population. Proc. Natl. Acad. Sci. USA. 2015, 112, 348–353. [Google Scholar] [CrossRef] [PubMed]
- Carr, C.J. Nyangatom Livelihood and the Omo Riverine Forest. In River Basin Development and Human Rights in Eastern Africa—A Policy Crossroads; Springer International Publishing: Cham, Switzerland, 2017; pp. 145–156. [Google Scholar]
- Kamski, B. The Kuraz Sugar Development Project (KSDP) in Ethiopia: Between ‘sweet visions’ and mounting challenges. J. East. Afr. Stud. 2016, 10, 568–580. [Google Scholar] [CrossRef]
- Household Figures; Livestock Department: Kangaten, Ethiopia, 2010.
- Mapedza, E.; Wright, J.; Fawcett, R. An investigation of land cover change in Mafungautsi Forest, Zimbabwe, using GIS and participatory mapping. Appl. Geogr. 2003, 23, 1–21. [Google Scholar] [CrossRef]
- Pearson, A.L.; Rzotkiewicz, A.; Mwita, E.; Lopez, M.C.; Zwickle, A.; Richardson, R.B. Participatory mapping of environmental resources: A comparison of a Tanzanian pastoral community over time. Land Use Policy 2017, 69, 259–265. [Google Scholar] [CrossRef]
- Millennium Ecosystem Assessment. Ecosystems and Human Well-Being: Current State and Trends; Island Press: Washington, DC, USA, 2005; ISBN 9781559632270. [Google Scholar]
- Hernández-Morcillo, M.; Plieninger, T.; Bieling, C. An empirical review of cultural ecosystem service indicators. Ecol. Indic. 2013, 29, 434–444. [Google Scholar] [CrossRef]
- Gorelick, N.; Hancher, M.; Dixon, M.; Ilyushchenko, S.; Thau, D.; Moore, R. Google Earth Engine: Planetary-scale geospatial analysis for everyone. Remote Sens. Environ. 2017, 202, 18–27. [Google Scholar] [CrossRef]
- USGS. Landsat 7 (L7) Data Users Handbook; USGS and NASA: Reston, VA, USA; Greenbelt, MD, USA, 2018. [Google Scholar]
- USGS. Landsat 8 Data Users Handbook; USGS and NASA: Reston, VA, USA; Greenbelt, MD, USA, 2019. [Google Scholar]
- USGS. Landsat 8 Surface Reflectance Code (Lasrc) Product Guide; USGS and NASA: Reston, VA, USA; Greenbelt, MD, USA, 2019. [Google Scholar]
- Gong, P.; Wang, J.; Yu, L.; Zhao, Y.; Zhao, Y.; Liang, L.; Niu, Z.; Huang, X.; Fu, H.; Liu, S.; et al. Finer resolution observation and monitoring of global land cover: First mapping results with Landsat TM and ETM+ data. Int. J. Remote Sens. 2013, 34, 2607–2654. [Google Scholar] [CrossRef]
- Dorais, A.; Cardille, J.; Dorais, A.; Cardille, J. Strategies for Incorporating High-Resolution Google Earth Databases to Guide and Validate Classifications: Understanding Deforestation in Borneo. Remote Sens. 2011, 3, 1157–1176. [Google Scholar] [CrossRef]
- Jain, M.; Mondal, P.; DeFries, R.; Small, C.; Galford, G. Mapping cropping intensity of smallholder farms: A comparison of methods using multiple sensors. Remote Sens. Environ. 2013, 134, 210–223. [Google Scholar] [CrossRef]
- SOFTWEL Pvt Ltd. SW Maps—Mobile GIS. Available online: http://swmaps.softwel.com.np/ (accessed on 30 June 2019).
- Pertaub, D.-P.; Tekle, D.; Stevenson, E.G.J. Flood Retreat Agriculture in the Lower Omo Valley, Ethiopia (SIDERA Briefing Note #2). In Omo-Turkana Research Network Briefing Notes; Hodbod, J., Stevenson, E.G.J., Eds.; OTuRN: Lansing, MI, USA, 2019; Available online: https://www.canr.msu.edu/oturn/briefing_notes (accessed on 30 June 2019).
- Tefera, T.K.; Ahmed, M.E. The Contribution of Productive Safety Net Program on Household Food Security of Tach Gayint Woreda, South Gonder, Ethiopia. Int. J. Afr. Asian Stud. 2017, 29, 18–27. [Google Scholar]
- The World Bank Productive Safety Net Project (PSNP). Available online: http://go.worldbank.org/E4PE1DEGS0 (accessed on 30 June 2019).
- Eulenberger, I.; Kamski, B.; Longole, H. Pastoral Civil Societies: Cooperative Empowerment Across Boundaries in Borderlands of Kenya, Uganda and Ethiopia; Study of Civil Society in Eastern African Border Regions; Arnold Bergstraesser Institute: Freiburg, Germany, 2018; Available online: https://www.arnold-bergstraesser.de/sites/default/files/eulenberger_pastoralist_civil_societies.pdf (accessed on 30 June 2019).
- Bassi, M. Primary identities in the lower Omo valley: Migration, cataclysm, conflict and amalgamation, 1750–1910. J. East. Afr. Stud. 2011, 5, 129–157. [Google Scholar] [CrossRef]
- Lydall, J. Reviewed Work: The Kwegu. RAIN 1982, 50, 22–24. [Google Scholar] [CrossRef]
- Human Rights Watch. “What Will Happen if Hunger Comes?” Abuses against the Indigenous Peoples of Ethiopia’s Lower Omo Valley; Human Rights Watch: New York, NY, USA, 2012. [Google Scholar]
- Burkhard, B.; Maes, J. Mapping Ecosystem Services; Burkhard, B., Maes, J., Eds.; Pensoft Publishers: Sofia, Bulgaria, 2017; Volume 1, ISBN 978-954-642-830-1. [Google Scholar]
- Tebbs, E.; Rowland, C.; Smart, S.; Maskell, L.; Norton, L. Regional-Scale High Spatial Resolution Mapping of Aboveground Net Primary Productivity (ANPP) from Field Survey and Landsat Data: A Case Study for the Country of Wales. Remote Sens. 2017, 9, 801. [Google Scholar] [CrossRef]
| Community | Water | Crops | Grazing Livestock | Wild Fruits | Fish | TFF | Bush Meat | Shade | Salt | Honey |
|---|---|---|---|---|---|---|---|---|---|---|
| K-W | 8 | 9 | 10 | 7 | 5 | 2 | 6 | 1 | 3 | 4 |
| K-M | 10 | 8 | 9 | 6 | 2 | 3 | 1 | 7 | 5 | 4 |
| A-W | 10 | 10 | 10 | 4 | 5 | 7 | 1 | 2 | 6 | 3 |
| A-M | 10 | 9 | 8 | 7 | 4 | 5 | 6 | 3 | 2 | 1 |
| N-W | 10 | 10 | 8 | 3 | 5 | 6 | 4 | 7 | 2 | 1 |
| N-M | 10 | 9 | 8 | 7 | 6 | 2 | 5 | 3 | 1 | 4 |
| Mean | 9.7 | 9.2 | 8.8 | 5.7 | 4.5 | 4.2 | 3.8 | 3.8 | 3.2 | 2.8 |
| SD | 0.8 | 0.8 | 1 | 1.8 | 1.4 | 2.1 | 2.3 | 2.6 | 1.9 | 1.5 |
| Mean (W) | 9.3 | 9.7 | 9.3 | 4.7 | 5.0 | 5.0 | 3.7 | 3.3 | 3.7 | 2.7 |
| Mean (M) | 10.0 | 8.7 | 8.3 | 6.7 | 4.0 | 3.3 | 4.0 | 4.3 | 2.7 | 3.0 |
| Ecosystem Service | K-W | K-M | A-W | A-M | N-W | N-M | Overall |
|---|---|---|---|---|---|---|---|
| Grazingfodder | ⇘ | ⇘ | ⇗ | ⇘ | ⇘ | ⇘ | ⇘ |
| Grazing—number of livestock supported | ⇗ | ⇗ | ⇘ | ⇗ | ⇗ | ||
| Drinking water—livestock | ⇘ | ⇘ | ⇘ | ⇘ | |||
| Drinking water—humans | ⇔ | ⇘ | ⇘ | ||||
| Salt | ⇘ | ⇘ | ⇘ | ||||
| Cultivation—flood | ⇘ | ⇘ | ⇘ | ⇘ | ⇘ | ⇘ | ⇘ |
| Cultivation—lake | ⇘ | ⇘ | ⇘ | ⇘ | ⇘ | ⇘ | ⇘ |
| Cultivation—rainfed | ⇘ | ⇘ | ⇘ | ⇘ | ⇘ | ⇘ | ⇘ |
| Cultivation—Irrigation | ⇘ | ⇘ | ⇘ | ⇘ | ⇘ | ||
| Wild fruits | ⇘ | ⇘ | ⇗ | ⇘ | ⇘ | ⇘ | ⇘ |
| Bush meat | ⇘ | ⇘ | ⇘ | ⇘ | |||
| Timber, Fuel, and Fiber | ⇘ | ⇘ | ⇘ | ||||
| Honey | ⇘ | ⇘ | |||||
| Fishing | ⇘ | ⇘ | ⇘ | ⇘ | |||
| Schools | ⇗ | ⇗ | ⇗ | ⇔ | ⇗ | ⇗ | |
| Ceremonial sites | ⇘ | ⇗ | ⇗ | ⇗ | ⇘ | ⇔ | ⇗ |
| Villages | ⇗ | ⇗ | ⇗ | ⇗ |
| K-W | K-M | A-W | A-M | N W | N-M | |
|---|---|---|---|---|---|---|
| Increasing 1 | Schools | People | Schools | Ceremonial sites | Schools | Donkeys |
| Increasing 2 | Cattle numbers | Cattle numbers | Ceremonial sites | Schools | Sheep & goat numbers | Pond cultivation |
| Increasing 3 | Salt | Villages | Grazing | n/a | Pond cultivation | Villages |
| Decreasing 1 | River cultivation | River cultivation | River cultivation | River cultivation | River cultivation | River cultivation |
| Decreasing 2 | Bush meat | Lake cultivation | Lake cultivation | Cattle | Irrigation | Irrigation |
| Decreasing 3 | Grazing/ water | Grazing | Pond cultivation | Grazing | Lake cultivation | Lake cultivation |
| Community | 2013 | 2018 |
|---|---|---|
| K-W | River > Lake > Valley | Valleys > Lake |
| K-M | River > Lake > Valley > Ponds | Lake > Valley > Ponds |
| A-W | River > Lake > Irrigation > Pond | Pond > Irrigation > Lake |
| A-M | River > Irrigation > Pond > Lake | Pond > Lake > Irrigation |
| N-W | River > Lake > Irrigation > Pond | Lake > Pond > Irrigation |
| N-M | River > Lake > Irrigation > Pond | Pond > Lake > Irrigation |
| River | Lakes | Ponds | Bare Ground | Grassland | Shrubland | Forest | ||||||||||||||
|---|---|---|---|---|---|---|---|---|---|---|---|---|---|---|---|---|---|---|---|---|
| P | S | P | S | P | S | |||||||||||||||
| Kebele | ha | % | ha | % | ha | % | ha | % | ha | % | ha | % | ha | % | ha | % | ha | % | ha | % |
| Ayepa | 3.9 | 53 | −42.6 | −72 | NA | NA | −3.9 | −17 | 0 | 0 | −1.6 | −4 | 778.3 | 30 | −496.9 | −21 | −337.6 | −18 | 100.3 | 15 |
| Charey | 6 | 55 | −7.2 | −52 | NA | NA | −29.1 | −98 | NA | NA | −16.8 | −24 | 284.8 | 36 | −766.1 | −33 | 615 | 33 | −85.8 | −21 |
| Kangaten | NA | NA | NA | NA | NA | NA | −41 | −98 | NA | NA | NA | NA | 179.8 | 61 | −110 | −75 | −28.7 | −75 | NA | NA |
| Kopriay | 1.6 | 62 | −3.2 | −60 | NA | NA | −8.6 | −88 | NA | NA | 2.4 | 21 | 526.5 | 52 | −206.9 | −10 | −305.9 | −21 | −6 | −2 |
| Kuchuru | 16.5 | 91 | −68.4 | −62 | −0.8 | −82 | −109.6 | −98 | NA | NA | −17 | −95 | 491 | 28 | −1737.7 | −28 | 1040.4 | 12 | 385.3 | 13 |
| Lokawamunyen | NA | NA | NA | NA | NA | NA | NA | NA | NA | NA | 0.4 | 200 | 20.7 | 7 | −18.5 | −32 | −4.3 | −24 | NA | NA |
| Lopakor | NA | NA | NA | NA | NA | NA | NA | NA | -0.4 | −57 | −101 | −99 | 689.9 | 29 | −277.4 | −9 | −315.3 | −20 | 4.2 | 62 |
| Lorenkachawe | 2 | 70 | −8.3 | −67 | −5 | −52 | 196.6 | 113 | NA | NA | −28.5 | −62 | 1672.3 | 131 | −231.2 | −5 | −1632.9 | −39 | 34.7 | 26 |
| Napasmuria | NA | NA | NA | NA | NA | NA | −15.5 | −85 | NA | NA | −1.9 | −91 | 60.2 | 19 | −47.4 | −61 | 3.8 | 28 | 0.7 | 800 |
| Napatokoyet | 12 | 122 | −28.3 | −84 | −0.9 | −83 | −90.8 | −93 | NA | NA | NA | NA | 462.1 | 16 | 336.2 | 22 | −507.8 | −26 | −178.1 | −35 |
| Naweyape | NA | NA | NA | NA | NA | NA | NA | NA | NA | NA | −29 | −87 | 1270 | 71 | −1134.3 | −43 | −93.7 | −9 | −13.1 | −91 |
| Norogoy | 11.6 | 126 | −31.7 | −71 | NA | NA | −41.2 | −94 | −0.9 | −34 | −47.6 | −66 | 1049.6 | 42 | −554.4 | −27 | −352.2 | −17 | −33.1 | −8 |
| Total | 54 | −189 | −7 | −143 | −1 | −242 | 7486 | −5244 | −1920 | 209 | ||||||||||
| Land Cover | ES Sub-Categories Supporteda | Mean Number of ES | Mean Number of ES Sub-Categories | Mean ES Capacity | Mean ES Value |
|---|---|---|---|---|---|
| Shrubland | Livestock (3), Wild Fruits (3), Bushmeat (3), TFF (2), Crops (1), Honey (1), Shade (1) | 9.33 | 4.67 | 0.95 | 0.83 |
| Ponds | Water (3), Crops (3), Livestock (2), Shade (1), Wild Fruits (1), TFF (1), Honey (1), Bushmeat (1) | 6.33 | 4.33 | 0.70 | 0.78 |
| River | Fish (3), Water (3), Livestock (1), Bushmeat (1) | 4.67 | 2.67 | 0.58 | 0.66 |
| Lakes | Crops (3), Fish (2), Livestock (2), Wild Fruits (1), Water (1), Honey (1), Bushmeat (1), TFF (1) | 5.67 | 4.00 | 0.61 | 0.65 |
| Forest | Wild Fruits (3), Wood (3), Bushmeat (2), Honey (2), Livestock (1) | 5.00 | 3.67 | 0.77 | 0.57 |
| Grassland | Livestock (3), Crops (1), Bushmeat (1), TFF (1) | 4.67 | 2.00 | 0.36 | 0.46 |
| Cropland | Crops (3) | 1.00 | 1.00 | 0.18 | 0.24 |
| Bare ground and Urban | None | 0 | 0 | 0 | 0 |
| Number of Services | No. of ES Sub-Categories | ES Capacity | ES Value | |||||||||
|---|---|---|---|---|---|---|---|---|---|---|---|---|
| Kebele | 00–03 | 16–19 | % change | 00–03 | 16–19 | % change | 00–03 | 16–19 | % change | 00–03 | 16–19 | % change |
| Kopriay | 5.20 | 4.30 | −16 | 2.50 | 2.10 | −16 | 0.49 | 0.41 | −16 | 0.49 | 0.41 | −15 |
| Ayepa | 4.30 | 3.60 | −16 | 2.10 | 1.80 | −14 | 0.42 | 0.36 | −14 | 0.41 | 0.34 | −15 |
| Napasmuria | 1.40 | 0.76 | −46 | 0.70 | 0.36 | −48 | 0.12 | 0.07 | −44 | 0.14 | 0.07 | −49 |
| Kangaten | 2.50 | 0.52 | −79 | 1.20 | 0.24 | −81 | 0.22 | 0.04 | −80 | 0.24 | 0.05 | −80 |
| Charey | 5.60 | 5.90 | 5 | 2.80 | 2.90 | 5.4 | 0.55 | 0.58 | 7 | 0.53 | 0.55 | 3 |
| Lorenkachawe | 6.00 | 4.50 | −25 | 2.90 | 2.20 | −25 | 0.57 | 0.42 | −26 | 0.56 | 0.43 | −24 |
| Norogoy | 4.50 | 3.50 | −21 | 2.20 | 1.80 | −21 | 0.44 | 0.35 | −20 | 0.42 | 0.33 | −21 |
| Lopakor | 4.10 | 3.50 | −17 | 2.00 | 1.60 | −18 | 0.37 | 0.31 | −18 | 0.39 | 0.32 | −17 |
| Naweyape | 4.00 | 2.80 | −29 | 1.90 | 1.30 | −28 | 0.35 | 0.26 | −27 | 0.38 | 0.27 | −30 |
| Lokawamunyen | 1.20 | 0.92 | −26 | 0.57 | 0.43 | −24 | 0.11 | 0.08 | −24 | 0.12 | 0.09 | −26 |
| Napatokoyet | 4.10 | 3.40 | −16 | 2.10 | 1.70 | −19 | 0.41 | 0.33 | −19 | 0.39 | 0.32 | −16 |
| Kuchuru | 6.30 | 6.40 | 2 | 3.20 | 3.30 | 3.4 | 0.64 | 0.67 | 4 | 0.60 | 0.60 | 1 |
© 2019 by the authors. Licensee MDPI, Basel, Switzerland. This article is an open access article distributed under the terms and conditions of the Creative Commons Attribution (CC BY) license (http://creativecommons.org/licenses/by/4.0/).
Share and Cite
Hodbod, J.; Tebbs, E.; Chan, K.; Sharma, S. Integrating Participatory Methods and Remote Sensing to Enhance Understanding of Ecosystem Service Dynamics Across Scales. Land 2019, 8, 132. https://doi.org/10.3390/land8090132
Hodbod J, Tebbs E, Chan K, Sharma S. Integrating Participatory Methods and Remote Sensing to Enhance Understanding of Ecosystem Service Dynamics Across Scales. Land. 2019; 8(9):132. https://doi.org/10.3390/land8090132
Chicago/Turabian StyleHodbod, Jennifer, Emma Tebbs, Kristofer Chan, and Shubhechchha Sharma. 2019. "Integrating Participatory Methods and Remote Sensing to Enhance Understanding of Ecosystem Service Dynamics Across Scales" Land 8, no. 9: 132. https://doi.org/10.3390/land8090132
APA StyleHodbod, J., Tebbs, E., Chan, K., & Sharma, S. (2019). Integrating Participatory Methods and Remote Sensing to Enhance Understanding of Ecosystem Service Dynamics Across Scales. Land, 8(9), 132. https://doi.org/10.3390/land8090132


