Article

Denitrification Rate and Its Potential to Predict Biogenic N2O Field Emissions in a Mediterranean Maize-Cropped Soil in Southern Italy

by
Annachiara Forte
1,2,* and
Angelo Fierro
1,2
1
Dipartimento di Biologia, Università di Napoli Federico II, 80126 Napoli, Italy
2
Laboratorio di Urbanistica e di Pianificazione del Territorio (LUPT), Università di Napoli Federico II, 80138 Napoli, Italy
*
Author to whom correspondence should be addressed.
Submission received: 10 May 2019 / Revised: 13 June 2019 / Accepted: 15 June 2019 / Published: 17 June 2019

Abstract

:
The denitrification rate in C2H2-amended intact soil cores and soil N2O fluxes in closed static chambers were monitored in a Mediterranean irrigated maize-cropped field. The measurements were carried out during: (i) a standard fertilization management (SFM) activity and (ii) a manipulation experimental (ME) test on the effects of increased and reduced application rates of urea at the late fertilization. In the course of the SFM, the irrigations following early and late nitrogen fertilization led to pulses of denitrification rates (up to 1300 μg N2O-N m−2 h−1) and N2O fluxes (up to 320 μg N2O-N m−2 h−1), thanks to the combined action of high soil temperatures and not limiting nitrates and water filled pore space (WFPS). During the ME, high soil nitrates were noted in all the treatments in the first one month after the late fertilization, which promoted marked N-losses by microbial denitrification (from 500 to 1800 μg N2O-N m−2 h−1) every time the soil WFPS was not limiting. At similar maize yield responses to fertilizer treatments, this result suggested no competition for N between plant roots and soil microbial community and indicated a probable surplus of nitrogen fertilizer input at the investigated farm. Correlation and regression analyses (CRA) on the whole set of data showed significant relations between both the denitrification rates and the N2O fluxes with three soil physical-chemical parameters: nitrate concentration, WFPS and temperature. Specifically, the response functions of denitrification rate to soil nitrates, WFPS and temperature could be satisfactorily modelled according to simple Michaelis-Menten kinetic, exponential and linear functions, respectively. Furthermore, the CRA demonstrated a significant exponential relationship between N2O fluxes and denitrification and simple empirical functions to predict N2O emissions from the denitrification rate appeared more fitting (higher concordance correlation coefficient) than the predictive empirical algorithm based on soil nitrates, WFPS and temperature. In this regard, the empirically established relationships between the denitrification rate on intact soil cores under field conditions and the soil variables provided local-specific threshold values and coefficients which may effectively work to calibrate and adapt existing N2O process-based simulation models to the local pedo-climatic conditions.

1. Introduction

Agricultural soils contribute to about 60% of the global anthropogenic N2O emission, mainly due to the increased input of N fertilizers [1]. It represents a relevant issue, since N2O is a potent greenhouse gas (GHG) accounting for about 6% of the overall global radiative forces [1], also significantly contributing to the depletion of stratospheric ozone [2]. Estimating N2O emission from cropped soils is therefore essential for determining the carbon footprint of agricultural supply chains and for devising strategies to mitigate the impact of agriculture on global warming. The issue remains challenging, especially at the within-field scale. N2O emissions show high variability in space and time due to the complex interaction of several environmental and management factors, such as site specific pedo-climatic conditions, crop type, irrigation systems and type, amount and timing of fertilizers supply, which drive microbial processes and gas diffusivity in soils [3,4,5,6,7].
Despite the relevance of the agricultural sector to the overall economy and sustainable development of the Mediterranean area, the topic of N2O emissions from Mediterranean cropped soils (both as process and inventory studies) did not receive the same level of attention as N2O fluxes in temperate agricultural areas. Only recent reviews have focused on a systematic analysis of N2O emissions from Mediterranean cropping systems [8,9,10]. These studies have highlighted an average overall emission factor EF (kg of on-site emitted N2O-N per kg of fertilizer N applied) for Mediterranean agriculture (about 0.5%) substantially lower than the default value (1%) of the Intergovernmental Panel on Climate Change (IPCC) [11] usually applied to inventory N2O emissions from fertilizer application. However, the specific water and fertilizer management significantly affected the pattern of N2O fluxes [9,10]. In this regard, intensive spring-summer crops, such as maize, resulted in more marked cumulative fluxes (close to the IPCC EF), due to the high N fertilization rate and water input (mainly through sprinkler irrigation systems) at high soil temperatures [10]. Due to the Mediterranean summer drought, the water input through irrigation (with its linked effect on soil WFPS) was highlighted as a key controlling factor of bacterial processes responsible for N2O evolution, leading to pulsed fluxes and also tuning the effect of different fertilizers strategies [9,10].
Denitrification represents a significant source of nitrous oxide emission from soils [3,4,7,12] and it is often considered a cause of the low N use efficiency in agriculture, since it can interfere in soil-plant relationships, competing for mineral N sources and leading to N loss from the system both as N2O and N2 [13]. It plays a key role in the pathway of N2O evolution especially in fine textured soils, characterized by high colloids content and water retention capacity affecting soil aeration and promoting favourable anaerobic conditions for denitrifying activity [3,4,12,14,15]. Indeed, the denitrification in soils results from the interaction of several parameters, among them the soil temperature, pH, nitrate, carbon substrate availability and soil water content [4,16]. It is characterized by high values of spatial variability, since it is usually confined to hotspots (i.e., soil aggregates characterised by anoxic microsites, high nitrate availability and organic carbon content) which are not homogeneously distributed along the soil profile [7,17,18].
As per N2O fluxes, several studies have been carried out to investigate denitrifying activity pattern and its end-products under temperate climate in response to irrigation and both mineral N fertilizers and organic amendments; otherwise, less extensive research has been executed in Mediterranean spring-summer crops [19,20,21,22,23]. In these systems, denitrification can be promoted by the combined enhancement of irrigation and high soil temperatures [21,22]. This especially applies to the widespread zootechnical farms, where the use of the livestock slurry (in addition to mineral fertilization) can promote the denitrifying activities, due to the easily degradable organic C supplied and the potential surplus of N with respect to the crop requirements [21,22,24]. The understanding of the denitrification dynamic in response to the driving soil parameters is a crucial step to achieve robust and reliable estimates of bacterial denitrification and soil N2O fluxes through modeling approaches [12].
In order to avoid the emission measurements in the field, a great number of models have been developed to simulate agricultural ecosystem carbon and nitrogen biochemical cycle and the response of soil N2O emissions to different agricultural managements of cropped land, combining aspects of mechanistic and empirical approaches [4,5,6,12,16]. The empirical models require minimal input data and derive emissions estimates from the direct measurement of driving soil parameters such as soil temperature, WFPS and mineral N availability [25,26]. They can effectively reflect peculiarities of the investigated local scale; conversely, they might be so specific to be not applicable to different systems [16]. The process models are quite complex, deal with huge sets of input data and calculate N2O fluxes from their response to the pattern of relevant soil parameters and bacterial activities, in their turn derived from mathematical functions based on chemical-physical laws [27,28,29,30,31,32,33,34]. This process-knowledge based approach can be more reliable for the quantitative estimation of N2O emissions at field scale and the development of N2O mitigation measures, but might require a parameterisation through numerical fitting to match specific pedo-climatic conditions, adding elements of empiricism [5,6,16,30,34,35].
The agro-ecological process-models take into account N2O emissions by microorganisms through specific process-based denitrification and nitrification sub-models, such as the NOE [31] and the NGAS [27,28] models using potential process rates then tuned by key soil drivers. The denitrification process in these models is calculated through similar rate-controlling variables, as a function of soil water content, temperature, pH and concentrations of relevant substrates (e.g., labile carbon, ammonium, nitrate, and so forth) [6,12,36,37]. Specifically, the denitrification rates in most simplified process-models are based on potential denitrification (i.e., the capacity of soil microorganisms to reduce nitrates under non-limiting conditions) weighted by a product of reduction functions taking into account the effect of environmental soil conditions such as water content and degree of saturation (as a complementary for oxygen diffusion), nitrate concentration, temperature and pH [6,12,36,37,38]. In this regard, there is a general consensus about the mathematical rationale behind the simplified process models for denitrification, with Michaelis-Menten kinetics, non-linear (exponential, power and sigmoidal) functions and Arrhenius-type exponential equations usually applied to tune the denitrification rate in response to soil nitrate availability, water content and temperature, respectively [6,7,36,38]. However, there is no consensus about the specific algorithms for reduction functions. They are empirically derived through regression analyses between denitrifying activity and soil driving variables from different site-specific study and therefore can greatly differ among the models [35,36,38]. In this regard, each simplified process model can effectively work only provided that the parameters are calibrated for the local soil environmental conditions [7,34,35,36,38]. This especially applies to the water content reduction function and the eventual threshold value for the degree of saturation (the critical WFPS below which it is assumed no denitrification occurs) affecting in a more sensitive way the simulation models and which therefore need to be determined through a great accuracy [7,12,35,36,38]. On this matter, the denitrification rate in soils under field conditions, without nutrients amendment, has been highlighted as an effective parameter to calibrate simplified denitrification models usually run as subroutines in process simulation models for N2O emissions [35].
In the lack of a comprehensive characterisation of soil N2O fluxes from Mediterranean croplands and of an exhaustive understanding of the driving microbial dynamic in response to the changing soil physical-chemical variables, the objective of the present process study was to investigate the pattern of the denitrification rate and the soil field N2O fluxes in an irrigated fine-textured maize-cropped soil in Campania Region (Southern Italy), where maize silage represents the main forage for the widespread buffalo livestock farms for “mozzarella” cheese production. To this end:
  • the denitrification rate in C2H2- amended intact soil cores incubated under field conditions and the soil field N2O fluxes by static closed chambers were monitored under the standard fertilization management (SFM) of the farm and during a manipulation experiment (ME) testing the effects of higher and lower application rates of urea at the late fertilization against the standard scheduling. Set of ancillary soil variables were analysed on each sampling date as well. In this regard the present study aimed at exploring the temporal pattern of denitrifying activity and N2O evolution as a function of the changes of soil environmental conditions driven by the fertilization and the irrigation agronomic practices;
  • the whole dataset, coming from the SFM and the manipulation experimental (ME) monitoring activities, was analysed to test potential correlations and regressions functions between the denitrification rate, the N2O fluxes and the soil parameters. Specifically, the authors hypothesized that the study could establish for both the denitrification rate on intact soil cores and the field N2O fluxes: (i) correlations and empirical regression functions with each one of the driving soil variables showing significant variations in time, with local-specific threshold values and coefficients for key soil parameters such as water content and nitrate availability; (ii) simple predictive combined multiplicative models, based on the empirically established relationships between variables, accounting for the main effect of each factor. Moreover, considering the fine texture of soil at the experimental site, the authors also hypothesized a correlation between the field N2O fluxes and the denitrifying activity, proving denitrification rate on intact soil cores as a good predictor parameter for N2O fluxes. In this regard, the current study aimed at pointing out empirically derived regression functions which could effectively work to further implement site-specific N2O empirical models and/or to calibrate existing N2O process-based simulation models to the local pedo-climatic conditions.

2. Materials and Methods

2.1. Study Site

The experimental field is part of a zootechnical farm located in the middle of the Sele River Plain in Campania Region, Southern Italy (Eboli), latitude 40°31’25.5″, longitude 14°57’26.8″, 15 m·a.s.l. The farm kindly hosts research activities of the “Federico II” University of Naples and belongs to the station networks of the CarboEurope-IP and NitroEurope-IP European projects. Climate is Mediterranean, characterized by dry summer and cold rainy winter. According to data collected from 1975 to 2005 by a nearby meteorological station (Bellizzi, mean altitude 15 m·a.s.l.), annual mean temperature is 15.5 °C and annual rainfall is 908 mm [39]. The FAO soil classification is Calcic Kastanozem Skeletic (WRB 2006) [26]. The soil parent material is calcium carbonate and has alluvial origin, deriving from the nearby Sele River. The soil presents a clay texture: clay 52%, silt 28%, sand 20%. In the top soil (0–15 cm), pH was on average subalkaline (7.5), according to the high presence of carbonates, with values closer to neutrality on sampling dates after irrigation events. Average organic matter was 2.5% (without significant variations in time during the monitoring activities); bulk density was 1.2 g cm−3; FC was 0.391 g water per g dry soil and WFPS at FC was 85.9%.

2.2. Field Management

The farm extends on about 50 hectares and produces mainly dairy products from on-farm produced milk by about 400 adult buffaloes. Relating to the nutrients cycle, it features as a semi-closed system. Most of the agricultural fields are tilled to grow fodder plants (corn, alfalfa or winter grass crops such as Lolium italicum) for fresh animal consumption or silage. The buffalo dejections from paddocks are stored in ponds and the manure and the slurry sewage are used as main source of nutrients for crops needs. Anyway, besides manuring, additional mineral and/or organic chemical fertilizers are spread also. Soil tillage schemes are conventional and herbicides are spread soon after sowing to control weeds during row crops. A centre pivot irrigation system is used to supply crops with water during the spring-summer period. Information about the tillage, sowing, fertilization, irrigation and harvest practices planned and performed by the farmer in the field during this study are listed in Table 1.

2.3. Experimental Set-Up

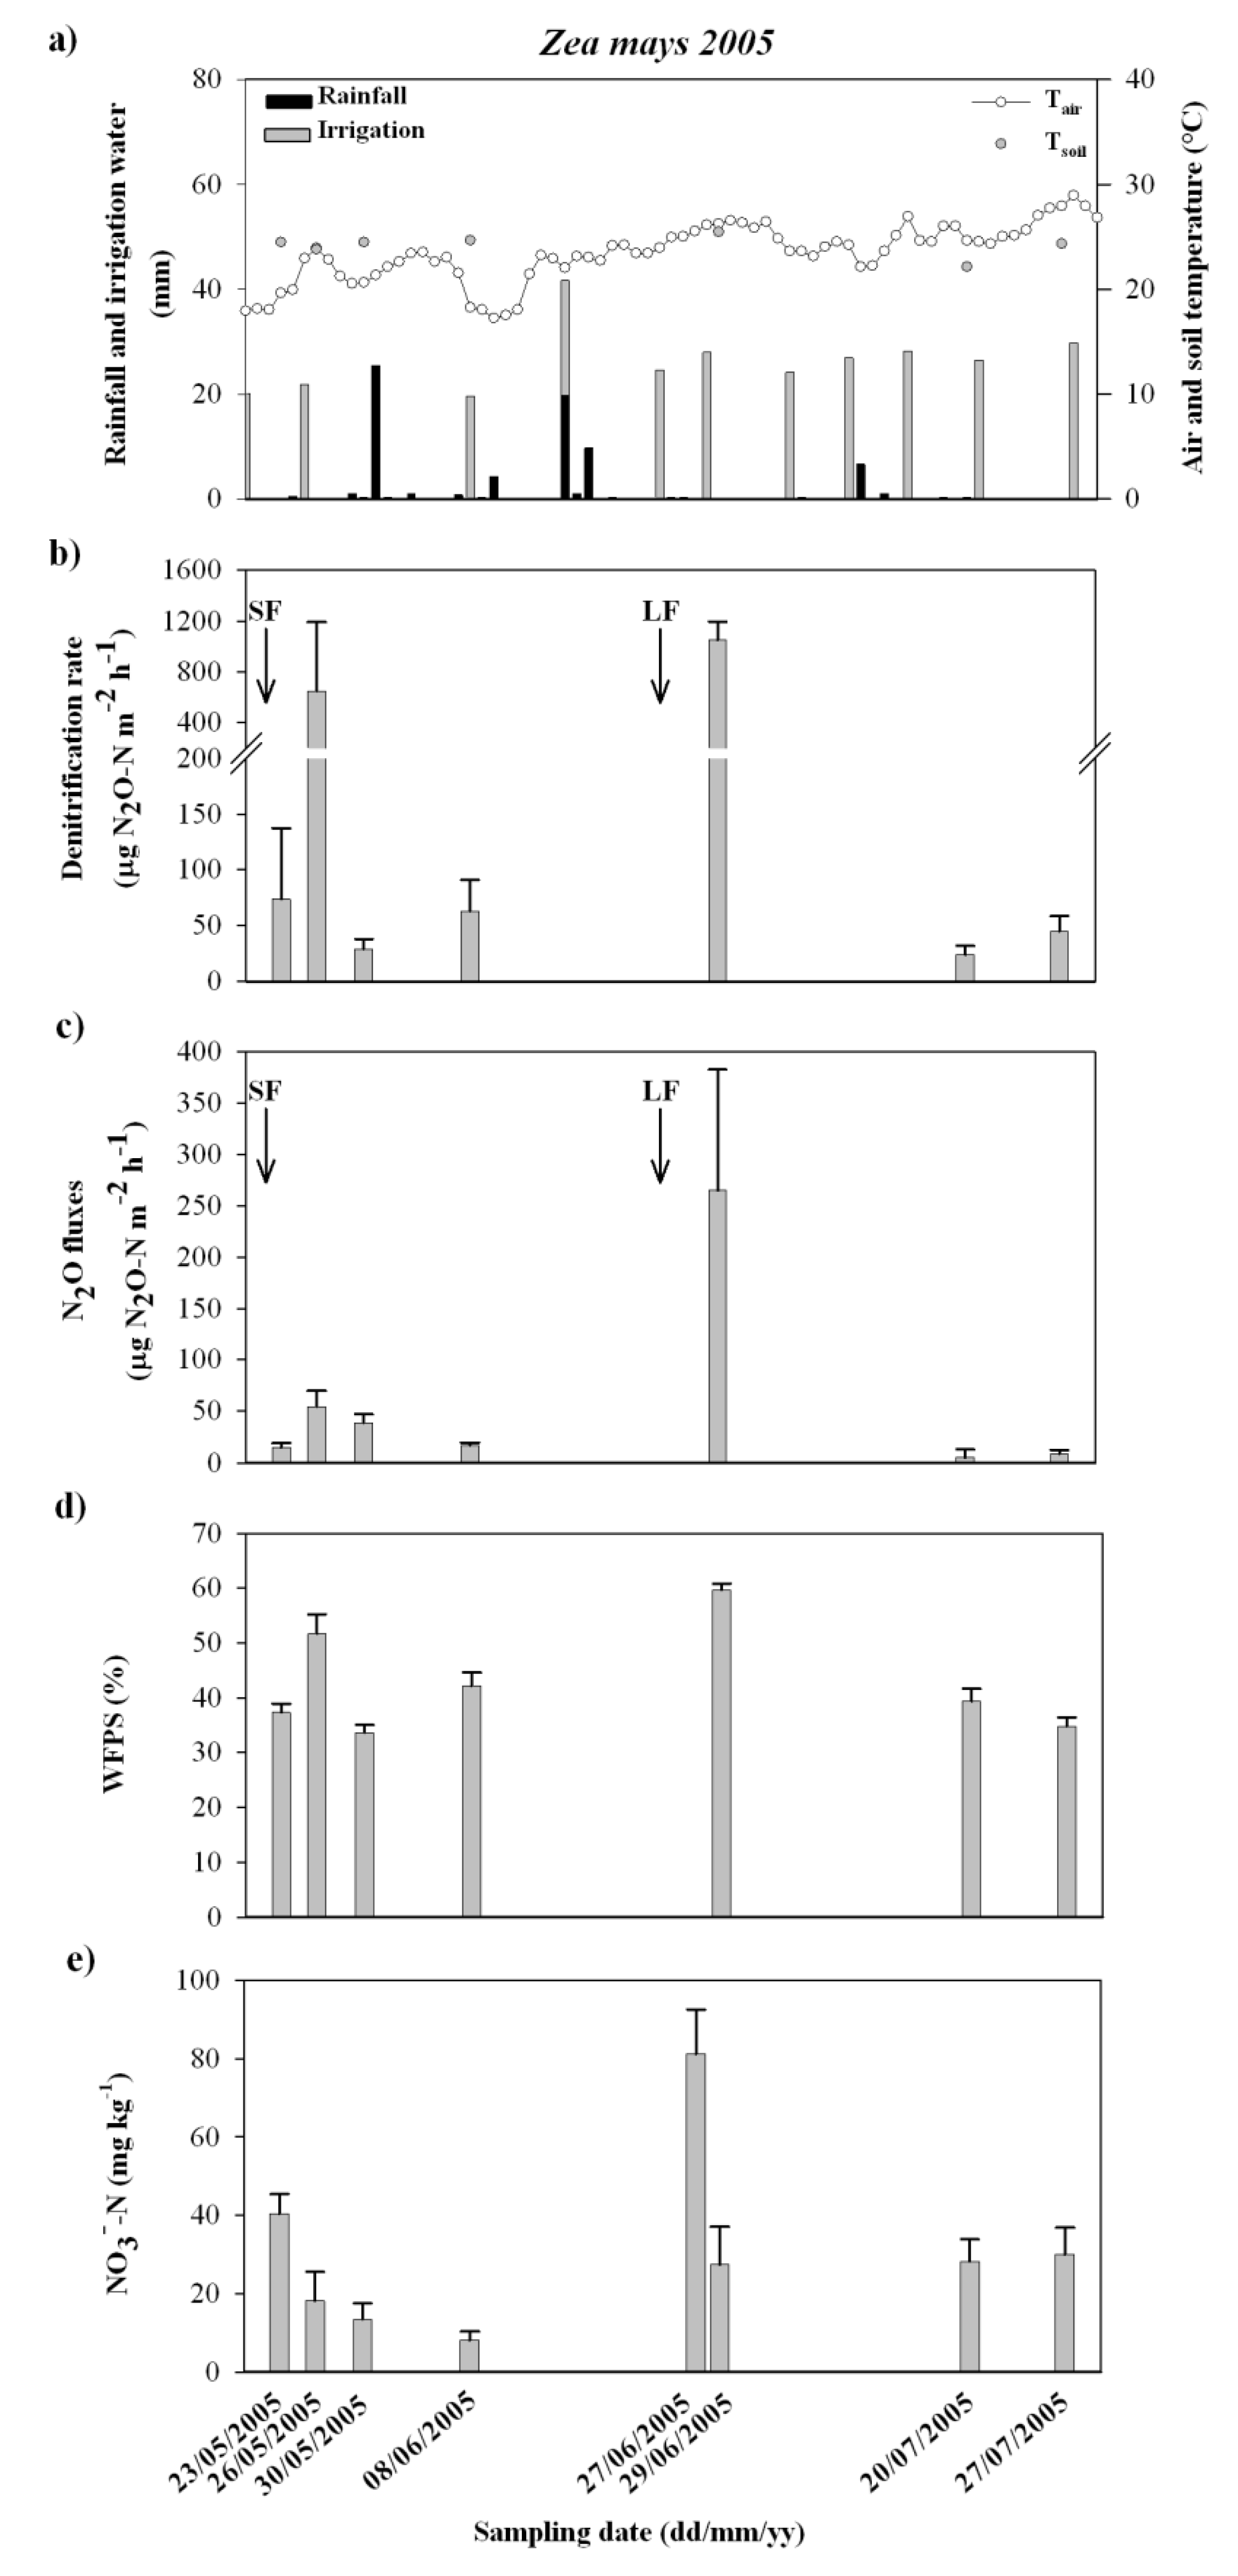
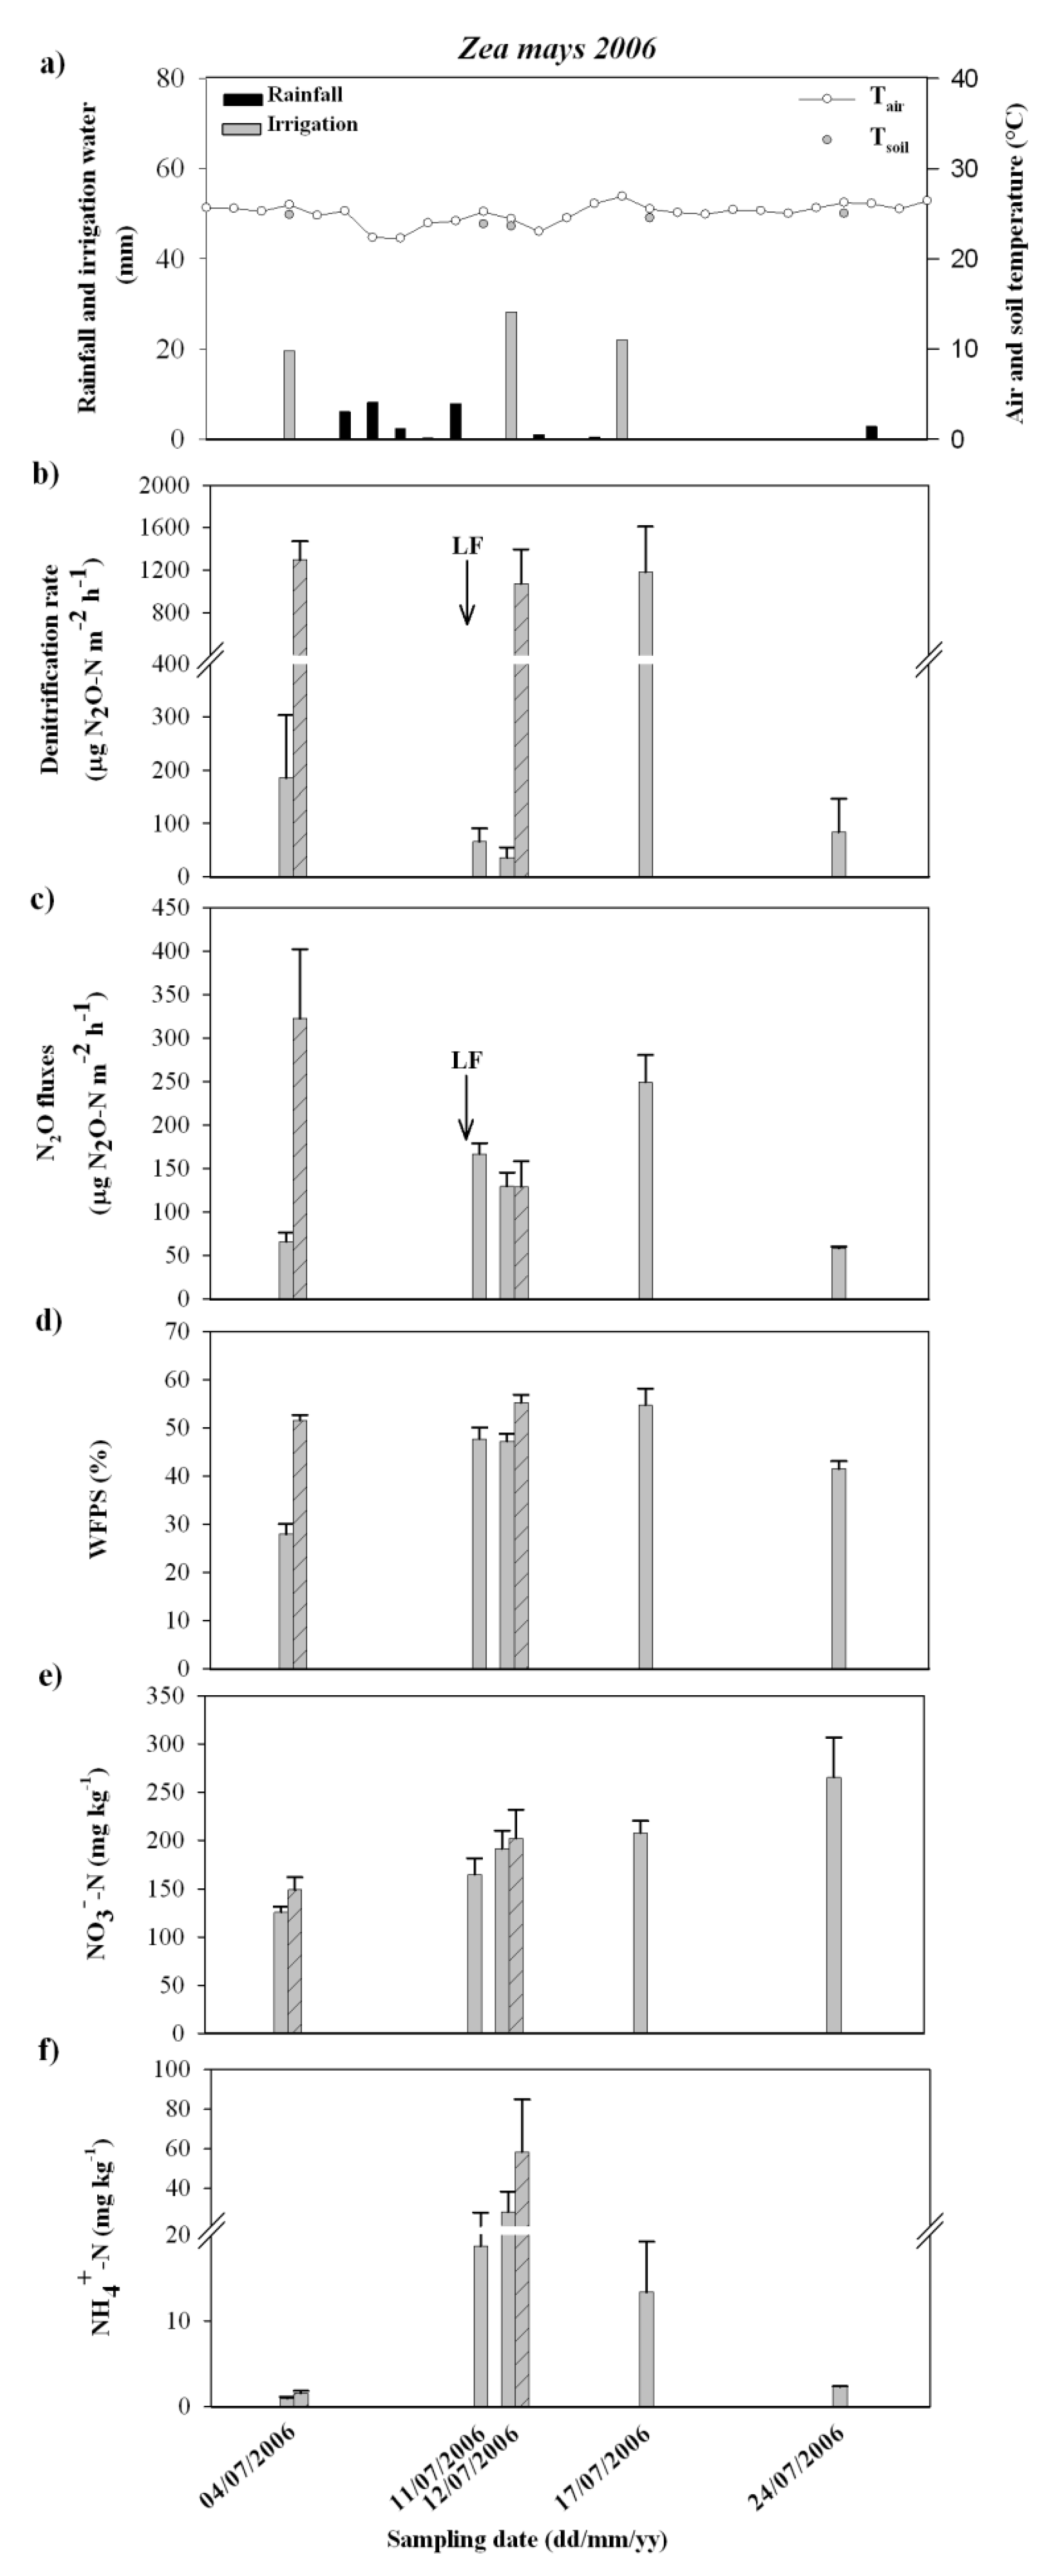
2.3.1. Monitoring Activities during the Standard Fertilization Management (SFM)

The measurements of the denitrification rate in intact soil cores and the field N2O fluxes were performed: (i) throughout the growing period of the maize crop in 2005 (from corn sowing to mowing) and (ii) starting from the late fertilization onward, during the maize growing season in 2006. In 2005, the intact soil cores for denitrification assessment (12 replicates) were collected close to the cover box collars (8 replicates) permanently placed in the field. On each sampling date, additional separate cores (8 replicates) were collected close to the collars to determine soil pH, gravimetric water content, WFPS, organic matter and nitrate concentration. In 2006, the experimental set-up was changed to further investigate the spatial variability of the denitrification and the N2O fluxes from soil in relation to the spatial variability of the driving soil parameter, such as nitrate and WFPS. To this end, the intact soil cores to assess denitrification (4 replicates) were sampled from the soil surface inside the cover box collars placed in the field on each sampling date (4 replicates). Part of the undisturbed soil cores was then gently removed by a sharp knife for soil physical-chemical characterisation before starting the denitrification measurement. At that time, also soil ammonium concentration was determined.

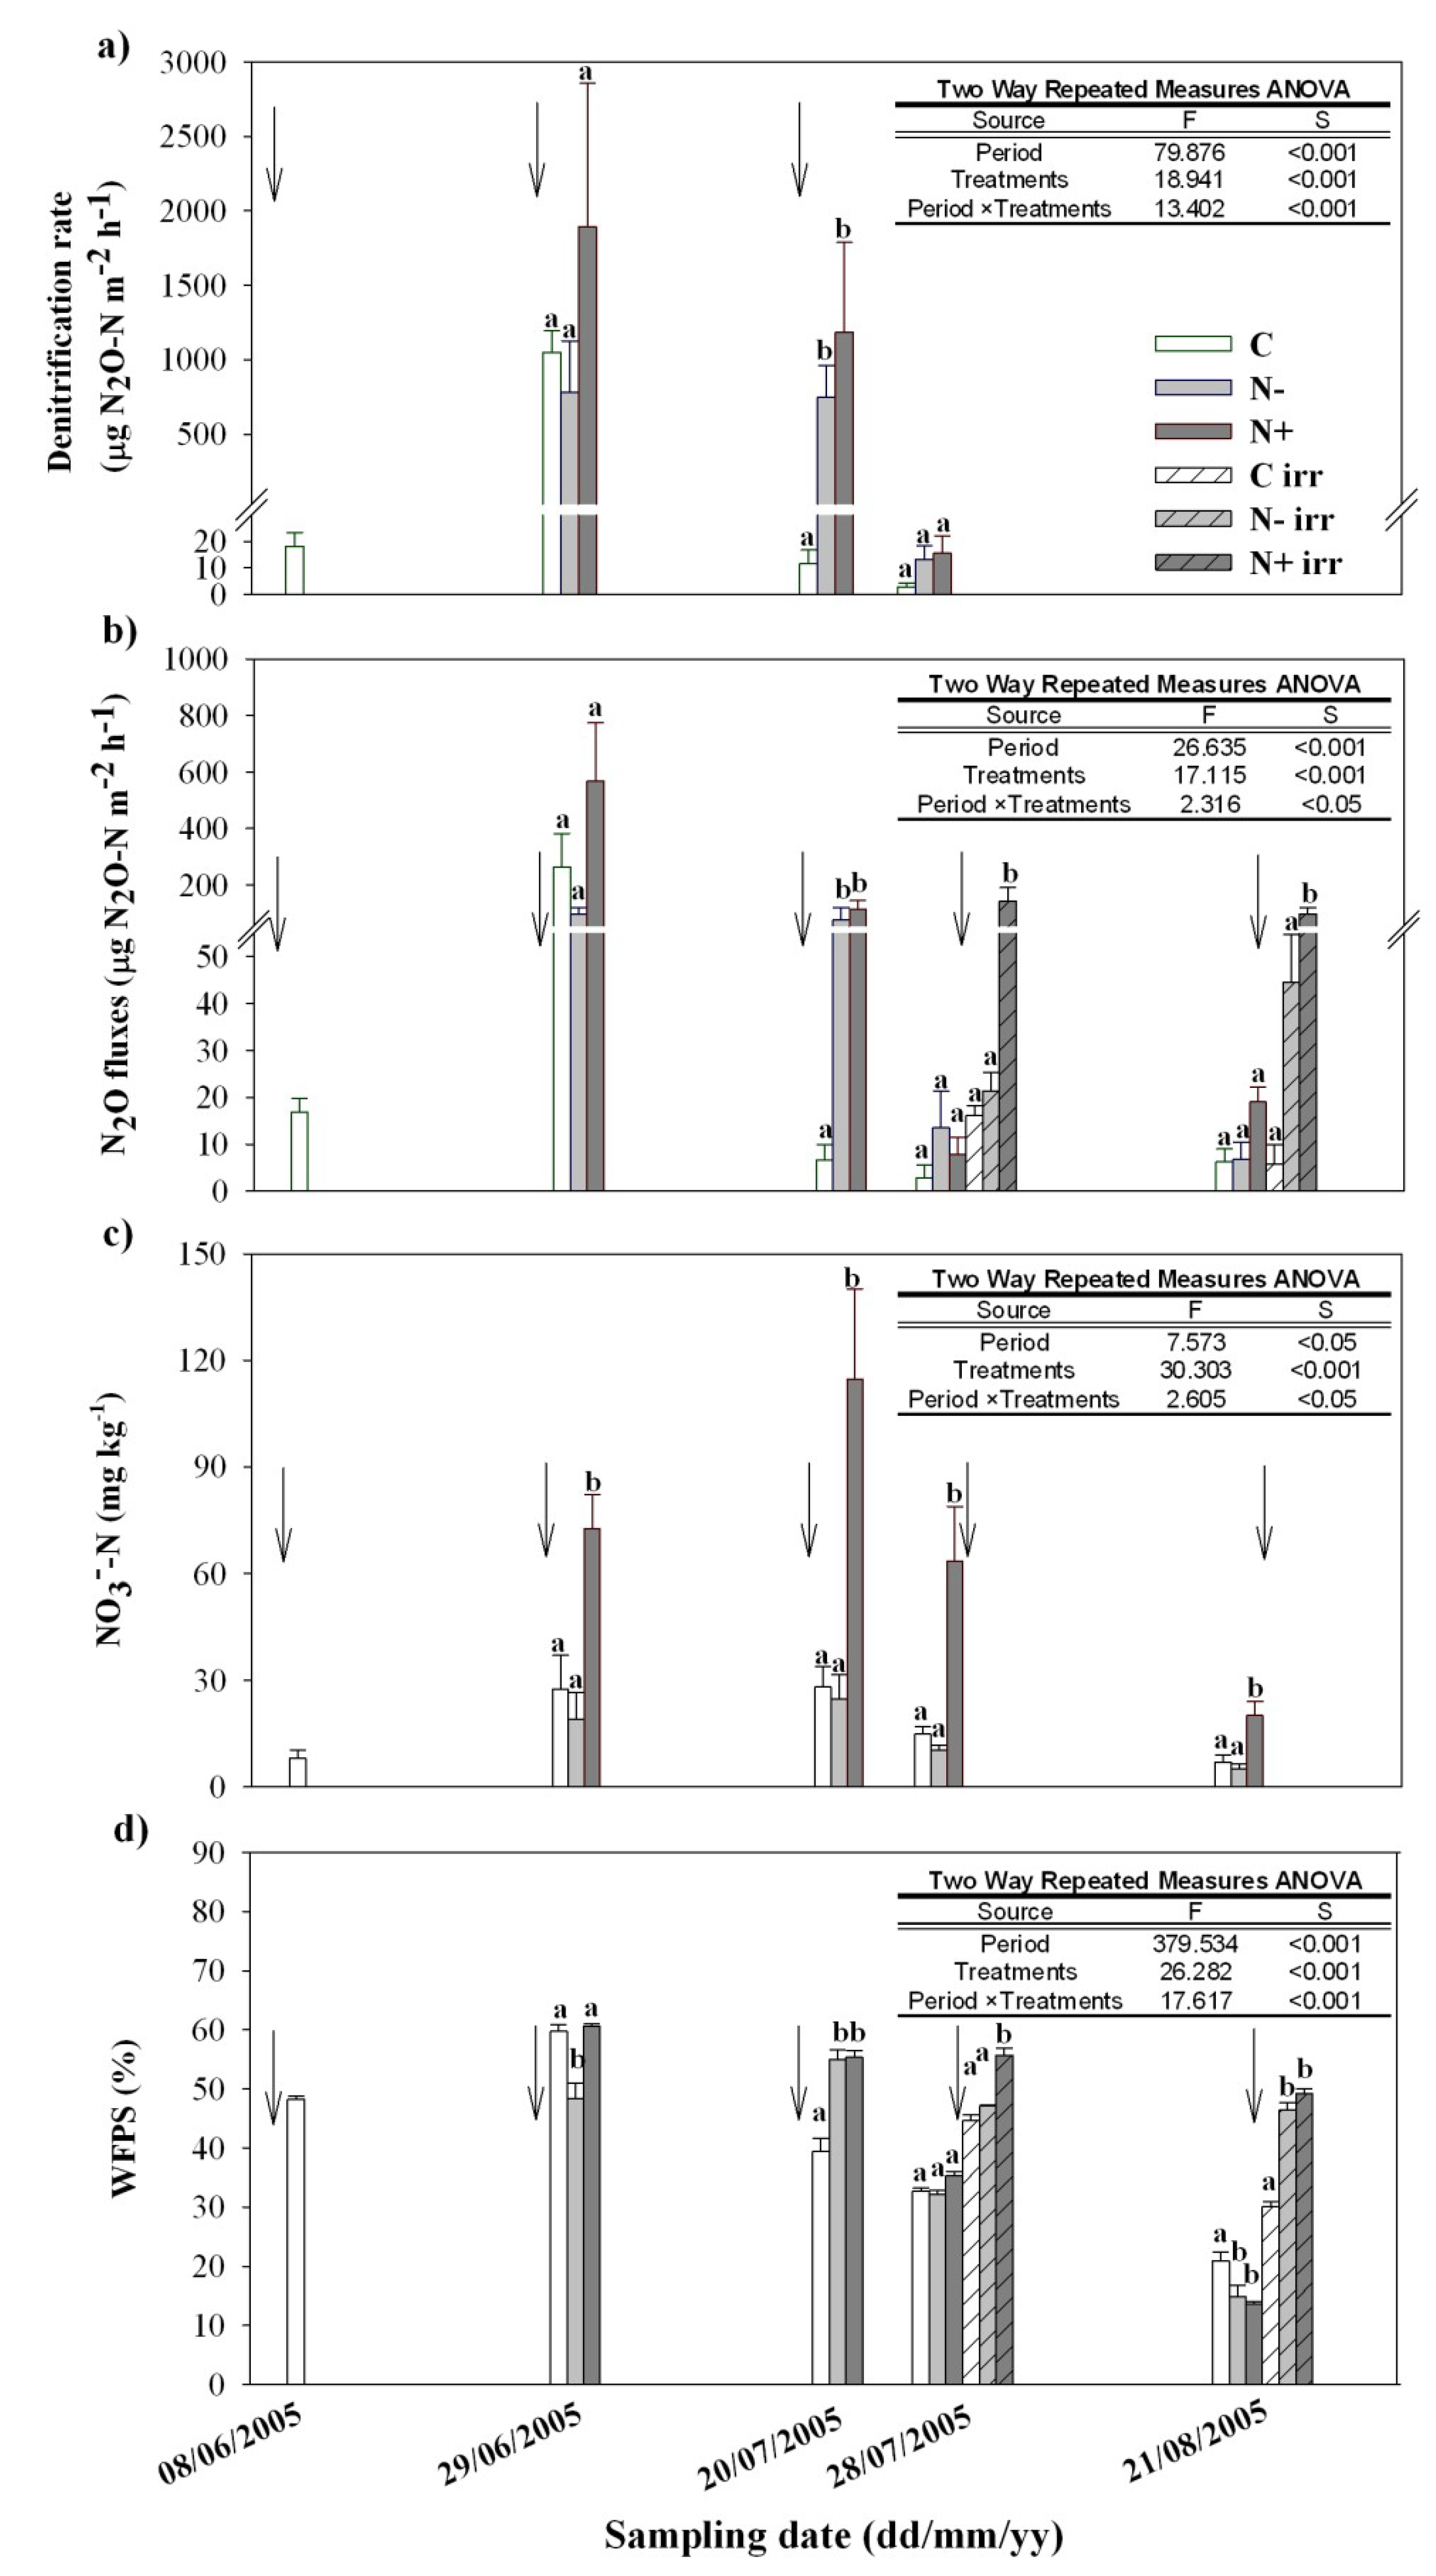
2.3.2. Monitoring Activities during the Manipulation Experiment (ME)

In the course of the Zea mays L. growth in 2005, in a marginal area of the agricultural field, 6 restricted experimental plots (3 m × 5 m) were subject to a different urea supply at the late fertilization time (post-emergence), in the framework of integrated research activities aimed to investigate the plant nitrogen metabolism and the efficiency use under different N fertilizer’s schemes. Specifically, 3 plots received a lower urea-N fertilization (N−: 138 kg N ha−1 by 300 kg ha−1 ENTEC® 46) and 3 plots received a higher urea-N fertilization (N+: 322 kg N ha−1 by 700 kg ha−1 ENTEC® 46) than the rest of the field under standard fertilization management (C: 230 kg N ha−1 by 500 kg ha−1 ENTEC® 46) (footnote a, in Table 1).
The measurements of denitrification and soil N2O fluxes were carried out at different stages of maize growth: 35 days (29 June 2005, at the beginning of stem extension, soon after the late fertilization), 50 days (20 July 2005, at the beginning of flowering) and 68 days (28 July 2005, at the beginning of ripening). Moreover, only for N2O emission, a further sampling was carried out at the very end of the growing period (93 days, mealy ripe), soon before the mowing. On each sampling date, in the same plot for each treatment, intact soil cores were sampled close to the coverbox collars (4 replicates) to assess denitrification rate, pH, soil moisture, nitrate concentration and organic matter content (4 replicates for both denitrification and soil physical-chemical characterisation).
In the same experimental plots, in the course of the maize growth, measurements of plant maximal PS2 photochemical efficiency and both soluble protein and total leaf free-amino acid content [40] were carried out as well. The maximal PS2 photochemical efficiency is widely used as an indicator of plant health under a wide range of environmental conditions. It is the ratio Fv/Fm of the variable chlorophyll fluorescence (Fv) and the maximal fluorescence level (Fm), giving the potential quantum efficiency of the leaf [41]. The soluble proteins are markers of the leaf N status, while the total leaf free-amino acid content reflects the whole-plant N status [42].

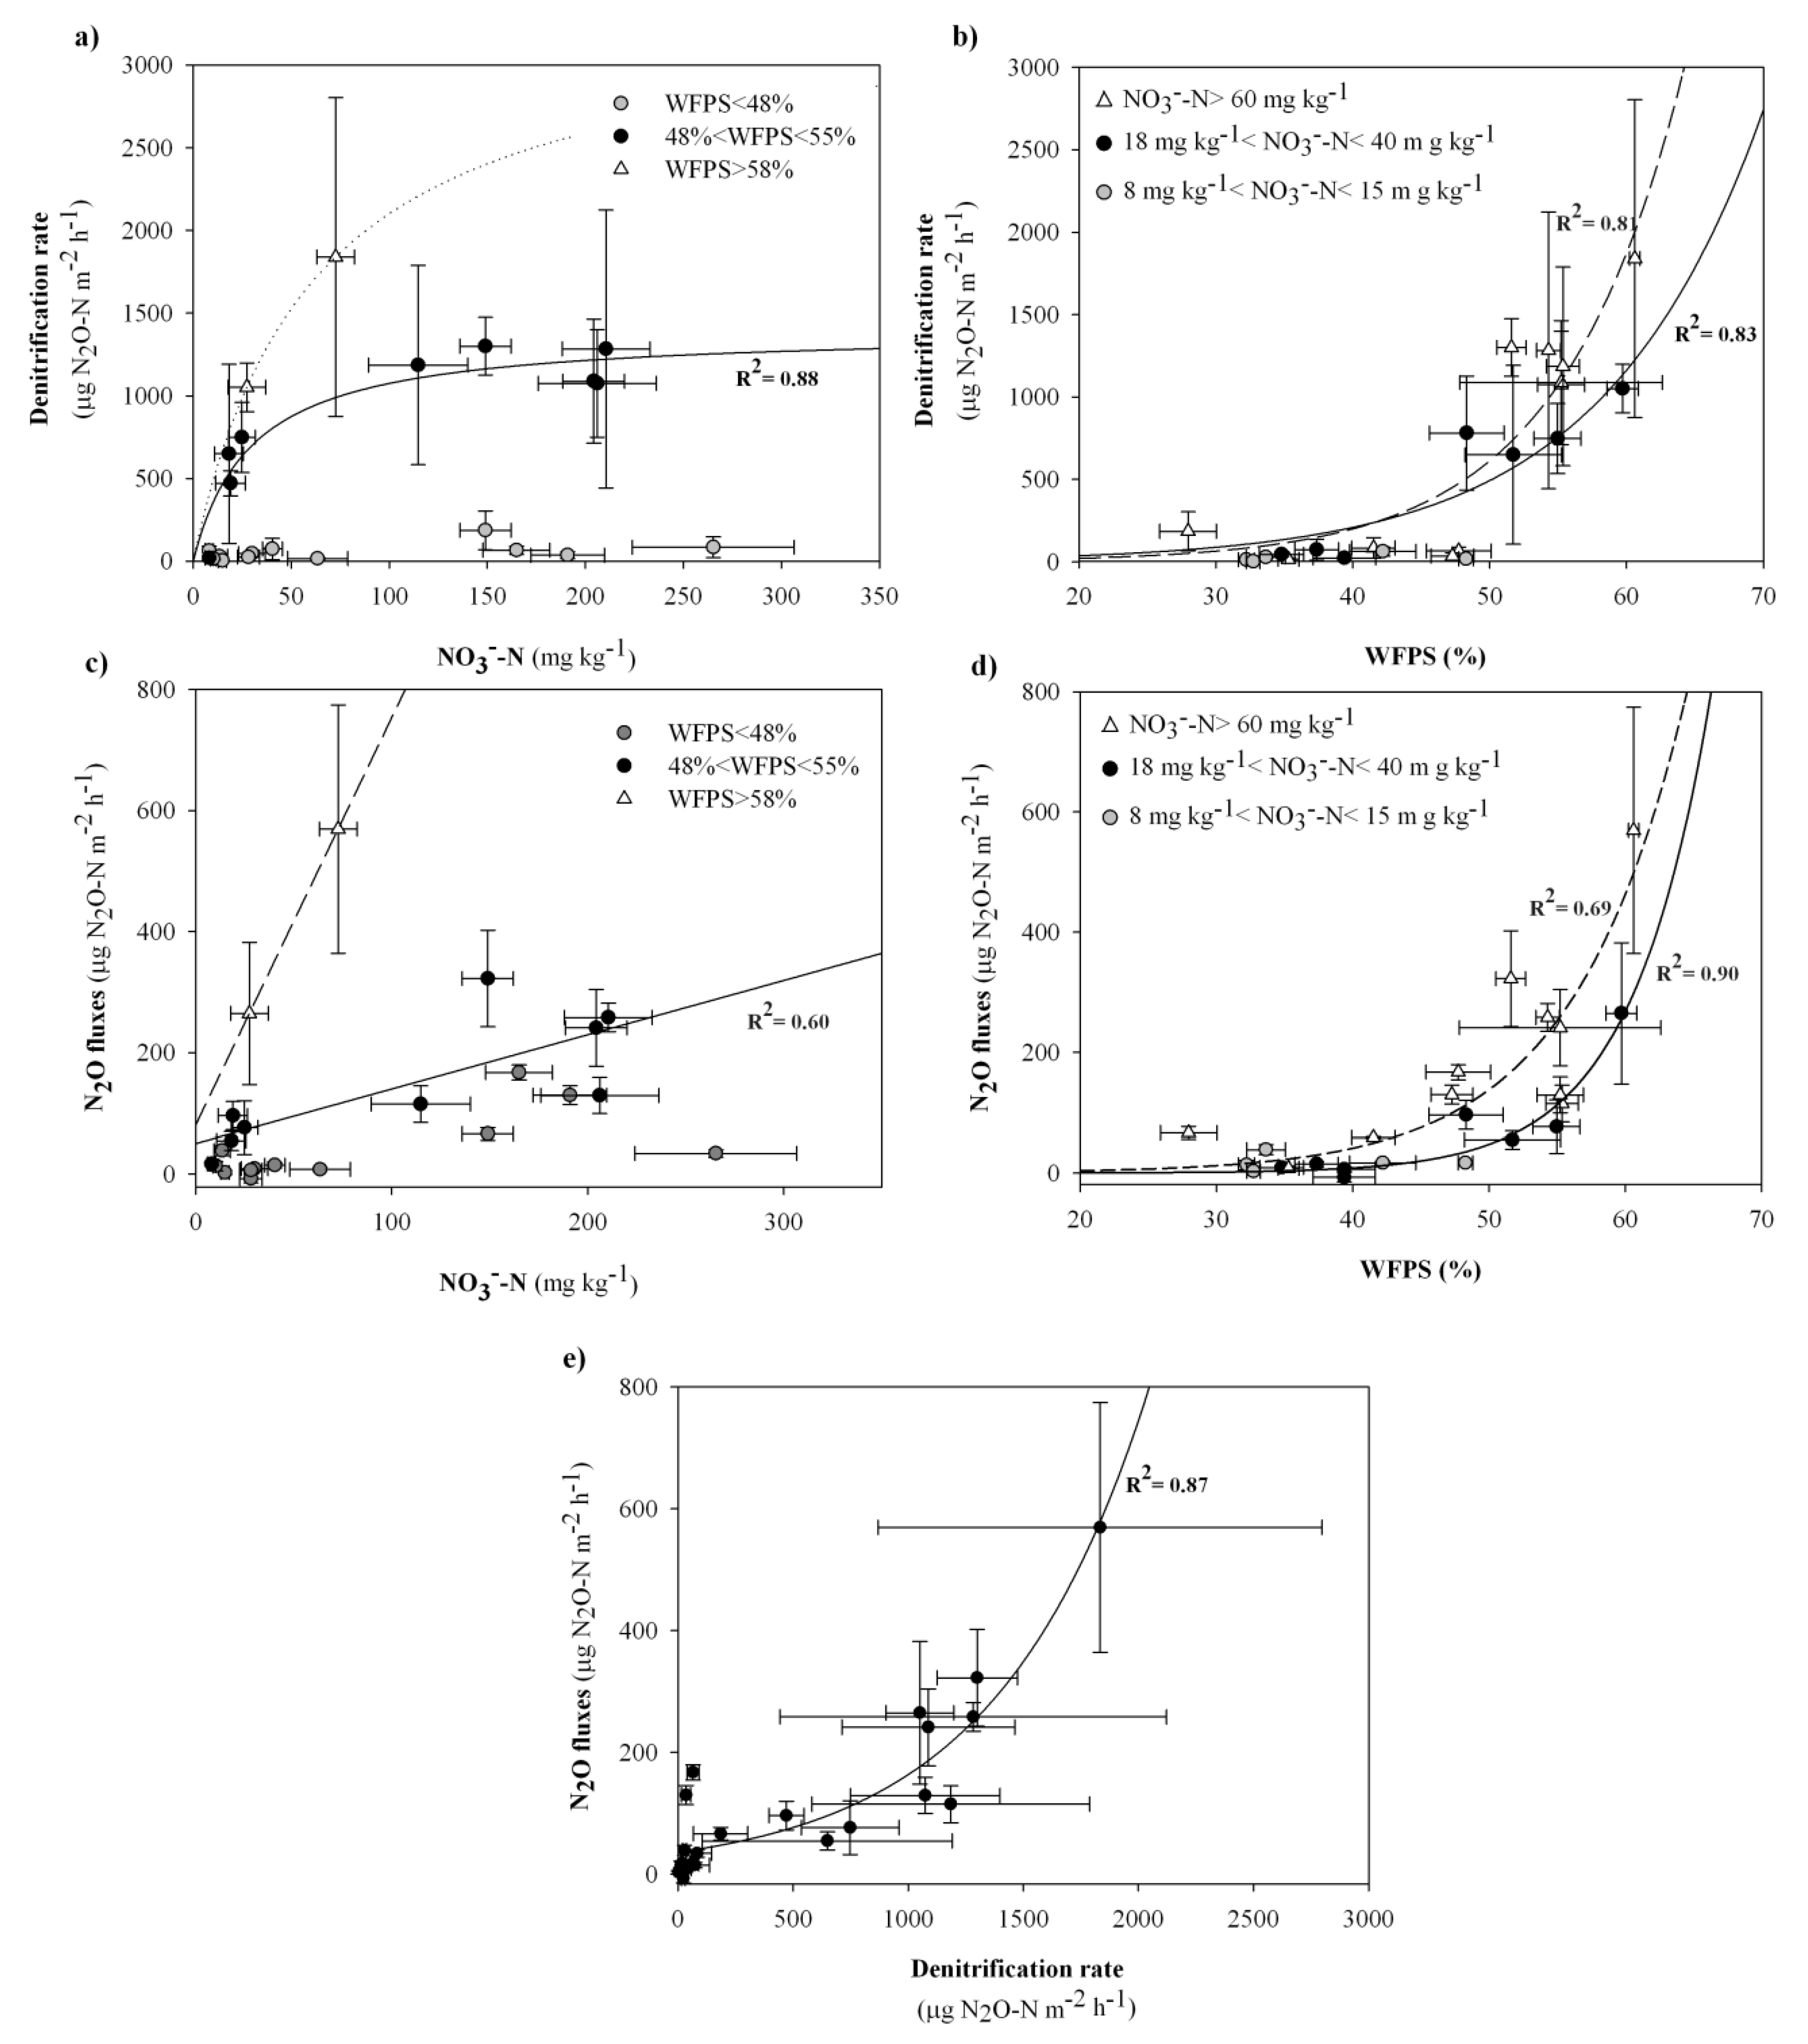
2.3.3. Correlation and Regression Analyses CRA

The correlation and regression analyses were performed using all the data collected during the monitoring activities in the SFM and ME, processing the mean values of each parameter on each sampling date. Since the soil NO3 concentration and WFPS can be limiting to a different extent and at different times in the field, the whole set of data was divided into more restricted homogeneous groups with similar soil physical-chemical characteristics, in order to better isolate the response functions of denitrification and N2O fluxes on each soil parameter. Soil nitrate concentration, WFPS and temperature were the driving variables taken into account, since no significant variations in time were observed for soil pH and organic matter content. Also, the relationship between N2O fluxes and soil NH4+ concentration was omitted in this section, since few data were available only for the maize growth in 2006. The CRA was performed according to the steps outlined below (details for statistical analyses provided in Section 2.7).
  • A correlation analysis was firstly performed to investigate the relationship between the denitrification rate, the N2O fluxes and the soil driving parameters, also to determine specific threshold values of soil variables for denitrifying activity and N2O evolution from soil;
  • A regression analysis was secondly carried out to empirically derive: (i) specific response functions of both the denitrification rate and the N2O fluxes to soil nitrate (f(NO3)), WFPS (g(WFPS)) and temperature (h(Tsoil)); (ii) a specific regression function between the soil N2O emissions and the denitrification rate (h(Denitrification rate));
  • Afterwards, simple predictive equation were designed on the basis of the empirically derived regression functions:
    (1) a simple multiplicative model to simulate the denitrifying activity as a function of the three driving soil parameters:
    Denitrification ratepredicted = k f(NO3)* g(WFPS)* h(T soil)
    where
    k = correction factor derived as the direction coefficient of the linear regression r’ = k*Denitrification ratemeasured, with r’ = f(NO3)* g(WFPS)* h(Tsoil)
    (2) a simple multiplicative model to simulate the soil N2O fluxes as a function of the three driving soil parameters:
    N2O fluxes predicted = k f(NO3)* g(WFPS)* h(Tsoil)
    where
    k = correction factor derived as the direction coefficient of the linear regression f’ = k N2O fluxes measured, with f’ = f(NO3)* g(WFPS)* h(Tsoil)
    (3) a simple predictive equation of the soil N2O fluxes as a function of the measured denitrification rates:
    N2O fluxespredicted = h(Denitrification ratemeasured)
    (4) a simple predictive equation of the soil N2O fluxes as a function of the simulated denitrification rates (i.e., in response to the predicted values of denitrification rate from soil parameters through equation (1)):
    N2O fluxes predicted = h(Denitrification ratepredicted)
  • Finally, the predicted values were plotted against the averaged experimental estimates from each sampling campaign to test deterministically the simple multiplicative models for simulating the denitrification and the flux pattern. At this stage the measured soil nitrate concentration, WFPS and temperature (as averaged values from each sampling date) were used as input parameters for predicting the average values of the denitrification rate and the N2O soil fluxes recorded on each campaign date. The agreement between simulated and measured variables was tested through the coefficient of determination between observations and simulations (R2), whilst the concordant correlation coefficient (CCC) was used to evaluate the different performances of the empirically derived simple prediction functions of soil N2O fluxes from soil ancillary parameters (2) and denitrification rate (3)(4).

2.4. Sampling and Processing Intact Soil Cores for Denitrification Rate

The denitrification rate was determined through the Acetylene Inhibition Technique (AIT) on intact soil cores, without modifying soil physical-chemical characteristics and avoiding disturbance of oxygen gradient [43,44,45,46]. It represents a simple and cheap method to assess the denitrification activity on a great number of field replicates without altering the soil structure and the nutrient concentration, with the aim to monitor the pattern of denitrification rates occurring in the field in response to agronomic practices. However, the authors are aware the AIT is becoming increasingly criticized due to the risk of underestimation of the denitrification rates, affecting the reliable assessment of total field N losses by denitrification, due to the potential inhibition effect of C2H2 on NO3 production via nitrification, the possible slow diffusion of C2H2 into fine textured soils and rapid decomposition of C2H2 [44,47,48,49]. Nonetheless, beyond this limitation of the method, the AIT has been effectively and widely used and recommended (also in recent pertinent literature) to compare sites and experimental treatments (in both terrestrial and aquatic environments) and to evaluate controlling factors [44,46,50,51,52]. Specifically, this is the real focus of the present work, which represents a process study aimed to investigate the temporal pattern of denitrification and soil N2O fluxes and their dependence on soil parameters, rather than the overall N losses by denitrification. Therefore, the authors agree with Groffman et al. [44] and Hauert and Lamberti [50] that the AIT assay can be an effective tool to investigate the response of denitrification to key controlling factors in intact soil cores. This is also linked to the very recent evidence about the significant correlation between the denitrification rates measured by the AIT on intact soil cores and the denitrification rates measured under the 15N gas-flux method [48].
Following the experimental set-up detailed in the Section 2.3.1 and Section 2.3.2, the intact soil cores (∅ = 5 cm, h = 15 cm) were collected from the field on each sampling date by an Eijkelkamp split tube soil sampler (∅ = 5 cm, h = 40 cm) and afterwards gently removed to be further processed in PVC containers (∅ = 5.4 cm, h = 17 cm). This allowed C2H2 access to the interior of the soil core from all over the soil core surface [45,46]. At the lab, the PVC containers were sealed through air tight lids equipped with output valves connectible to gas-chromatograph stopcocks and male-luers. C2H2 was added to at least 10% of the volume of the headspace, by replacing about 30 mL of air with 30 mL of C2H2. Additionally, to promote acetylene diffusion inside the core [45,46], the air space inside each container was repeatedly mixed for 5 minutes by manual mixing through a 60 mL PP (polypropylene) syringe.
Afterwards, the containers were incubated at a constant field temperature (recorded in the field at 12:00 am on each sampling date) and gas samples were removed, 3 hours after and 6 hours after, for N2O analysis via gas-chromatography by a 63Ni electron capture detector (GC 8000, Fison Instruments). The column used was a Poropak Q 80–100 mesh (∅ = 2 mm, 2 m length), equipped with a pre-column to remove water vapour and carbon dioxide from the sample. The carrier gas (Argon-methane 10%) flux was 30 mL min−1 and the injector, oven and detector temperatures were 38 °C, 38 °C and 300 °C, respectively. The incubation always started within 24 hours. The rate of N2O production between the initial and the final sampling time inside the headspace volume was taken as the rate of denitrification:
Denitrification rate = ((Cf* H) − (Ci* H))/(A* t)
where Ci = N2O concentration (µg N2O-N mL−1) at the initial sampling time, Cf = N2O concentration (µg N2O-N mL−1) at the final sampling time, H = Headspace volume, A = Core surface area, Δt = time between initial and final sampling time. The total headspace volumes were determined by calculating the volume of the empty containers and subtracting the volume of the soil cores inside, taking into account for their pore space and water content. The accuracy of this calculation was checked by measuring the volume of water required to fill the containers (with soil cores inside) completely. The amount of N2O accumulated inside the PVC containers was then corrected for the gas dissolved in the liquid phase. To this end the Bunsen coefficients were used to predict the amount of N2O dissolved in the liquid phase from the concentration in the gas phase:
N2Otot = N2Og (Vg + Vl*β)
where N2Otot = total amount of N2O in water plus gas phase, N2Og = N2O concentration (µg N2O-N mL−1) in the gas phase, Vg = volume of the gas phase, Vl = volume of the liquid phase, β = Bunsen coefficient (1.06 at 5 °C; 0.882 at 10 °C; 0.743 at 15 °C; 0.632 at 20°C; 0.544 at 25 °C; 0.472 at 30 °C).

2.5. N2O Fluxes Measurement

The N2O fluxes from soil were measured in-situ by cylindrical PVC no automated static chambers (20 cm diameter, 15 cm height), inserted 5 cm dept into the soil and supplied with butyl rubber septa on their air tight lids. On each sampling date, at solar noon, gas samples were collected by a 60 mL PP syringe and stored in 6 mL airtight evacuated glass vials sealed by silicon. During the maize crop in 2005, the gas samples were collected soon after closing the chambers, 15 minutes after and 30 minutes after. Afterwards, they were analysed via gas-chromatography, according to what detailed for denitrification rate, except for the injector and oven temperatures (50 °C and 60 °C, respectively). N2O fluxes from soil, expressed as µg N2O-N m−2 h−1, were calculated by the following equation:
FN2O = a/S
where, a = direction coefficient of the regression line of N2O concentration with time, s = surface area of the soil inside the chamber.
During the maize crop in 2006, the headspace was sampled only twice: soon after closing the chamber and 30 minutes after. In that case, the preceding equation was replaced as follow:
FN2O = (Cf − Ci)/(S* Δt)
where Ci = N2O concentration (µg N2O-N mL−1) at the initial sampling time, Cf = N2O concentration (µg N2O-N mL−1) at the final sampling time, Δt = time between initial and final sampling time, S = surface area of the soil inside the chamber

2.6. Soil Analysis

On each sampling date, following the experimental set-up detailed in the Section 2.3.1 and Section 2.3.2, ancillary analyses for the soil physical-chemical characterisation were performed on fresh sieved (2 mm mesh) soil samples, stored at 4 °C and always processed within 24 hours. The gravimetric soil water content θg was calculated as: θg = [(fresh weight soil − dry weight soil)/dry weight soil]* 100. Soil WFPS was calculated by dividing the volumetric soil water content θv by the total soil porosity [22,53,54]. θv was derived by θg and the soil bulk density (ρb) according to the following equation: θv = θg* (ρb/ ρw), where ρw is the water density. The total soil porosity was derived by ρb, according to the following relationship: soil porosity = [1 − (ρb/2.65)], assuming a particle density of 2.65 g cm−3 [22,53,54]. Soil pH was measured through a glass electrode (Methron 665 Dosimat, Hanna Instruments) on soil samples extracted with deionized water. Soil nitrate concentration in the soil samples collected in 2005 was determined by colorimetric reaction and spectrophotometry on soil extracts with deionized water (LASA 50 DrLange portable spectrophotometer). In 2006, the soil mineral N content, under the form of NO3 -N and NH4+ -N, was determined by ion-selective electrodes on soil extracts with a 0.5 M K2SO4 solution according to Castaldi and Aragosa [55]. Soil organic matter content (SOM) was evaluated according to Allen [56] and calculated as: SOM = [(dry weight soil − dry weight ash)/dry weight soil]* 100. On each sampling date, soil temperature was measured (4–8 replicates) down to a depth of 10 cm by means of a thermo-pHmeter (Hanna Instruments).

2.7. Statistical Analysis

The statistical analyses were performed using the Sigma Plot package (Systat Software, Inc., Germany, version 11.0). All the mean values were calculated as arithmetic mean and the bars in the graphs represent the standard error of the mean. The simple correlation analyses between soil variables were carried out through the Pearson product-moment Test (P < 0.05). The effect of different urea supply rates on denitrification, N2O fluxes and soil chemical-physical characteristics, over time, was tested by an analysis of variance (ANOVA-two way repeated measures), followed by the All Pairwise Multiple Comparison Procedures (Holm-Sidak method) to test, for each analysed soil variable, significant differences among treatments on each sampling date. To visualize and plot the curves best describing the shape and behaviour of the association between the analyzed soil variables (denitrification rate, direct N2O fluxes and soil driving ancillary parameters), the curve fitting procedure through linear and nonlinear regressions (implemented in the SigmaPlot package) was used to find the equations that most closely fitted the actual data (based on the coefficient of determination R2), using the values of each one selected independent (predictor) variables to predict the value of the desired dependent (response) variable. The concordance correlation coefficient (CCC) was estimated according to Lin [57]. The normal distribution of data was always checked (Kolmogorov-Smirnov Test, P < 0.05) before running parametric tests and if necessary, data were log-transformed. All the data used for the regression analyses, both linear and not, passed the Durbin-Watson Statistic Test, Normality Test and Constant Variance Test.

3. Results

3.1. Monitoring Activities under the Standard Fertilization Management (SFM)

The denitrification rate showed a great variability, with coefficient of variation (CV) ranging from 10% up to 185.8% (mean value of about 90%).
During the Zea mays crop in 2005 (Figure 1e), soil nitrates stepped-up at the sowing and the late fertilizations. At these stages, peaks of denitrifying activity (Figure 1b) were recorded at soil rewetting through the first irrigation events (Figure 1a,d) following the N supply, up to values of about 650 µg N2O-N m−2 h−1 and 1050 µg N2O-N m−2 h−1 at the pre-plant and the post-emergence mineral fertilization, respectively. A significant correlation was found between denitrification rate and WFPS (Table 2), whilst the relation of the denitrifying activity with soil nitrate could not be assessed because of the slight number of data at not limiting WFPS values.
Similarly, in the course of the Zea mays crop in 2006, the nitrate availability in soil increased soon after the late fertilization (Figure 2e). At this stage, the NO3concentration resulted consistently higher than the values recorded at similar crop growing stages in 2005, as a consequence of the different crops preceding Zea mays and the different kind and rate of fertilizes N supply in 2005 and 2006 (Table 1). The maize crop in 2005 was grown after a Lolium italicum grass crop; differently the Zea mays in 2006 was preceded by a mixed cultivation of Lolium italicum and Trifolium alexandrinum (legume) (Table 1), which might have led to a higher level of residual N in the soil. Moreover, before the sowing, the maize crop in 2006 received an amount of buffalo slurry sewage 4–5 times higher than that one applied in the field in 2005 and, at the late fertilization, 50% of the total urea fertilizer spread on the field did not contain the 3.4 DMPP nitrification inhibitor (Table 1). At high soil nitrate availability, WFPS was the only parameter significantly correlated to the denitrification rate (Table 2), with a threshold value of about 48%. Moreover, at not limiting WFPS, despite the much higher soil NO3 concentrations, the denitrification rate peaked up to values comparable (about 1300 µg N2O-N m−2 h−1 as the maximum rate recorded) to those ones detected in the course of the maize crop in 2005.
The N2O fluxes from soil showed a very high spatial variability as well (85.3% as mean value of CV). On the whole, they were in the ranges of basal (10–100 µg N2O-N m−2 h−1) and low-medium (100–200 µg N2O-N m−2 h−1) values, with peaks (>200 µg N2O-N m−2 h−1) being detected after irrigation events during the maize cropping cycles, on sampling dates when the denitrification rates were intense (Figure 1 and Figure 2).
A significant correlation was found between N2O emissions and denitrification rate (Table 2); however higher average fluxes were detected after soil irrigation at the late fertilization in 2006 (Figure 2) compared with similar crop growing stages in 2005 (Figure 1). The amount of N2O produced increased at raising values of soil WFPS (Table 2) with: (i) 40% as the minimum WFPS value for the low N2O fluxes, (ii) 48% as the minimum WFPS for the medium-high N2O fluxes (in the range of 200–500 µg N2O-N m−2 h−1). The N2O fluxes resulted also positively correlated to the soil NH4+ concentration at values of WFPS below 48% (Table 2), although always remaining in the basal range.
Even if, on the whole, significant correlations were found between variables in the course of the monitoring activities in 2006, both the denitrification rates and the N2O emissions exhibited a wide range of values at given soil nitrates and WFPS, suggesting it’s not always possible to go beyond the analytical variability of an intact soil core (data not shown).

3.2. Monitoring Activities during the Manipulation Experiment (ME)

After the late fertilization in 2005, a marked increase of denitrifying activity, N2O fluxes and soil nitrate concentration was recorded in all the experimental plots C, N- and N+ (Figure 3). The different urea supply rates affected soil processes and parameters, interacting with the changing environmental conditions in the course of the sampling dates (inset tables in Figure 3).
Soil NO3 concentration showed the highest values in N+ throughout the observation period (Figure 3). After 1 month from the post-emergence fertilization, soil nitrates remained fairly stable in all treatments; afterwards a generalized decrease was observed. Nonetheless, the soil NO3 concentration in N+ showed values of about 41.3 mg NO3-N kg−1 even at the very end of the maize growing season, just few days before the mowing. Otherwise, no significant differences were recorded between C and N- plots, even if slightly higher values of NO3 were found on all the sampling dates in the control soil (C) under the standard fertilization management.
As far as the denitrification and the N2O evolution were concerned, the fertilization scheme interacted with the timing of the sampling campaigns, showing a temporal pattern in a close relation to the irrigation scheduling (Figure 3). Peaks of denitrifying activity and N2O emissions from soil were detected in all the experimental plots following the irrigation events during the stem extension and flowering campaigns (Figure 3). At this stages, both the denitrification rate and the N2O fluxes showed the highest average values in N+ (mean values of 1893 μg N2O-N m−2 h−1 and 570 μg N2O-N m−2 h−1, respectively). Differently, C and N- plots showed commensurable denitrifying activity and N2O emissions, with slightly differences driven by the dishomogeneous values of soil WFPS in the field. On the third sampling date after the late fertilization, at maize ripening, low denitrifying activities and N2O fluxes were detected in all treatments, when low values of soil WFPS were recorded as well. Finally, at the end of the maize growing season, medium N2O fluxes (100–200 µg N2O-N m−2 h−1) were measured after irrigation only from the soil of the N+ plots, where nitrate availability was still high.
Both the denitrification rate and the N2O emissions showed to increase at raising soil WFPS and NO3 concentration (at values of WFPS above 48%). They also revealed to be positively related between each other (Table 2).

3.3. Correlation and Regression Analysis (CRA) on the Whole Dataset

Through the CRA on the whole data set (collected during the SFM and the ME), the response functions of denitrification rate to soil nitrate concentration, WFPS and Tsoil could be satisfactorily modelled according to simple Michaelis-Menten kinetic, exponential and linear functions, respectively (Figure 4a,b; Table 2).
Specifically, the CRA confirmed for the denitrification rate the WFPS threshold value of 48% (Figure 4a), corresponding to volumetric moisture contents (θd) below 0.260 cm3 cm−3. Otherwise, at not limiting values of WFPS, the denitrification rates increased with rising values of nitrate availability (Table 2) according to a Michaelis-Menten kinetic (Figure 4a), with 38.5 mg NO3-N kg−1 as Km (half-saturation constant) giving a denitrification rate equal to 50% of the maximum value (about 1400 µg N2O-N m−2 h−1), for WFPS values in the range 48–55%. Nevertheless, the plateau appeared to increase in the highest range of soil WFPS (58–61%) (Figure 4a). In a similar way, the N2O fluxes did not correlated with soil nitrate concentration for WFPS below 48%, whilst above this value they increased linearly with rising values of nitrate availability (Table 2 and Figure 4c).
Both the denitrification rate and the N2O fluxes were strongly correlated to the soil WFPS (Table 2). Specifically, at soil nitrate concentration below 15 mg NO3-N kg−1, denitrification and N2O emissions remained basal despite of the increasing values of the soil moisture. Otherwise, at not limiting soil nitrates, the denitrifying activity and the N2O fluxes exponentially raised at increasing values of soil WFPS, with a higher steepness of the curve at increasing ranges of soil nitrate concentration (Figure 4b,d).
The effect of Tsoil was evidenced only for a narrow range of samples at not limiting values of both WFPS and nitrate (Table 2).
According to these findings, the simple combined multiplicative models to predict denitrification rate (1) and N2O fluxes (2) from soil parameters (Section 2.3.3) were set as follow:
• for Denitrification ratepredicted (1)
f(NO3) = Michaelis-Menten function describing the dependence of denitrification rate on soil NO3-N concentration at 48% < WFPS < 55% (Figure 4a)
g(WFPS) = exponential function describing the dependence of denitrification rate on soil WFPS at NO3-N > 60 mg kg−1, i.e., at nitrate concentration close to the plateau and so slightly influencing denitrification rates (Figure 4b)
h(Tsoil) = linear function describing the dependence of denitrification rate on soil temperature at not limiting soil NO3-N concentration and WFPS (Table 2).
• for N2O fluxes predicted(2)
f(NO3) = linear function describing the dependence of N2O fluxes on soil nitrate concentration at 48% < WFPS< 55% (Figure 4c)
g(WFPS) = exponential function describing the dependence of N2O fluxes on soil WFPS at NO3-N > 60 mg kg−1, close to the plateau for denitrification rate (Figure 4d)
h(Tsoil) = linear function describing the dependence of N2O fluxes on soil temperature at not limiting soil NO3-N concentration and WFPS (Table 2).
A positive significant correlation was found between the N2O evolved from the soil and the denitrifying activity (Table 2), with an exponential increase at a raising denitrification rate (Figure 4e). Therefore, the additional predictive functions to estimate N2O fluxes by measured (3) and predicted (4) denitrification rates (Section 2.3.3) could be set as follow:
h(Denitrification ratemeasured) = exponential function describing the dependence of N2O fluxes on the measured values of denitrification rate (Figure 4e) (3)
h(Denitrification ratepredicted) = exponential function describing N2O fluxes from the predicted values of denitrification rate through Equation (1) (4)
In Figure 5, the predicted values through equations (1), (2), (3), (4) were plotted against the denitrifying activity and N2O emissions experimentally measured (Figure 5a–d). The denitrification process (Figure 5a) appeared satisfactorily predictable by the simple multiplicative function considering its dependence on the investigated soil parameters. Simulated and observed mean N2O fluxes were significantly correlated for all predictive equations (2), (3) and (4) (Figure 5b–d). Additionally, the best fit between measured and observed data was obtained through the functions considering the relation of the N2O fluxes with the denitrification rate, both directly measured (3) (Figure 5c) or in its turn derived from soil parameters (4) (Figure 5d), against the equation (2), which was based on the relation of N2O fluxes with soil NO3, WFPS and Tsoil (Figure 5b), with CCC values of 0.85, 0.92 and 0.91 for (2), (3) and (4), respectively (Figure 5b–d).

4. Discussion

4.1. Monitoring Activities during the Standard Fertilization Management (SFM)

Both the denitrification rate and the N2O emissions from soil showed a high spatial heterogeneity, in agreement with the large spatial variability reported for denitrifying activity and trace gas fluxes at all scales and especially at the finer within-field scale, where N2O fluxes and denitrifying activity are characterised by the frequent occurrence of extreme values (hotspots) accounting for a significant part of the total cumulative recorded [5,7,17,18].
Their patterns evidenced pulses after the irrigations following the fertilizers input, every time soil nitrates and WFPS promoted the process, as highlighted by the other available studies inherent Mediterranean irrigated spring-summer crops [21,22,23,26,53,54,58,59,60,61,62]. A stimulating priming positive effect of urea N addition on the decomposition of native soil organic carbon (SOC) might also have contributed to the observed peaks of denitrifying activity and soil N2O fluxes [63,64,65], according to the hypothesis that a sufficient N supply can supplement microbial demand for available N, thereby stimulating microbial growth and activity and accelerating the SOC decomposition [65].
The maximum values of denitrification rate throughout the observation period (from 1100 to 1900 µg N2O-N m−2 h−1) appeared close to the lower bound of the range of denitrifying peaks recorded by Vallejo et al. [21] and Meijide et al. [23] by the AIT on intact soil cores in Mediterranean irrigated maize-cropped sandy loam soils in central Spain. Specifically, the Spanish Authors [21,23] detected peaks ranging from about 2000 up to 10,500 µg N2O-N m−2 h−1, for several N fertilizer managements including mineral fertilization and organic amendments. However, beyond mean annual rainfall, daily mean temperature and soil NO3 concentration comparable with the current study, the irrigation water input was nearly doubled at the Spanish site (from 40 mm to 60 mm weekly), resulting in higher WFPS throughout the maize cropping seasons [21,23].
Conversely, the denitrification peaks resulted markedly higher than the maximum values reported by Arcara et al. [19] through the AIT for a rainfed maize crop in the Mediterranean basin in Northern Italy under both urea and pig slurry fertilization (on average about 287 µg N2O-N m−2 h−1 with a single peak up to 690 µg N2O-N m−2 h−1). This finding likely reflected the colder and wetter climate conditions of the Po Plain promoting high stable soil WFPS due to frequent rainfall events [19]. In fact, the denitrification has been shown to peak at higher values when soils are going through wetting/drying cycles as opposed to soil water content kept constantly high [66].
The range of the detected pulses of direct N2O fluxes from soil (from 250 to 560 µg N2O-N m−2 h−1) appeared in line with the values of the peaks recorded for similar Mediterranean maize crop systems under sprinkler irrigation, ranging from 200 to 600 µg N2O-N m−2 h−1 [21,23,26]. Differently, they resulted significantly higher than the N2O pulses (from 30 to 80 µg N2O-N m−2 h−1) monitored in Mediterranean drip irrigated maize cultivations [60,62], according to the key role of the irrigation management on N2O evolution from soil under drought spring-summer Mediterranean conditions [8,10].

4.2. Monitoring Activities during the Manipulation Experiment (ME)

The high denitrifying activities and the N2O fluxes detected in the different experimental plots 10 days and 30 days after the urea-N supply, at not limiting values of soil WFPS, suggested soil NO3 concentrations were probably enough high in all the treatments to cause no competition between microbial community and plant system for mineral-N source demand. This result would suggest that marked N-losses by denitrification might have occurred up to 1 month after the late fertilization (even in the least fertilized treatment N-), every time soil moisture promoted the process. In this regard, also the results coming from the assessment of nitrogen metabolism of plants indicated soil NO3 concentration was not limiting for soil-plant relationships. In fact, the Fv/Fm ratio, the soluble proteins and the total leaf free-amino acid content [40] did not show statistical differences among the treatments on all the sampling dates, pointing out that the different N management did not produce any influence on maize performance in the field, also resulting in similar maize yields (Table 1).
These findings supported the idea of an N-surplus in the field management at the experimental site, which represents a recognized issue in intensive agriculture where N supply often exceeds crop requirements [67,68]. In fact, if amount and time of fertilizer application match crop needs during the active growth phase, it is assumed that the N2O fluxes are relatively low, since plants are better competitors for soil N than N2O-producing bacteria are [69]. Moreover, the residual soil NO3-N concentration and the medium N2O fluxes measured in N+ plots right to the very end of the maize season (at not limiting WFPS) pointed out that a more marked mismatch between the N supply and the N crop requirements might result in higher N-losses from the system through microbial denitrification. The greater N surplus might also enhance the risk of nitrate leaching through the first fall rains, which represents a major concern in the post-harvest phase of the spring-summer cash crops in the Mediterranean agricultural systems [68,70,71].
Inhibitors are widely recognised to be a good strategy to mitigate direct N2O emissions from soil [72] and the effectiveness of nitrification/urease inhibitors to reduce N2O fluxes has been also verified under Mediterranean conditions [10]. On this matter, the DMPP nitrification inhibitor, was commonly adopted by the farmer in the conventional fertilization management scheme (Table 1). However according to the outcome of this study, a further optimization of the N fertilization reducing the conventional urea-N supply rates appears desirable, in order to achieve high crop productivity without exacerbating N2O emissions or the risk of nitrate leaching. Reducing N fertilizer rate not only would constrain the related downstream pollutant emissions but also would improve the energy use profile of the farm. In fact, according to the outcome of an emergetic analysis of the zootechnical farm, the system greatly relied on non-stop external inputs of not renewable resources, among them fertilizers N were the main driving factors [73].

4.3. Correlation and Regression Analysis (CRA) On the Whole Dataset

According to Vallejo et al. [21], the denitrification process measured by the AIT on intact soil cores could be effectively simulated on the basis of the investigated soil parameters.
Specifically, the study confirmed the Michaelis-Menten kinetic for the denitrification dependence on soil NO3, which is the type of relation usually reported to predict denitrification rate in most of N-cycling models [6,7,36,38]. The derived value of the half-saturation constant Km at intermediate soil WFPS (38.5 mg NO3-N kg−1) fell in the wide spectrum of values highlighted for Km in pertinent literature, which ranged from 4 mg kg−1 [74] and 25 mg kg−1 [75], up to 117–138 mg kg−1 [76], depending on soil texture, climatic factors and soil management practices. Additionally, Km and the maximum value of denitrification rate resulted sensitive to the level of WFPS [7,31] and the threshold WFPS value above which the Michaelis-Menten kinetic could be detected (48%) appeared peculiar for the specific analysed soil-climate conditions.
The soil volumetric water content and the WFPS are key predictor parameters to estimate the reduction of denitrifying activities at increasing O2 supply rates, since the oxygen gradient along the soil profile is strongly affected by the soil water content, with air porosity decreasing at increasing values of WFPS [36]. In this regard, the exponential response function of denitrification rate to WFPS highlighted in this study agrees with the non-linear dynamics (exponential, power and sigmoidal equations) usually employed in simulation models, due to coefficients of oxygen diffusion inside the soil which are non-linearly related to soil air filled pore space [27,36]. However, the WFPS threshold value in this study (i.e., the value of WFPS below which it is assumed the O2 content inside the soil core is enough high to inhibit denitrifying enzymes) resulted quite lower than the values usually identified and reported in pertinent literature ranging from 60%to 68.9% [6,19,21,22,31,37]. For instance, as far as it concerns irrigated croplands under Mediterranean conditions, Vallejo et al. [21] found a threshold volumetric moisture content (θd) of 0.285 cm3 cm−3 corresponding to a soil WFPS values of 65%, in the top-layer of a sandy-loam soil, with a bulk density value of 1.47 g cm−3 and a total organic matter content of 1.4%. Nonetheless, soil denitrifying micro-organisms are able to produce N2O over a wide range of oxygen pressure, in anaerobic micro-zones when the soil is not at field capacity or saturation [12,77]. Furthermore, the limiting value of WFPS for bacterial denitrification can show marked variations depending on the soil texture, with a decrease of the required critical WFPS (and the subsequent degree of saturation) in finer textured soil than in coarser textured soil [12,77]. Additionally, not always the empirical WFPS term is able to normalize the water regimes of intact soil cores for different soil types, especially in the presence of shrinkage cracks [16,78,79]. Indeed, at the experimental site the dynamics of continuous macropores in the clay soil can be strongly affected by cracks formations during the spring and summer periods, as generally reported for clay soils of Mediterranean regions [80]. One main characteristic of clay soils is, in fact, their capacity to change their volume, through swelling and shrinking processes which induce the formation of cracks in the horizontal plane and turn the soil into a two-domain structure: cracks (macropores) and soil matrix (containing micropores), characterised by different conditions of water transport and retention affecting the dynamics of soil hydrological processes [79]. The shrinking of the soil at decreasing water content produces a very heterogeneous network of macropores [79,80]. This might allow, during rainfall or irrigation, a quicker and wider water infiltration towards the anaerobic denitrifying microsites (with high intra-aggregated WFPS), which could therefore become very active at relatively low total WFPS. The volumetric changes are driven by the clay minerals content, which affects the geometry of crack network and the shrinkage characteristics [79]. In this regard, further research activities on the soil water regime and related issues, also including the mineralogical analysis of soil clays, could improve the understanding of key soil hydrological processes such as, water flow to cracks, water flow within cracks and water flow from cracks to soil matrix [79], in their turn affecting microbial metabolism and related GHG emissions.
This study supported the evidence that also N2O can be effectively predicted from empirical relations with soil nitrate, WFPS and temperature [25,26].
As it relates to N2O response to soil nitrates, a linear increase was highlighted, despite the frequent examined Michaelis–Menten kinetic [16]. Nonetheless, these results might portrait the linear phase of a plateau curve and might be ascribed to the inhibitory and retarding effect of rising soil NO3 concentration on N2O reduction to N2 via bacterial denitrification, determining a marked increase of the N2O/N2 product ratio [81,82]. N2O fluxes showed an exponential increase at raising soil moisture, according to the sigmoidal relationship recognized for direct soil N2O emissions and WFPS in case studies and simulation models [16,28,83,84]. However, while in N2O emission models the continuous exponential curve usually starts at WFPS close to 60% [83], the threshold value for the N2O fluxes in this study was about 48%. This value coincided with the threshold WFPS for the denitrification rate and appeared in line with the scanty data for other Mediterranean fine textured soils under similar agronomic management evidencing N2O peaks at WFPS above 50% [26].
Relating to the response of bacterial soil processes and N2O fluxes to soil temperature, the pertinent literature has usually evidenced exponential, Arrhenius type and optimum functions [16,17,25,31,36,37]. However, in this study, the narrow range of soil temperature at not limiting values of soil nitrate and WFPS did not allow to investigate in detail the relations between the denitrifying activity and the N2O fluxes with day-to-day variations of soil temperature.
The positive exponential relationship detected between the N2O fluxes and the denitrification rates suggested denitrifying activity was as a key factor determining the amount of N2O evolved from this kind of fine textured soil characterized by high values of water retention capacity and organic colloids [3,14,15,16]. Nitrification might have also contributed to the N2O-N losses in the low range of nitrous oxide fluxes, under more aerobic conditions, as suggested by the positive correlation found between soil NH4+ concentration and the N2O emissions at values of WFPS <48%. Therefore, the denitrification rate in C2H2- amended intact soil cores under field conditions proved to be a good predictor parameter of direct N2O emissions from soil and the empirically derived regression functions between soil variables could be useful to further develop site-specific N2O empirical models or to calibrate existing N2O process-based simulation models to the local pedo-climatic conditions. Other correlation analyses demonstrated significant exponential relationships for N2O fluxes with both denitrification and nitrification [85,86], which indeed represent driving variables in several N2O simulation models [27,28,29,31,32,83]. As far as denitrification is concerned, most process-models are based on potential denitrification and its regulation through soil temperature, nitrate and water content [6,12,36,37,38]. Numerical fitting/calibration through estimates of denitrification rate in intact soil cores without nutrients amendments might improve the model’s output, since they could be more representative of the denitrifying activities and linked N2O emissions occurring in the field. For instance, Šimek et al. [18] found a significant correlation between the denitrification rate in relatively undisturbed soil cores and the N2O fluxes from the soil of three perennial forage crops systems in Czech Republic, whilst no similar relation was found for both denitrifying enzyme activity and denitrification potential. Additionally, Hénault and Germon [37] showed that the simple denitrification process model NEMIS worked well for two data sets with parameters specifically derived for, while it appeared not to furnish good estimates for other data sets, suggesting that parameters need to be calibrated for different locations depending on specific pedo-climatic conditions. In this respect, Heinen [35] managed to parameterise simplified denitrification models for different soil types by additional data sets of measured actual rate of denitrification and concluded that many models parameterised for each location may work better than a single one pretending to fit a wide range of conditions by using averaged parameters.

5. Conclusions

The present study confirmed that the spring-summer Mediterranean crop peaks of denitrifying activity and direct soil N2O emissions following the key agricultural practices of fertilization and irrigation, thanks to the combined action of high soil nitrate concentration and temperature, every time WFPS promoted the processes. In this regard, the low WFPS threshold value (about 48%) highlighted for both denitrification and N2O fluxes appears characteristic of the analysed fine textured soil under drought Mediterranean conditions.
The marked denitrification rate and direct N2O-N losses from soil (at promoting WFPS) following the late fertilization (also in the case of reduced rate of N-input supply) supported the idea of an N-surplus in the field management at the experimental site.
Significant correlations and regression functions were found for the clay soil between both the denitrification rates and the N2O fluxes with three soil physical-chemical parameters: nitrate concentration, WFPS and temperature. Denitrification rate could be satisfactorily simulated by a simple empirical multiplicative function taking into account the main effect of each driving soil variable and it showed to be significantly correlated with the amount of N2O evolved from soil according to an exponential kinetic. The empirically derived regression functions between soil variables in this study could be useful to further implement site-specific N2O empirical models and/or to calibrate existing N2O process models in other to achieve proper estimations of N2O evolution at the local field scale for fine textured Mediterranean maize-cropped soils.

Author Contributions

Conceptualization, A.F. (Annachiara Forte) and A.F. (Angelo Fierro); methodology, A.F. (Annachiara Forte) and A.F. (Angelo Fierro); software, A.F. (Annachiara Forte); validation, A.F. (Angelo Fierro); formal analysis, A.F. (Annachiara Forte); investigation, A.F. (Annachiara Forte); resources, A.F. (Angelo Fierro); data curation, A.F. (Annachiara Forte); writing—original draft preparation, A.F. (Annachiara Forte); writing—review and editing, A.F. (Angelo Fierro); visualization, A.F. (Annachiara Forte); supervision, A.F. (Angelo Fierro); project administration, A.F. (Angelo Fierro).

Funding

This research received no external funding.

Acknowledgments

Authors wish to thank the zootechnical farm “Iemma” kindly hosting the on-field experimental activities. The Authors also wish to thank Silvia Piccirillo and Rosa Milo for their valuable contribution to both on-field and laboratory activities.

Conflicts of Interest

The authors declare no conflict of interest.

References

  1. IPCC. Climate Change 2013: The Physical Science Basis. In Contribution of Working Group I to the Fifth Assessment Report of the Intergovernmental Panel on Climate Change; Stocker, T.F., Qin, D., Plattner, G.K., Tignor, M., Allen, S.K., Boschung, J., Nauels, A., Xia, Y., Bex, V., Midgley, P.M., Eds.; Cambridge University Press: Cambridge, UK; New York, NY, USA, 2013; p. 1535. [Google Scholar]
  2. Ravinshakara, A.R.; Daniel, J.S.; Portmann, R.W. Nitrous oxide (N2O): the dominant ozone-depleting substance emitted in the 21st century. Science 2009, 326, 123–125. [Google Scholar] [CrossRef] [PubMed]
  3. Hénault, C.; Grossel, A.; Mary, B.; Roussel, M.; Léonard, J. Nitrous Oxide Emission by Agricultural Soils: A Review of Spatial and Temporal Variability for Mitigation. Pedosphere 2012, 22, 426–433. [Google Scholar] [CrossRef]
  4. Butterbach-Bahl, K.; Baggs, E.M.; Dannenmann, M.; Kiese, R.; ZechmeisterBoltenstern, S. Nitrous oxide emissions from soils: How well do we understand the processes and their controls? Philos. Trans. R. Soc. B 2013, 368, 1621. [Google Scholar] [CrossRef] [PubMed]
  5. Chen, D.; Li, Y.; Grace, P.; Mosier, A. N2O emissions from agricultural lands: a synthesis of simulation approaches. Plant Soil 2008, 309, 169–189. [Google Scholar] [CrossRef]
  6. Fang, Q.; Ma, L.; Halvorson, A.D.; Malone, R.; Ahuja, L.; Del Grosso, S.; Hatfield, J. Evaluating four N2O emissions algorithms in RZWQM2 in response to N rate on an irrigated corn field. Environ. Model. Softw. 2015, 72, 56–70. [Google Scholar] [CrossRef]
  7. Grossel, A.; Nicoullaud, B.; Bourennane, H.; Lacoste, M.; Guimbaud, C.; Robert, C.; Hénault, C. The effect of tile-drainage on nitrous oxide emissions from soils and drainage streams in a cropped landscape in Central France. Agric. Ecosyst. Environ. 2016, 230, 251–260. [Google Scholar] [CrossRef]
  8. Aguilera, E.; Lassaletta, L.; Sanz-Cobena, A.; Garniere, J.; Vallejo, A. The potential of organic fertilizers and water management to reduce N2O emissions in Mediterranean climate cropping systems. A review. Agric. Ecosyst. Environ. 2013, 164, 32–52. [Google Scholar] [CrossRef]
  9. Castaldi, S.; Alberti, G.; Bertolini, T.; Forte, A.; Miglietta, F.; Valentini, R.; Fierro, A. N2O EmissionFactors for ItalianCrops. In The Greenhouse Gas Balance of Italy; Valentini, R., Miglietta, E.F., Eds.; Environmental Science and Engineering; Springer: Berlin, Germany, 2015; Chapter 9; pp. 135–144. ISBN 978-3-642-32423-9. [Google Scholar]
  10. Cayuela, M.; Aguilera, E.; Sanz-Cobena, A.; Adams, D.; Abalos, D.; Bartong, L.; Ryalsh, R.; Silver, W.L.; Alfaro, M.A.; Pappa, V.A.; et al. Direct nitrous oxide emissions in Mediterranean climate cropping systems: Emission factors based on a metaanalysis of available measurement data. Agric. Ecosyst. Environ 2017, 238, 25–35. [Google Scholar] [CrossRef]
  11. IPCC. Intergovernamental Panel of Climate Change Guidelines for National Greenhouse Gas inventories. Prepared by the National greenhouse Gas Inventories Programme. In Agriculture, Forestry and other Land Use. N2O Emissions from Managed Soils, and CO2 Emissions from Lime and Urea Application; Eggleston, H.S., Buendia, L., Miwa, K., Ngara, T., Tanabe, K., Eds.; IGES: Hayama, Japan, 2006; Chapter 11; Volume 4. [Google Scholar]
  12. Boyer, E.W.; Alexander, R.B.; Parton, W.J.; Li, C.; Butterbach-Bahl, K.; Donner, S.D.; Skaggs, W.; Del Grosso, S.J. Modeling denitrifcation in terrestrial and aquatic ecosystems at regional scales. Ecol. Appl. 2006, 16, 2123–2142. [Google Scholar] [CrossRef]
  13. Galloway, J.N.; Dentener, F.J.; Capone, D.G.; Boyer, E.W.; Howarth, R.W.; Seitzinger, S.P.; Asner, G.P.; Cleveland, C.C.; Green, P.A.; Holland, E.A.; et al. Nitrogen cycles: Past, Present and Future. Biogeochemistry 2004, 70, 153–226. [Google Scholar] [CrossRef]
  14. Bollmann, A.; Conrad, R. Influence of O2 availability on NO and N2O release by nitrification and denitrification in soils. Glob. Chang. Biol. 2004, 4, 387–396. [Google Scholar] [CrossRef]
  15. Khalil, K.; Mary, B.; Renault, P. Nitrous oxide production by nitrification and denitrification in soil aggregates as affected by O2 concentration. Soil Biol. Biochem. 2004, 36, 687–699. [Google Scholar] [CrossRef]
  16. Farquharson, R.; Baldock, J. Concepts in modelling N2O emissions from land use. Plant Soil 2008, 309, 147–167. [Google Scholar] [CrossRef]
  17. Abbasi, M.K.; Adams, W.A. Gaseous N emission during simultaneous nitrification-denitrification associated with mineral N fertilization to a grassland soil under field conditions. Soil Biol. Biochem. 2000, 32, 1251–1259. [Google Scholar] [CrossRef]
  18. Šimek, M.; Elhottová, D.; Klimeš, F.; Hopkins, D.W. Emissions of N2O and CO2, denitrification measurement and soil properties in red clover and ryegrass stands. Soil Biol. Biochem. 2004, 36, 9–21. [Google Scholar] [CrossRef]
  19. Arcara, P.G.; Gamba, C.; Bidini, D.; Marchetti, R. The effect of urea and pig slurry fertilization on denitrification, direct nitrous oxide emission, volatile fatty acids, water-soluble carbon and anthrone-reactive carbon in maize-cropped soil from the Po plain (Modena, Italy). Biol. Fertil. Soils 1999, 29, 270–276. [Google Scholar] [CrossRef]
  20. Sánchez, L.; Díaz, J.A.; Vallejo, A.; Cartagena, M.C. Denitrification losses from irrigated crops central Spain. Soil Biol. Biochem. 2001, 33, 1201–1209. [Google Scholar] [CrossRef]
  21. Vallejo, A.; Diez, J.A.; Lopez-Valdivia, L.M.; Cartagena, M.C.; Tarquis, A.; Hernàiz, P. Dentitrification from an irrigated soil fertilized with pig slurry under Mediterranean conditions. Biol. Fertil. Soils 2004, 40, 93–100. [Google Scholar] [CrossRef]
  22. Vallejo, A.; Skiba, U.M.; García-Torres, L.; Arce, A.; López-Fernández, S.; Sánchez-Martín, L. Nitrogen oxides emission from soils bearing a potato crop as influenced by fertilization with treated pig slurries and composts. Soil Biol. Biochem. 2006, 38, 2782–2793. [Google Scholar] [CrossRef]
  23. Meijide, A.; Díez, J.A.; Sánchez-Martín, L.; López-Fernández, S.; Vallejo, A. Nitrogen oxide emissions from an irrigated maize crop amended with treated pig slurries and composts in a Mediterranean climate. Agric. Ecosyst. Environ. 2007, 121, 383–394. [Google Scholar] [CrossRef] [Green Version]
  24. Maag, F.P.; Vinther, F.P. Effect of temperature and water on gaseous emissions from soils treated with animal slurry. Soil Sci. Soc. Am. J. 1999, 63, 858–865. [Google Scholar] [CrossRef]
  25. Conen, F.; Dobbie, K.E.; Smith, K.A. Predicting N2O emissions from agricultural land through related soil parameters. Glob. Chang. Biol. 2000, 6, 417–426. [Google Scholar] [CrossRef]
  26. Ranucci, S.; Bertolini, T.; Vitale, L.; Di Tommasi, P.; Ottaiano, L.; Oliva, M. The influence of management and environmental variable on soil N2O emissions in a crop system in Southern Italy. Plant Soil 2011, 343, 83–96. [Google Scholar] [CrossRef]
  27. Parton, W.J.; Mosier, A.R.; Ojima, D.S.; Valentine, D.W.; Schimel, D.S.; Weier, K.; Kulmala, A.E. Generalized model for N2 and N2O production from nitrification and denitrification. Glob. Biogeochem. Cycles 1996, 10, 401–412. [Google Scholar] [CrossRef]
  28. Parton, W.J.; Holland, E.A.; Del Grosso, S.J.; Hartman, M.D.; Martin, R.E.; Mosier, A.R.; Ojima, D.S.; Schimel, D.S. Generalized model for NOx and N2O emissions from soils. J. Geophys. Res. Atmos. 2001, 106, 17403–17419. [Google Scholar] [CrossRef]
  29. Del Grosso, S.J.; Parton, W.J.; Mosier, A.R.; Walsh, M.K.; Ojima, D.S.; Thornton, P.E. Daycent national scale simulations of N2O emissions from cropped soils in the USA. J. Environ. Qual. 2006, 35, 1451–1460. [Google Scholar] [CrossRef] [PubMed]
  30. Hénault, C.; Chèneby, D.; Heurlier, K.; Garrido, F.; Pérez, S.; Germon, J.C. Laboratory kinetics of soil denitrification are useful to discriminate soils with potentially high levels of N2O emission on the field scale. Agronomie 2001, 21, 713–723. [Google Scholar] [CrossRef]
  31. Hénault, C.; Bizouard, F.; Laville, P.; Gabrielle, B.; Nicoullau, B.; Germon, J.C.; Cellier, P. Predicting in situ soil N2O emission using NOE algorithm and soil database. Glob. Chang. Biol. 2005, 11, 115–127. [Google Scholar] [CrossRef]
  32. Li, C.S. Modelling trace gas emissions from agricultural ecosystems. Nutr. Cycl. Agroecosyst. 2000, 58, 259–276. [Google Scholar] [CrossRef]
  33. Chatskikh, D.; Olesen, J.; Berntsen, J.; Regina, K.; Yamulki, S. Simulation of effects of soils, climate and management on N2O emission from grasslands. Biogeochemistry 2005, 76, 395–419. [Google Scholar] [CrossRef]
  34. Gabrielle, B.; Laville, P.; Hénault, C.; Nicoullaud, B.; Germon, J.C. Simulation of nitrous oxide emissions from wheatcropped soils using CERES. Nutr. Cycl. Agroecosyst. 2006, 74, 133–146. [Google Scholar] [CrossRef]
  35. Heinen, M. Application of a widely used denitrification model to Dutch data sets. Geoderma 2006, 133, 464–473. [Google Scholar] [CrossRef]
  36. Heinen, M. Simplified denitrification models: Overview and properties. Geoderma 2006, 133, 444–463. [Google Scholar] [CrossRef]
  37. Hénault, C.; Germon, J.C. NEMIS, a predictive model of denitrification on the field scale. Eur. J. Soil Sci. 2000, 51, 257–270. [Google Scholar] [CrossRef]
  38. Bessou, C.; Ferchaud, F.; Gabrielle, B.; Mary, B. Biofuels, greenhouse gases and climate change. In Sustainable Agriculture; Eric, L., Marjolaine, H., Mireille, N., Philippe, D., Eds.; Springer: Heidelberg, Germany, 2011; Volume 2, pp. 365–468. [Google Scholar]
  39. Vitale, L.; Di Tommasi, P.; Arena, C.; Riondino, M.; Forte, A.; Verlotta, A.; Fierro, A.; De Santo, A.V.; Fuggi, A.; Magliulo, V. Growth and gas exchange response to water shortage of a maize crop on different soil types. Acta Physiol. Plant 2009, 31, 331–341. [Google Scholar] [CrossRef]
  40. Parisi, D.; Nacca, F.; Cozzolino, C.; Verlotta, A.; Arena, C.; Vitale, L.; Carillo, P.; Fuggi, A. Photosynthesis and nitrogen metabolism of maize plants cultivated in the Mediterranean area. In Proceeding of the 8th Annual FISV Meeting, Riva del Garda, Italy, 28 September–1 October 2006. [Google Scholar]
  41. Butler, W.L.; Kitajima, M. Fluorescence quenching in Photosystem II of chloroplasts. Biochim. Biophys. Acta 1975, 376, 116–125. [Google Scholar] [CrossRef]
  42. Hirel, B.; Andrieu, B.; Valadier, M.H.; Renard, S.; Quillere, I.; Chelle, M.; Pommel, B.; Fournie, C.; Drouet, J.L. Physiology of maize. II. Identification of physiological markers representative of the nitrogen status of maize (Zea mays) leaves during grain filling. Physiol. Plant. 2005, 124, 178–188. [Google Scholar] [CrossRef]
  43. Robertson, G.P.; Bledsoe, C.S.; Coleman, D.C.; Sollins, P. Standard Soil Methods for Long Term Ecological Research; Oxford University Press: New York, NY, USA, 1999. [Google Scholar]
  44. Groffman, P.M.; Altabet, M.A.; Bohlke, J.K.; Butterbach-Bahl, K.; David, M.B.; Firestone, M.K.; Giblin, A.E.; Kana, T.M.; Nielsen, L.P.; Voytek, M.A. Methods for measuring denitrification: Diverse approaches to a difficult problem. Ecol. Appl. 2006, 16, 2091–2122. [Google Scholar] [CrossRef]
  45. Carter, M.R.; Gregorich, E.G. Soil Sampling and Methods of Analysis, 2nd ed.; CRC Press: Boca Raton, FL, USA, 2007. [Google Scholar]
  46. Drury, C.F.; Myrold, D.D.; Beauchamp, E.G.; Reynolds, W.D. Denitrification techniques for soils. In Soil Sampling and Methods of Analysis; Canadian Soil Science Society; Carter, M.R., Gregorich, E.G., Eds.; CRC Press: Boca Raton, FL, USA, 2008; pp. 471–494. [Google Scholar]
  47. Revsbech, N.P.; Sørensen, J. Denitrification in Soil and Sediment; Springer Science & Business Media: New York, NY, USA, 2013. [Google Scholar]
  48. Sgouridis, F.; Stott, A.; Ullah, S. Application of the 15N gas-flux method for measuring in situN2 and N2O fluxes due to denitrification in natural and semi-natural terrestrial ecosystems and comparison with the acetylene inhibition technique. Biogeosciences 2016, 13, 1821–1835. [Google Scholar] [CrossRef]
  49. Felber, R.; Conen, F.; Flechard, C.R.; Neftel, A. Theoretical and practical limitations of the acetylene inhibition technique to determine total denitrification losses. Biogeosciences 2012, 9, 4125–4138. [Google Scholar] [CrossRef] [Green Version]
  50. Hauer, F.R.; Lamberti, G.A. Methods in Stream Ecology: Volume 2: Ecosystem Function; Academic Press: New York, NY, USA, 2017. [Google Scholar]
  51. Fuller, K.D.; Burton, L.D.; Grimmett, M.G.; Franklin, J.L.; Drury, C.F.; Zebarth, B.J.; Rodd, A.V.; St George, E. Effect of land management practices and environmental parameters on growing season denitrification rates under dairy crop rotations in Atlantic Canada. Can. J. Soil Sci. 2017, 96, 86–103. [Google Scholar] [CrossRef]
  52. Miller, J.J.; Beasley, B.W.; Drury, C.F.; Zebarth, B.J. Denitrification during the growing season as influenced by long-term application of composted versus fresh feedlot manure. Can. J. Plant Sci. 2012, 92, 865–882. [Google Scholar] [CrossRef]
  53. Sánchez-Martín, L.; Arce, A.; Benito, A.; Garcia-Torres, L.; Vallejo, A. Influence of drip and furrow irrigation systems on nitrogen oxide emissions from a horticultural crop. Soil Biol. Biochem. 2008, 40, 1698–1706. [Google Scholar] [CrossRef]
  54. Sánchez-Martín, L.; Meijide, A.; Garcia-Torres, L.; Vallejo, A. Combination of drip irrigation and organic fertilizer for mitigating emissions of nitrogen oxides in semiarid climate. Agric. Ecosyst. Environ. 2010, 137, 99–107. [Google Scholar] [CrossRef]
  55. Castaldi, S.; Aragosa, D. Factors influencing nitrification and denitrification variability in a natural and fire-disturbed Mediterranean shrubland. Biol. Fertil. Soils 2002, 36, 418–425. [Google Scholar] [CrossRef]
  56. Allen, S.E. Chemical Analysis of Ecological Materials, 2nd ed.; Blackwell Scientific Publications: Oxford, UK, 1989; pp. 81–159. [Google Scholar]
  57. Lin, L.I.K. A concordance correlation coefficient to evaluate reproducibility. Biometrics 1989, 45, 255–268. [Google Scholar] [CrossRef] [PubMed]
  58. López-Fernández, S.; Díez, J.A.; Hernaiz, P.; Arce, A.; García-Torres, L.; Vallejo, A. Effects of fertiliser type and the presence or absence of plants on nitrous oxide emissions from irrigated soils. Nutr. Cycl. Agroecosys. 2007, 78, 279–289. [Google Scholar] [CrossRef]
  59. Kallenbach, C.M.; Rolston, D.E.; Horwath, W.R. Cover cropping affects soil N2O and CO2 emissions differently depending on type of irrigation. Agric. Ecosyst. Environ. 2010, 137, 251–260. [Google Scholar] [CrossRef]
  60. Fierro, A.; Forte, A. Measurements of CO2 and N2O Emissions in the Agricultural Field Experiments of the MESCOSAGR Project. In Carbon Sequestration in Agricultural Soils; Piccolo, A., Ed.; Springer: Heidelberg, Germany, 2012; Chapter 9. [Google Scholar]
  61. Forte, A.; Fiorentino, N.; Fagnano, M.; Fierro, A. Mitigation impact of minimum tillage on CO2 and N2O emissions from a Mediterranean maize cropped soil under low-water input management. Soil Tillage Res. 2017, 166, 167–178. [Google Scholar] [CrossRef]
  62. Forte, A.; Fagnano, M.; Fierro, A. Potential role of compost and green manure amendment to mitigate soil GHGs emissions in Mediterranean drip irrigated maize production systems. J. Environ. Manag. 2017, 192, 68–78. [Google Scholar] [CrossRef] [Green Version]
  63. Neff, J.C.; Townsend, A.R.; Gleixner, G.; Lehman, S.J.; Turnbull, J.; Bowman, W.D. Variable effects of nitrogen additions on the stability and turnover of soil carbon. Nature 2002, 419, 915–917. [Google Scholar] [CrossRef] [PubMed]
  64. Potthoff, M.; Dyckmans, J.; Flessa, H.; Muhs, A.; Beese, F.; Joergensen, R.G. Dynamics of maize (Zea mays L.) leaf straw mineralization as affected by the presence of soil and the availability of nitrogen. Soil Biol. Biochem. 2005, 37, 1259–1266. [Google Scholar] [CrossRef]
  65. Qiu, Q.; Wu, L.; Ouyang, Z.; Li, B.; Xu, Y.; Wu, S.; Gregorich, E.G. Priming effect of maize residue and urea N on soil organic matter changes with time. Appl. Soil Ecol. 2016, 100, 65–74. [Google Scholar] [CrossRef]
  66. Granli, T.; Bockman, O.C. Nitrous oxide from agriculture. Nor. J. Agric. Sci. 1994, 12, 128. [Google Scholar]
  67. Zhou, M.; Butterbach-Bahl, K. Assessment of nitrate leaching loss on a yield-scaled basis from maize and wheat cropping systems. Plant Soil 2014, 374, 977–991. [Google Scholar] [CrossRef]
  68. Piccini, C.; Di Bene, C.; Farina, R.; Pennelli, B.; Napoli, R. Assessing Nitrogen Use Efficiency and Nitrogen Loss in a Forage-Based System Using a Modeling Approach. Agronomy 2016, 6, 23. [Google Scholar] [CrossRef]
  69. McSwiney, C.P.; Robertson, G.P. Non-linear response of N2O flux to incremental fertilizer addition in a continuous maize (Zea mays sp.) cropping system. Glob. Chang. Biol. 2005, 11, 1712–1719. [Google Scholar] [CrossRef]
  70. Quemada, M.; Baranski, M.; Nobel-de Lange, M.N.J.; Vallejo, A.; Cooper, J.M. Meta-analysis of strategies to control nitrate leaching in irrigated agricultural systems and their effects on crop yield. Agric. Ecosyst. Environ. 2013, 174, 1–10. [Google Scholar] [CrossRef] [Green Version]
  71. Guardia, G.; Abalosb, D.; García-Marco, S.; Quemadaa, M.; Alonso-Ayusoa, M.; Cárdenas, L.M.; Dixonc, L.E.; Vallejo, A. Integrated soil fertility management drives the effect of cover crops on GHG emissions in an irrigated field. Biogeosciences 2016, 13, 5245–5257. [Google Scholar] [CrossRef]
  72. Gilsanz, C.; Baez, D.; Misselbrook, T.H.; Dhanoa, M.S.; Cardenas, L.M. Development of emission factors and efficiency of two nitrification inhibitors, DCD and DMPP. Agric. Ecosyst. Environ. 2016, 216, 1–8. [Google Scholar] [CrossRef]
  73. Alfieri, F. Applicazione Dell’analisi Energetica ad un Sistema Produttivo Nell’area Della Piana del Sele. Master’s Thesis, Università degli Studi di Napoli Federico II, Naples, Italy, 2005. [Google Scholar]
  74. Klemedtsson, L.; Svensson, B.H.; Linberg, T.; Rosswall, T. The use of acetylene inhibition of nitrous oxide reductase in quantifying denitrification in soils. Plant Soil 1977, 99, 303–319. [Google Scholar] [CrossRef]
  75. Limner, A.W.; Steele, K.W. Denitrification potentials: measurements of seasonal variations using a short-termanaerobic incubation technique. Soil Biol. Biochem. 1982, 14, 179–184. [Google Scholar] [CrossRef]
  76. Mahli, S.S.; McGill, W.B.; Nyborg, M. Nitrate losses in soils: Effect of temperature, moisture and substrate concentration. Soil Biol. Biochem. 1990, 22, 733–737. [Google Scholar]
  77. Barton, L.; McLay, C.D.A.; Schipper, L.A.; Smith, C.T. Annual denitrification rates in agricultural and forest soils: A review. Soil Res. 1999, 37, 1073–1093. [Google Scholar] [CrossRef]
  78. Schjønning, P.; Munkholm, L.J.; Moldrup, P.; Jacobsen, O.H. Modelling soil pore characteristics from measurements of air exchange: The long-term effects of fertilization and crop rotation. Eur. J. Soil Sci. 2002, 53, 331–339. [Google Scholar] [CrossRef]
  79. Gomboš, M. The Impact of Clay Minerals on Soil Hydrological Processes. In Clay Minerals in Nature-Their Characterization, Modification and Application; Valaskova, M., Ed.; IntechOpen: Rijeka, Croatia, 2012; pp. 119–148. [Google Scholar]
  80. Vogel, H.J.; Hoffmann, H.; Leopold, A.; Roth, K. Studies of crack dynamics in clay soil II. A physically based model for crack formation. Geoderma 2005, 125, 213–223. [Google Scholar] [CrossRef]
  81. Firestone, M.K.; Fireston, R.B.; Tiedje, J.M. Nitrous oxide from soil denitrification: Factors controlling its biological production. Science 1980, 208, 749–751. [Google Scholar] [CrossRef]
  82. Vinther, F.P. Total denitrification and the ratio between N2O and N2 during the growth of spring barley. Plant Soil 1984, 76, 227–232. [Google Scholar] [CrossRef]
  83. Rabot, E.; Cousin, I.; Hénault, C. A modeling approach of the relationship between nitrous oxide fluxes from soils and the water filled pore space. Biogeochemistry 2015, 122, 395–408. [Google Scholar] [CrossRef]
  84. Van Lent, J.; Hergoualc’h, K.; Verchot, L.V. Reviews and syntheses: Soil N2O and NO emissions from land use and land-use change in the tropics and subtropics: A meta-analysis. Biogeosciences 2015, 12, 7299–7313. [Google Scholar] [CrossRef]
  85. Chen, S.T.; Huang, Y. Determination of Respiration, Gross Nitrification and Denitrification in Soil Profile Using BaPS System. J. Environ. Sci. 2006, 18, 937–943. [Google Scholar] [CrossRef]
  86. Li, Y.K.; Li, B.; Guo, W.Z.; Wu, X.P. Effects of Nitrogen Application on Soil Nitrification and Denitrification Rates and N2O Emissions in Greenhouse. J. Agric. Sci. Techol. 2015, 17, 519–530. [Google Scholar]
Figure 1. Figure shows: the pattern of climatic variables (daily average air temperature and rainfall, soil temperature and irrigation water input) (a) and the mean values and standard errors for denitrification rate (b), N2O fluxes (c), soil water filled pore space (WFPS) (d) and soil NO3 (e), in the course of the Zea mays crop in 2005. SF, sowing fertilization; LF, late fertilization.
Land 08 00097 g001
Figure 2. Figure shows: the pattern of climatic variables (daily average air temperature and rainfall, soil temperature and irrigation water input) (a) and the mean values and standard errors for denitrification rate (b), N2O fluxes (c), soil WFPS (d), soil NO3 (e) and soil NH4+ (f), at the late fertilization (LF) in the course of the Zea mays crop in 2006.
Land 08 00097 g002
Figure 3. Figure shows the mean values and standard errors for denitrification rate (a), N2O fluxes (b), soil NO3(c) and WFPS (d) in the course of the manipulation experiment during the Zea mays growth in 2005. The arrows indicate the irrigation events. The statistical results of the analysis of variance are shown in the inset tables. The different letters point out significant differences between treatments on each sampling date (All Pairwise Multiple Comparison Procedures, Holm-Sidak method). The crossed bars indicate the N2O fluxes and the WFPS after irrigation events, on sampling dates when direct N2O emissions were recorded before and after water supply.
Land 08 00097 g003
Figure 4. Analyses on the whole data set. All the figures refer to the mean values from each sampling date and R2 is the coefficient of determination for the linear and non-linear fitting equations. (a) Denitrification rate vs. soil nitrate concentration at increasing range of soil WFPS (One site saturation equation, f = (Bmax*x)/(Km+x), where Bmax (maximum rate) = 1469.6 μg N2O-N m−2 h−1 and Km (half-saturation constant) = 38.5 mg NO3-N kg−1); (b) Denitrification rate vs. soil WFPS at increasing range of soil nitrate concentration (Exponential growth, 2 parameter equation, f = a*exp(b*x); a = 6.780 and b = 0.086 at 19 mg·kg−1 < NO3-N < 29 mg·kg−1, solid line; a = 2.305 and b = 0.112 at NO3-N > 40 mg·kg−1, dashed line); (c) N2O fluxes vs. soil nitrate concentration at increasing range of soil WFPS (Linear equation, f = y0+a*x, where y0 = 50.37 and a = 0.90 at 40% < WFPS < 45%, solid line); (d) N2O fluxes from soil vs. soil WFPS at increasing range of soil nitrate concentration (Exponential growth, 2 parameter, equation, f = a*exp(b*x), where a = 0.32 and b = 0.12 at 19 mg·kg−1 < NO3-N < 29 mg·kg−1 and a = 0.79 and b = 0.11 at NO3-N> 40 mg·kg−1); (e) N2O fluxes from soil vs. Denitrification rate (Exponential growth, 2 parameter, equation, f = a*exp(b*x), where a = 35.8461 and b = 0.0015.
Land 08 00097 g004
Figure 5. Coefficients and concordance correlation coefficients (CCC) relating to the comparison of the measured and simulated denitrification rate and N2O fluxes through the four simple empirically derived predictiveequations: (a) equation (1); (b) equation (2); (c) equation (3); (d) equation (4). The correction factors (k) of the predicting functions deriving the N2O fluxes and the denitrification rate from soil parameters were: 743.871 and 32.913 for equation (1) and (2), respectively.
Land 08 00097 g005
Table 1. The main agronomic practices and output of the Zea mays L. cultivations in 2005 and 2006.
2005 2006
Preceding cropLolium italicum L., supplied with 250 kg ha−1 NPK 11-22-16 Hydro at the sowing timeMixed crop of Lolium italicum L. and Trifolium alexandrinum L., supplied with 250 kg ha−1 NPK 11-22-16 Hydro at the sowing time
Soil managementPloughingPloughing
Buffalo slurry sewage spreading 4 L m−2 (early September)20 L m−2 (early September)
Sowing date17 May 200512 June 2006
Sowing fertilization200 kg ha−1ENTEC® 25+15 (NP fertilizer with 3,4 DMPP nitrification inhibitor)250 kg ha−1ENTEC® 25+15(NP fertilizer with 3,4 DMPP nitrification inhibitor)
Late fertilization26 days after maize sprouting; 500 kg ha−1 ENTEC®46 (urea fertilizer with 3,4 DMPP nitrification inhibitor) a30 days after maize sprouting; 200 kg ha−1 ENTEC® 46 (urea fertilizer) + 200 kg ha−1 urea 46%
Mowing24 August 200528 September 2006
Above-ground biomass b22.5 ± 1.1 (t ha−1) c23 ± 1.2 (t ha−1)
a At the late fertilization, N+ and N- plots in the manipulation experiment were supplied with 300 kg ha−1 and 700 kg ha−1 urea COMPO-ENTEC 46 (with 3,4 DMPP nitrification inhibitor), respectively. b Mean values and standard error of the mean from four replicates. c Crop yield in N+ and N− treatments did not differ significantly from the control plots under standard fertilization management.
Table 2. Coefficients for the significant correlations between the N2O emissions, the denitrification rate (Den. rate) and the driving ancillary parameters. Pearson Product- Moment Test: * P < 0.05; ** P < 0.01; *** P < 0.001. The numbers reported in parentheses in Italic font show the samples size. Tsoil: soil temperature; WFPS: water filled pore space.
TsoilWFPSNO3-NNH4-NDen. Rate
Standard cultivation management 2005
Den. rate 0.957***(7)
N2O fluxes 0.830*(7) 0.786*(7)
Standard cultivation management 2006
Den. rate 0.487**(32)
N2O fluxes 0.487**(32) 0.627*(12)
(WFPS > 48%)
0.562***(32)
Manipulation experiment 2005
Den. rate 0.862**(10)0.856*(6)
(WFPS > 48%)
N2O fluxes 0.598**(17)0.763*(7)
(WFPS > 48%)
0.906***(10)
The whole dataset
Den. rate0.858*(6) a
(NO3-N > 15 mg kg−1,
48% < WFPS < 55%)
0.818**(24)0.744**(9)
(48% < WFPS < 55%)
N2O fluxes0.750**(6) b
(NO3-N > 15 mg kg−1,
48% < WFPS < 55%)
0.706**(24)0.781*(9)
(48% < WFPS < 55%)
0.860***(24)
a Denitrification rate = −3207.883 + (174.565 * Tsoil); b N2O fluxes = −858.674 + ( 44.062 * Tsoil).

