Article

Horse Welfare and Natural Values on Semi-Natural and Extensive Pastures in Finland: Synergies and Trade-Offs

by
Markku Saastamoinen
1,*,
Iryna Herzon
2,
Susanna Särkijärvi
1,
Catherine Schreurs
2 and
Marianna Myllymäki
1
1
Natural Resources Institute Finland (Luke), Green Technology, 00790 Helsinki, Finland
2
Department of Agricultural Sciences, University of Helsinki, 00014 Helsinki, Finland
*
Author to whom correspondence should be addressed.
Submission received: 10 August 2017 / Revised: 3 October 2017 / Accepted: 12 October 2017 / Published: 14 October 2017

Abstract

:
In several regions in Europe, the horse is becoming a common grazer on semi-natural and cultivated grasslands, though the pasturing benefits for animals and biodiversity alike are not universally appreciated. The composition of ground vegetation on pastures determines the value of both the forage for grazing animals as well as the biodiversity values for species associated with the pastoral ecosystems. We studied three pastures, each representing one of the management types in southern Finland (latitudes 60–61): semi-natural, permanent and cultivated grassland. All have been grazed exclusively by horses for several decades. We aimed to evaluate feeding values and horses’ welfare, on the one hand, and impacts of horses on biodiversity in boreal conditions, on the other. Though there were differences among the pastures, the nutritional value of the vegetation in all three pastures met the energy and protein needs of most horse categories through the whole grazing season. Some mineral concentrations were low compared to the requirements, and supplementation of Cu, Zn and Na is needed to balance the mineral intake. Only minor injuries or health problems were observed. All metrics of biological values, as well as number of species eaten by horses, were particularly high in a semi-natural pasture compared to other pasture types. The highest ratio of species cover preferred by horses to the total cover was found in the permanent pasture, while at the regularly re-seeded pasture, there was a particularly high cover of species, indicating low biodiversity values on grassland. There was, therefore, a trade-off between the quantity of forage and biological values in pastures, but not in quality. The results provide clear indication both for the suitability of the studied pasture types to horses and for grazing of horses for biodiversity management. In each pasture type, specific management is needed to simultaneously achieve objectives of adequate pasturing and biodiversity. The short duration (only one grazing season) must be considered when applying the results.

1. Introduction

Sustainable management of grasslands occupies a prominent role in land use policies. This is due to their multifunctional character in producing not only agricultural commodities but also maintaining biodiversity, soil and water quality, supporting recreation, and adding to resilience to environmental change [1,2]. Two types of grasslands have received particular attention in land use research. Permanent grasslands are retained for over 5 years on the same parcel but additional seeding is possible without termination of the previous sward. There are no input or management restrictions (EU Regulation 1307/2013). Within the permanent grasslands, semi-natural grasslands are long-term swards that have not been fertilized and re-seeded for several decades and, sometimes, for hundreds of years. Their vegetation consists of natural herbs, grasses and sedges [3]. In modern livestock production systems in Europe, the importance of both has declined and grazing is practiced mostly on cultivated grasslands, which are re-seeded at regular intervals and receive inputs [1]. However, rough grazing on permanent pastures is still common in some European regions [4]. In many cases, grazing of old pasturelands with a grazing history gives the highest biodiversity benefits with horse grazing having a more positive effect compared to mowing [2].
Halting and reversing the decline of permanent pastures is also regarded among the biggest challenges for the maintenance of European biodiversity and wider ecosystem services. Semi-natural grasslands are among the most species-rich habitats in Europe and, therefore, their continuing loss is a major driver for decrease in biodiversity [5,6]. Accordingly, both types are protected in the European Union through various policy tools [7]. In Finland, grassland area decreased from 1960 to the beginning of 2000 by about 55% [8]. At the beginning of the 1900s, the area of natural meadow pastures was about 1.3 million hectares but today it is only 100,000 hectares, and the natural meadows have practically disappeared. In Sweden, pasture area decreased from 1.3 million hectares at the beginning of the 1900s to 235,000 hectares at the beginning of the 2000s, and only 1% of Sweden’s land area consists of permanent pasture and meadows [9,10]. The corresponding figures for Europe and the world are 17% and 26%, respectively [11].
The equine sector is currently one of the few growing rural industries in many European countries [12,13,14,15]. The growing number of horses is increasingly seen as an opportunity to preserve and maintain pastoral biodiversity, especially in regions with high rates of grassland abandonment [16]. However, the potential of horses as grazers of semi-natural and other extensive grasslands is often poorly realised [17] and studied [18]. Better understanding of the role of horses in managing farmland biodiversity is needed for promoting socially acceptable and sustainable equine industries. Understanding of pasture feeding is also needed for attracting horse owners’ attention to the utilization of permanent pastures and in developing optimized management approaches.
As grazers, horses differ from other herbivores in several ways. Firstly, as a monogastric herbivore and hind gut fermenter, the horse is adapted to low starch diets (due to the low amylase activity in the small intestine) and high daily feed intake and requires a steady supply of dietary fiber in considerable quantity for proper digestion and gut health [19]. This can most naturally be supplied through pasturing where the horse spends 10–18 h grazing daily [20,21]. Horses maintained on pasture are expected to have healthy gastric mucosa compared with stall fed horses [22]. Secondly, horses have a highly selective grazing behavior [20,23,24]. They have a higher preference for grass and make less use of forbs and legumes compared to ruminants [25,26]. Finally, horses use pasture in a patchy manner: the foraging areas are grazed closely while latrine areas are rejected, which creates more heterogeneous swards than those managed through cattle grazing [25]. Overgrazing at preferred areas may, however, cause soil erosion problems on horse pastures [27]. Horses are also reputed for trampling ancient remains or gnawing on trees on semi-natural pastures [28]. Therefore, management of species-rich grassland for horses should take into account equine-specific grazing preferences and forage nutritive values on such grasslands [25,29]. Thus, there is a need for equine pasturing guidelines because the management context is different from that developed for grasslands used for livestock [30].
Although the effects of grazing by horses on the vegetation and on best management of horse pastures have received considerable research attention (e.g., [26,31]), the extent to which horses can be used in maintaining semi-natural pastures in the boreal zone is still unknown because the horse is not a native grazer in the boreal ecosystems. Despite regionally high numbers of horses in Finland, there are only a few pastures that have been continuously managed exclusively with horses for at least two decades. Such rare cases are valuable in establishing the impact of equines on maintaining the natural values of pastures, on the one hand, and on obtaining proper nutrition and welfare of the horse, on the other. We conducted field research in 2012 on three case pastures in southern Finland aimed at filling in the gap above.
Our specific questions were: (1) Do permanent and semi-natural pasture types in boreal conditions provide forage of adequate feed values for most horse categories (young horses, lactating mares, sedentary horses); (2) Do the vegetation composition and biodiversity in pastures managed exclusively with horses indicate high biological values; (3) How does the vegetation structure of the grazed areas differ among the pasture types and change during the grazing periods? We aimed to obtain results of applied value in producing recommendations for optimizing pasture management so that both the wellbeing of horses and pasture nature values are achieved. Particularly, we wanted to identify specific synergies and trade-offs arising between the above aspects of management. Since the knowledge gap is particularly severe for semi-natural boreal pastures, we focused on this grassland type more than the other two types.

2. Materials and Methods

2.1. Selection of Study Cases

We conducted a case-based study in southern Finland, on the border of the hemi-boreal and southern boreal vegetation zones. We chose three pastures characterized by a long history of management exclusively by horses and representing three pasture types, as study areas (Table 1). The types are (i) semi-natural permanent grassland in Ypäjä (owned and managed by MTT Agrifood Research Finland, currently Natural Resources Institute Finland Luke, 60°48.341 N, 23°16.346 E), (ii) permanent grassland under light additional management in Sipoo (privately owned Savijärvi Farm, 60°36.763 N, 25°30.626 E), and (iii) cultivated grassland converted from semi-natural type in Hauho (Särkisaari Island, 61°12.140 N, 24°29.080 E). The three study areas differed in ecological character and in management but all represented the mesic grassland type (Table 1). The stocking rates varied according to the grassland productivity. In all study pastures, they were adjusted for the available forage and body condition score (BCS) of the animals, which were followed in each pasture by people responsible for the care of the horses. The horses were moved to a new parcel once the productivity of the parcel in use declined. Average monthly local weather conditions were obtained from the Finnish Meteorological Institute (Climate guide.fi).
The Ypäjä study area is among the largest areas grazed by horses in Finland (Table 1). It is comprised of 40 ha of open and semi-open pastures, 20 ha of forest pastures and 30 ha of marginal zone. The ground consists mainly of moraine but sand and mull is also present. The area includes 1% species-rich Nardus grasslands on siliceous substrates, 10% Fennoscandian lowland species-rich dry to mesic grasslands, 20% lowland hay meadows, and 30% Fennoscandian wooded meadows—all protected as a Natura 2000 site. The pastures have been under continuous grazing by horses since 1937. In the study year, an average of 20 barren Finnhorse mares owned by MTT (aged 4–20 years, on maintenance level) grazed daily from the end of May to the middle of October. Rotational stocking was applied based on the grass production of the parcels: the mares grazed in rotation on five parcels, which resulted in a stocking rate ranging from 1.1 to 5.9 horses per ha for 1 to 3 weeks per parcel. As per the restrictions for Natura 2000 sites, no additional feeds except mineral concentrates were used. In certain years, bushes and trees have been cut to prevent afforestation and latrine areas have been occasionally mowed. The weather conditions of the study year deviated from the long-term average (2000–2010): the total rainfall (344 vs. 266 mm) of the study period, and the monthly rainfalls of June (89 vs. 60 mm), July (79 vs. 70 mm) and September (116 vs. 60 mm) were higher, but lower than the average in August (57 vs. 76 mm). The monthly mean temperatures were somewhat lower than the average in June (12.6 vs. 15.0 °C), July (16.8 vs. 17.0 °C) and August (14.6 vs. 15.5 °C), but higher in September (10.7 vs. 10.0 °C).
The study area of Savijärvi is a grassland on former peatland and lake bottom (Table 1), and the ground consists of soil and clay. The permanent pasture was established in 2000, and its prior history is cultivation of oats and potato and, later on, hay. Trifolium spp and Phleum pratense are locally re-sown when required, especially in areas avoided by horses. One- and two-year-old Finnish warm-blooded horses owned by the farm grazed in rotation on six parcels at a grazing pressure of 10 horses per ha for two to four weeks per parcel from June to September. The pasture is managed according to organic farming standards. In certain years, bone meal and cow urine are applied as fertilizers. Dung heaps were mechanically spread a couple of times during the summer. Hay is occasionally supplied to the horses during dry summer periods and horses used for riding may receive some oats according to their energy needs. The pasture has a wetness gradient towards a lake. Horses have access to the lake and forest. The rainfall in Savijärvi was higher in June (87 mm) and September (150 mm) but a little bit lower in July (58 mm) and August (56 mm) than the long-term average (50, 61, 81 and 70 mm from June to September, respectively). The temperatures were lower in June (13.3 vs. 15.4 °C) and August (15.5 vs. 16.0 °C) and higher in September (12.0 vs. 11.2 °C) than the average. The temperature in July (17.6 °C) corresponded to the long-term mean (17.4 °C).
The Särkisaari Island (Table 1) is owned by a local Horse Breeding Association and provides summer pasture for young horses owned by private persons. The 16-ha island has been used exclusively for horse pasturing since 1953. The ground is clay and mull. From 1997 (to 2012), a semi-natural grassland has been re-seeded annually with Poa pratensis, Ph. pratense and Lolium perenne. Fertilizers and lime are applied annually and herbicides are used for spot treatment. In the study year, 14 1–3-year-old horses (Finhorses, Standardbred trotters, half-breds) grazed rotationally on two parcels at a grazing pressure of 4.7 to 5.7 horses per ha for about two weeks per parcel. Horses do not receive additional feed except minerals and vitamin. The rainfall in Särkisaari area was lower than the long-term average in July (71 vs. 80 mm) and August (47 vs. 80 mm) but higher in June (86 vs. 61 mm) and September (121 vs. 63 mm). The temperatures corresponded to the average in July (17.0 vs. 17.0 °C) and September (10.4. vs. 10.0 °C) but were lower in June (12.8 vs. 15.3 °C) and August (14.5 vs. 15.1 °C).
In all study areas, the thermal-time corresponded to that of the long-term average, but the cumulative rainfall was higher than the average.

2.2. Feed Analysis of the Pasture Vegetation

We collected vegetation samples for feed analyses from each pasture parcel: five times in Ypäjä (n = 22) and four times in Savijärvi (n = 24) from the beginning of June to the end of September. The sampling sites were within grazed parts of a pasture. We cut plants at the height of ca 2–3 cm from the ground, which was estimated to correspond to the height of horses cutting plants when grazing [32]. In the samples, we retained plants that are known to be eaten by horses in Finland and discarded those that are strictly avoided (Jansson, H. unpubl). The samples (0.5 to 1.0 kg fresh weight) were stored in −20 °C until analysis. On Särkisaari Island, we sampled vegetation only once in mid-July (n = 4).
The feed analysis included contents of dry matter (DM), crude protein (CP), total sugars (TS), neutral detergent fiber (NDF) and in vitro digestible organic matter concentration (DODM, D-value). DM was determined by drying the sample in an oven at 105 °C for 20 h. CP, NDF, DOMD and sugars were determined by the NIR method (Valio Laboratories Ltd., Seinäjoki, Finland). Metabolisable energy (ME, MJ) values were calculated as DOMD × 0.016 [33,34], and digestible crude protein (DCP) by multiplying the CP content (g/kg DM) by the digestibility coefficient determined for ruminants [35]. Minerals—Ca, P, Mg, K, Na, Cu, Zn, Fe and Mn—were analyzed chemically using the emissionspectrometry method (ICP-OES) (Seilab Ltd., Seinäjoki, Finland).

2.3. Animal Management and Welfare

Prior to entering the pasture, the horses in all study areas were dewormed and had their teeth checked and cared for, if necessary. Fresh water was always available from buckets. Mineral supplementations follow intake recommendations [35]. In Savijärvi permanent pasture, some oats were also given. The horses in all research sites were unshod.
The pastures and parcels were fenced with wooden and/or electrical fences. In all study areas, the horses were observed, and the data were recorded and reported daily for signs of injuries and illnesses by persons with experience in animal care and welfare issues. In animal handling, the European Union directives (1999/575/EU; 2007/526/EU) and national animal welfare and ethical legislation based on the directives above and set by the Ministry of Agriculture and Forestry of Finland were followed. In all cases, injured horses were treated with appropriate medicine and care when necessary.
The health, body condition score (BCS, scale 1–9) [36], body weight (BW) and two body measurements (heart girth circumference, HG; waist circumference, WC) of the 20 research horses were recorded in Ypäjä semi-natural pasture. Horses were weighed with an electric animal scale (Raute Weighing Ltd., Lahti, Finland) four times (the beginning of the study, August, September, October). The BCS was monitored simultaneously with the weighing. The HG and WC were measured with a measuring tape three times (the beginning of the study, September, October). Monitoring and weighing were done by experienced personnel of the research institute.
To establish whether the available pasture herbage can fulfil the needs of those horse categories that are usually grazing on semi-natural pasturelands (i.e., young horses, lactating mares and sedentary horses), we compared (not statistically) the feed values in each study area to recommended values [37,38]. Also, we compared (not statistically) the approximated nutrient intakes to the needs of the horses [37,38,39] using the feed analysis and feeding value data and assuming pasture dry matter intake (DMI) of 2.2% of the body weight based on NRC-2007 [37] and Chavez et al. [40]. We took the body measures (BW, BCS, HG, WC) and health records from the horses to be used as descriptive data only to follow their welfare status and we did not test their possible changes during the study period statistically.

2.4. Vegetation Survey

We conducted three rounds of vegetation survey in Ypäjä and Savijärvi study areas (the beginning of June, when grazing started, mid-July, and at the end of September, when grazing just ended) and one mid-season survey (in the middle of July) in Särkisaari study area. At each study area, we placed sampling squares of 1 m2 at regular intervals in study area sections with regular horse grazing with an approximate density of 1.7 squares per hectare (44 in Ypäjä, 33 in Savijärvi, 9 in Särkisaari). These were not in the same spots from where samples for feed values were taken. Botanic samples were close to the spots of feed sampling to represent the same vegetation character. We marked the position of each square with sticks and recorded their positions by GPS coordinates at the first round. We measured relative covers of vascular plant species, of litter, and of bare ground in the squares as abundance classes: 1 ≤ 0.125%, 2 ≤ 0.5%, 3 ≤ 2%, 4 ≤ 4%, 5 ≤ 8%, 6 ≤ 16%, 7 ≤ 32%, 8 ≤ 64%, 9 > 64% [41]. We identified plants following a handbook for field flora in Finland [42].
For each sample, we grouped vascular plant species into several functional groups. Firstly, we compiled a list of species that are known to be eaten by horses and a list of species that are avoided based on literature [30,43] and own observations. The number of species in the first group indicates the range of dietary choice. There are several species in this group (e.g., Anthriscus sylvestris, Deschampsia cespitosa, Filipendula ulmaria, Rubus idaeus; Supplementary Materials Table S1), which horses eat only in small quantities and at particular growth stages. These and the avoided species together, make up the species that horses do not control effectively. Secondly, we extracted a smaller list of species that are preferred by horses and consumed in considerable amounts (mainly Gramineae, Fabaceae; Supplementary Materials Table S1) and calculated the ratio of their combined cover to the total vegetation cover (preferred ratio). Finally, we listed species identified as positive and negative indicators for semi-natural grasslands in southern Finland (i.e., indicating nature values; [44], Supplementary Materials Table S1).

2.5. Pasture Structure

We surveyed the whole pasture areas using a method of digital photography, also in summer 2012, concurrent with the botanic surveys. The use of the digital imaging method for sampling vegetation cover provides a repeatable, minimally disruptive, and non-subjective method for estimating percent ground cover with estimates of classification accuracy [45]. Fieldwork is performed quickly, which allows its easy incorporation into other fieldwork tasks. We took the photographs using a camera attached to the stick from a constant height of 1.5 m above the ground at an approximate downward angle of 90°. We set the camera at a fixed zoom, infinite focus, and used automatic settings for focus, lighting, and shutter speed for each picture. We placed a 1-m square frame at each spot and focused the camera on its centre. We also measured the vegetation height within the frames by placing a stick in five systematic points within a square and marking the highest point where plants touched the stick with a 10-cm accuracy. We covered each study area in a systematic way with an image taken every 50 m. This yielded 150 pictures for Ypäjä, 33 for Särkisaari, and 75 pictures for Savijärvi from all rounds.
In order to estimate the relative area that is not efficiently grazed by horses, we visually estimated the number of images that had more than half of vegetation cover under species not controlled by horses (as above). To characterize the vegetation structure, we imported digital images into eCognition as JPEG files (2160 × 1440) and applied an object-based image analysis (for details, see [46]). We cut out a standard area within a 1-m frame. Then, we segmented each image with a scale parameter of 25 and based 20% on color and 80% on shape, and shape as 90% smoothness and 10% compactness of the segments. The choice of the parameters was tested according to Kankaanpää [46] for the best groupings of pixels (segments) in separating the types of vegetation of interest. We estimated the relative covers (in percentages) for such vegetation classes as bare ground, dung, grasses, forbs, and litter (dead on-ground and senescent standing vegetation). The classes were defined based on 90–120 sampled segments per vegetation class in each image for a total of 450–600 samples per image. On about 15% of the images, there were small portions of odd objects (such as the camera pole). We visually identified their boundaries, separated them into a new category, and adjusted the final cover estimates by recalculating the percentages for the reduced total image area.

2.6. Statistical Analysis

We used three analysis methods: regression estimation and linear modelling for testing temporal patterns and differences among the study areas in species numbers and structural characteristics, multivariate ordination methods for species composition, and structural characteristic analyses. We applied the statistical software packages R 3.0.2 [47] and IBM SPSS Statistics 24.
To examine feed values of pasture types during the pasturing season in the boreal conditions (objective 1), we analyzed the temporal patterns in the feed values of Ypäjä and Savijärvi study areas using the curve estimation procedure in IBM SPSS Statistics 24. We fitted four types of regression models that were plausible in describing the temporal change in forage feeding values: linear, logarithmic, inverse and quadratic. We report the best fitting function from the curve estimation procedure. We modeled such feed parameters as CP, ME, TS, NDF, D-value and key minerals of Ca, Cu, Fe, K, Mg, Mn, Na, P, and Zn. The data from Särkisaari originates from only one sampling round.
To include biological values on pasture types managed exclusively with horses (objective 2), we analysed the difference in vegetation diversity and composition among the study pastures using 1 m square as a sample (and a statistical unit). We fitted generalized linear models (GLM) for data from the mid-season visit (conducted in all three study areas) with the study area as a fixed factor [48]. We used six response variables: total number of vascular plant species and number of species potentially eaten by horses (hereafter eaten; Poisson error structure), ratio of the preferred species’ combined cover to the total vegetation cover (hereafter preferred ratio; binomial error), cover of species avoided by horses, cover of positive indicator species and cover of negative indicator species (all linear models with log-transformed response variables). We checked the residual plots to confirm the choice of error family [46].
We compared the species composition in 1-m squares among the study areas by using Nonmetric Multidimensional Scaling (NMDS) in RStudio with Vegan-package [49]. To test the strength of differences among the study areas, we ran Permutational multivariate analysis of variance (PERMANOVA) [50].
Finally, to identify differences in the vegetation structure among the pasture types and its temporal change (objective 3), we compared structural characteristics among the case pastures and study visits using digital images as samples. Since several of the structural characteristics derived from the digital images were strongly intercorrelated, we first reduced the variation over variables into a restricted set of gradients by running the principle component analysis (PCA). We then checked for the separation of the study areas in the multivariate space and tested the differences in loadings on two main gradients between the three study areas (GLM with Gaussian error and study area as a fixed factor), and for Ypäjä and Savijärvi also between three visits (GLM with the sampling round as a fixed factor). In cases with severe overdispersion, we used non-parametric testing (Median test). We did not test statistically the differences in the feed values between the three study pastures due to particularly low and unbalanced sample sizes.

3. Results

3.1. Feed Values and Estimated Intakes

The average feed values and nutrient content varied among the three study areas and within them (Table 2). Three of these, Ca and Zn concentrations, and the Ca-to-P ratio, were numerically largest in Ypäjä (Table 2).
There were several significant changes in the vegetation nutrient content as the grazing season progressed in the study areas of Ypäjä and Savijärvi (Table 3). In Ypäjä, the average CP and NDF increased, while D-values, ME and TS contents decreased. The mean NDF was at its lowest (424 g/kg DM) and D-value at its highest (730 g/kg DM) at the beginning of the study period. Both had their highest (531 g/kg DM) and lowest (638 g/kg DM) values, respectively, at the end of the season. The mean CP achieved its highest value (199 g/kg DM) at the end of the season and was at its lowest (140 g/kg DM) in mid-June. The sugar content (TS) was highest at the beginning of the season and declined gradually toward the end of it (from 221 to 83 g/kg DM). The rate of change somewhat varied: for example, the best fitting function for CP and NDF was inverse. The steep increase by week 28 (mid-July) slowed down by the end of September. The pattern was partly due to a large variance in mean values at the end of the season. The best fit for TS content and D-value was quadratic function with negative estimates: the values declined rapidly and stabilized by week 28 (mid-July). Concerning the mineral contents, Fe, Mn and P increased when the grazing season progressed. The Zn content was low (<38 mg/kg DM) except in mid-September (42 mg/kg DM). Also, the Cu content was low (<7 mg/kg DM). There were no significant trends in the changes of Zn and Cu concentrations. The Ca-to-P–ratio ranged between 1.2 and 2.2, having the season average of 1.7.
In Savijärvi permanent pasture, the average ME, D-value and TS content decreased over the course of the grazing season. The changes in the mean NDF content and D-value were non-significant though the pattern of the change was similar to that in Ypäjä; the NDF was at its lowest (467 g/kg DM) and the D-value at its highest (750 g/kg DM) at the beginning of the season, and at their highest (557 g/kg DM) and lowest (630 g/kg DM), respectively, at the end of the grazing season. CP had its highest value at the beginning of the season (140 g/kg DM), and was at its lowest in mid-summer and at the beginning of the season (97 and 98 g/kg DM, respectively). TS content declined rapidly from its initial value (217 g/kg DM) to its lowest value (109 g/kg DM) before stabilizing in mid-July. Both Cu and Zn contents were relatively low (Table 2), and their temporal changes were non-significant at both sites. The mean Ca and P contents were both relatively high (Table 2).
The ME values of the vegetation in the study areas were 60% to 25% higher than the recommended values for forages to horses, depending on the horse category [37,38], and may result in larger estimated energy intakes than recommended, i.e., energy overfeeding, in all horse categories [36,37,38]. The CP content in Ypäjä semi-natural pasture was higher than recommended during the whole season. In Savijärvi permanent pasture, the estimated CP intake was below the needs of lactating mares and growing young horses. The estimated Ca content in both study areas was higher than needed by all horse categories concerned, resulting in sufficient estimated intakes. The estimated P intake was higher than recommended, meaning a possible P overdosing and resulting in an impaired diet Ca-to-P ratio in all horse categories, except sedentary horses. Even the maximum level of the ratio was below sufficient levels (>2.0) for growing horses and lactating mares. Concerning both study areas, the Cu concentration was about 30–40% under the recommended level, and Zn concentration was also somewhat lower than recommended. The K, Mg, Mn, Fe levels and their estimated intakes were above recommended levels, but the estimated intake of Na from the study areas was too low compared to the needs.

3.2. Animal Health and Wellbeing

Some minor detrimental effects and negative health or welfare issues were observed in horses only in the Ypäjä study area, the most typical being small scratches on the body and head (in 12 horses out of 20), obviously from branches of trees and bushes, and insect bites causing allergic reactions on the skin, hair, tail and head in two horses. No severe wounds were detected. Five horses had slight eye inflammation during the study period, which were possibly due to flies. No digestive disturbances existed. Based on routine observations by the personnel responsible for the management of the horses and pastures, the horses in the other two research sites maintained their health status without any severe welfare issues.
The mean BW, HG and WC increased somewhat during the season (Table 4). The BCS of the horses increased rapidly over the course of the grazing season (June–August) but declined at the end of the grazing period (September–October). As a detail, individuals that had the lowest initial BCS (3.5–4.5; thin/moderately thin, n = 3), gained weight quickly to reach the BCS of 5.5–6.0 (moderately fleshy), where it remained for the rest of the season. Those horses also increased their BW, HG and WC. In contrast, the horse with the largest initial BCS (7.0; fleshy), experienced a decline to 6.0. At the same time, its BW increased from 604 to 633 kg, but HG and WC did not change.

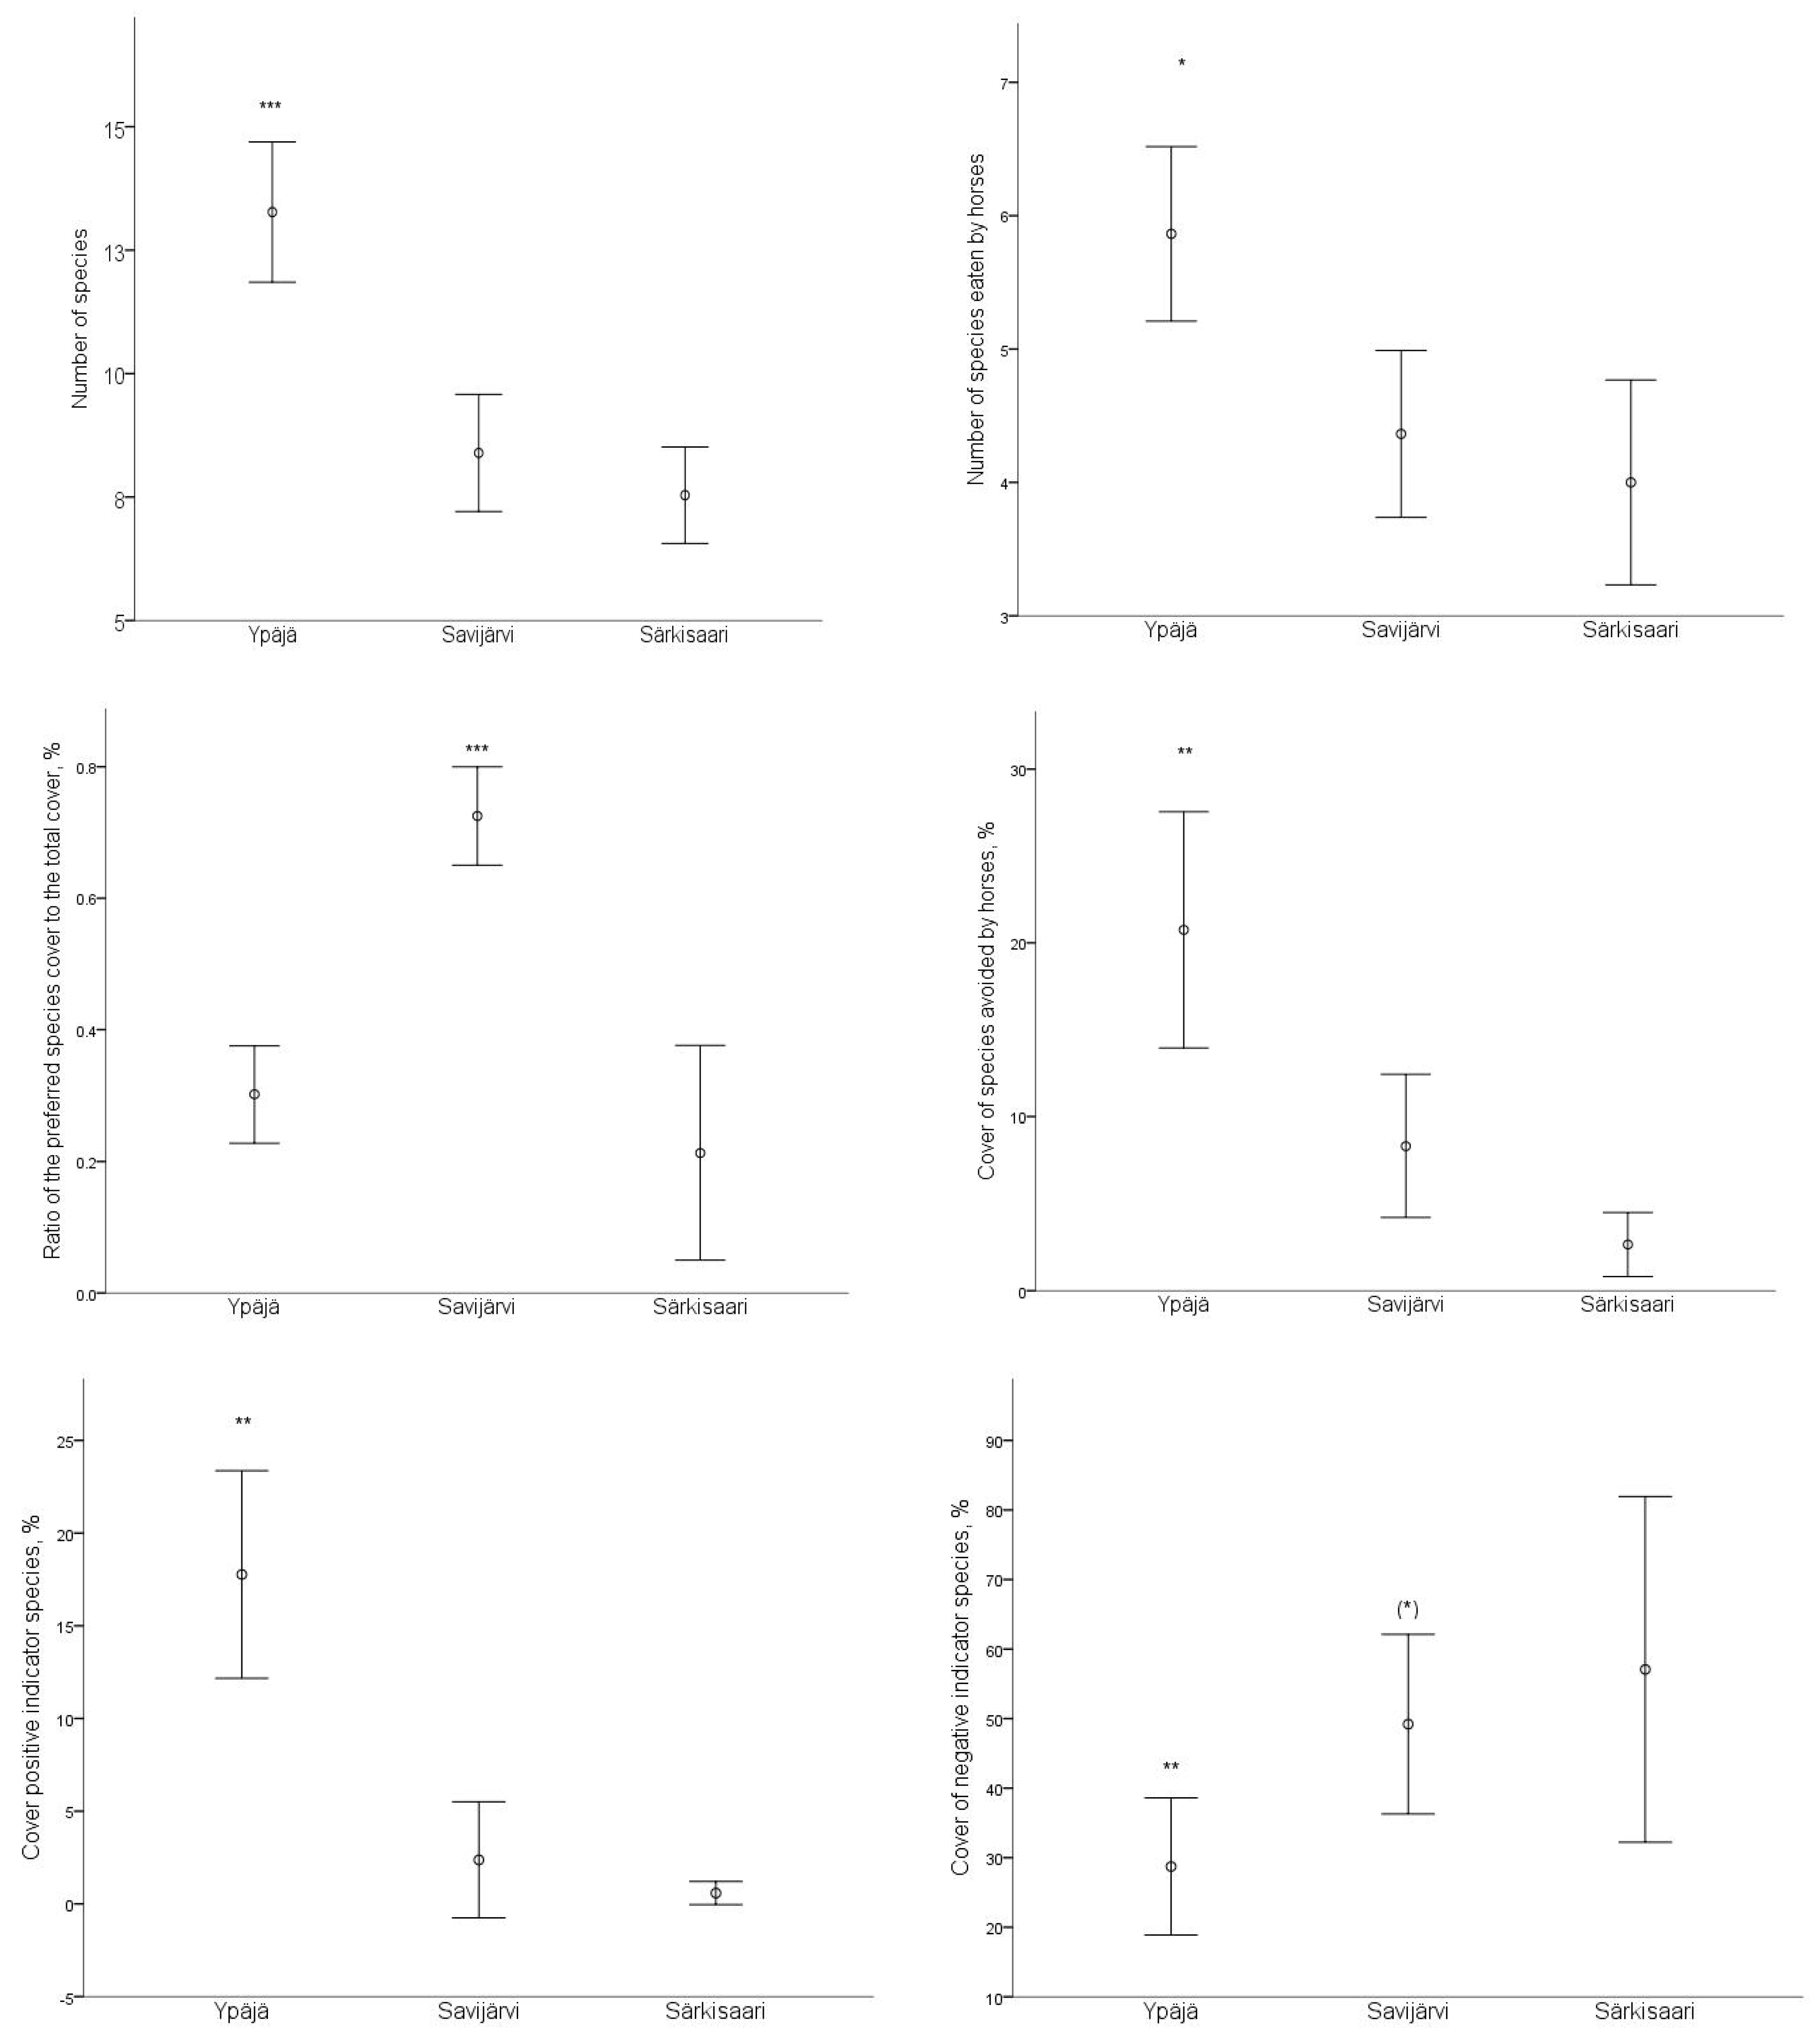
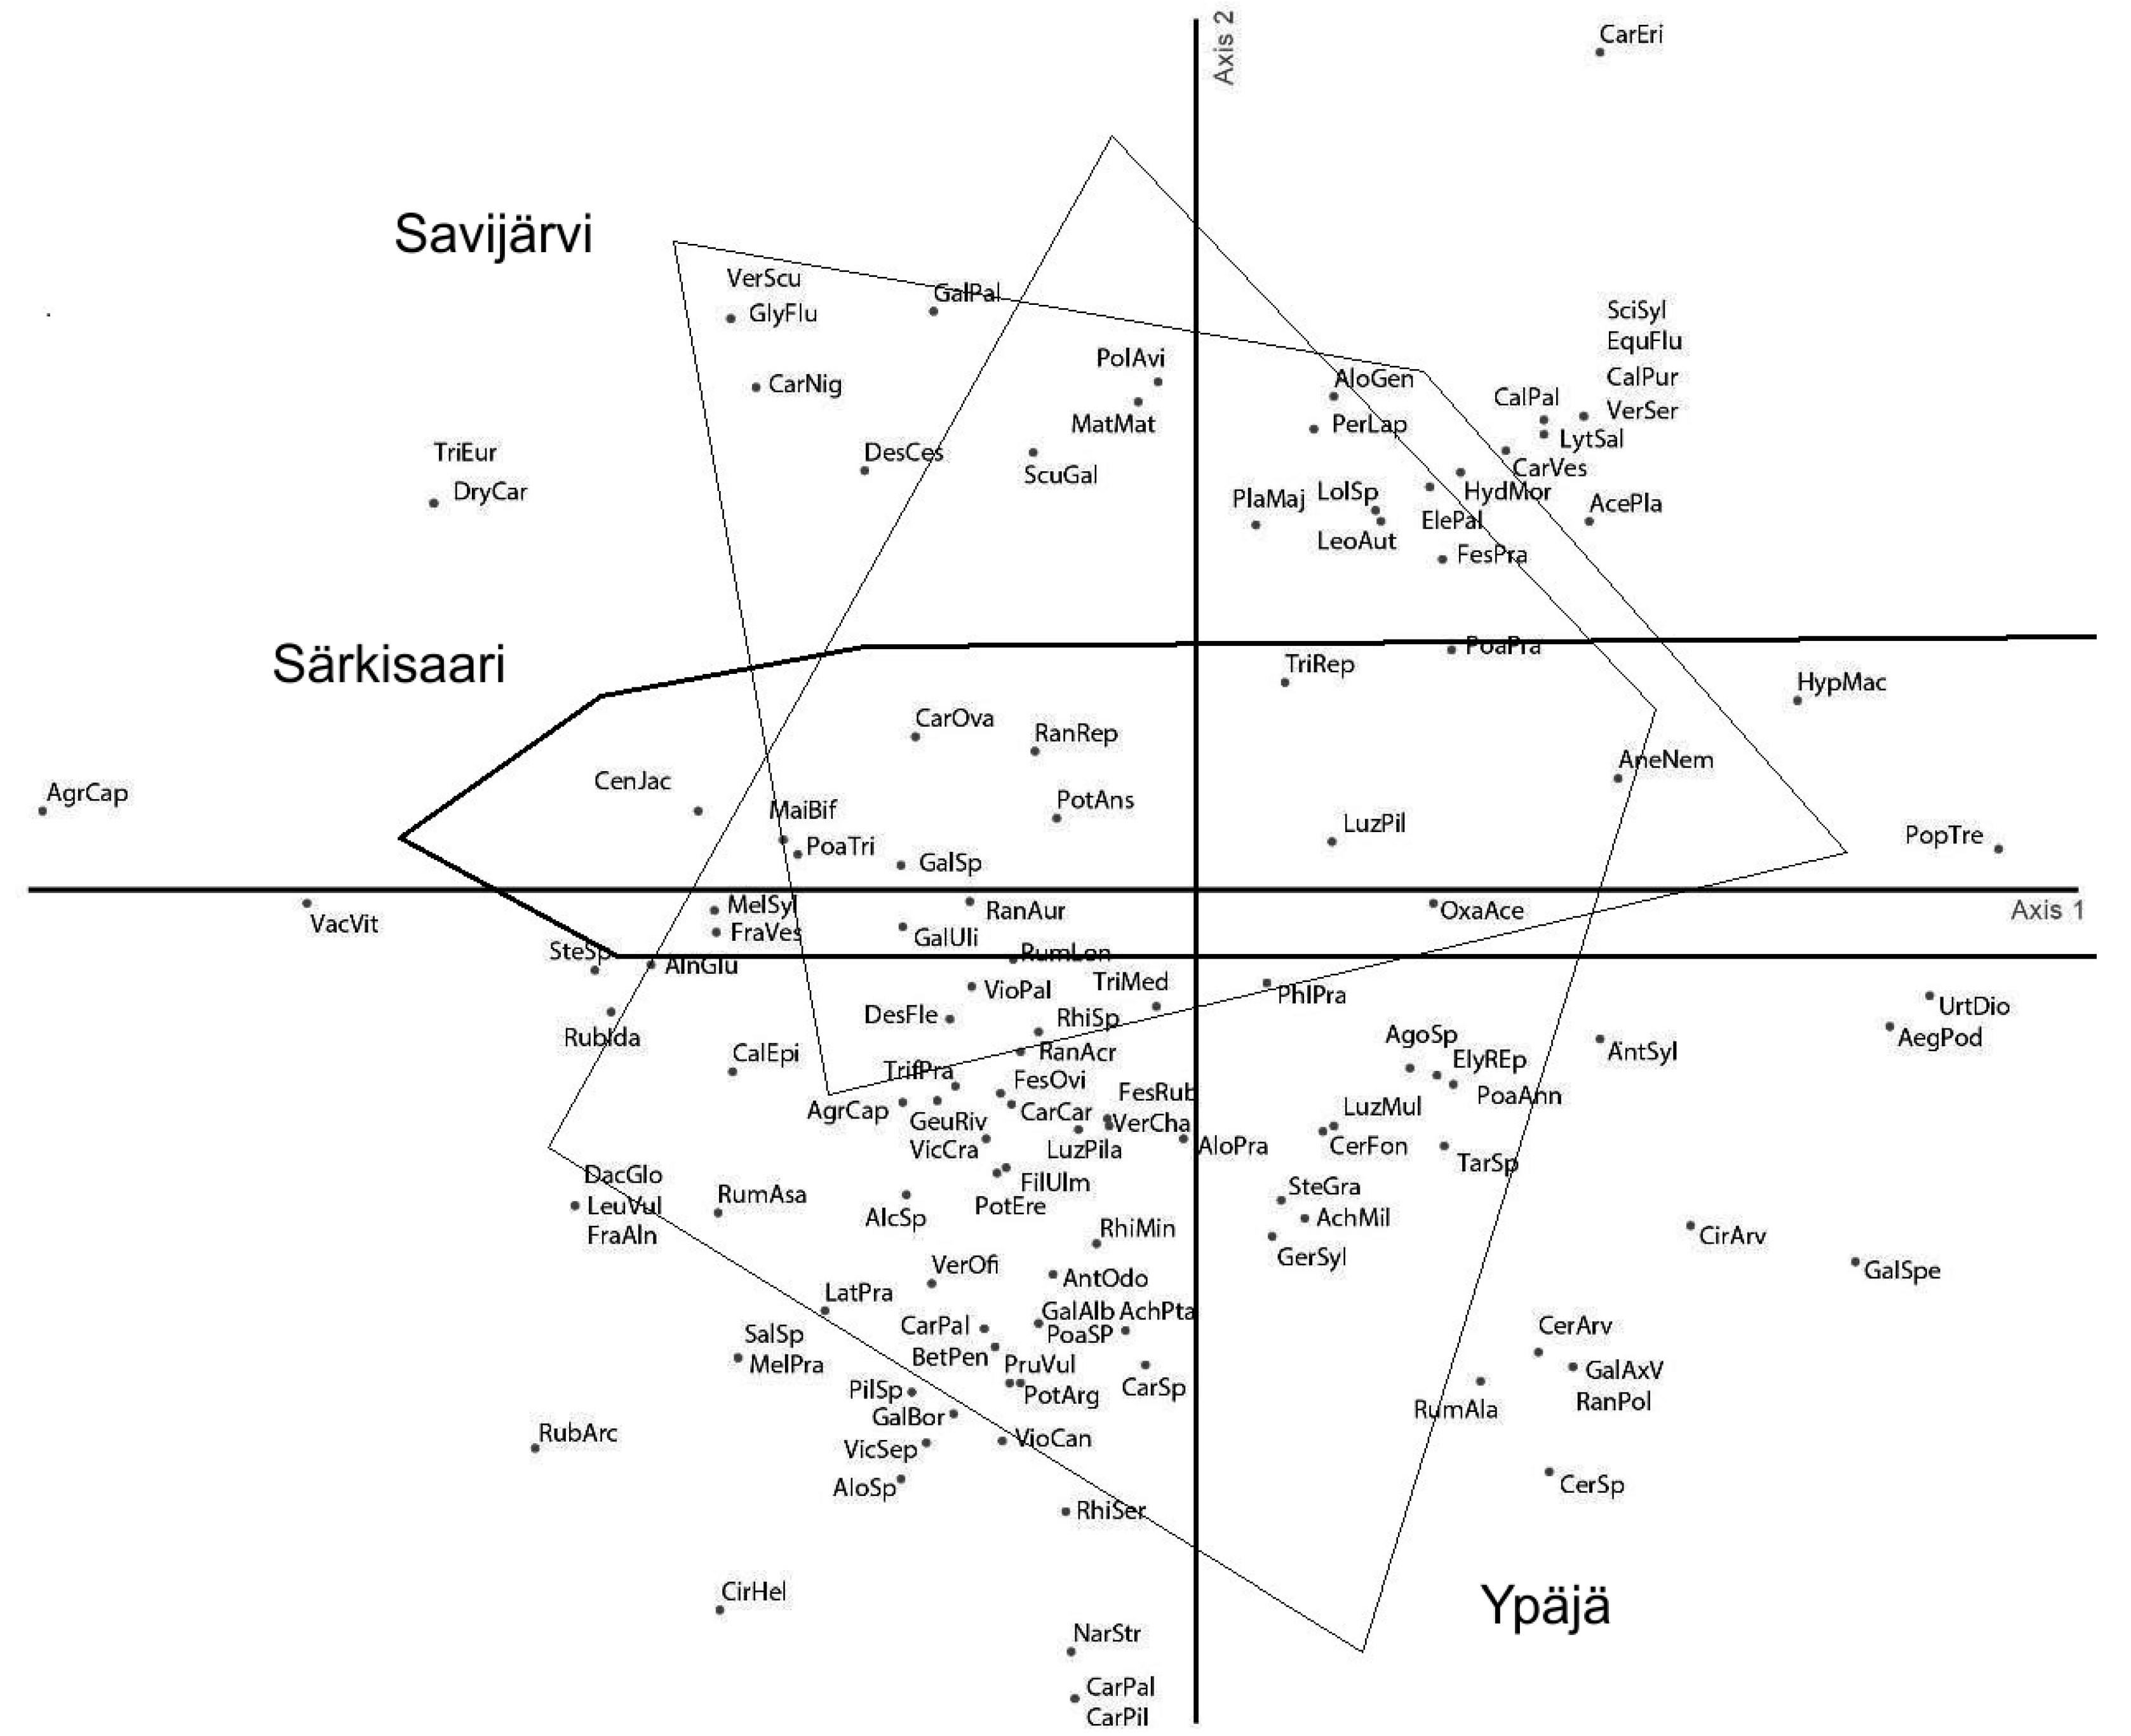
3.3. Community Diversity and Composition of Vascular Plants

The total numbers of species registered within sampling squares (i.e., grazed pasture areas) and for complete pasture areas (including marginal areas) were 116 and 155 in Ypäjä, 48 and 121 in Savijärvi, and 40 and 137 in Särkisaari, respectively. Vegetation of the three study areas differed in all aspects studied. Ypäjä semi-natural pasture was characterised as having the significantly highest values for biodiversity metrics: total numbers of species and those eaten by horses, covers of positive indicator species, and the lowest cover of negative indicator species (Figure 1). It also had the significantly highest cover of species avoided by horses, and the ratio of preferred species was lower than that in Savijärvi permanent pasture. Savijärvi area was characterised by the significantly higher preferred ratio (Figure 1). The cover of the negative indicator species tended to be lower than that of Särkisaari cultivated island pasture. The other parameters were not significantly different from the respective values in the third research area of Särkisaari. All the studied parameters had the lowest values in Särkisaari, though cover of negative indicator species was significantly higher than in the two other study areas.
We found few significant correlations between the response variables: preferred ratio negatively correlated with covers of avoided species and positive indicator species (Pearson r = −0.298 and −0.350, both p < 0.01) and cover of positive indicator species negatively correlated with that of negative indicators (Pearson r = −0.358 p < 0.001).
The most frequent (over 30% of occurrence) and, at the same time, abundant species (over 8% of cover) that are preferred by horses were Achillea millefolium and Ph. pratense in Ypäjä semi-natural pasture, P. pratensis and Trifolium repens in Savijärvi permanent pasture, and Taraxacum sp., Ph. pratense, Elymus repens and P. pratensis in Särkisaari cultivated island pasture (Supplementary Materials Table S1). In Ypäjä, the highly avoided Ranunculus acris was both frequent and reached a locally high abundance. In the other study areas, species eaten in limited quantities were locally dominant: D. cespitosa in Savijärvi and A. sylvestris and Cirsium arvense in Särkisaari. In Ypäjä and Savijärvi, positive indicator species (Alchemilla spp, Carex nigra and Rumex acetosa) and protected species were registered (Carex panicea, Carex pilulifera, Galium verum and Nardus stricta) (Supplementary Materials Table S1).
The NDMS-ordination (Figure 2) resulted in good configuration of the data (stress value = 0.102). The study areas statistically differed in species composition (F = 7.962 p < 0.001) according to the PERMANOVA test, though the model’s explanatory power was not high (r = 0.155). Species composition in Särkisaari cultivated island pasture was intermediate between the other two study areas.

3.4. Structure of the Pasture

The percentage of photos with a predominance of species not controlled by horses was 14% in Ypäjä, 9% in Särkisaari and 17% in Savijärvi. The PCA on the data obtained from the digital photographs resulted in four components, which explained 86% of the variance. The first gradient was from the predominance of grass in vegetation to that of dicotyledonous plants, the second from the presence of litter in the swards to vegetation height, the third to the presence of dung, and the fourth to the amount of bare ground (Table 5). The study areas did not separate in the multivariate space based on the structural characteristics, and the study area factor was not significant (p > 0.1).
The only significant difference in PCA loadings was for the third gradient (GLM, p = 0.002), indicating a higher amount of dung in Ypäjä semi-natural than in Savijärvi permanent pasture. The variation in vegetation heights and litter abundance was particularly high in Ypäjä area. No severe trampling, except locally around the drinking spots or pasture gates, was found in the study area.
Based on the analysis of the digital photographs across the three visits, there were significant differences in the first (covers of grasses) and third gradients (amount of dung). Both increased from the first examination visit to the third (GLM, p = 0.009 and p = 0.03). The horses reduced the cover of grasses (Median test, p = 0.008) and the cover of eaten species (Median test, p = 0.056). There was no significant difference in the cover of avoided species (Median test, p = 0.456), which decreased similarly in both study areas by the end of the grazing season.

4. Discussion

4.1. Nutrient Intakes and Animal Wellbeing

The results confirm that forage from boreal permanent and semi-natural pastures is of sufficient nutritional quality for many horse categories (young horses, lactating mares, sedentary horses). The composition and feed values (ME, CP, NDF, TS) of the grassland vegetation obtained in this study corresponded to those reported for cultivated pastures in Finland [35,51] and in neighboring Sweden [52] and Estonia [53]. The feed values of pasture vegetation fluctuate during the growth period due to the physiological stage of vegetation, weather conditions and soil fertility [51,54]. The feed values of the vegetation in the present study decreased during the summer but stabilized or even improved in early autumn, which is similar to a previously reported pattern on natural pastures in Finland [55]. Lifvendahl [52] reported rapidly declining feed values for D. cespitosa on semi-natural pastures in Sweden as the season progressed but improved quality to the end of the season, and they were comparable to those of cultivated pastures in the late season. In this study, the semi-natural pastures had lower CP than that on the cultivated field pastures [35], but the level was sufficiently high for all horse categories. Increased NDF during maturation of the vegetation in the course of the grazing season resulted in decreased digestibility, meaning also lower energy content, as indicated by D-values of the vegetation. Higher CP contents at the end of the season compared to early-season values might be due to the re-growth of the vegetation or due to mobilization of N from old plants and faeces and urine of the horses.
The feed values in this study were analyzed by the NIR method. This may cause bias in the values compared to wet chemical analysis, the bias depending on the reference material applied in calibration of the method. According to Davies et al. [56], NIR may under-predict CP contents in silages, but no effect on NDF was found. Concerning semi-natural pastures, the reference data are smaller than for silages, causing slightly biased estimates of the feed values, and consequently, also of the estimated nutrient intakes.
The concentrations of most minerals in all study pastures were within the normal ranges and offered sufficient amounts of the minerals for meeting horses’ nutritional needs [35,36]. The Ca-to-P ratios in Savijärvi and Särkisaari pastures were lower than recommended and may not guarantee healthy bone formation of young horses. Therefore, these horse categories need daily Ca supplementation on the cultivated and intensively managed pastures. The semi-natural grassland in Ypäjä had a more balanced ratio. The rather high P content in Särkisaari might be due to inorganic P-fertilization, and due to the bone-meal used as a fertilizer in Savijärvi. The low Cu and Zn (critical for the bone structure) intakes need to be compensated, too, with supplementation to ensure healthy bone formation [37,39]. The K content was typically high in forages [35], and can negatively affect anion–cation and fluid balances in the horses [57].
The value of pasture depends on both nutritional value and availability of the grass. The cultivated pastures often yield more biomass than semi-natural pastures, especially if the latter survived intensification on the least productive soils [58]. For example, in a study in Sweden, the seasonal yield of semi-natural pastures may be only 1134 (dry type) or 2575 (mesic type) kg dry matter [59]. The amount of herbage mass is likely to be sufficient on all studied pastures, including that of semi-natural type in Ypäjä pasture, as indicated by the BCS, and body and weight measures of the horses. Optimizing the number of horses (stocking rate) for each year is challenging, especially on pastures with diverse vegetation types (semi-natural grasslands). Estimating grazer carrying capacity in advance is impossible, because horses apply selection-specific grazing based not only on local foraging values but also on weather, time of the day, insect amounts and other stochastic factors [32].
Grazing on semi-natural pastures is usually recommended for animals with low energy needs [53]. However, our results confirm that the forage nutritional quality and estimated energy and protein intakes on all pasture types supported also the needs of lactating mares that require more energy and protein than growing and sedentary horses, but maybe not the needs of adult horses (Standardbred trotters) in training as reported by Jansson [60]. On the other hand, fluctuation in the quality and amount of the vegetation on semi-natural pastures may lead to overfeeding of horses with low physical activity such as horses included in this study.
We applied pasture dry matter intake of 2.2% BW [37,40], which can be considered a proper estimate (variation between 1.4 and 3.3%) [61,62]. Horses can maintain their intakes when the height of vegetation ranges between 6 and 17 cm [62], which is the average height maintained in this study. However, the pasture dry matter intakes can be much higher, even 3 to 5% of BW [62,63]. Thus, depending on the time of the grazing season, the energy needs of the horse may be exceeded at least by 2-fold and, thus, may cause obesity.
Although the intakes presented in this study are estimates, they are in agreement with the calculated nutrient intakes of Longland et al. [63,64] during the season. They found the lowest intakes in mid-summer because of the lower nutrient content of summer pasture compared to spring and late summer/autumn pastures [63,64].
The real nutrient intakes of the horses depend also on the species they eat, because of the differences in the chemical composition and feed values among them. Horses select the most palatable species (e.g., Ph. pratense) and take only small amounts of others [65]. They can select plants of high protein content and graze mostly on areas with the best nutrient value and quality [25,28,66], such as younger and leafy stage vegetation with lower NDF content. By discarding plant species that are known to be avoided by horses in Finland, we approximated the nutrient intake from a diverse vegetation sward.
Dry matter intake also increases with herbal mass of the pasture [67], which is at its largest in cool-season grasses during the summer months [29]. However, performance of the horses is affected by the botanical composition and nutritional value rather than the mass [24,66]. Fleurance et al. [32] concluded that horses maximize the digestible organic matter intake on pastures with a wide range of sward heights.
Only minor negative health and welfare effects were observed in the horses in Ypäjä. The BW and BCS changes reflected the ME intake and availability of feed from the pasture during grazing, and agree with previous results for the same breed but in leaner body condition and grazing on the same pastures [68]. The measure of waist circumference (WC) (belly girth), was taken as a more sensitive indicator of short-term seasonal changes on body fat [69,70]. The good ME value of the available vegetation led to increased BW, WC, HG and BCS at the beginning of the grazing, but declines in the amount of available feed and increased NDF (resulting in lower digestibility and ME value; [71]) resulted in decreased BW and BCS in autumn. The observations are in congruence also with Giles et al. [69]; BCS started to increase when pasture quality was the greatest and declined thereafter, and lean horses had greater seasonal score changes (increase/decrease) compared to obese horses. They concluded this to be due to decreased intake in obese horses [69]. Excessive energy intake can lead to obesity and related problems, such as insulin resistance and laminitis [37], however, no such health problems were observed.
The allergic reaction observed here (summer eczema) is associated with biting insects, especially species of Culicoides. Some horses are more sensitive than others to the insects [72] and this has to be considered when planning grazing. Summer eczema may be an increasing problem in Finnhorses (the breed grazed in Ypäjä), as an increased number of cases have been seen during the 2000s [73,74]. Insect bites was a challenge most frequently mentioned by horse owners in Finland [75]. The low number of injuries on all study pastures might be due to the good group hierarchy (the horses knew each other) and a possibility to avoid conflicts due to the large area and good availability of feed.
Grazing by corresponding to the natural way of living and eating prevents health problems in horses [19,20]. Horse owners are usually aware of this and state that positive health effects related to free exercise and foraging behavior are the major reasons for turning horses out to pasture [75]. Some plants may also have additional health effects: for example, tannins in legumes can reduce intestinal parasite attacks, thus maintaining the digestion capacity and reducing the need for synthetic medical products [3].

4.2. Impacts on Vegetation Diversity and Composition, and Pasture Structure

The results confirm that grazing by horses supports high biological values of vegetation mainly on pastures with long-term vegetation cover (permanent pastures) and minimized corrective management (semi-natural grasslands) [76,77]. Once the pasture is converted into a cultivated grassland, its botanical values become low, as demonstrated here by low diversity metrics, absence of positive indicator species and high negative indicator species cover in Särkisaari.
All study pastures had patches dominated by species that are either avoided by horses (Ranunculus. repens) or consumed in small amounts (D. cespitosa and A. sylvestris). This contributed to a pasture-specific mosaic structure. We found no evidence in Finland that horses may present a threat to rare plants (vf. New Zealand [78]). A total of 130 herbaceous species were identified in Ypäjä study area in 1995 [79], which is comparable with 135 species in this study in 2012. The only rare species registered previously but not in this survey was Botrychium multifidum, which is not known to be selected by horses. We did not observe instances of severe damage of horses to trees, nor did the pasture owners report such damage. However, we had no data to allow detection of the horse trampling of possible ancient remains of semi-natural communities. Instead of continuous grazing, alternative grazing regimes (late grazing, years without grazing, mowing) may be beneficial to biodiversity [80].
The grazed areas of pastures were structurally similar among the pasture types, which may reflect generally adequate grazing pressure optimized for each pasture. However, the variation in vegetation heights and litter abundance was particularly high in the semi-natural pasture of Ypäjä. The selective pattern of grazing by horses is known to lead to a mosaic structure of pastures due to close grazing on most suitable sites and concomitant avoidance of some other areas by horses creates heterogeneous vegetation [26], which is likely to contribute to high diversity of other taxa, such as invertebrates and birds [78,81]. However, the patterns will only persist if no additional management to prevent structural and compositional diversification is carried out. Out of three types of pastures studied here, there was no corrective management on the semi-natural pasture in Ypäjä due to its Natura 2000 status. Because of this and the initially biologically diverse floristic composition, the semi-natural pasture stands apart from the other cases: the average species number per 1 m2 was almost double that in the other two study areas. The vegetation within each parcel was also the most heterogeneous, which confirms the results of Fleurance et al. [26]. It also had most litter in the sward, which is characteristic for extensive grazing [45].
On pastures managed for the primary objective of high feed quantity for horses, corrective management such as mowing of rejection spots, additional seeding, and re-establishment of the sward, kept simplified vegetation at local and whole pasture levels. However, this management strategy also presents its own challenges. Management should be sufficiently regular to prevent spread of arable weeds on disturbed patches and of nutritive plants on rejected ones. Otherwise, as was the case on the island pasture (Särkisaari), about 15% of the area was rejected by horses. Another corrective management was mechanical spreading of dung heaps in Savijärvi permanent pasture, which may explain the observed difference in dung amount. In Ypäjä, the amount of dung increased as the grazing season progressed. This is likely to benefit an important functional group of dung beetles, of which 53% of the species in Finland are presently endangered [82].

4.3. Synergies and Trade-Offs between the Fodder and Biodiversity Values

Our results point to a number of synergies between managing pastures for horse welfare and for biological values. First, all three pasture types performed similarly in respect to quality of feed regarded as sufficient for most horse categories in light use. The semi-natural pasture had two beneficial features: the best Ca-to-P ratio and a wide dietary range of foraging species. Though highly selective grazers, horses are known to consume a wide range of species. Slivinska and Kopij [83] observed horses consuming 52 species, that is 43% of the plant species recorded in the pasture. Horses can modify their foraging behavior in response to the availability of the plant species, and the feeding preferences vary during the season [83,84]. Horses are known to select medicinal plants and to avoid poisonous plants as long as the latter are fresh [83]. Houpt et al. [85] also reported that horses can learn to avoid feeds that make them ill. The benefit of dietary range to horse well-being seems to remain underappreciated by horse owners. In the horse owner interviews run concurrently with this study, respondents were mostly worried about occurrence of “weeds” on horse pastures [75]. Only a few respondents reported observation of their horses picking up unusual plant species depending on their state (for example, after stress of a competition). To improve tolerance of pasture owners for native unsown species, pasture monitoring by owners could include recognition of plant species that, on the one hand, are characteristic of semi-natural vegetation and, on the other hand, are easily recognizable (such as Dianthus deltoides, Campanula species, Leucanthemum vulgare, Vicia cracca/sepium).
The largest trade-off resides largely in the fact that the local cover of plants preferred by horses may negatively relate to the cover of species, indicating botanically rich grassland. In pastures under additional management, more than half of the species were found outside the areas mainly grazed by horses, such as at stone heaps, ditches, woodlots and wet areas.
Another trade-off commonly reported for low-input systems is an agronomic constraint in animals with high energy requirements, for example racing horses [60] and dairy cows [86]. Finally, the results indicate a challenge of using horses for pasture management that is specific to boreal conditions. With the high intake capacity for roughages, horses effectively control competitive grasses [26], but may not be able to contain rapid forest regeneration (starting with Betula spp, Rubus idaeus, Salix spp, as detected on a high proportion of images for Ypäjä). Preferences of horses for already open pasture areas and low consumption of scrub leads to overgrowth of the boreal pastures managed exclusively by horses [21,87]. On permanent pastures with naturally high water tables, horses may be unsuitable grazers for suppression of dominant species such as D. cespitosa [88], as was the case in Savijärvi.

5. Conclusions and Implications to Management

This study is based on data from only one year and three pasture cases. This considerably limits the applicability of the conclusions below to other pasture types or other grazing animals and their generalizability. To minimize year-to-year differences, studies lasting several consecutive grazing seasons are needed. However, this study indicates that horses are suitable for grazing semi-natural pastures. A growing number of leisure horses enables horse grazing to be a promising way to preserve grasslands’ biological values, especially in the regions lacking livestock. In particular, semi-natural pastures having a considerably higher biological value than intensively managed permanent and regularly re-seeded pastures, and facing abandonment, should be targeted.
The results also provide a clear indication of the suitability of these pasture types to horses. Only mineral supplementation with some trace minerals may be needed to ensure the dietary needs. Semi-natural grassland with species-rich vegetation provides a wide dietary choice for horses, but this should be more widely recognized by horse owners.
There is, however, a trade-off between the plant diversity and forage amount. Extensive grazing with horses that allows development of species-rich swards is feasible in situations, where the pasture availability is not limited. On pastures where high stocking density is unavoidable, retention of unmanaged refuge areas (margins and corners especially on dry areas) can be a solution for increasing overall pasture diversity. Long-term grazing with only horses may not be optimal in boreal regions. Mixed stocking or alternate years with different grazers and alternative grazing regimes should be supported for better results.
Our case-based study highlights the need for better measuring of the productivity of semi-natural pastures to optimize their use. Agronomic and conservation benefits of mixed pasturing or continuing grazing to late autumn when horses start to use a wider range of plants and eat more woody material [89] needs further research. Use of native breeds [90] on semi-natural pastures in which they have evolved, also requires more research in order to achieve greater recognition of their potential among horse breeders and owners. Multifunctional use of grazing land reinforces the need for interdisciplinary research so that broader benefits to the society, beyond economic efficiency, are reflected in the use and management of grazing lands.

Supplementary Materials

The following are available online at www.mdpi.com/2073-445X/6/4/69/s1. Table S1. List of species and pseudospecies registered 1-m2 sampling plots.

Acknowledgments

The authors thank the owners of the study areas—Savijärvi Farm/Simonsen family and Häme Horse Breeding Association—for permission to work on their land, and all fieldworkers Heljä Marjamäki, Anna Johanson, Andrea Maier, Hanna Seitapuro and Marjaana Toivonen, and Veikko Hakala caring the Särkisaari pasture and horses there. Traci Birge improved the English of the paper.

Author Contributions

Iryna Herzon, Markku Saastamoinen and Catherine Schreurs designed the experiments, analyzed the data and wrote the paper. Susanna Särkijärvi and Marianna Myllymäki conducted field work and the experiments. All of them also contributed the writing of the paper.

Conflicts of Interest

The authors declare no conflict of interest. The study was a part The InnoEquine project led by MTT Agrifood Research Finland (current Natural Resources Institute Finland, Luke) and carried out in collaboration with University of Helsinki, Swedish University of Agricultural Sciences (SLU) and Latvia’s University of Agriculture. The InnoEquine project was funded by European Union Central Baltic Interreg IVA Programme. The founding organization had no role in the design of the study; in the collection, analyses, or interpretation of data; in the writing of the manuscript, and in the decision to publish the results”.

References

  1. Hopkins, A.; Holz, B. Grassland for agriculture and nature conservation: Production, quality and multi-functionality. Agron. Res. 2006, 4, 3–20. [Google Scholar]
  2. Tälle, M.; Deak, B.; Poshold, P.; Valko, O.; Westerberg, L.; Milberg, P. Grazing vs. mowing: A meta-analysis of biodiversity benefits for grassland management. Agric. Ecosyst. Environ. 2016, 222, 200–212. [Google Scholar] [CrossRef]
  3. Hæggström, C.-A.; Heikkilä, T.; Peiponen, J.; Vuokko, S. Toukohärkä Ja Kultasiipi–Niityt Ja Niiden Hoito; Otava: Keuruu, Finland, 1995. (In Finnish) [Google Scholar]
  4. Hadjigeorgiou, I.; Osoro, K.; Fragoso de Alimeida, J.P.; Molle, G. Southern European grazing lands: Production, environment and landscape management aspects. Livest. Prod. Sci. 2005, 96, 51–59. [Google Scholar] [CrossRef]
  5. Wallis De Vries, M.F. Large herbivores as key factors for nature conservation. In Grazing and Conservation Management; Wallis De Vries, M.F., Bakker, J.P., Van Wieren, S.E., Eds.; Kluwer Academic Publishers: Dordrecht, The Netherlands, 1998; pp. 1–20. [Google Scholar]
  6. Cremene, C.; Groza, G.; Rakosy, L.; Schileyko, A.A.; Baur, A.; Erhardt, A.L. Alterations of steppe-like grasslands in eastern Europe: A threat to regional biodiversity hotspots. Conserv. Biol. 2005, 19, 1606–1618. [Google Scholar] [CrossRef]
  7. Poláková, J.; Tucker, G.; Hart, K.; Rayment, M. Addressing Biodiversity and Habitat Preservation through Measures Applied under Common Agricultural Policy; Report Prepared for DG Agriculture and Rural Development, Contract No. 30-CE-0388497/00-44; Institute for European Environmental Policy: London, UK, 2011. [Google Scholar]
  8. Salonen, J.; Keskitalo, M.; Segerstedt, M. (Eds.) Biodiversity in Farmland; Agrifood Research Finland: Jokioinen, Finland, 2007; (In Finnish, English Summary). [Google Scholar]
  9. Mattson, R. Jordbrukets Utveckling i Sverige; Aktuelt från Lantbruksuniversitetet nr 344; Swedish Agricultural University: Uppsala, Sweden, 1985. (In Swedish) [Google Scholar]
  10. Persson, K. Ängs-Och Betesmarkinvesteringen 2002–2004; Report 2005:1; Swedish Board of Agriculture: Jönköping, Sweden, 2006. (In Swedish)
  11. FAO. Food and Agriculture Data (FAOSTAT). 2010. Available online: http://www.faostat.fao.org (accessed on 5 May 2016).
  12. Equus 2001. The Horse Industry in the European Union, Final Report; Swedish University of Agricultural Scienses, Department of Economics: Skara and Solvalla, Sweden, 2001. [Google Scholar]
  13. Backteman, E. Hästen i Kommunen—Betyder mer än du Tror; Hästnäringens Nationella Stiftelse and Swedish Agricultural University: Stockholm, Sweden, 2008. (In Swedish) [Google Scholar]
  14. Andersson, K.; Eklund, E. Hästsam—Konturer av en ny Hästhushållning; SSKH Skifter; University of Helsinki: Vaasa, Finland, 2011. (In Swedish) [Google Scholar]
  15. Younge, B.; Vial, C. Socio-economic impact of horse production on rural areas: A comparison between Ireland and France. In Forages and Grazing in Horse Nutrition; Saastamoinen, M., Fradinho, M.J., Santos, A.S., Miraglia, N., Eds.; Wageningen Academic Publishers: Wageningen, The Netherlands, 2012; pp. 453–465. [Google Scholar]
  16. Menard, C.; Duncan, P.; Fleurance, G.; Georges, J.Y.; Lila, M. Comparative foraging and nutrition of horses and cattle in European wetlands. J. Appl. Ecol. 2002, 39, 120–133. [Google Scholar] [CrossRef]
  17. Miraglia, N. Equids contribution to sustainable development in rural areas: A new challenge for the third millennium. In Forages and Grazing in Horse Nutrition; Saastamoinen, M., Fradinho, M.J., Santos, A.S., Miraglia, N., Eds.; Wageningen Academic Publishers: Wageningen, The Netherlands, 2012; pp. 439–452. [Google Scholar]
  18. Smith, R.; Cotton, K.; Allman, R.; Watson, R.; Sena, K.; Keene, T. Grazing and pasture management considerations from around world. In Forages and Grazing in Horse Nutrition; Saastamoinen, M., Fradinho, M.J., Santos, A.S., Miraglia, N., Eds.; Wageningen Academic Publishers: Wageningen, The Netherlands, 2012; pp. 197–208. [Google Scholar]
  19. Frape, D. Equine Nutrition and Feeding, 4th ed.; Wiley Blackwell: Oxford, UK, 2010. [Google Scholar]
  20. Duncan, P. Time-budgets of Camargue horses III. Environmental influences. Behaviour 1985, 92, 188–208. [Google Scholar] [CrossRef]
  21. Duncan, P. Horses and Grasses: The Nutritional Ecology of Equids and their Impact on the Camargue; Springer: New York, NY, USA, 1992. [Google Scholar]
  22. Murray, M.J.; Eichorn, E.S. Effects of intermittent feed deprivation, intermittent feed deprivation with ranitidine administration, and stall confinement with ad libitum access to hay on gastric ulceration in horses. Am. J. Vet. Res. 1996, 57, 1599–1603. [Google Scholar] [PubMed]
  23. Archer, M. Further studies on palatability of grasses to horses. J. Br. Grassl. Soc. 1978, 33, 239–243. [Google Scholar] [CrossRef]
  24. Lopez Lopez, C.; Ferreira, L.M.M.; Garcia, U.; Moreno-Gonzalo, J.; Rodrigues, M.A.M.; Osoro, K.; Ferre, I.; Celaya, R. Diet selection and performance of horses grazing on different heathland types. Animal 2017, 11, 1708–1717. [Google Scholar] [CrossRef] [PubMed]
  25. Fleurance, G.; Duncan, P.; Fritz, H.; Cabaret, J.; Cortet, J.; Gordon, I.J. Selection of feeding sites by horses at pasture: Testing the anti-parasite theory. Appl. Anim. Behav. Sci. 2007, 108, 288–301. [Google Scholar] [CrossRef]
  26. Fleurance, G.; Edouard, N.; Collas, C.; Duncan, P.; Farruggia, A.; Baumont, R.; Lecomte, T.; Dumont, B. How do horses graze pastures and affect the diversity of grassland ecosystems? In Forages and Grazing in Horse Nutrition; Saastamoinen, M., Fradinho, M.J., Santos, A.S., Miraglia, N., Eds.; Wageningen Academic Publishers: Wageningen, The Netherlands, 2012; pp. 147–161. [Google Scholar]
  27. Fiorellino, N.M.; McGrath, J.M.; Momen, B.; Kariuki, S.K.; Calkins, M.J.; Burk, A.O. Use of best management practices and pasture and soil quality on Maryland horse farms. J. Equine Vet. Sci. 2013, 34, 1–8. [Google Scholar]
  28. Palmgren Karlsson, C. Hästen som betesdjur. In Hästforskningsrapport 1/2008; Stiftelsen Svensk Hästforskning: Stockholm, Sweden, 2008; pp. 27–29. (In Swedish) [Google Scholar]
  29. Allen, E.; Sheaffer, C.; Martinson, K. Yield and persistence of cool-season grasses under horse grazing. Agron. J. 2012, 104, 1741–1746. [Google Scholar] [CrossRef]
  30. O’Beirne, E. Managing Grass for Horses: The Responsible Owner's Guide; J.A. Allen: London, UK, 2005. [Google Scholar]
  31. Loucougaray, G.; Bonis, A.; Bouzillé, J.B. Effects of grazing by horses and/or cattle on the diversity of coastal grasslands in western France. Biol. Conserv. 2004, 115, 59–70. [Google Scholar] [CrossRef]
  32. Fleurance, G.; Duncan, P.; Fritz, H.; Gordon, I.J.; Grenier-Loustalot, M.-F. Influence of sward structure on daily intake and foraging behavior by horses. Animal 2010, 4, 480–485. [Google Scholar] [CrossRef] [PubMed]
  33. MAFF. Energy Allowances and Feeding Systems for Ruminants; Tecg. Bull 33; Her Majesty’s Stationery Office: London, UK, 1975. [Google Scholar]
  34. MAFF. Animal science 1979. In ADAS Agricultural Science Service, Research and Developments Reports; Reference book 254; Her Majesty’s Stationary Office: London, UK, 1981. [Google Scholar]
  35. Luke Feed Tables and Nutrient Requirements. MTT Agrifood Research Finland. 2015. Available online: http://www.mtt.fi/portal/page/potal/Rehutaulukot/feed_tables_english (accessed on 2 March 2017).
  36. Henneke, D.R.; Potter, G.D.; Kreider, J.L.; Yetes, B.F. Relationship between condition score, physical measurements and body fat percentage in mares. Equine Vet. J. 1983, 15, 371–372. [Google Scholar] [CrossRef] [PubMed]
  37. NRC. Nutrient Requirements of Horses, 6th ed.; National Research Council: Washington, DC, USA, 2007.
  38. Meyer, H. Pferdefütterung, 3rd ed.; Blackwell: Berlin, Germany, 1996. [Google Scholar]
  39. Ellis, A.; Saastamoinen, M. Feeding growing race horses in work. In Nutrition of the Exercising Horse; Saastamoinen, M.T., Martin-Rosset, W., Eds.; Wageningen Academic Publishers: Wageningen, The Netherlands, 2008; pp. 311–331. [Google Scholar]
  40. Chavez, S.J.; Siciliano, P.D.; Huntington, G.B. Intake estimation of horses grazing tall fescue (Lolium arundinaceum) or fed tall fescue hay. J. Anim. Sci. 2014, 92, 2304–2308. [Google Scholar] [CrossRef] [PubMed]
  41. Raatikainen, K.M.; Heikkinen, R.K.; Pykälä, J. Impacts of local and regional factors on vegetation of boreal semi-natural grasslands. Plant Ecol. 2007, 189, 155–173. [Google Scholar] [CrossRef]
  42. Hämet-Ahti, L.; Suominen, J.; Ulvinen, T.; Uotila, P. Retkeilykasvio (Field Flora of Finland), 4th ed.; Finnish Museum of Natural History: Helsinki, Finland, 1998. (In Finnish) [Google Scholar]
  43. Jansson, H.; Jansson, K.H.; Olin, A.; Talikka, T.; Pykälä, J. Development of natural horse pastures in Finland in the 1900’s. In Proceedings of the XVIII International Grassland Congress, Winnipeg, MB, Canada, 8–19 June 1997; pp. 9–10. [Google Scholar]
  44. Pykälä, J. Maintaining Biodiversity through Traditional Animal Husbandry; Finnish Environment Institute: Helsinki, Finland, 2001; (In Finnish, English Summary). [Google Scholar]
  45. Booth, D.T.; Cox, S.E. Image-based monitoring to measure ecological change in rangeland. Front. Ecol. Environ. 2008, 6, 185–190. [Google Scholar] [CrossRef]
  46. Kankaanpää, O. Digital Photographs and Object-Based Image Analysis in Vegetation Surveys. Master’s Thesis, University of Helsinki, Helsinki, Finland, 2003. [Google Scholar]
  47. RStudio Team. RStudio: Integrated Development for R; RStudio, Inc.: Boston, MA, USA, 2015; Available online: http://www.rstudio.com (accessed on 20 December 2016).
  48. Crawley, M.J. Generalized Linear Models. In The R Book, 2nd ed.; John Wiley & Sons: Chichester, UK, 2012. [Google Scholar]
  49. Oksanen, J.; Blanchet, F.G.; Kindt, R.; Legendre, P.; Minchin, P.R.; O’Hara, R.B. Vegan: Community Ecology. 2015. Available online: http://github.com/vegandevs/vegan (accessed on 20 December 2016).
  50. Andersson, M.J. A new method for non-parametric multivariate analysis of variance. Austral Ecol. 2001, 26, 32–46. [Google Scholar]
  51. Särkijärvi, S.; Niemeläinen, O.; Sormunen-Christian, R.; Saastamoinen, M. Changes in chemical composition of different grass species and -mixtures in equine pasture during grazing season. In Forages and Grazing in Horse Nutrition; Saastamoinen, M., Fradinho, M.J., Santos, A.S., Miraglia, N., Eds.; Wageningen Academic Publishers: Wageningen, The Netherlands, 2012; pp. 45–48. [Google Scholar]
  52. Lifvendahl, Z. Fodervärde på Fuktiga Naturbetesmarker–Analyser av Fem Vegetationsbildande Arter; Swedish Agricultural University: Uppsala, Sweden, 2004; (In Swedish, English Summary). [Google Scholar]
  53. Lengyel, Z.A.; Bühle, L.; Donnison, I.; Heinsoo, K.; Wachendorf, M.; Südekum, K.-H. Silage quality of biomass harvested from semi-natural grassland communities. In Proceedings of the XVI International Silage Conference, Hämeenlinna, Finland, 2–4 July 2012; pp. 464–465. [Google Scholar]
  54. Virkajärvi, P.; Saarijärvi, K.; Rinne, M.; Saastamoinen, M. Grass physiology and its relation to nutritive value in feeding horses. In Forages and Grazing in Horse Nutrition; Saastamoinen, M., Fradinho, M.J., Santos, A.S., Miraglia, N., Eds.; Wageningen Academic Publishers: Wageningen, The Netherlands, 2012; pp. 17–43. [Google Scholar]
  55. Sonninen, R.; Järvi, M.; Huuskonen, A.; Kiljala, J. Development of Suckler Cow Grazing on the Strand Meadows in Oulu Area; Agrifood Research Finland MTT: Jokioinen, Finland, 2004; (In Finnish, English Abstract). [Google Scholar]
  56. Davies, D.R.; Davies, G.K.; Morgan, C.T. Silage analysis–comparison of 58 Welsh farm silages analyzed either by traditional wet chemistry or wet NIRs. In Proceedings of the XVI International Silage Conference, Hämeenlinna, Finland, 2–4 July 2012; pp. 270–271. [Google Scholar]
  57. Warren, L.K.; Lawrence, L.M.; Brewster-Barnes, T.; Powell, D.M. The effect of dietary fibre on hydration status after dehydration with frumiside. Equine Vet. J. 1999, 31, 508–513. [Google Scholar] [CrossRef]
  58. Steen, E.; Matzon, C.; Svensson, C. Landskapsvård Med Betesdjur: Betets Avkastning och Djurens Tillväxt på Bete; Aktuelt från Landbrukshögskolan 182; Swedish Agricultural University: Uppsala, Sweden, 1972. (In Swedish) [Google Scholar]
  59. Pelve, M. Cattle Grazing on Semi-Natural Pastures–Animal Behavior and Nutrition, Vegetation Characteristics and Environmental Aspects. Licentiate Thesis, Swedish University of Agricultural Sciences, Uppsala, Sweden, 2010. [Google Scholar]
  60. Jansson, A. Effects of natural pasture on body condition in fit Standardbred geldings. Grassl. Sci. Eur. 2009, 13, 989–991. [Google Scholar]
  61. Dowler, L.E.; Siciliano, P.D.; Pratt-Phillips, S.E.; Poore, M. Determination of pasture dry matter intake rates in different seasons and their application in grazing management. J. Equine Vet. Sci. 2012, 32, 85–92. [Google Scholar] [CrossRef]
  62. Edouard, N.; Fleurance, G.; Dumont, B.; Baumont, R. Does sward height affect feeding patch choice and voluntary intake in horses? Appl. Anim. Behav. Sci. 2009, 119, 219–228. [Google Scholar] [CrossRef]
  63. Longland, A.C.; Ince, J.; Harris, P.A. Estimation of pasture intake by ponies from liveweight change during six weeks at pasture. J. Equine Vet. Sci. 2011, 31, 275–276. [Google Scholar] [CrossRef]
  64. Longland, A.C.; Barfoot, C.; Harris, P.A. The effect of wearing a grazing muzzle vs. not wearing a grazing muzzle on intakes of spring, summer and autumn pastures by ponies. In Forages and Grazing in Horse Nutrition; Saastamoinen, M., Fradinho, M.J., Santos, A.S., Miraglia, N., Eds.; Wageningen Academic Publishers: Wageningen, The Netherlands, 2012; pp. 185–186. [Google Scholar]
  65. Särkijärvi, S.; Niemeläinen, O.; Sormunen-Christian, R.; Saastamoinen, M. Suitability of grass species on equine pasture: Water soluble carbohydrates and grass preferences by horses. In Grassland in Changing World, Proceedings of the 23th General Meeting of the European Grassland Federation, Kiel, Germany, 29 August–2 September 2010; Universität Göttingen: Göttingen, Germany, 2010; pp. 1000–1002. [Google Scholar]
  66. Celaya, R.; Ferreira, L.M.M.; Garcia, U.; Rosa Garcia, R.; Osoro, K. Heavy grazing by horses on heathlands of different botanical composition. In Forages and Grazing in Horse Nutrition; Saastamoinen, M., Fradinho, M.J., Santos, A.S., Miraglia, N., Eds.; Wageningen Academic Publishers: Wageningen, The Netherlands, 2012; pp. 219–226. [Google Scholar]
  67. Fleurance, G.; Duncan, P.; Mallevaud, B. Daily intake and the selection of feeding sites by horses in heterogeneous wet grasslands. Anim. Res. 2001, 50, 149–156. [Google Scholar] [CrossRef]
  68. Särkijärvi, S.; Reilas, T.; Saastamoinen, M.; Elo, K.; Jaakkola, S.; Kokkonen, T. Effect of cultivated or semi-natural pasture on changes in live weight, body condition score, body measurements and fat thickness in grazing Finnhorse mares. In Forages and Grazing in Horse Nutrition; Saastamoinen, M., Fradinho, M.J., Santos, A.S., Miraglia, N., Eds.; Wageningen Academic Publishers: Wageningen, The Netherlands, 2012; pp. 231–234. [Google Scholar]
  69. Giles, S.L.; Rands, S.A.; Nicol, C.J.; Harris, P.A. Obesity prelevance and associated risk factors in outdoor living domestic horses and ponies. PeerJ 2014, 2, e299. [Google Scholar] [CrossRef] [PubMed] [Green Version]
  70. Dugdale, A.H.; Curtis, C.G.; Harris, P.A.; Argo, C.M. Assessment of body fat in the pony: Part 1. Relationship between the anatomical distribution of adipose tissue, body composition and body condition. Equine Vet. J. 2011, 43, 552–561. [Google Scholar] [CrossRef] [PubMed]
  71. Ragnarsson, S.; Lindberg, J.-E. Nutritional value of timothy haylage in Icelandic horses. Livest. Sci. 2008, 113, 202–208. [Google Scholar] [CrossRef]
  72. Schurink, A.; van Grevenhof, E.M.; Ducro, B.J.; van Arendonk, J.A.M. Heritability and repeatability of insect bite hypersensitivity in Dutch Shetland breeding mares. J. Anim. Sci. 2008, 87, 484–490. [Google Scholar] [CrossRef] [PubMed]
  73. Hallamaa, R. Characteristics of equine summer eczema with emphasis on differences between Finnhorses and Icelandic horses in a 11-year study. Acta Vet. Scand. 2009, 51, 29–34. [Google Scholar] [CrossRef] [PubMed]
  74. Hallamaa, R. Phospholipids in Equine Summer Eczema and Its Therapy. Ph.D. Thesis, University of Helsinki, Faculty of Veterinary Medicin, Helsinki, Finland, 2017. [Google Scholar]
  75. Herzon, I.; Saastamoinen, M.T.; Särkijärvi, S.; Myllymäki, M.; Schreus, C. Natural values on semi-natural and permanent pastures grazed by horses. In Book of Abstracts 65th Annual Meeting of the European Federation of Animal Science; EAAP: Copenhagen, Denmark, 2014; p. 79. [Google Scholar]
  76. Soder, K.J.; Rook, A.J.; Sanderson, M.A.; Goslee, S.C. Interaction of plant species diversity on grazing behavior and performance of livestock grazing temperate region pastures. Crop Sci. 2007, 47, 416–425. [Google Scholar] [CrossRef]
  77. Shoji, A.; Hayashi, H.; Kohyama, K.; Sasaki, H. Effects of horse grazing on plant species richness and Abundance of Iris setosa in a boreal semi-natural grassland, Japan. Grassl. Sci. 2011, 57, 1–8. [Google Scholar] [CrossRef]
  78. Rogers, G.M. Kaimanawa feral horses and their environmental impacts. N. Z. J. Ecol. 1991, 15, 49–64. [Google Scholar]
  79. EMAS. Ympäristöselonteko 2007 MTT Ypäjä; Agrifood Research Finland MTT: Jokioinen, Finland, 2007. (In Finnish) [Google Scholar]
  80. Wissman, J. Grazing Regimes and Plant Reproduction in Semi-Natural Grasslands. Ph.D. Thesis, Swedish University of Agricultural Sciences, Uppsala, Sweden, 2006. [Google Scholar]
  81. Hoste-Danylow, A.; Romanowski, J.; Zmihorski, M. Effects of management on invertebrates and birds in extensively used grassland of Poland. Agric. Ecosyst. Environ. 2010, 139, 129–133. [Google Scholar] [CrossRef]
  82. Roslin, T.; Heliövaara, K. Dung Beetles of Finland; Helsinki University Press: Helsinki, Finland, 2017; (In Finnish, English Summary). [Google Scholar]
  83. Slivinska, K.; Kopij, G. Diet of the Przewalski’s horse Equus prewalskii in the Chernobyl exclusion zone. Pol. J. Ecol. 2011, 59, 841–847. [Google Scholar]
  84. Ferreira, L.M.M.; Celaya, R.; Santos, A.S.; Garcia, U.; Rosa Garcia, R.; Rodrigues, M.A.M.; Osoro, K. Foraging behavior of equines grazing on partially improved heathlands. In Forages and Grazing in Horse Nutrition; Saastamoinen, M., Fradinho, M.J., Santos, A.S., Miraglia, N., Eds.; Wageningen Academic Publishers: Wageningen, The Netherlands, 2012; pp. 227–230. [Google Scholar]
  85. Houpt, K.A.; Zahorik, D.M.; Swartzman-Andert, J.A. Taste aversion learning in horses. J. Anim. Sci. 1990, 68, 2340–2344. [Google Scholar] [CrossRef] [PubMed]
  86. Bruinenberg, M.H.; Geets, R.H.E.M.; Struik, P.C.; Valk, H. Dairy cow performance on silage from semi-natural grassland. J. Life Sci. 2006, 54, 95–110. [Google Scholar] [CrossRef]
  87. Cosyns, E.; Degezelle, T.; Demeulenaere, E.; Hoffmann, M. Feeding ecology of Konik horses and donkeys in Belgian coastal dunes and its implications for nature management. Belg. J. Zool. 2001, 131, 111–118. [Google Scholar]
  88. Köster, T.; Kauer, K.; Tönutare, T.; Kölli, R. The management of the coastal grasslands of Estonia. In Coastal Environment V; Bredda, C.A., Saval Perez, J.M., Garcia Andion, L., Eds.; Inc. Oil Spills Studies, WIT Press: Southampton, UK, 2004; pp. 45–54. [Google Scholar]
  89. Gudmundsson, O.; Dyrmundsson, O.R. Horse grazing under cold and wet conditions: A review. Livest. Prod. Sci. 1994, 40, 57–63. [Google Scholar] [CrossRef]
  90. Shingu, Y.; Kondo, S.; Hata, H.; Okubo, M. Digestibility and number of bites and chews on hay at fixed level in Hokkaido native horses and light half-bred horses. J. Equine Sci. 2001, 12, 145–147. [Google Scholar] [CrossRef]
Figure 1. Number of vascular plant species, number of species eaten by horses, ratio of the cover of species preferred by horses related to the total vegetation cover, cover of plant species avoided by horses, and numbers of positive and negative indicator species per 1 m2 for mesic grasslands by the study areas (mean and ±SE). Sample sizes are: n = 44 (Ypäjä), n = 33 (Savijärvi), n = 9 (Särkisaari). Statistical differences are based on generalized linear model (* p < 0.05, ** p < 0.01, *** p < 0.001, and (*) p < 0.1).
Land 06 00069 g001
Figure 2. NDMS-ordination based on species composition in 1 m2 sampling squares on the three horse pastures (n = 86). The envelopes illustrate the levels of similarity between the study areas. Species names are abbreviated by the three first letters of genus and species names (see Supplementary material).
Land 06 00069 g002
Table 1. The main ecological and management-related characteristics of the study areas.
YpäjäSavijärviSärkisaari
Study area, ha90205.5
Ecological typeSemi-natural grasslandLake-side mesic grasslandIsland lake-side mesic grassland
Management typePermanent
Semi-natural
Protected site
Permanent
Additional seeding locally
Organic
Formerly permanent; re-seeded annually
Cultivated, conventional
Stocking rate1–6 horses/ha, rotational, 2 pastures10 horses/ha
Rotational, 6 parcels
5 horses/ha
Rotational, 2 parcels
Horse categoryBarren mares1–2–yr old horses1–3–yr old horses
Table 2. Means (±SE) of feed values and nutrient composition of the pasture grass for the whole period of measurements (8 June–24 September 2012). All values are per kg of dry matter. Samples were taken within grazed parts of a pasture and plant species strictly avoided by the horses were discarded.
Ypäjä n = 22Savijärvi n = 24Särkisaari n = 4
Crude protein (CP), g175.0 (10.3)123.8 (5.7)198.5 (44.0)
Metabolisable energy (ME), MJ10.4 (0.1)10.0 (0.1)10.3 (0.4)
Total sugars (TS), g177.7 (18.7)136.6 (32.5)88.0 (39.3)
Neutral detergent fibre (NDF), g501.0 (10.9)540.8 (10.2)549.3 (29.3)
Digestibility of organic matter (D-value)677.5 (19.4)654.4 (19.5)671.5 (16.8)
Ca, g4.9 (0.2)4.5 (0.3)3.2 (0.4)
P, g2.4 (0.1)2.7 (0.1)2.7 (0.3)
Ca-to-P ratio1.7 (0.8)1.6 (0.4)1.2 (0.5)
Mg, g1.7 (0.3)1.7 (0.3)2.1. (0.8)
Na, g0.03 (0.01)0.04 (0.01)0.05 (0.03)
K, g18.4 (3.4)18.7 (2.5)23.0 (5.7)
Cu, mg6.1 (0.3)5.3 (0.2)6.5 (0.9)
Zn, mg36.3 (1.1)29.7 (1.5)29.0 (3.5)
Fe, mg95.6 (3.6)218.7 (55.4)293.5 (159.5)
Mn, mg200.3 (23.7)182.8 (16.5)175.0 (53.7)
Table 3. Temporal changes in feed values and nutrient composition in Ypäjä semi-natural (08.06–24.09.2012, n = 22) and Savijärvi permanent pastures (08.06–31.07.2012, n = 24). The best fitting function as derived from the curve estimation procedure with negative (−) or positive (+) direction and statistical significance indicated by the number of signs.
YpäjäSavijärvi
Crude protein (CP)inverse +ns
Metabolisable energy (ME)inverse − − −linear − −
Total sugars (TS)quadratic − − −quadratic −
Neutral detergent fibre (NDF)inverse ++ns
Digestibility of organic matter D-valuequadratic − − −quadratic −
Plinear +ns
Feexponential +ns
Mnexponential +ns
The data for Ca, Mg, Na, K, Cu and Zn are not shown because the changes were non-significant. The number of signs corresponds to the significance levels as: ns non-significant, +/− at p < 0.05, ++/−− p < 0.01 and +++/−−− p < 0.001.
Table 4. Means and change (beginning–October) of body condition score (BCS; score 1–9), body weight (BW, kg), heart girth circumference (HG, cm) and waist circumference (WC, cm) of the horses (n = 20) in Ypäjä semi-natural pasture during the study period.
InitialAugustSeptemberOctoberChangeSEM
BCS5.386.056.075.70+0.320.25
BW, kg546.9597.0600.2558.2+11.312.51
HG, cm191.1-194.7197.0+5.92.03
WC, cm210.7-221.7217.6+6.92.78
Table 5. Principal component analysis components (1–4) based on the structural pasture characteristics for the three study areas (major loadings are highlighted in bold). Variable names refer to the relative covers of the parameters measured from the digital photographs as well as vegetation height, n = 258.
Component Variable1234
Bare0.0090.0350.0090.998
Dung−0.0500.0060.9090.016
Grasses0.9140.223−0.222−0.168
Others−0.9440.227−0.162−0.173
Litter0.143−0.8140.280−0.99
Height0.1360.7030.322−0.59

