Article

How Do Human Land Use Changes and Ecological Restoration Drive Ecological–Economic–Social Coupling Coordination Across the Yellow River Basin in China?

1
College of Public Administration, Shandong Technology and Business University, Yantai 264005, China
2
Weifang Engineering Vocational College, Weifang 262500, China
3
School of Economics and Management, Beijing Forestry University, Beijing 100083, China
4
Development Research Center, National Forestry and Grassland Administration, Beijing 100714, China
*
Author to whom correspondence should be addressed.
Land 2026, 15(9), 1729; https://doi.org/10.3390/land15091729
Submission received: 14 August 2026 / Revised: 7 September 2026 / Accepted: 15 September 2026 / Published: 16 September 2026

Abstract

Conflicts between intense human activity and fragile ecosystem protection have and will continue to affect the ecological–economic–social complex system across the Yellow River Basin. An enhanced understanding of the effects of human land use changes and ecological restoration on the coupling coordination of this system is urgently needed to promote the basin’s sustainable development. Here, we integrated remote sensing data with county-level panel data from 2001 to 2020 to assess the coupling coordination degree at a fine spatial resolution. We also investigated the spatial heterogeneity of the effects of changes in urbanization rate, cropland area, and vegetation area on changes in the coupling coordination degree. We found that the coupling coordination degree was low overall and exhibited High–High clustering in the lower reaches, which have the most hydrothermal resources and highest socio-economic development level. Since 2001, the coupling coordination degree has exhibited a significant increasing trend and shows High–High clustering in the agro-pastoral ecotone of the Loess Plateau, which is the core area of the Grain for Green Program. The urbanization rate should be regulated within a reasonable range to ensure sufficient preservation of cropland and vegetation areas to sustain coupling coordination in the upper and middle reaches. Increasing or maintaining stable cropland and vegetation areas could support urban expansion by safeguarding food security and the provision of ecosystem services, thereby strengthening coupling coordination. Ecological restoration played a dominant role in promoting coordinated development in the upper and middle reaches. The continued implementation of ecological protection and restoration projects has enhanced ecosystem services and the well-being of rural residents, promoting sustainable development. These findings will improve the governance of human land use activity and ecological project implementation to promote sustainable development in the study area.

1. Introduction

The Yellow River Basin in China is a complex system composed of coupled ecological, economic, and social subsystems. The basin not only supports 15% of China’s cropland and seven urban agglomerations, but it is also one of the country’s most vital ecological security barriers [1,2,3]. Divergent ecosystem and socio-economic development across the basin have posed significant challenges to the sustainable development of the basin as a whole. The upper reaches, situated on the northeastern Tibetan Plateau, the southern Inner Mongolian Plateau, and the western Loess Plateau, supply 60% of the basin’s runoff, serving as the primary water source for the ecological–economic–social complex system [4]. This area has the lowest level of socio-economic development in the basin and is an area with high sensitivity to human activity [5]. The middle reaches, located in the Loess Plateau, contribute 90% of the Yellow River’s sediment load [6], which is caused by expansion of land for human use [7,8]. The upper and middle reaches are critical ecological protection and restoration areas. The lower reaches, located in the North China Plain, exhibit the highest level of socio-economic development in the basin but face the challenge of ecological land being squeezed by urban and cropland expansion [9,10]. Understanding the effects of human land use changes and ecological restoration on the ecological–economic–social coupled system is essential for advancing sustainable development of the basin.
Human land use is a major driver of the ecological–economic–social coupling coordination in the basin. Coupling coordination is higher in the lower reaches than in the upper and middle reaches [11], which is particularly evident in the lower reaches’ urban agglomerations [12]. Since 2000, coupling coordination has increased significantly [13], but the three subsystems remain imbalanced, with ecological conservation lagging socio-economic development [14]. Urban land and cropland are the two main human land uses in the basin. Rapid urbanization has improved economic efficiency and social well-being [15,16,17], but it has also encroached upon natural ecosystems and intensified resource consumption [18,19,20]. Cropland expansion driven by the increasing food demand has caused vegetation degradation, water and soil erosion, and non-point-source pollution [21,22].
To mitigate conflicts between ecological, economic, and social subsystems, ecological restoration programs have been implemented to enhance ecosystem functions and support the economic and social subsystems [23,24]. The human land use changes and ecological restoration mentioned above have made the coupling coordination increasingly complex. To advance sustainable development across the basin, decision-makers need a deeper understanding of the coupling coordination and its driving mechanism at a fine spatial scale. However, previous studies primarily used provincial- or municipal-level panel data to analyze coupling coordination and compared spatial variations across administrative divisions. These data suffer from limitations such as coarse spatial resolutions, missing values in long-term series, and a lack of ecological and water resource indicators.
Satellite remote sensing provides higher-spatial resolution, long-term series data for global sustainable development studies [25,26]. Its continuous observation capability ensures superior data availability and integrity compared with traditional panel data. These advantages have facilitated the increasing application of satellite remote sensing data in regional ecological–economic–social coupling coordination studies [27,28].
To this end, we integrated satellite remote sensing data with county-level panel data to establish an ecological–economic–social index system to characterize this system, and used a coupling coordination degree model to quantify its relationship with coupling coordination during the period of 2001–2020. We then applied statistical and geostatistical analyses to investigate effects of changes in urbanization rate, cropland area, and vegetation area on changes in coupling coordination. Specifically, we addressed the following questions:
  • What is the spatial pattern of the ecological–economic–social coupling coordination across the Yellow River Basin?
  • Does the ecological–economic–social coupling coordination show trends along increasing gradients of human land use and vegetation area?
  • How do human land use changes and ecological restoration affect the spatial heterogeneity of changes in ecological–economic–social coupling coordination?
Using an index system integrating multi-source data, we identified the clustering characteristics of the coupling coordination degree and its significant change trends. Patterns of the coupling coordination degree along increasing gradients of human land use and vegetation area revealed the potential of regulating urbanization rate, cropland area, and vegetation area to support regional sustainable development management. The driving effect analysis revealed the core role of ecological restoration in promoting sustainable development in ecologically fragile areas.

2. Materials and Methods

2.1. Study Area

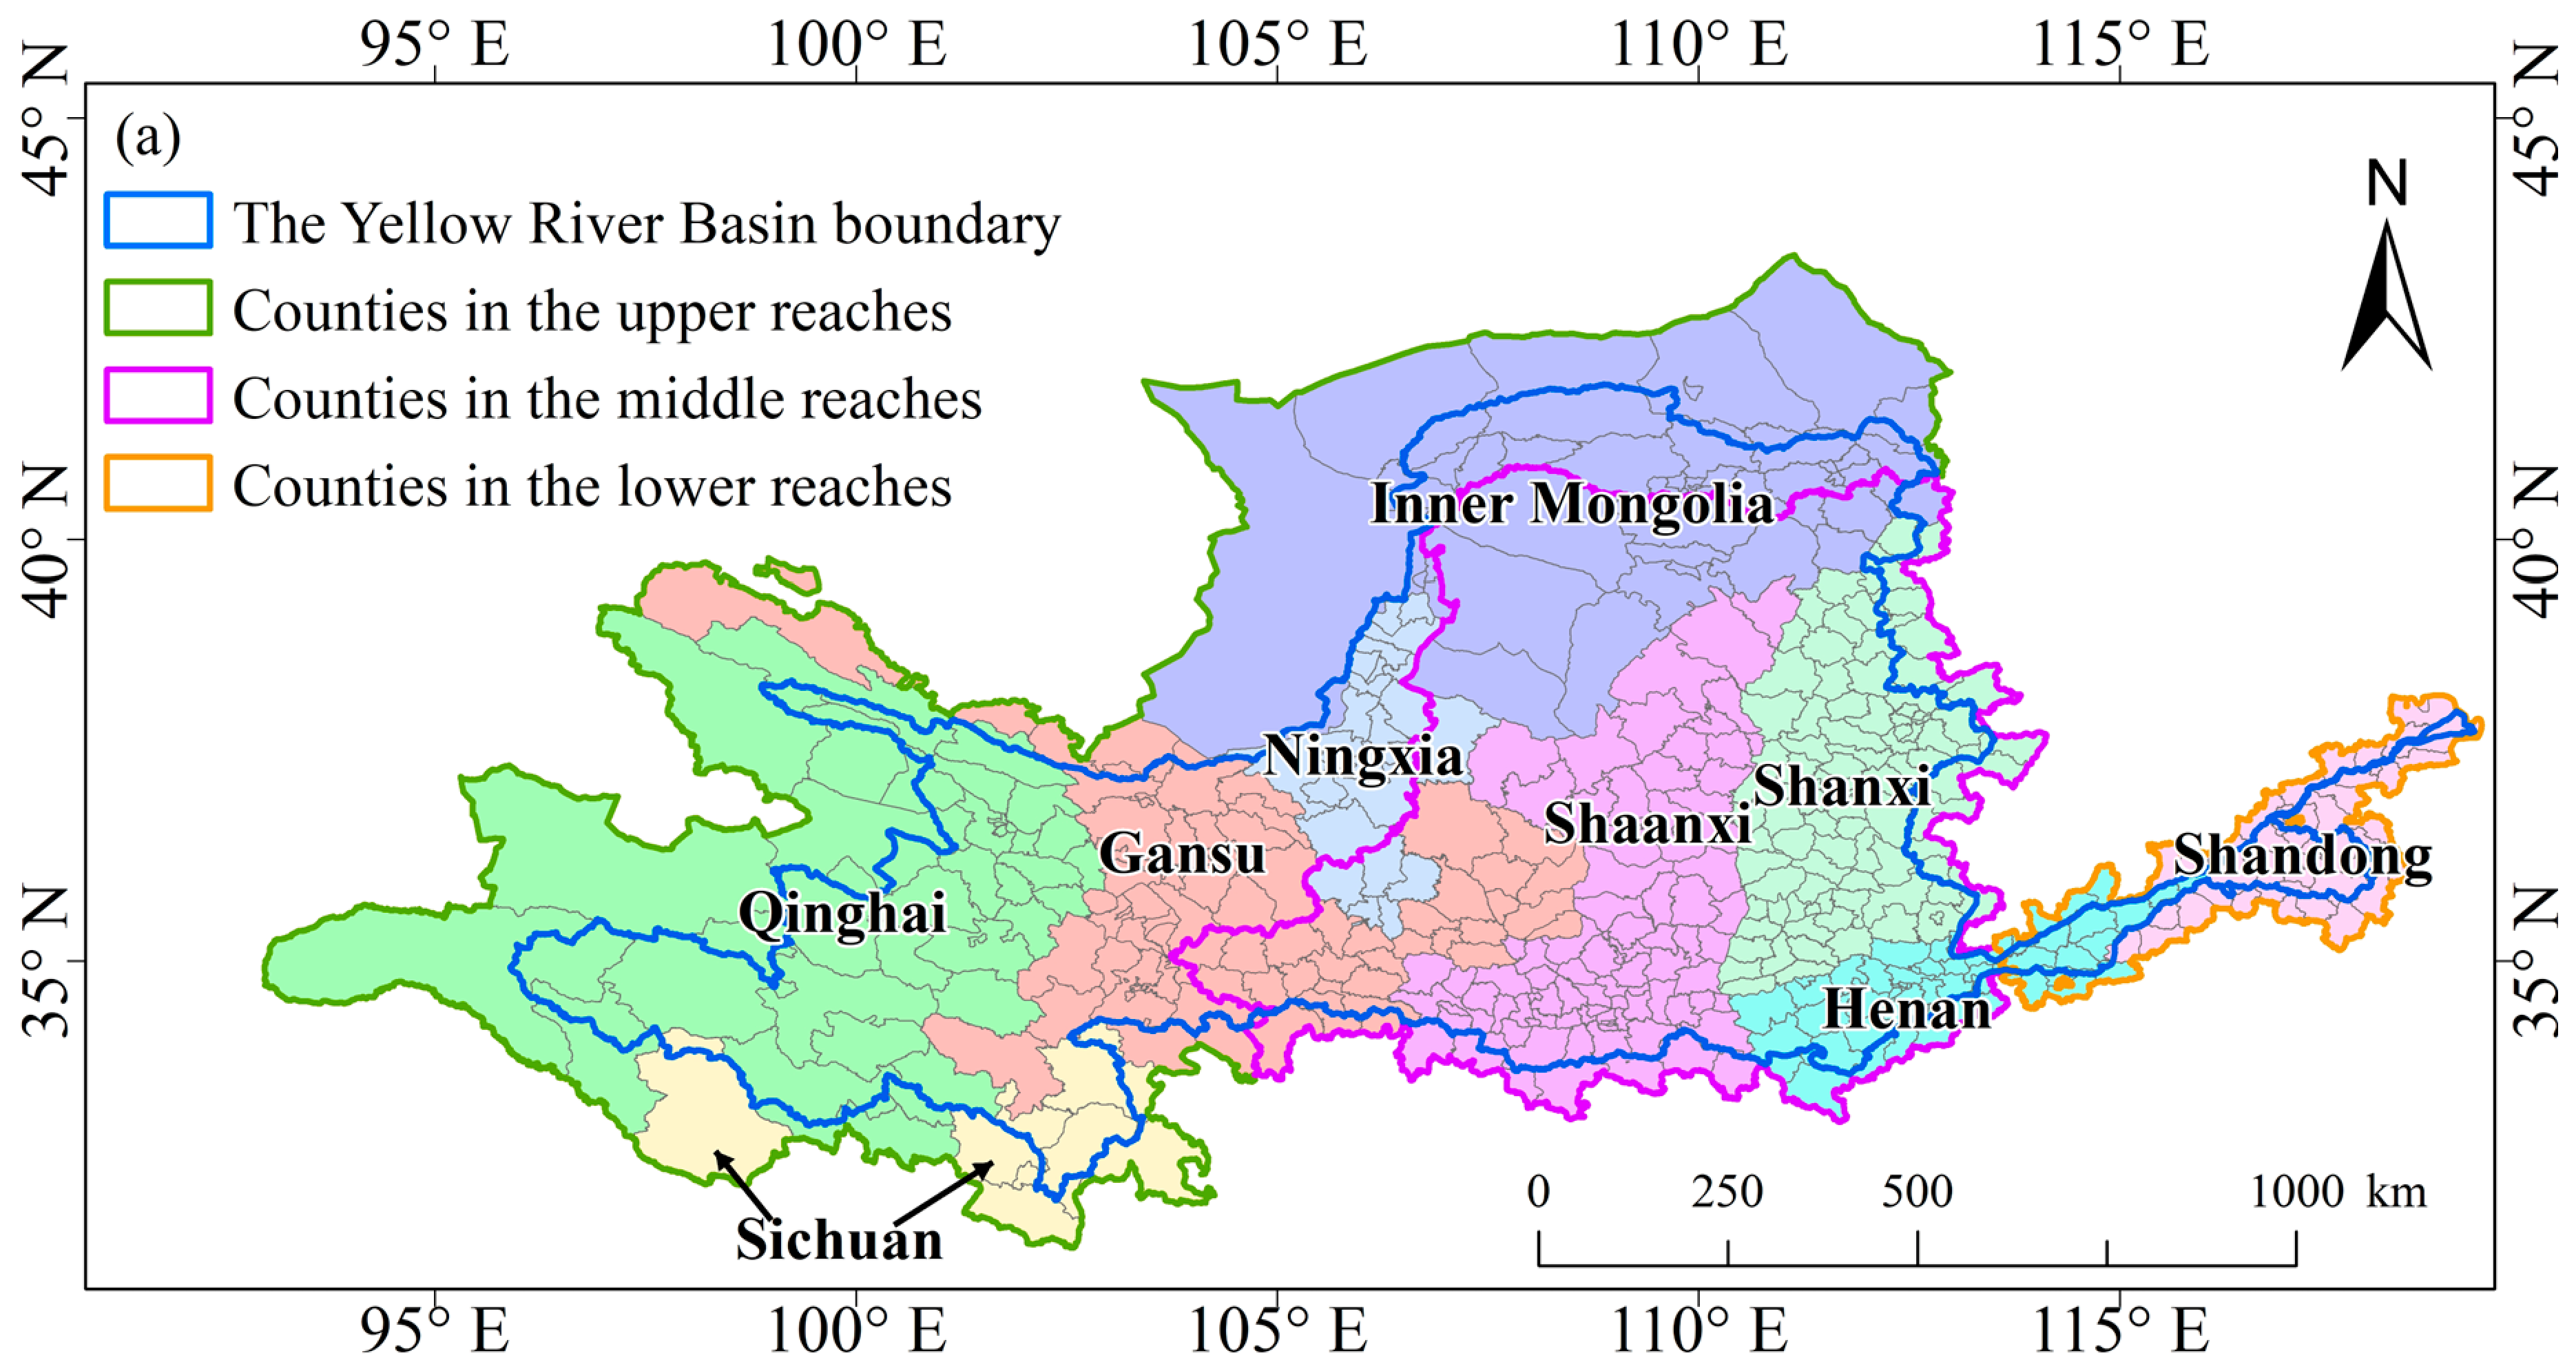
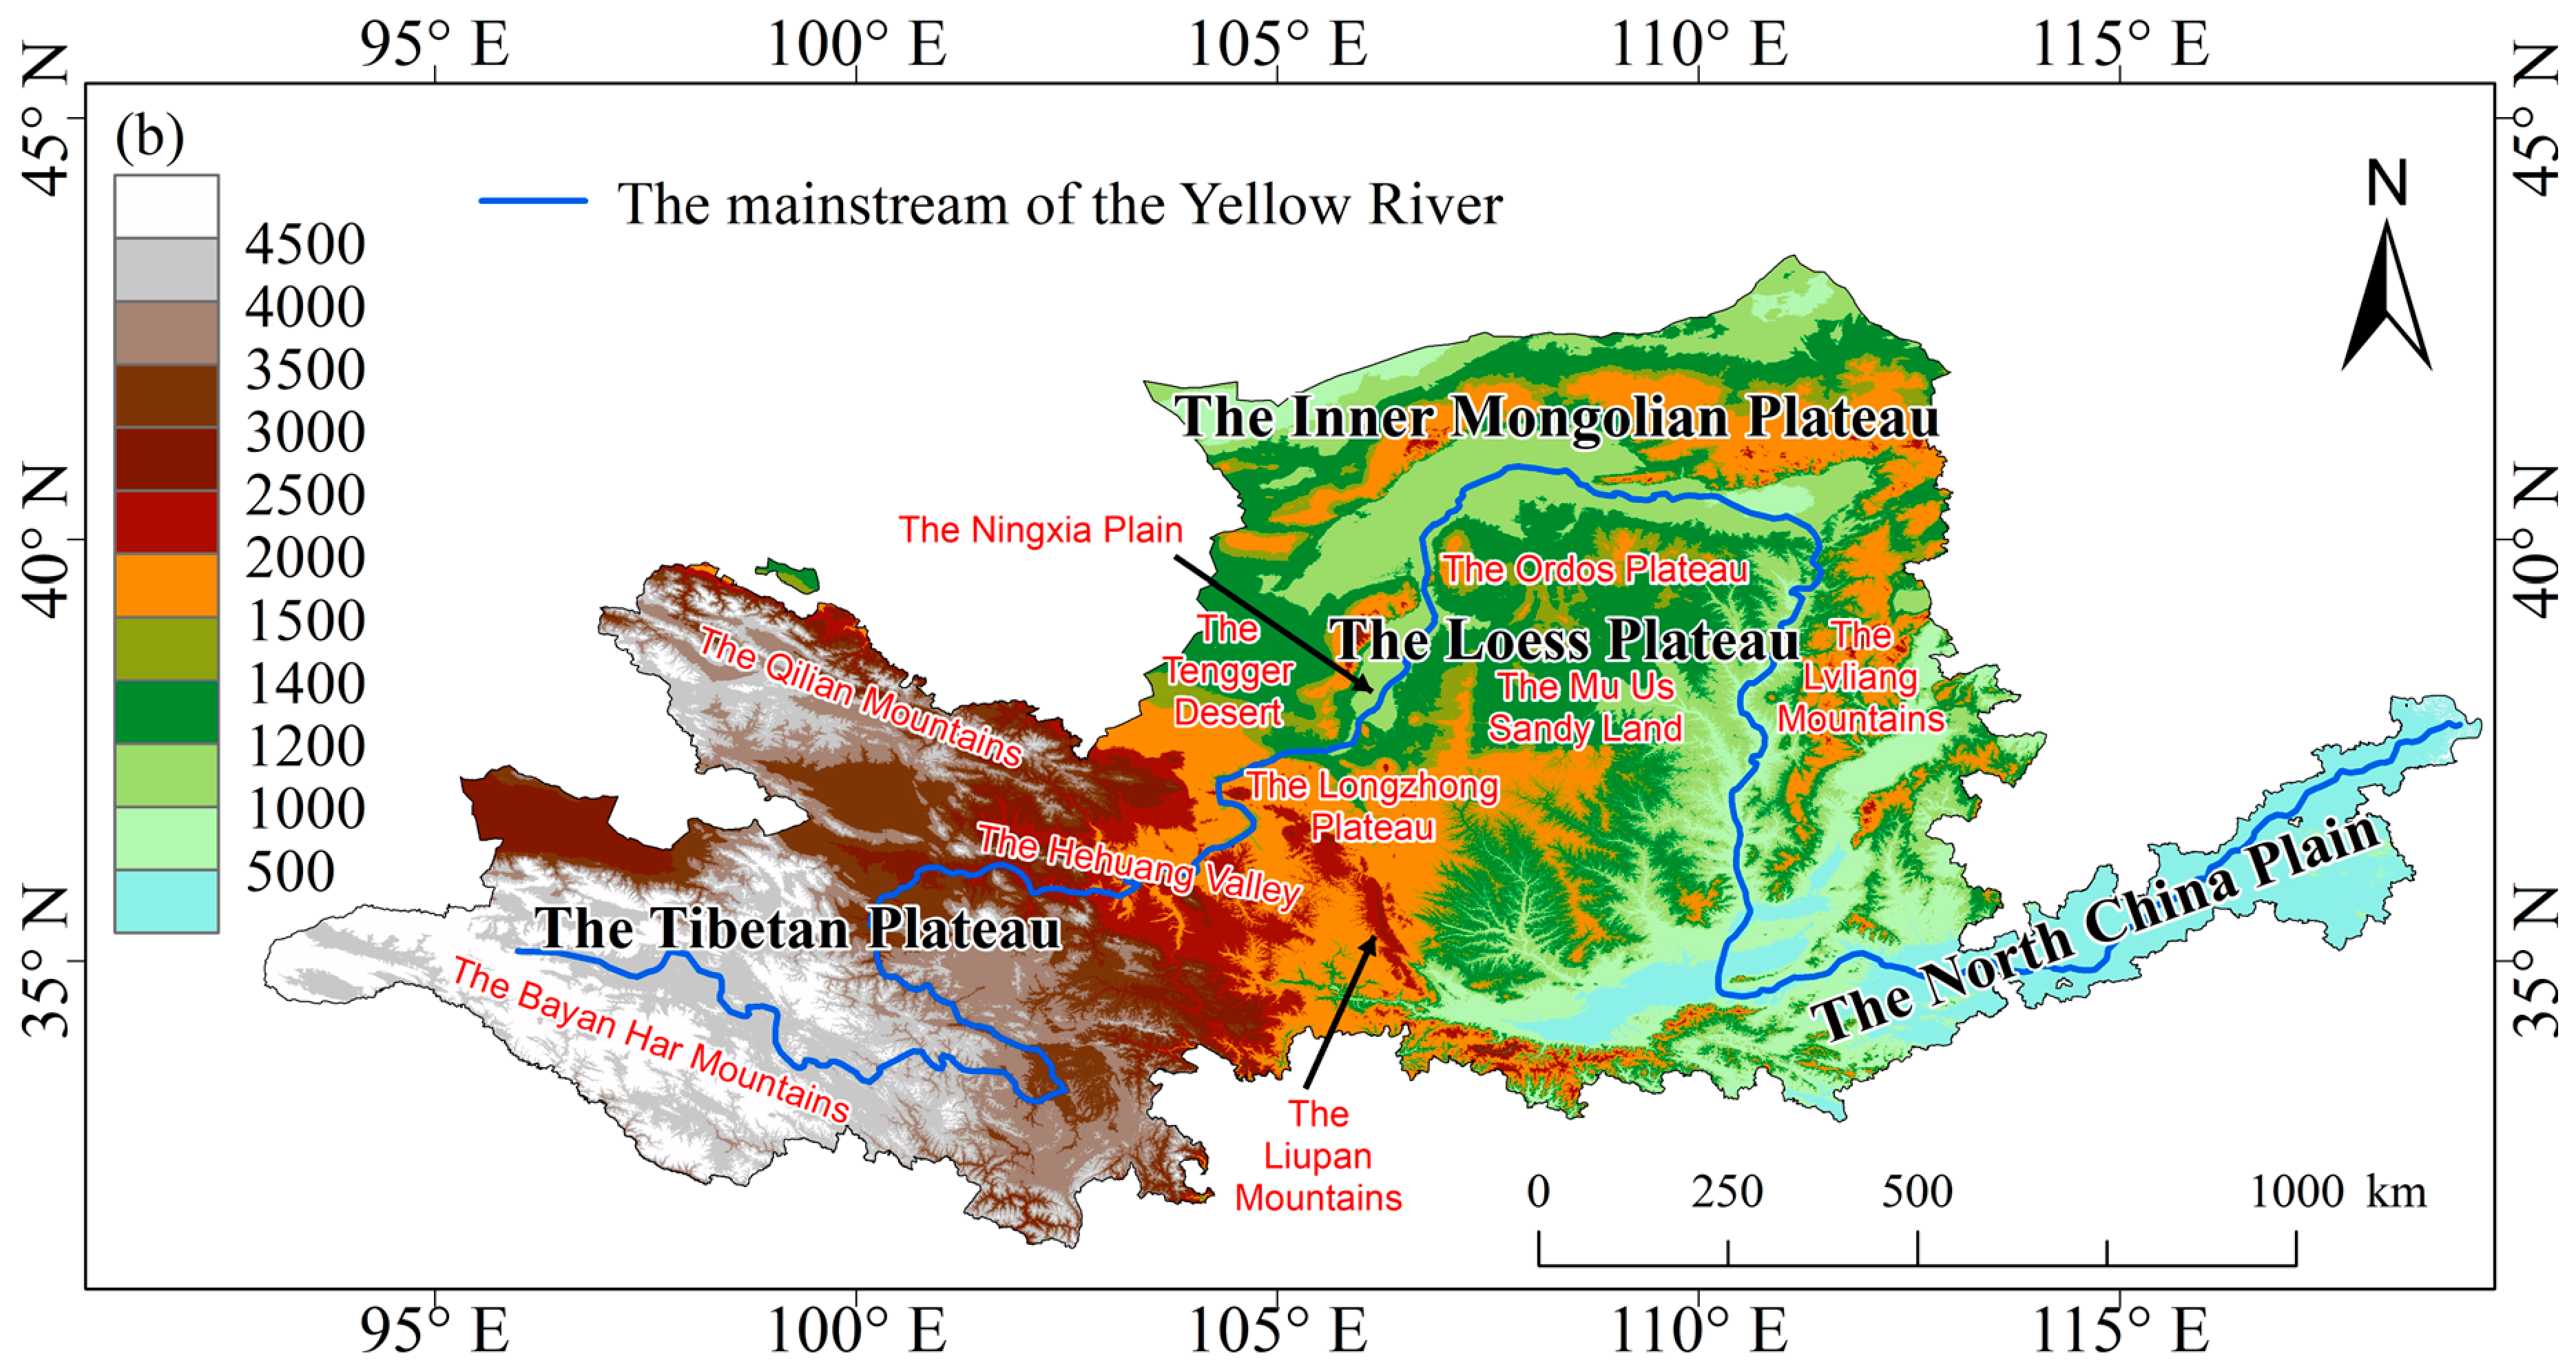
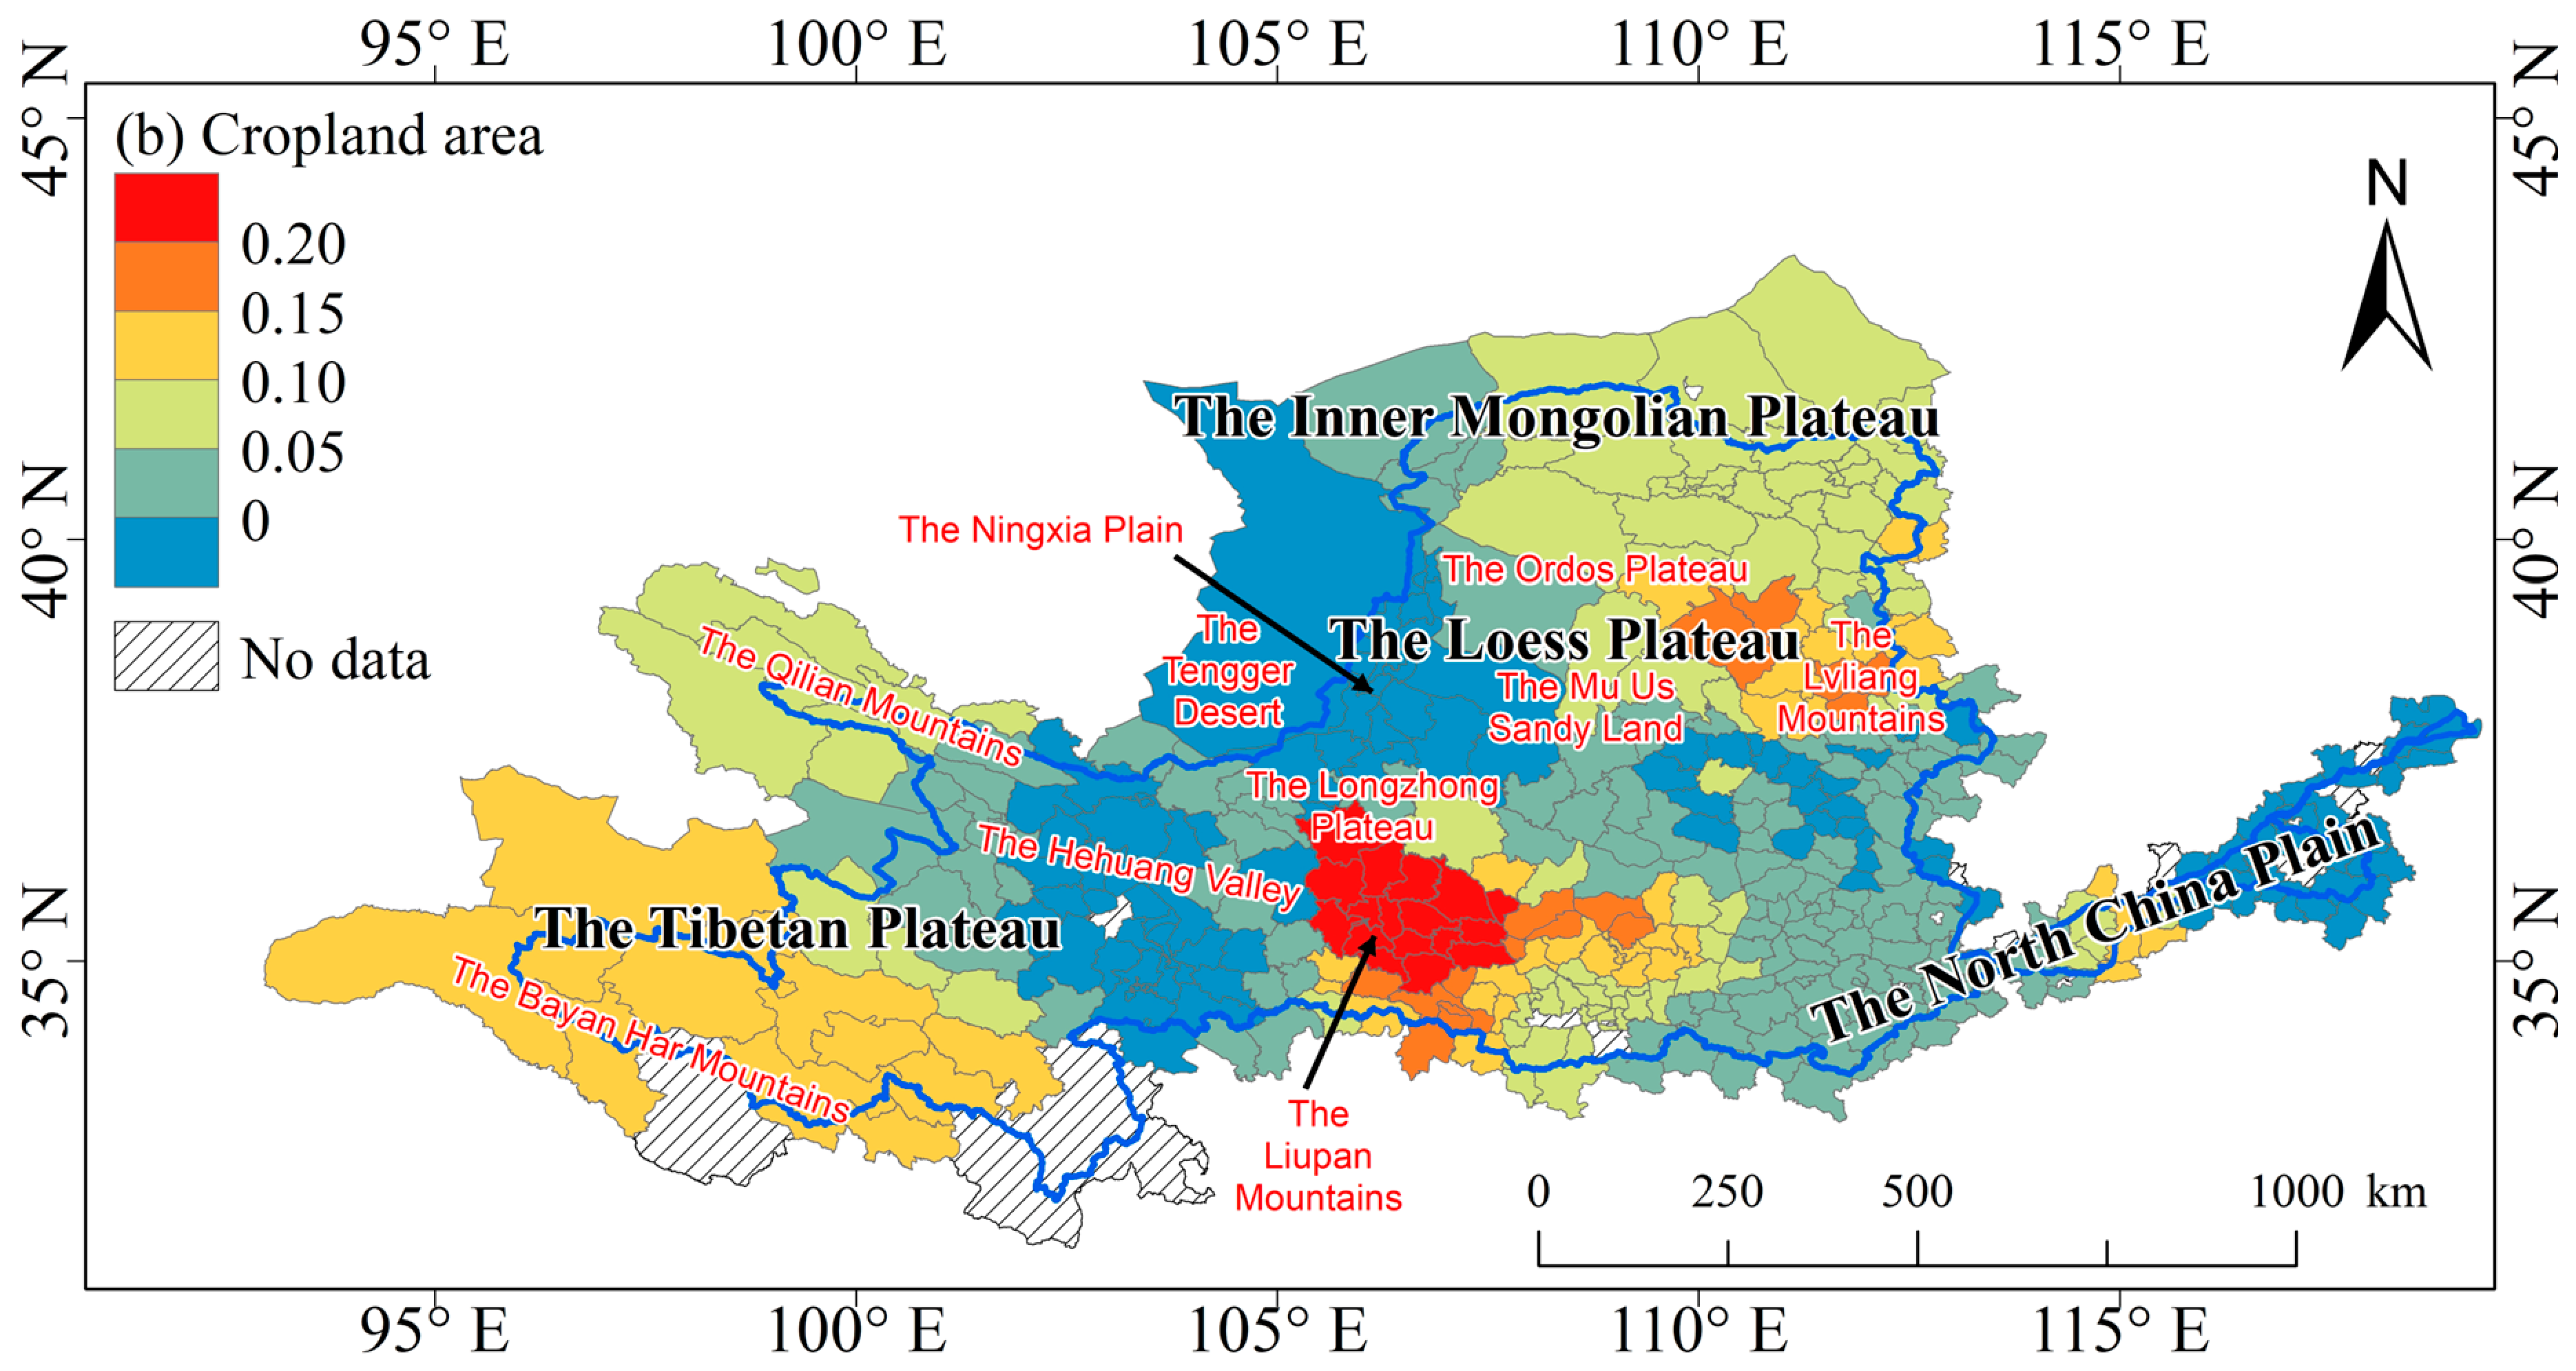
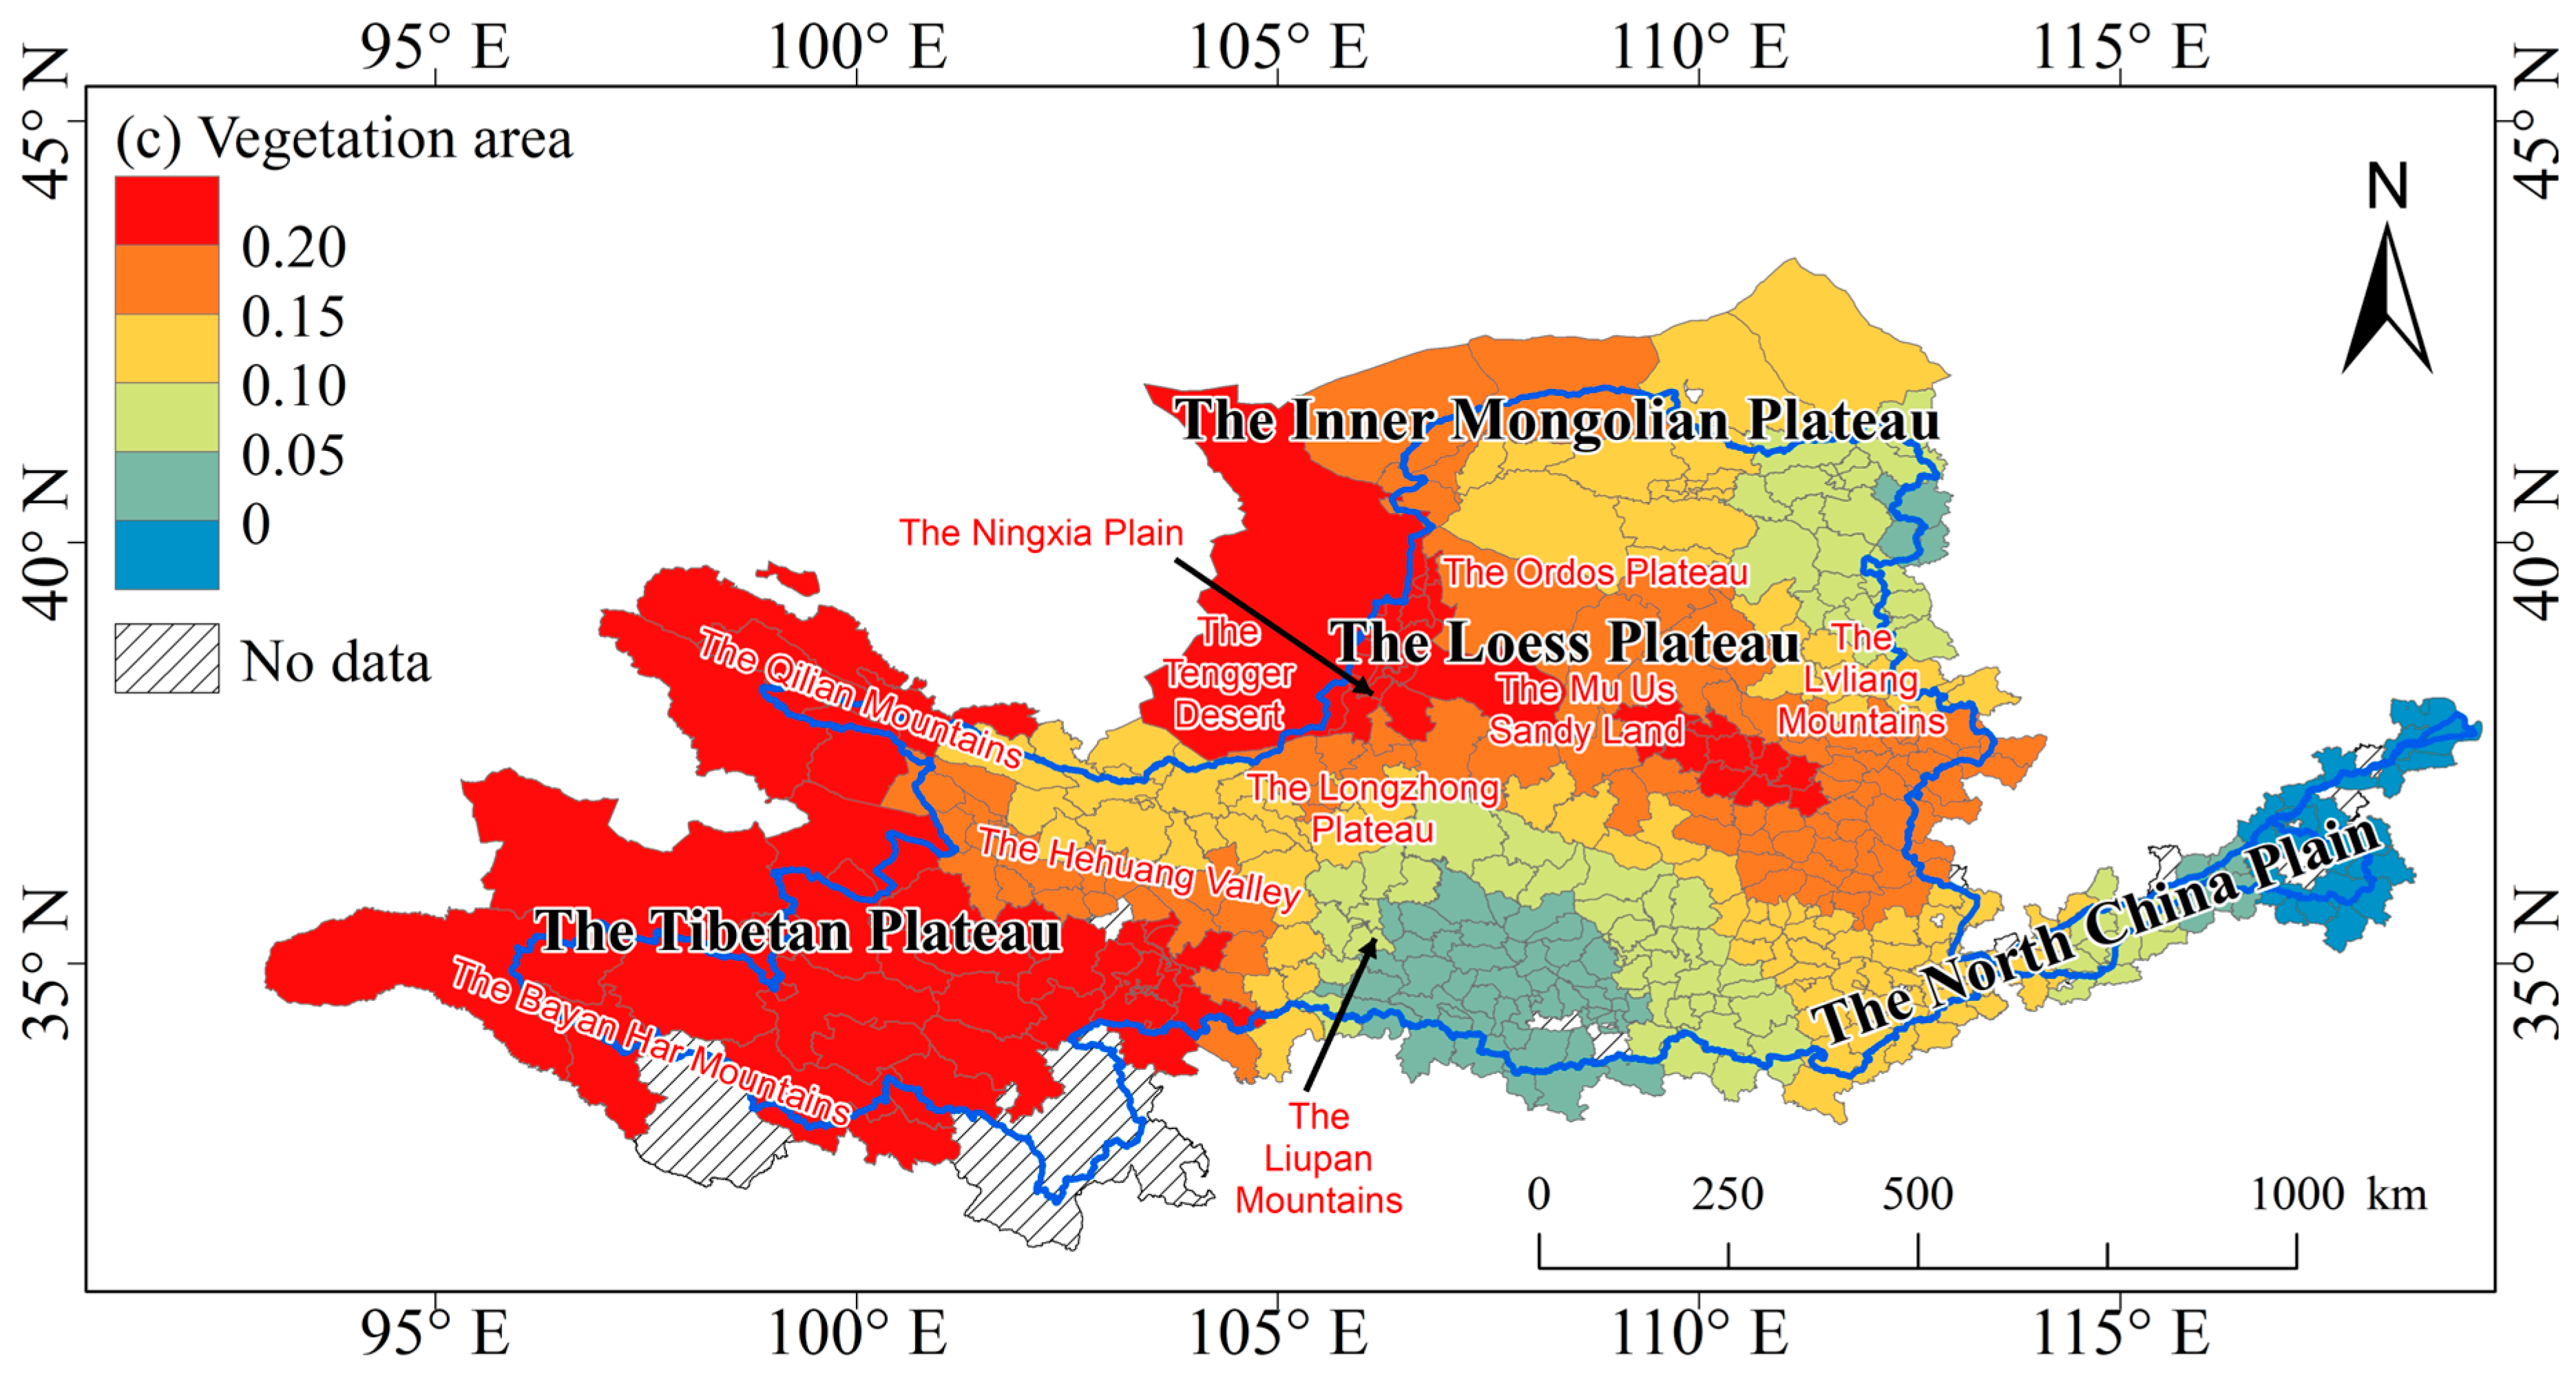
The Yellow River originates from the Yueguzonglie Basin in the northeastern Tibetan Plateau in China and flows eastward through nine provinces: Qinghai, Sichuan, Gansu, Ningxia, Inner Mongolia, Shaanxi, Shanxi, Henan, and Shandong. In this study, we selected 410 counties, which are either entirely or partially located within the basin boundary, as our study area (Figure 1a). The Yellow River Basin is located between 32 and 42° N and 96–119° E, covering an area of approximately 7.95 × 10⁵ km2. The basin encompasses the northeastern Tibetan Plateau, the Loess Plateau, the southern Mongolian Plateau, and the North China Plain (Figure 1b). The basin’s elevation shows a decreasing eastward trend from the western plateau area to the eastern plain area.

2.2. Methods and Data Sources

2.2.1. Research Framework

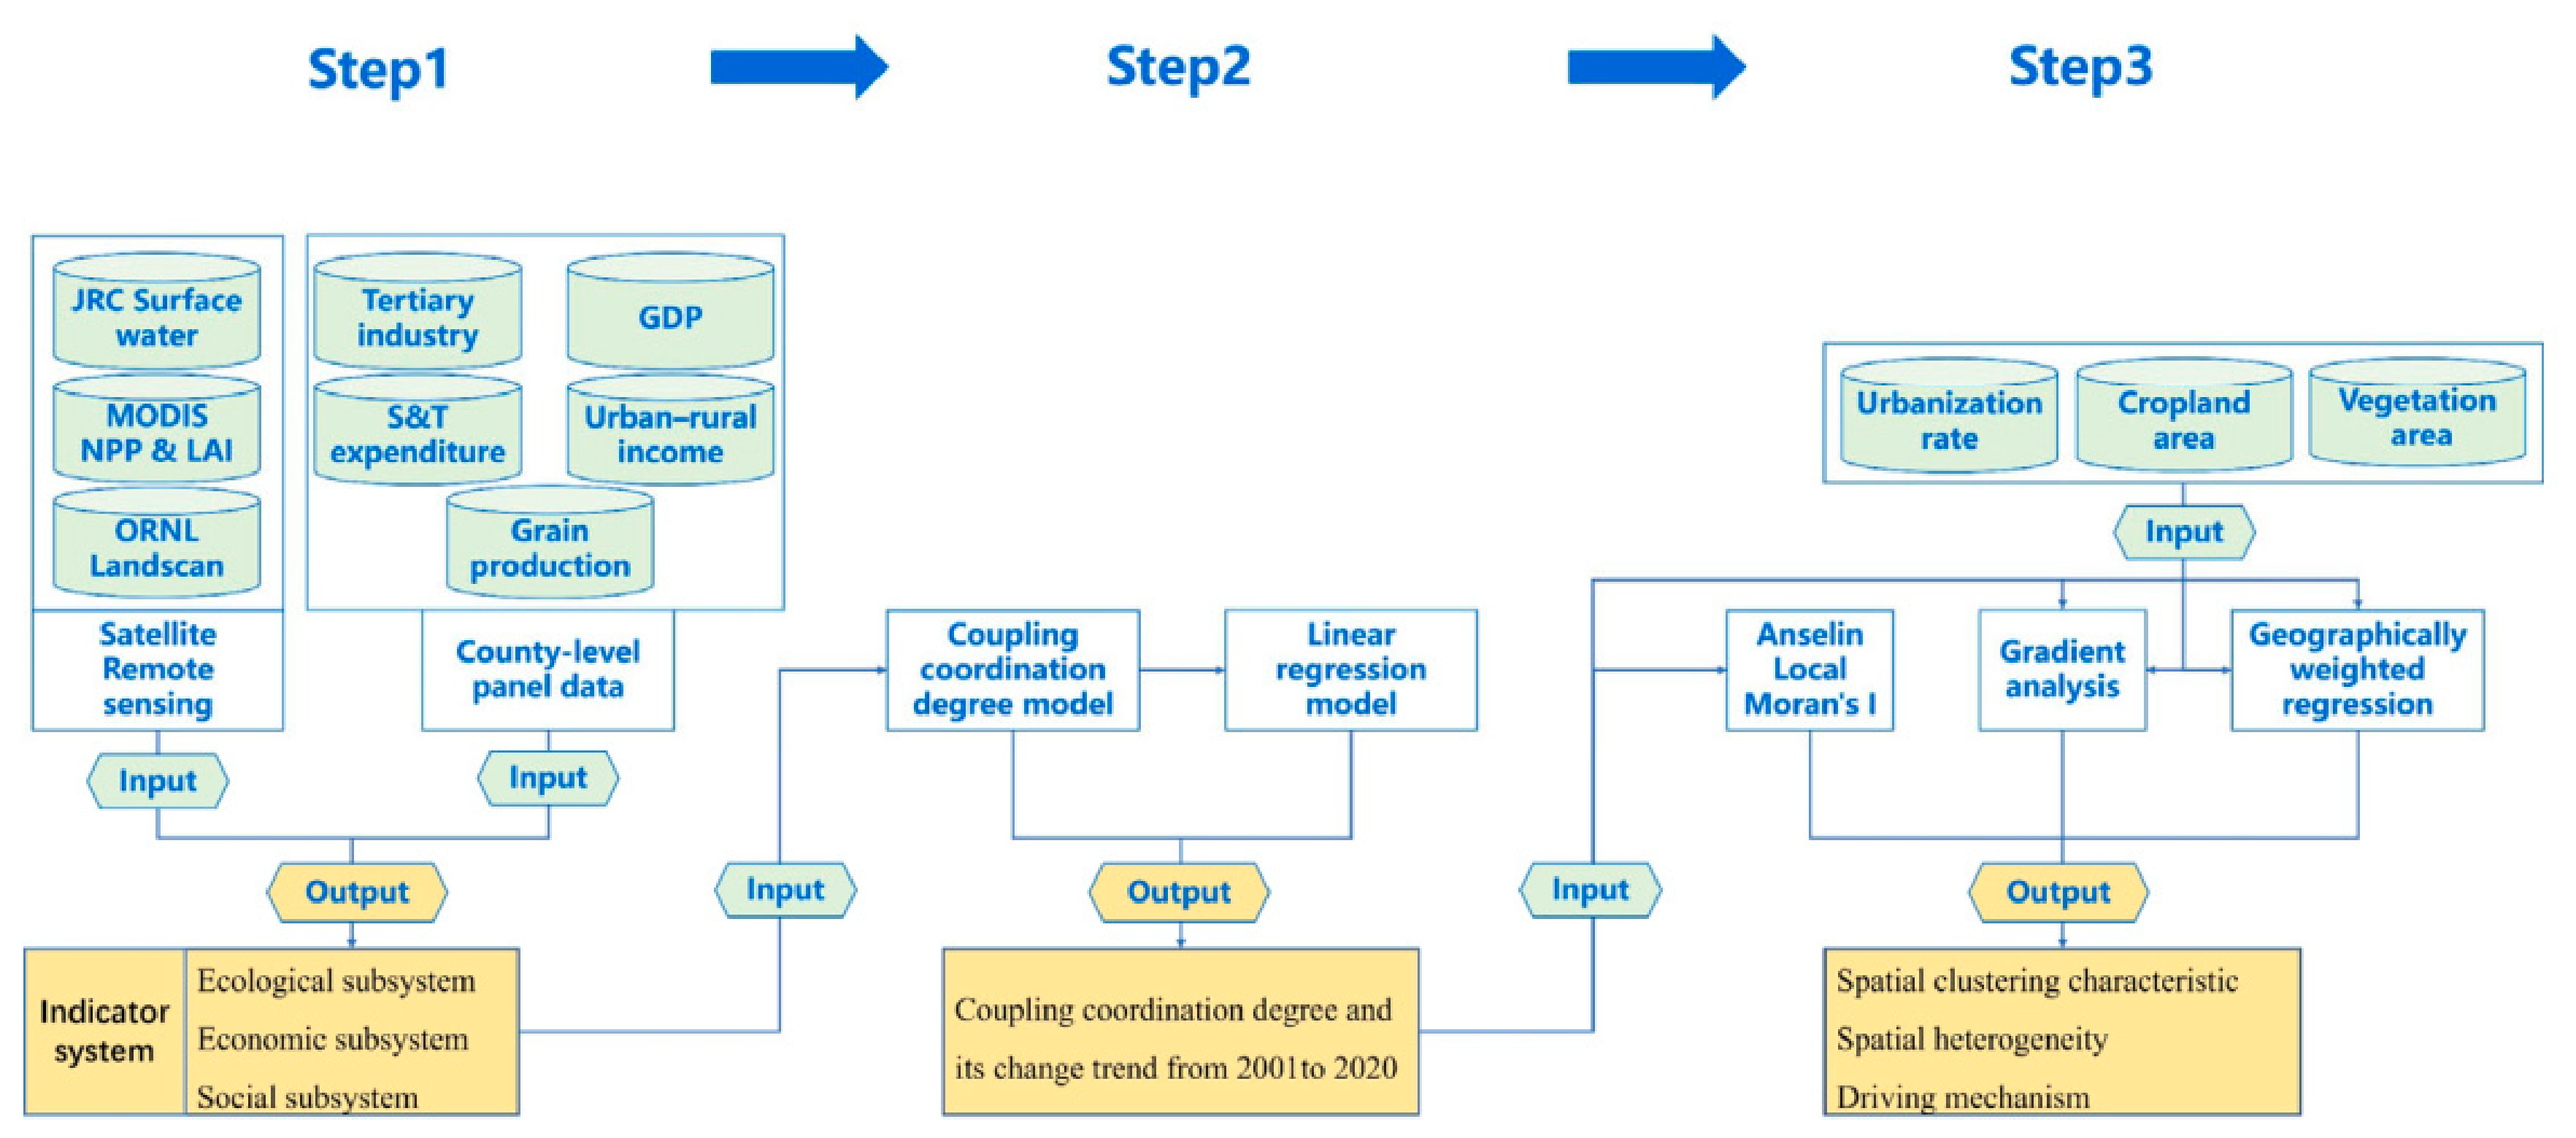
To investigate the coupling coordination relationship between ecological, economic, and social subsystems [12,15,29] and between different factors (water, energy, and food supply) [14,30,31], previous studies established an index system to measure each subsystem or individual factor, and then selected a coupling coordination degree model or performed correlation analysis to assess the coupling coordination relationship between different subsystems or factors. Some studies also explored the driving mechanism of coupling coordination using statistical or geostatistical methods [13,20,32]. Following previous studies, we constructed our research framework and the associated steps (Figure 2).
First, we deconstructed the basin’s complex system into ecological, economic, and social subsystems, and integrated satellite remote sensing data with county-level panel data for the period of 2001–2020 to establish an index system. The county-level panel data primarily consisted of economic and social indicators, but lacked ecological indicators. Consequently, we used satellite remote sensing data to assess the ecological subsystem. Second, we used the coupling coordination degree model to calculate the coupling coordination relationship between ecological, economic, and social subsystems, and used the linear regression model to calculate its change trend from 2001 to 2020. Third, based on the coupling coordination degree and its change trend results, we used Anselin Local Moran’s I analysis to investigate their spatial clustering characteristics. We then analyzed the spatial heterogeneity of the coupling coordination degree and its change trend along increasing gradients of human land use and ecological space. Geographically weighted regression was used to further explore the effects of human land use changes and ecological restoration on the changes in coupling coordination degree.

2.2.2. Ecological–Economic–Social Index System

The index system consisted of three components: ecological, economic, and social subsystems (Table 1). Following previous studies, we selected indicators in each subsystem based on ecosystem and socio–economic development characteristics. In the Yellow River Basin, the core ecosystem functions are water resource conservation in the upper reaches, vegetation restoration and water and soil conservation in the middle reaches, and vegetation protection in the lower reaches [2,10,12,33,34]. We selected the surface water area data from the European Commission Joint Research Centre (JRC GSW) [35], and the MODIS net primary productivity (NPP) [36] and leaf area index (LAI) [37] data to analyze the ecological subsystem. In the economic subsystem, the tertiary industry is a significant factor that promotes sustainable development in the ecologically fragile basin [32]. Per capita GDP was used to measure economic development, and per capita science and technology expenditure were used to indicate the level of science and technology innovation following previous studies [11,13]. For the social subsystem, the urban–rural income ratio can indicate the level of social equity, while the per capita grain production can indicate the level of food security [38,39]. In a basin complex system, societal demands for resources, and public goods and services are largely determined by the population size and density [40]. Therefore, we used the Landscan population density data developed by the Oak Ridge National Laboratory (ORNL) as a positive index for the social subsystem. This dataset measures regional active population density [41], and has been widely used to investigate social vitality and public health [42].
Table 1. Index system for the ecological–economic–social complex system. The direction indicates a positive (+) or negative (−) indicator in the subsystem.
SubsystemIndicatorDirectionData Source
Ecological subsystemSurface water area+JRC GSW
Net primary productivity+MODIS
Leaf area index+MODIS
Economic subsystemPer capita tertiary industry value added+National Bureau of Statistics
Per capita GDP+National Bureau of Statistics
Per capita science and technology expenditure+National Bureau of Statistics
Social
subsystem
Urban–rural income ratioNational Bureau of Statistics
Per capita grain production+National Bureau of Statistics
Population density+ORNL Landscan

2.2.3. Coupling Coordination Model

The calculation process of the coupling coordination model includes two steps: calculating the integrated value of each subsystem, and calculating the coupling coordination degree between the three subsystems.
  • Integrated value of each subsystem
The various indicators in each subsystem use different units. To eliminate the influence of the different units, the indicators were standardized as follows (Equation (1) for positive indices and Equation (2) for negative indices):
X i j t = X i j t X i j , m i n X i j , m a x X i j , m i n X i j , m i n X i j t X i j , m a x
X i j t = X i j , m a x X i j t X i j , m a x X i j , m i n X i j , m i n X i j t X i j , m a x
where X′ijt is standardized value of indicator i in county j in year t, and Xijt is the original value. Xij,min and Xij,max are the minimum and maximum values of the indicator i in county j during the period of 2001–2020, respectively.
We then used the entropy weight method to calculate the weight of each indicator [43]. The entropy weight method measures the quantity of useful information provided by the indicator to determine its reliability and accuracy, which ensures the objectivity of weight allocation. We deconstructed the basin complex system into three subsystems, and assessed the coupling coordination degree between the three subsystems. Consequently, for each subsystem, the entropy weight coefficients of all three indicators sum to 1. Taking indicator i in a certain subsystem as an example, the calculations are as follows:
P i = X i j t Σ t = 1 l Σ j = 1 m X i j t
k = ln l × m 1   ( k > 0 )
e i = k Σ t = 1 l Σ j = 1 m P i l n ( P i )
g i = 1 e i
ω i = g i / Σ i = 1 n g i
where Pi is the proportion for indicator i; l and m are the counts of all years and all counties, respectively; ei is the entropy value of indicator i; gi is the utility of the information for indicator i; and ωi is the weight of indicator i.
The integrated value of each subsystem was calculated as follows:
V s = Σ i = 1 n X i j t × ω i
where Vs is the integrated value of subsystem s, and n is the count of all indicators.
2.
Coupling coordination degree between three subsystems
Based on the integrated value of each subsystem, the ecological–economic–social coupling coordination degree was calculated as follows:
C = s = 1 q V s ( s = 1 q V s q ) q q = s = 1 q V s q s = 1 q V s q = q · s = 1 q V s q s = 1 q V s
T = s = 1 q ω s · V s
D = C · T
where C is the coupling degree between all subsystems; q is the count of all subsystems; T is the coordination degree; ωs is the weight of subsystem s, and was assigned a value of 1/3 because the three subsystems were defined as being of equal importance; and D is the coupling coordination degree.

2.2.4. Geospatial and Geostatistical Analyses

Anselin Local Moran’s I was calculated as follows:
I a = D a D ¯ E a 2 b = 1 ,   b a m w a b ( D b D ¯ )
E a 2 = b = 1 ,   b a m ( D b D ¯ ) 2 m 1
where Ia is Anselin Local Moran’s I in county a; Da and Db are the coupling coordination degrees in county a and the adjacent county b, respectively; D ¯ is the mean value of the coupling coordination degree; m′ is the count of all adjacent counties; and wab is spatial weight between county a and the adjacent county b.
The geographically weighted regression was calculated as follows:
y a = β 0 a + β 1 a x 1 + β 2 a x 2 + β 3 a x 3 + ε
where y(a) is the dependent factor in county a; x1, x2, and x3 are independent factors in county a; β1(a), β2(a), and β3(a) are regression coefficients in county a, which change with spatial coordinate; and ε is the regression error. In this calculation, the percentage change in the coupling coordination degree was defined as the dependent factor, while the percentage changes in urbanization rate, cropland area, and vegetation area were defined as the dependent factors. The units of all dependent and independent factors were percentages so the regression coefficients of the independent factors can be used to compare their relative contributions. The results of data accuracy and fitting accuracy tests were provided in the Supplementary Material.

3. Results

3.1. Spatial Pattern of Coupling Coordination Degree

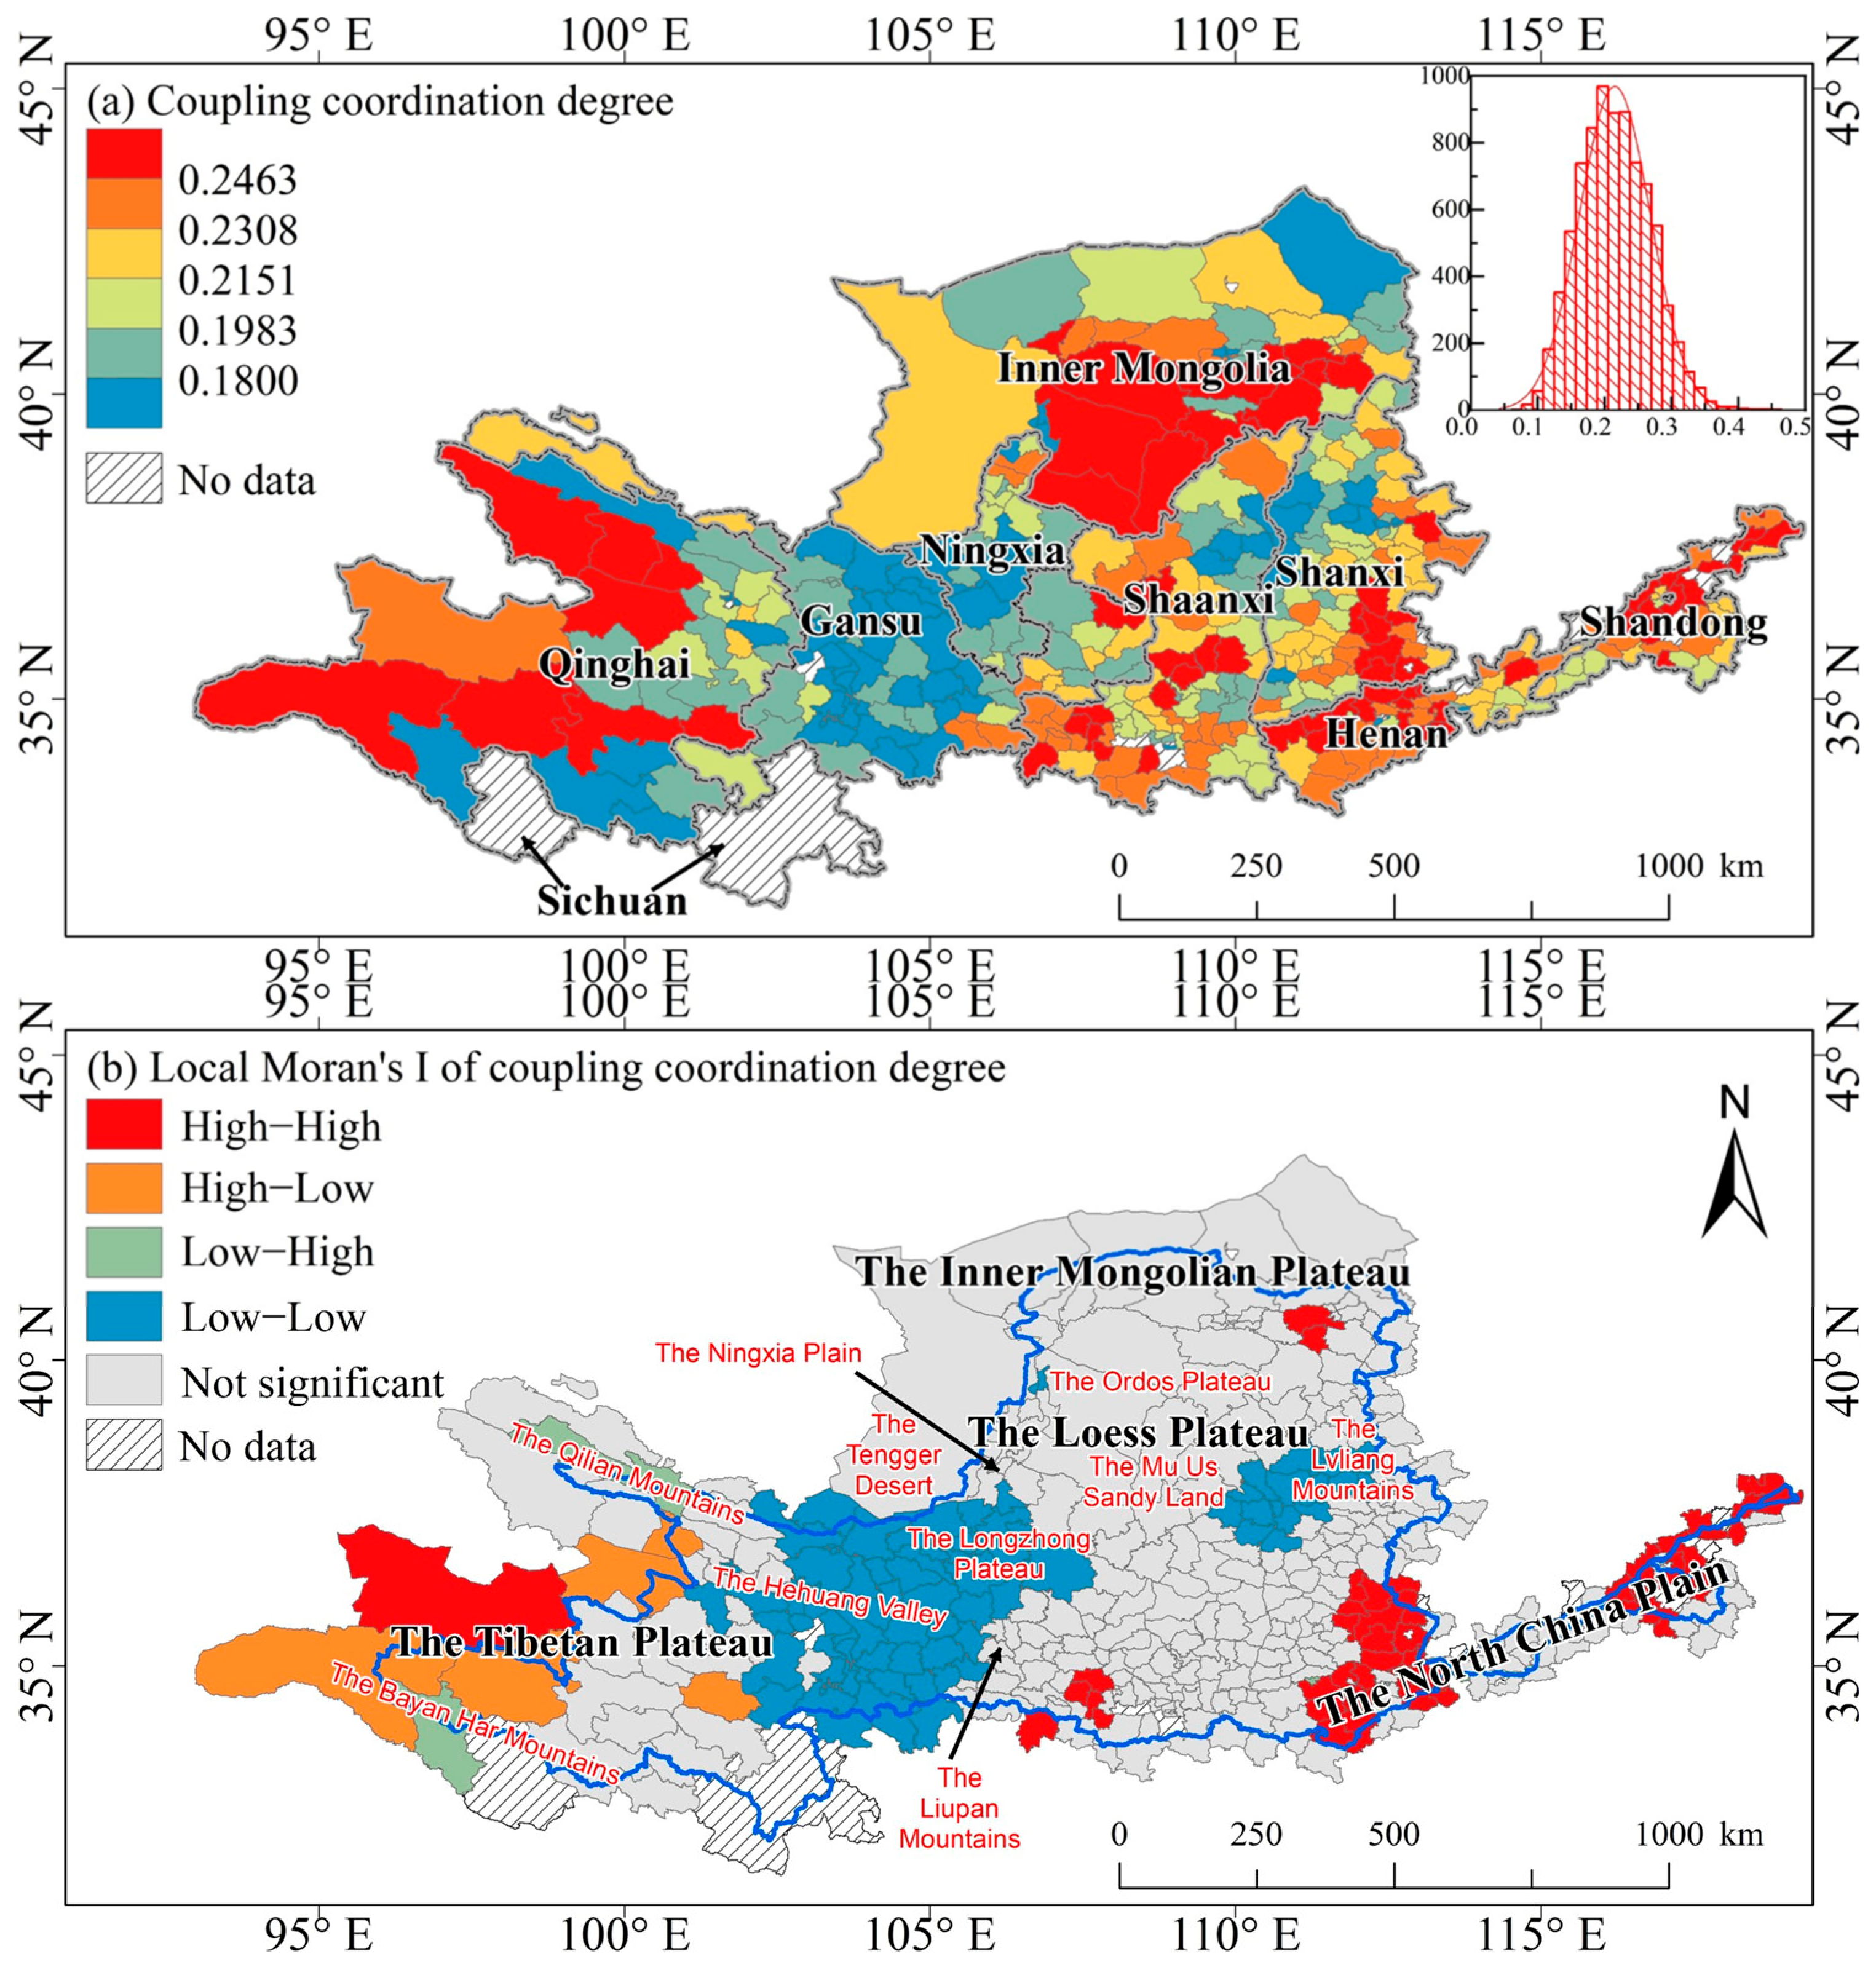
Figure 3 shows the spatial patterns of the ecological–economic–social coupling coordination degree and its Anselin Local Moran’s I across the basin during the period of 2001–2020. The coupling coordination degree ranged from 0.07 to 0.46, with an average value of 0.22 (as shown in the upper-right subfigure of Figure 3a). Counties with a high coupling coordination degree were located in the western part of the basin, encompassing the southern foothills of the Qilian Mountains to the northern foothills of the Bayan Har Mountains, the Ordos Plateau, the Zhongyuan urban agglomeration in Henan Province, and the Shandong Peninsula urban agglomeration. Counties with a low coupling coordination degree were concentrated in the mid-western part of the basin, covering the Hehuang Valley–Longzhong Plateau zone, and in the mid-eastern region, extending from the Lvliang Mountains to the eastern Mu Us Sandy Land zone.
In particular, the Anselin Local Moran’s I showed that the Zhongyuan and the Shandong Peninsula urban agglomerations exhibited pronounced High–High clustering patterns. In the western basin, Dulan County exhibited a High–High clustering pattern, while its four surrounding counties—Haiyan County, Gonghe County, Qumalai County, and Maduo County—showed High–Low clustering patterns. The Hehuang Valley–Longzhong Plateau and Lvliang Mountains–eastern Mu Us Sandy Land zones, however, exhibited pronounced Low–Low clustering patterns.
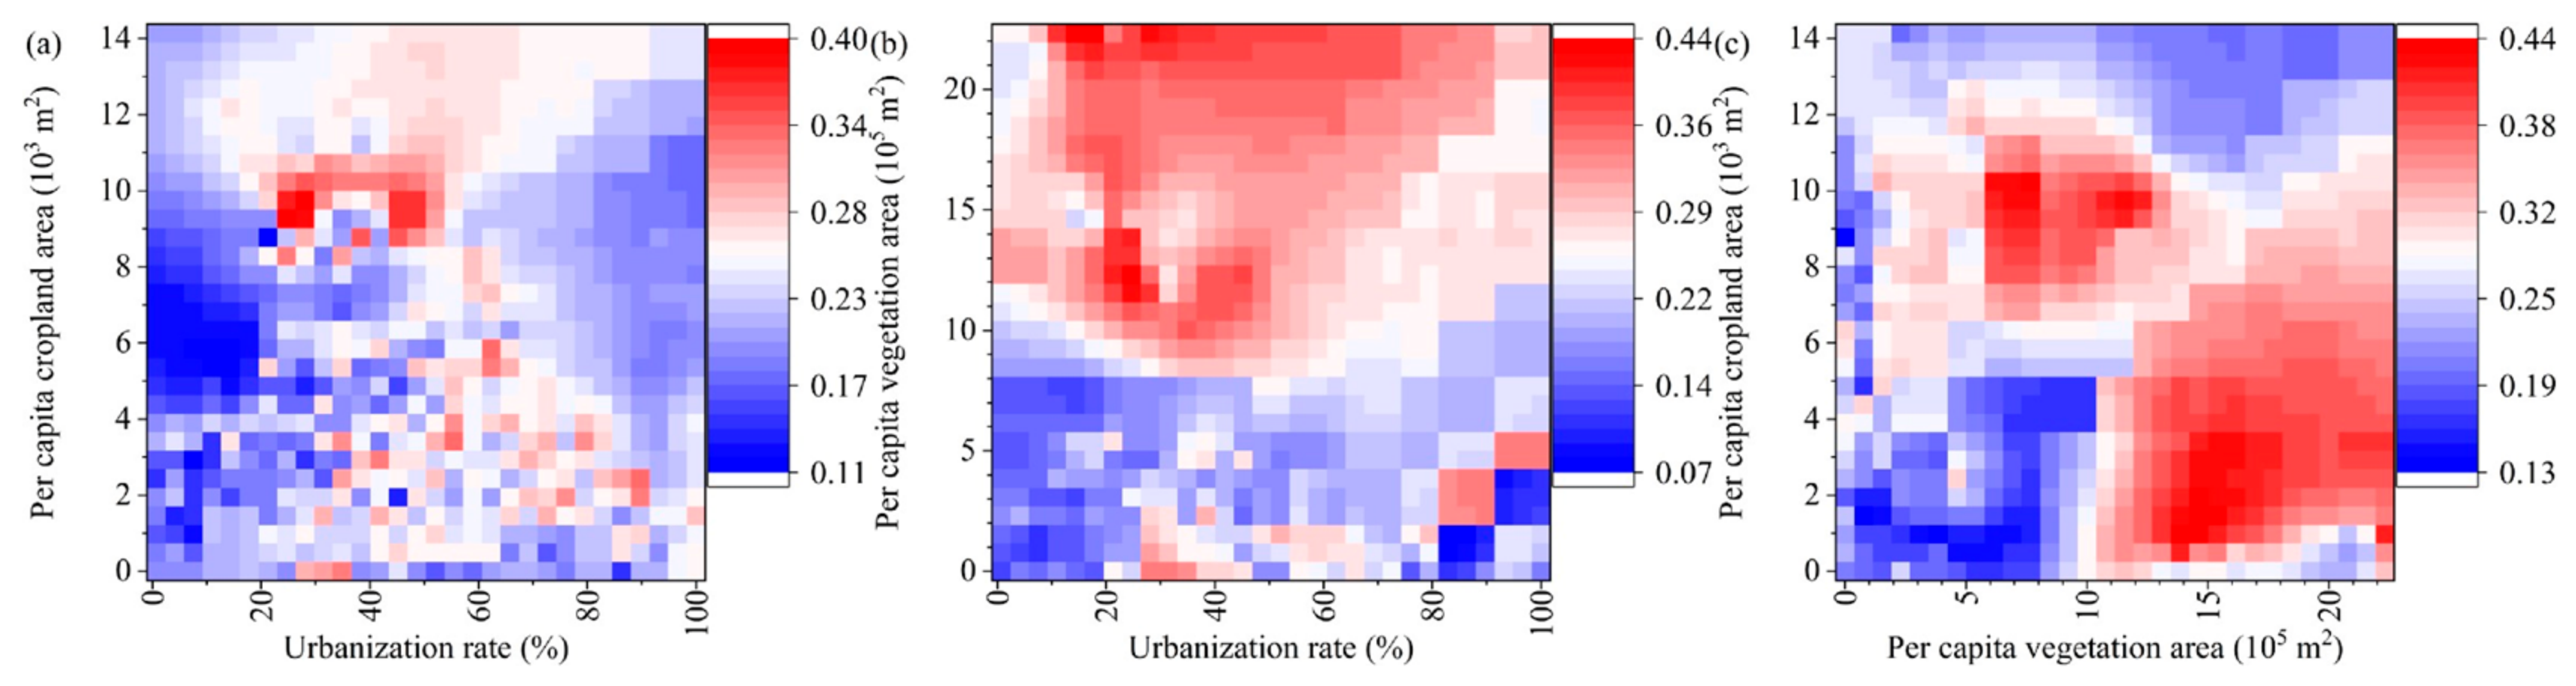
Figure 4a shows the coupling coordination degree in a two-dimensional graph of urbanization rate vs. per capita cropland area. Counties with a high coupling coordination degree were mainly located in the moderate urbanization rate (20–50%)–moderate cropland area (9–11 × 103 m2) zone. Counties with a low coupling coordination degree were located in the low urbanization–high cropland area and high urbanization–low cropland area zones. In the moderate urbanization–moderate cropland area zone, structural allocation of urban and cropland areas was more conducive to stronger coordination. In the low urbanization–high cropland area zone, the low urbanization level limited the agricultural development quality, despite the abundant agricultural resources in these counties. In the high urbanization–low cropland area zone, the agricultural production capacity was insufficient to support industrial development and population agglomeration in the county.
Figure 4b shows the coupling coordination degree in a two-dimensional graph of urbanization rate vs. per capita vegetation area. Counties with a high coupling coordination degree were mainly located in regions with a high vegetation area (>10 × 105 m2) and an urbanization rate of 20% to 50%. This indicates that a high per capita vegetation area was crucial for maintaining high coupling coordination. In contrast, in counties with a low per capita vegetation area, the conflict between urban expansion and insufficient vegetation area limited their sustainable development.
Figure 4c shows the coupling coordination degree in a two-dimensional graph of per capita vegetation area vs. per capita cropland area. Counties with a high coupling coordination degree were located in the high vegetation area (>12 × 105 m2)–low cropland area (<8 × 10³ m2) and moderate vegetation area (6 × 10⁵–12 × 105 m2)–high cropland area (7 × 10³–11 × 103 m2) zones. Counties with a low coupling coordination degree were located in the low vegetation area (<8 × 10⁵ m2)–low cropland area (<5 × 10³ m2) and high vegetation area (>12 × 105 m2)–high cropland area (>11 × 103 m2) zones.
In the high vegetation area–low cropland area zone, the sufficient vegetation area was capable of supporting socio–economic development despite the relatively limited cropland area. In the moderate vegetation area–high cropland area zone, the ecosystem and agricultural resources remained in a relatively balanced state, thereby providing ecosystem functions and agricultural resources to support sustainable development. In the low vegetation area–low cropland area zone, the insufficient vegetation and cropland areas resulted in weak ecosystem functions and inadequate agricultural resources to support sustainable development. In the high vegetation area–high cropland area zone, the urbanization rate was low and the effect of industrial development on coordinated ecological–economic–social development was insufficient.

3.2. Spatial Pattern of Changes in Coupling Coordination Degree

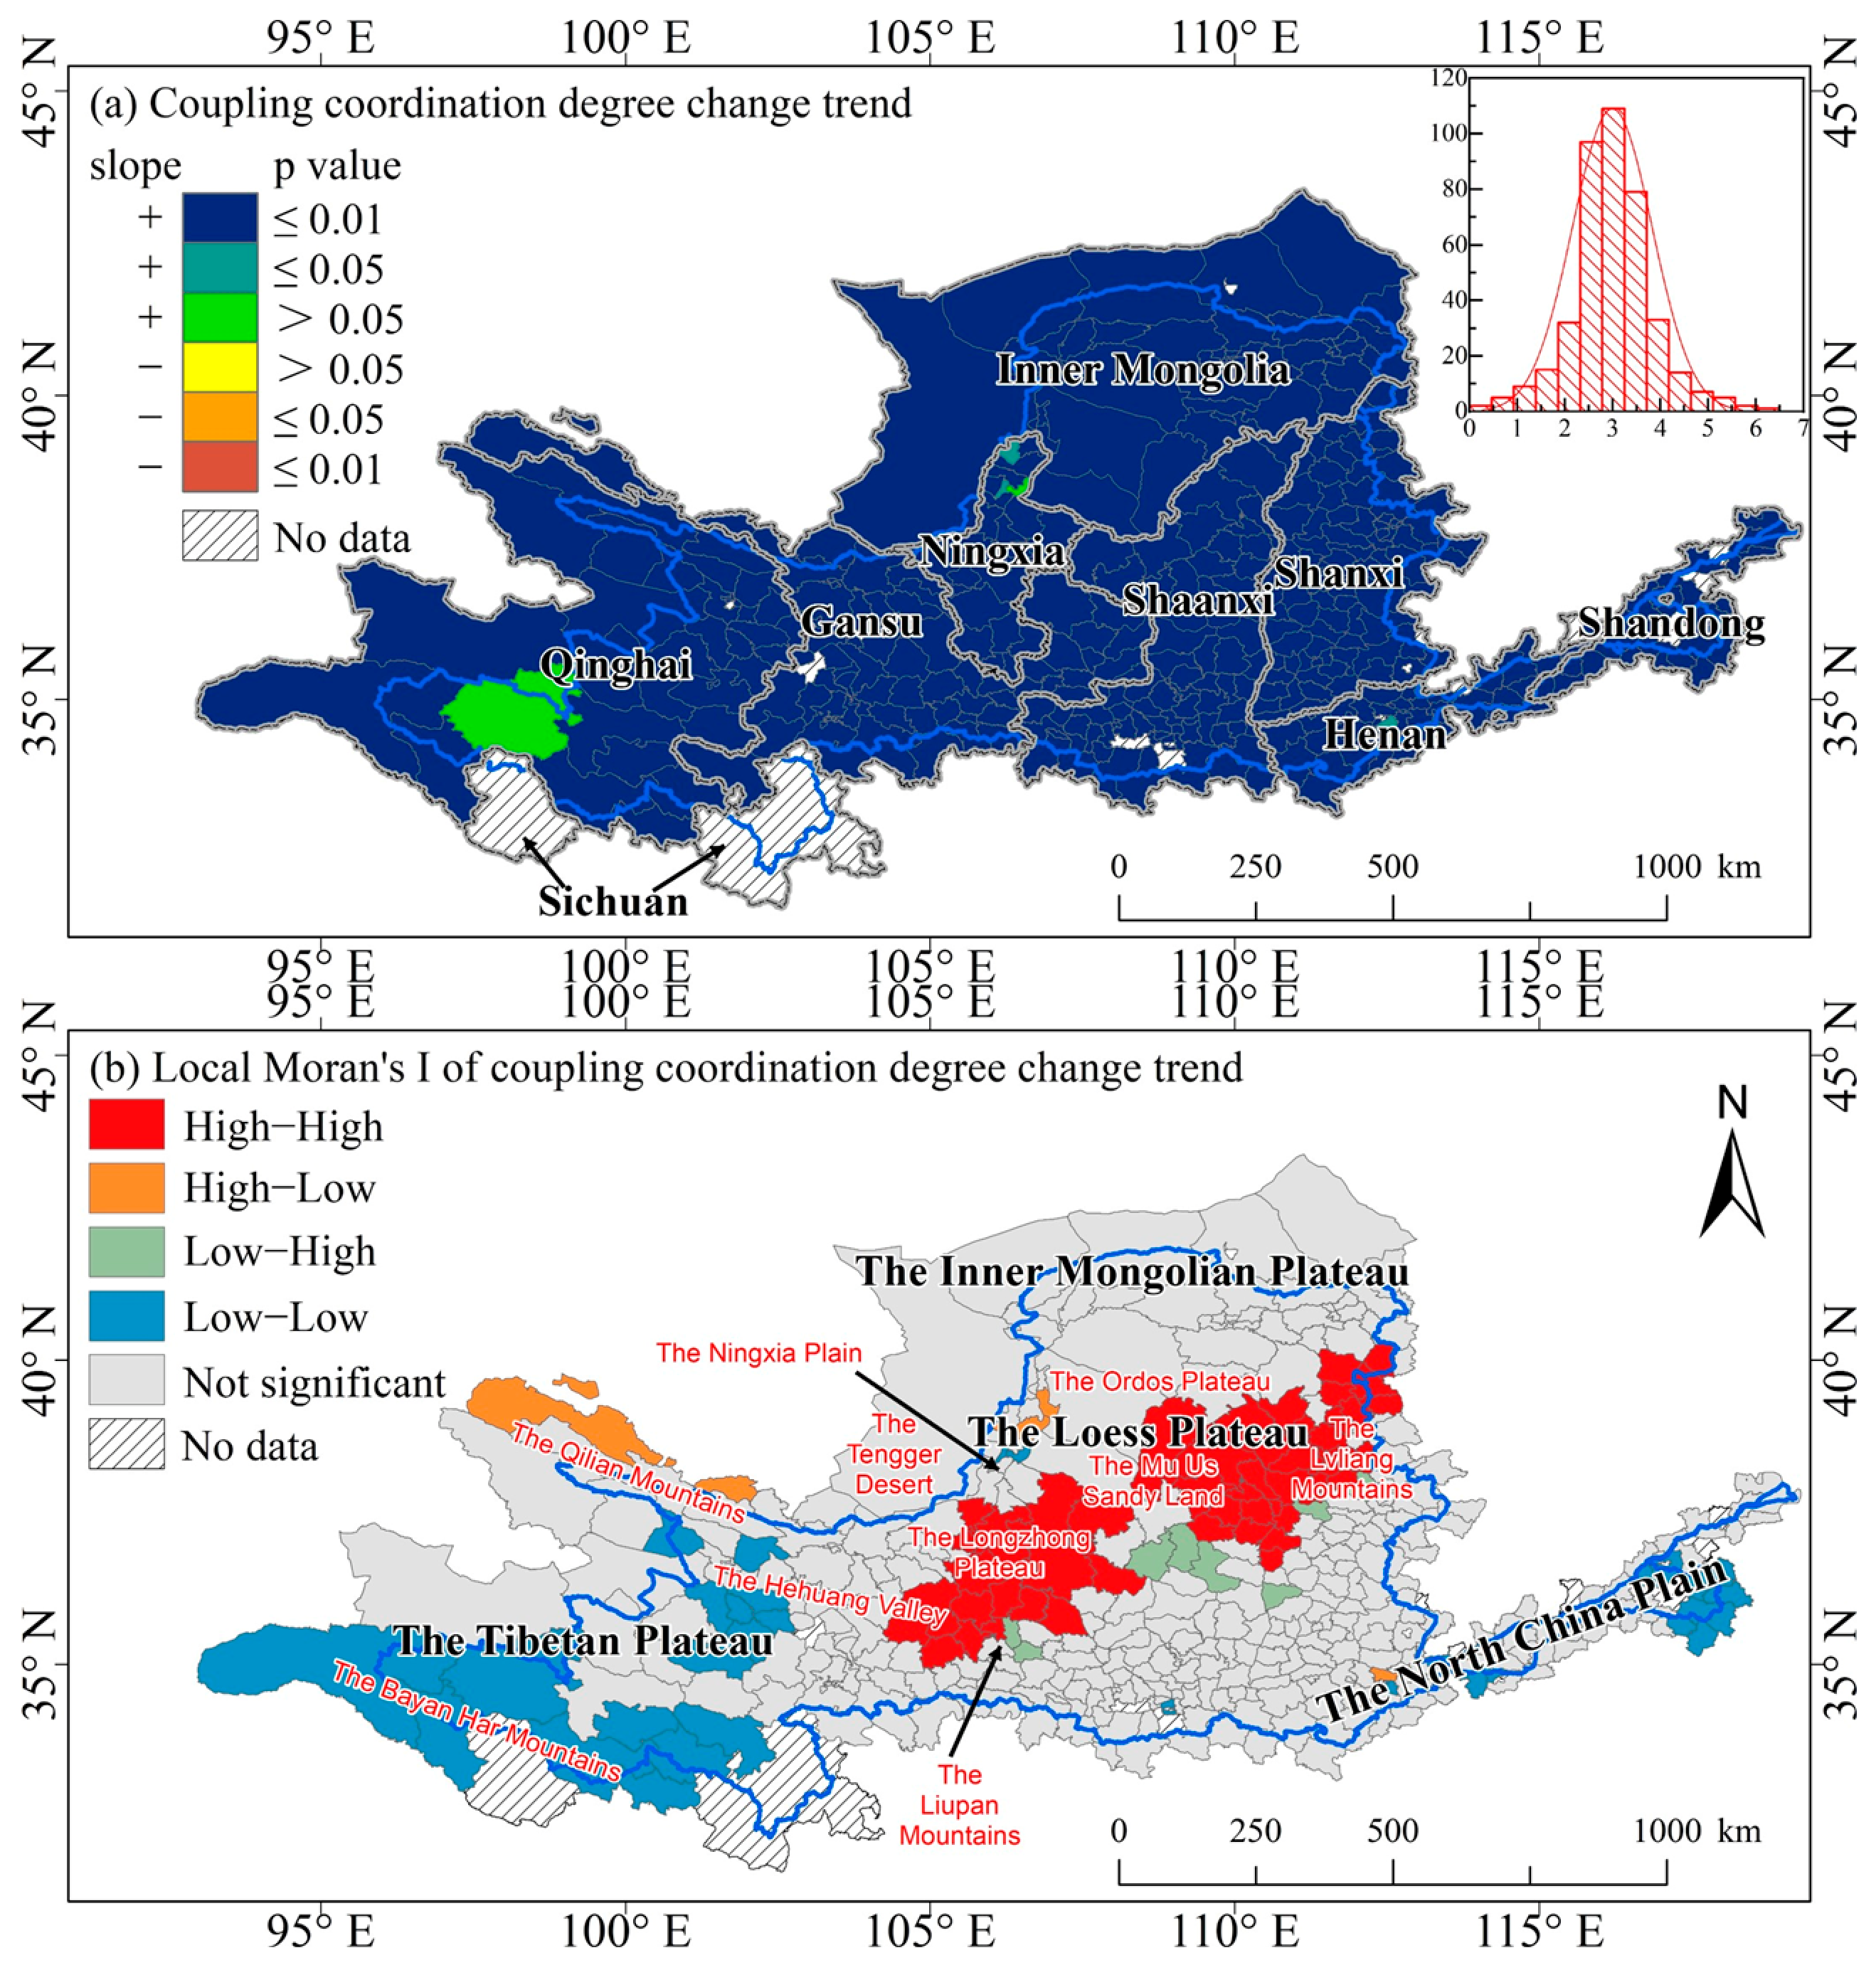
Figure 5 shows the spatial patterns of the changes in the coupling coordination degree and its Anselin Local Moran’s I across the basin. From 2001 to 2020, the coupling coordination degree increased significantly in all counties, with the exceptions of Maduo County in Qinghai Province and Xingqing County in Ningxia Autonomous Region (Figure 5a). The percentage change ranged from 0.31 to 6.08% year−1, with an average value of 2.99% year−1 (as shown in the upper-right subfigure of Figure 5a).
In particular, the Anselin Local Moran’s I showed that changes in the Lvliang Mountains–eastern Mu Us Sandy Land and the southern Mu Us Sandy Land–Longzhong Plateau–Liupan Mountains zones showed High–High clustering patterns (Figure 4b). The Lvliang Mountains–eastern Mu Us Sandy Land zone serves as a national-level energy and chemical industrial base and is a key region for environmental pollution control. The southern Mu Us Sandy Land–Longzhong Plateau–Liupan Mountains zone is located in the agro-pastoral ecotone of the Loess Plateau, and is a priority region for ecological protection and restoration. The source region of the Yellow River showed Low–Low clustering. This region is a priority area for ecological restoration, where ecological protection and restoration take priority over socio-economic development, resulting in a smaller increase in coupling coordination degree than in other regions.
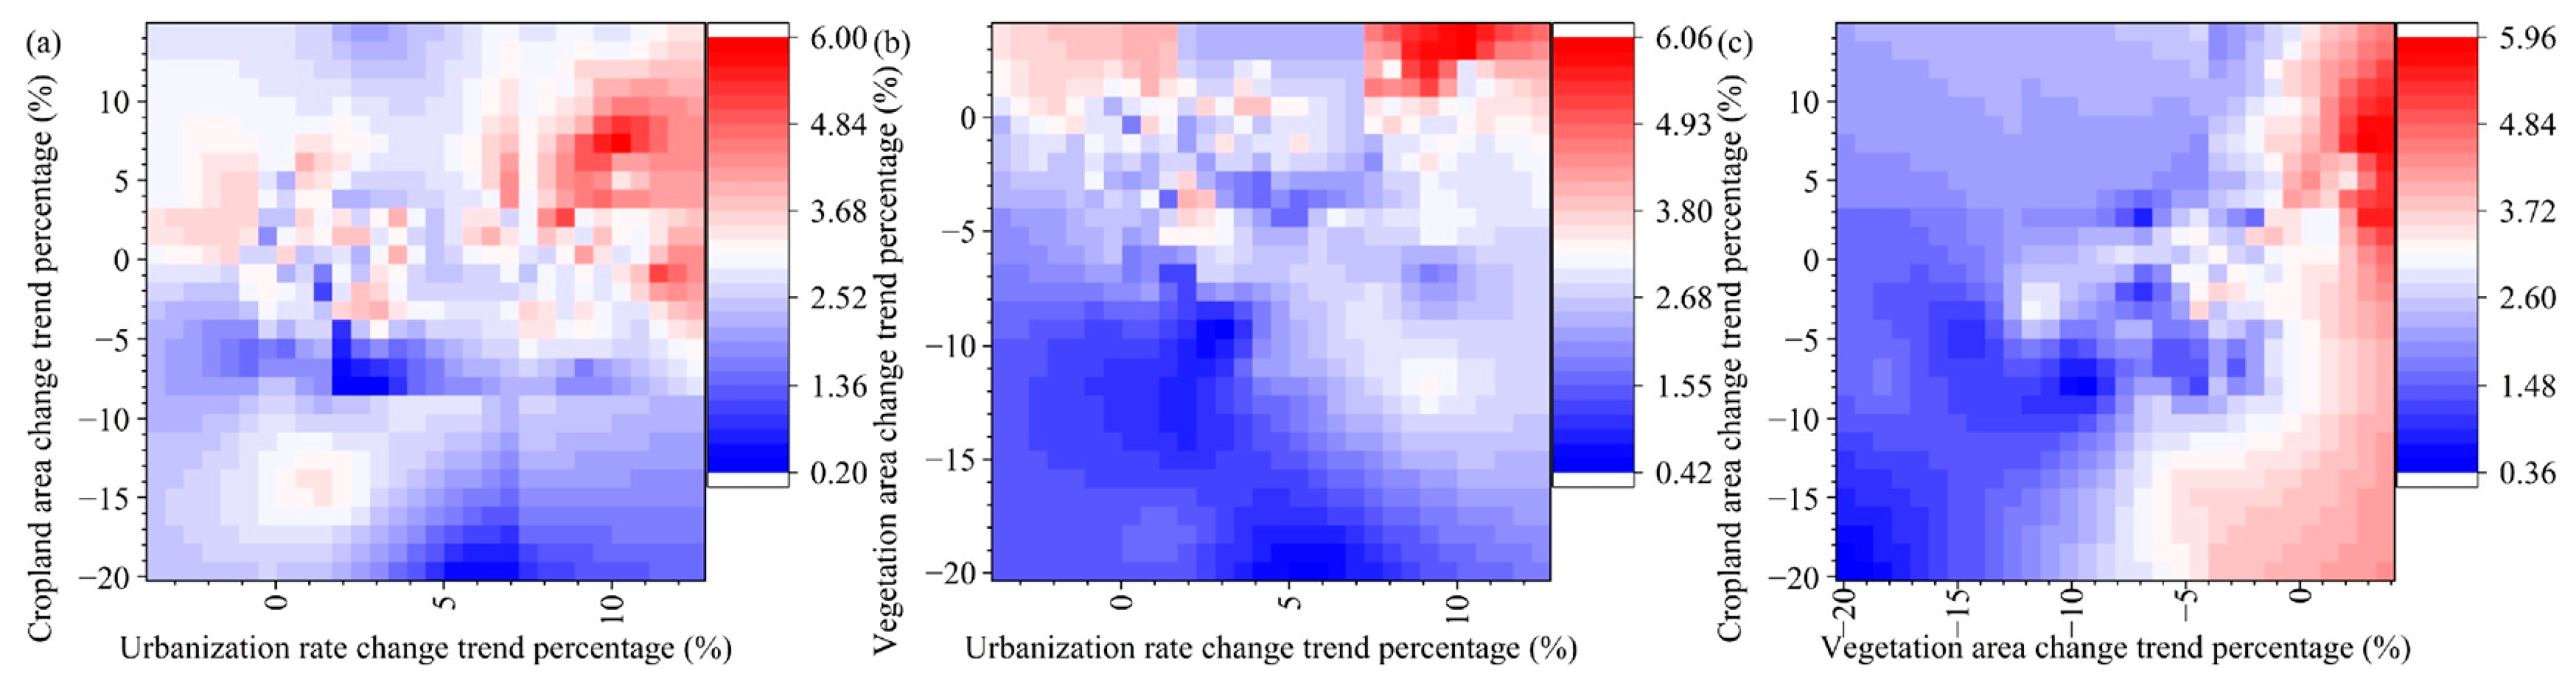
Figure 6a shows the percentage change in the coupling coordination degree in a two-dimensional graph of the percentage change in urbanization rate vs. per capita cropland area. Counties with a high percentage change were located in the urban expansion (>8%)–stable/increasing cropland area (≥0%) zone, while counties with a low percentage change were located in the urban expansion (>5%)–cropland reduction (<−11%) zone. In the former zone, coordination between urban expansion and stable growth in cropland reconciled the conflicts between industry, humans, and food security. In the latter, urban expansion encroached on cropland, intensifying the human–land conflict and undermining food security.
Figure 6b shows the percentage change in the coupling coordination degree in a two-dimensional graph of the percentage change in urbanization rate vs. per capita vegetation area. Counties with a high percentage change were located in the urban expansion (>8%)–stable/increasing vegetation area (≥0%) zone. Counties with a low percentage change were located in the urban expansion–vegetation reduction zone, which is located in the lower-left triangular zone delineated by the line connecting the starting point (x-value: minimum percentage change in urbanization rate; y-value: 0% change in per capita vegetation area) to the endpoint (x-value: maximum percentage change in urbanization rate; y-value: minimum percentage change in per capita vegetation area). In the urban expansion–stable/increasing vegetation area zone, the urbanization process enhanced industrial development and population agglomeration, while the implementation of ecological restoration expanded the vegetation area to support socio-economic development. In the urban expansion–vegetation reduction zone, urbanization encroached on the vegetation area, thereby weakening the support capacity of ecosystem services for socio-economic development.
Figure 6c shows the percentage change in the coupling coordination degree in a two-dimensional graph of the percentage change in per capita vegetation area vs. per capita cropland area. Counties with a high percentage change were located in regions where vegetation area and cropland area showed a stable or increasing trend (≥0%). Counties with a low percentage change were located in regions where vegetation (≤−10%) and cropland (≤−5%) areas showed decreasing trends. The capacity of ecosystem services and agricultural resources were enhanced in counties where vegetation and cropland areas showed a stable or increasing trend, but were weakened in counties where vegetation and cropland areas showed a decreasing trend.

3.3. Effects of Human Land Use Changes and Ecological Restoration on Changes in Coupling Coordination Degree

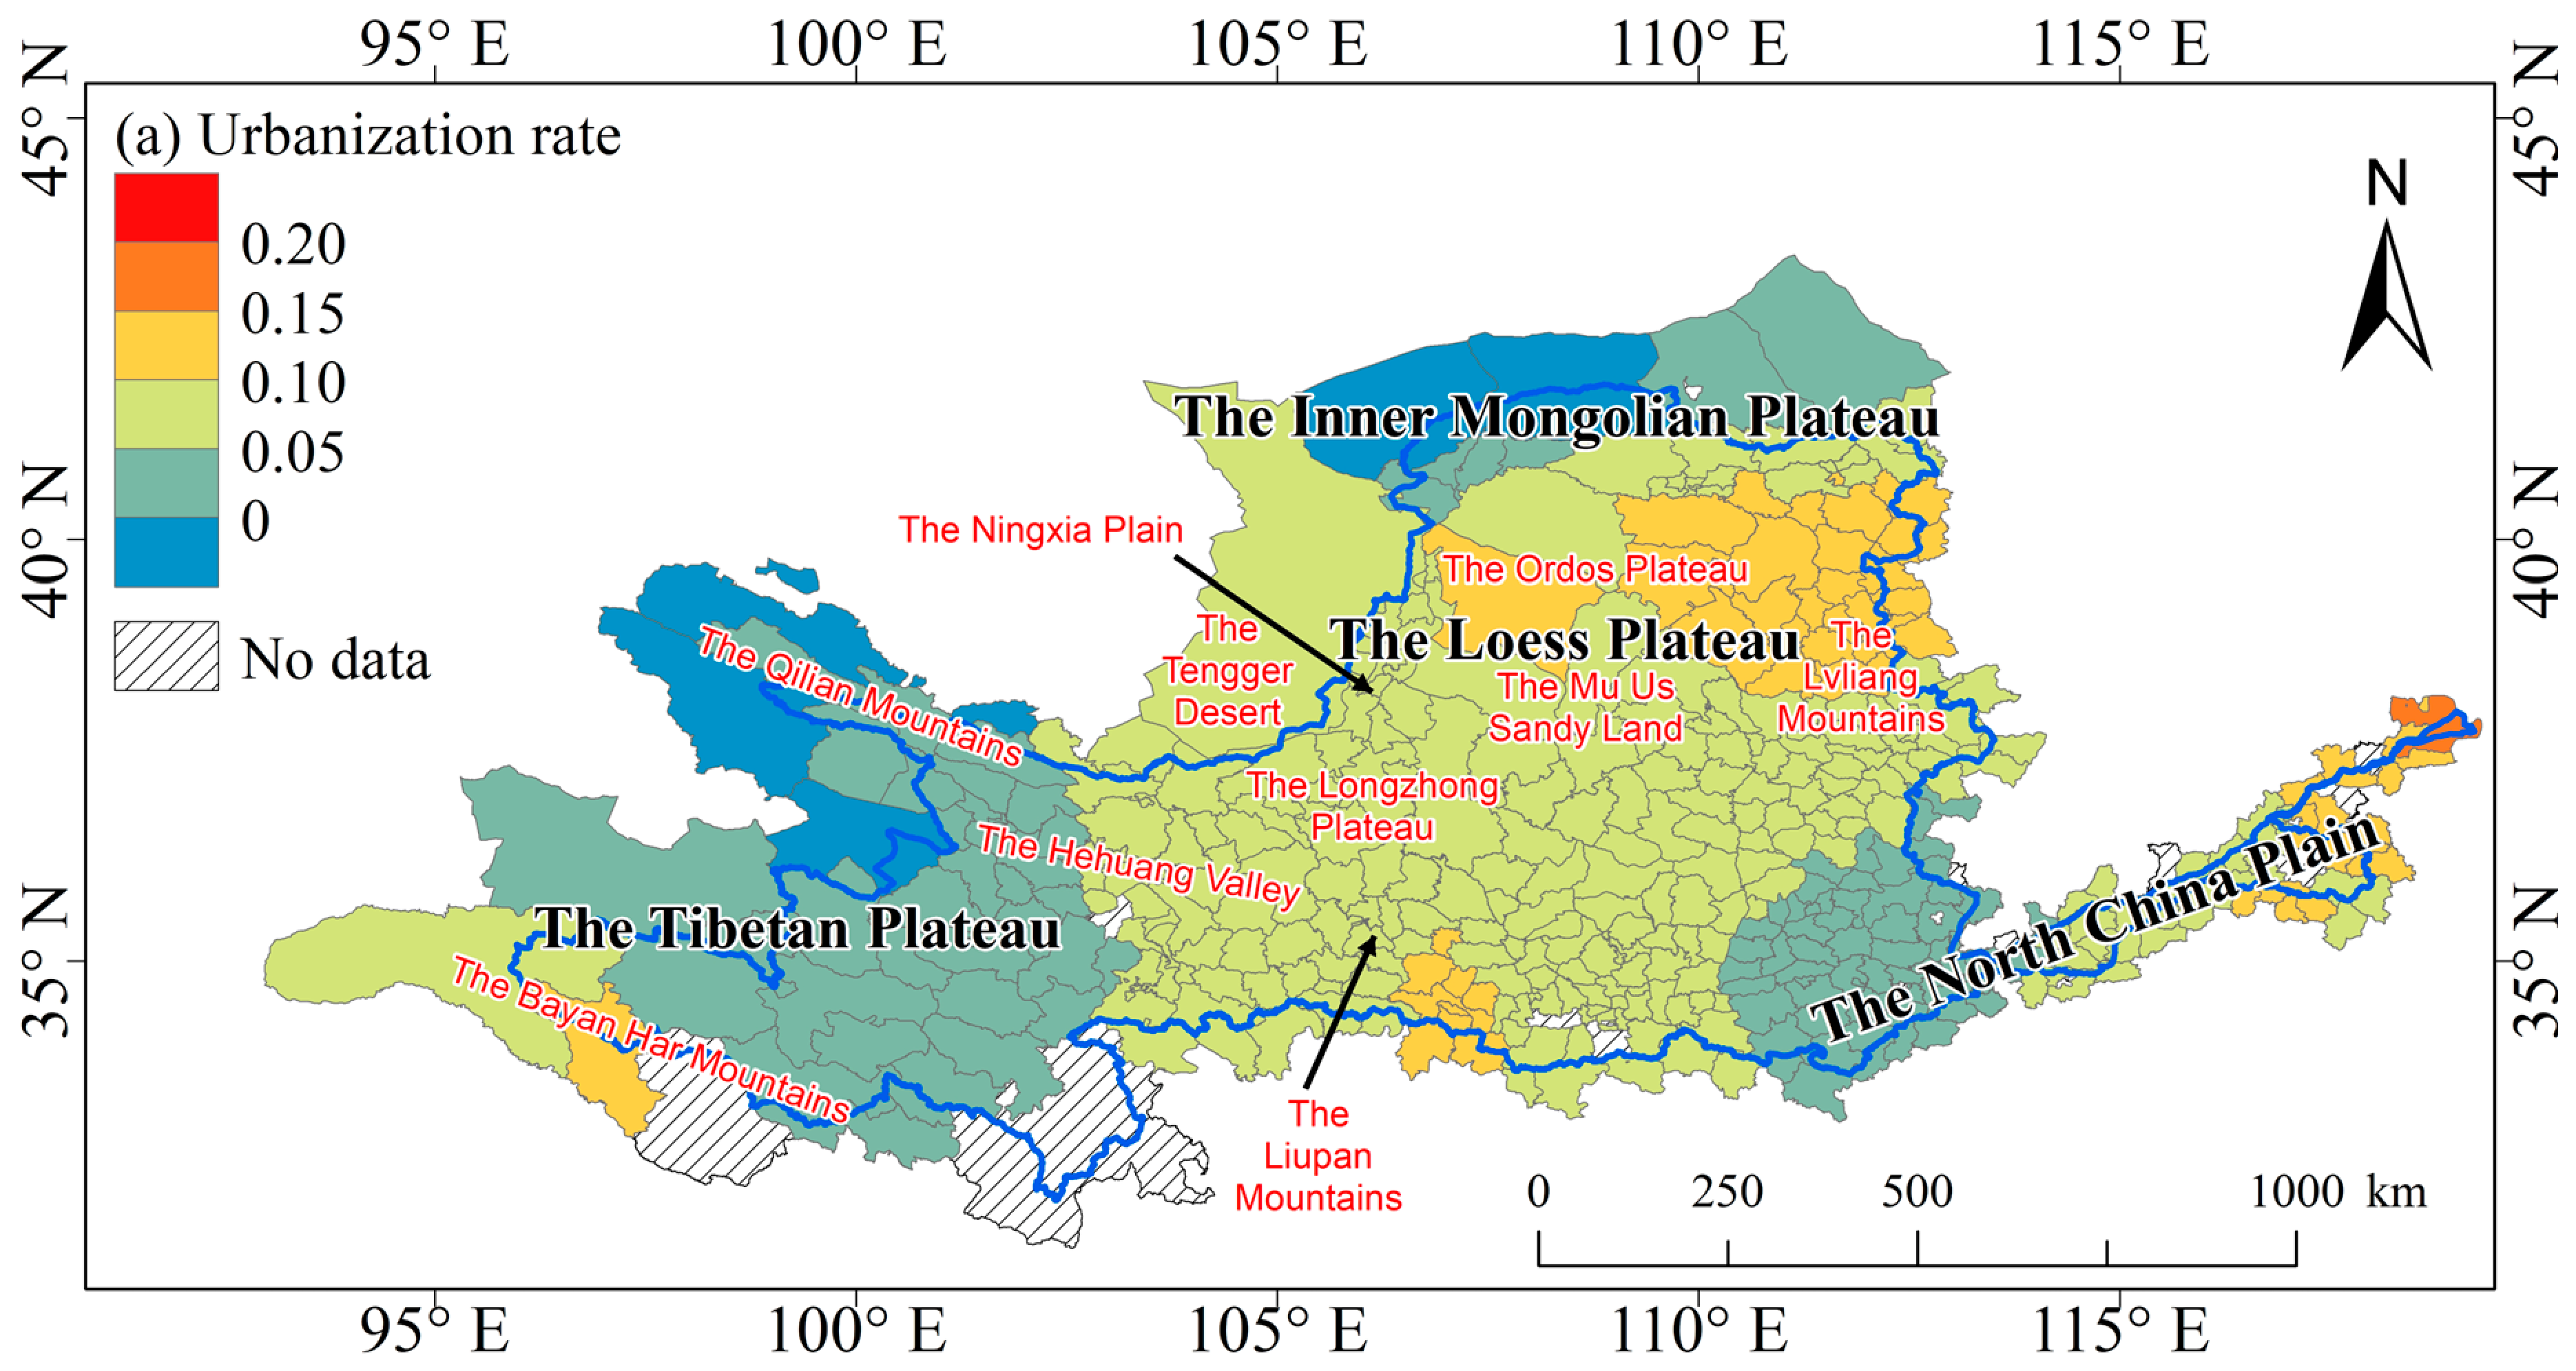
Figure 7a shows the geographically weighted regression coefficients for the effect of percentage change in urbanization rate on that of coupling coordination degree. The coefficient was high in the lower reaches and the northeastern part of the middle reaches but was low in the upper reaches and the southeastern part of the middle reaches. The eastern part of the Shandong Peninsula urban agglomeration in the lower reaches is the most economically and societally developed area in the basin. Urbanization in this region advances resource allocation and regional sustainable development. The northeastern part of the middle reaches, encompassing the Lvliang Mountains, the eastern Ordos Plateau, and the northern Mu Us Sandy Land, serves as a national-level energy and chemical industrial base, where industrial agglomeration is more evident. The northeastern margin of the Qinghai–Tibet Plateau and the southern Inner Mongolia Plateau in the upper reaches are the vital ecological security barrier in China, where the effect of urbanization development on changes in the coupling coordination degree was weaker than in other regions. Although the Zhongyuan urban agglomeration in the southeastern part of the middle reaches is the most economically and societally developed area in the middle reaches, it exhibited a weaker effect of urbanization changes on changes in the coupling coordination degree.
Figure 7b shows the geographically weighted regression coefficients for the effect of percentage change in cropland area on that of the coupling coordination degree. The coefficient was high in the southwestern part of the middle reaches but was low in the northwestern part of the middle reaches and the lower reaches. The southwestern part of the middle reaches, located in the Liupan Mountains area, experienced increases in cropland area, which had a positive effect on the coupling coordination degree. In the northwestern part of the middle reaches, encompassing the Hehuang Valley and Ningxia Plain, the cropland area was reduced. Cropland areas in the eastern Tengger Desert–southwestern Mu Us Sandy Land zone and the Shandong Peninsula urban agglomeration expanded, exerting a negative effect on the coupling coordination degree.
Figure 7c shows the geographically weighted regression coefficients for the effect of percentage change in vegetation area on that of the coupling coordination degree. The coefficient was high in the upper and middle reaches but was low in the lower reaches. In the upper and middle reaches, the sustained implementation of ecological protection and restoration programs expanded the vegetation area and increased the coupling coordination degree. This promotion was evident in the southwestern Hehuang Valley and eastern Tengger Desert–Mu Us Sandy Land–Lvliang Mountains zone. In the Shandong Peninsula urban agglomeration in the lower reaches, the vegetation area was continuously compressed, exerting a negative effect on the coupling coordination degree.

4. Discussion

4.1. Efficiency and Future Application of the Framework

In this study, we employed complex system theory to investigate the coupling coordination between the fragile ecosystem and socio-economic development in the Yellow River Basin, which is a crucial ecological security barrier and major human settlement region in China [2,44]. Several previous studies deconstructed the basin’s complex system into different subsystems using provincial- or municipal-level panel data and applied the coupling coordination degree model or nexus model to assess the interactions [15,18,45]. However, due to data constraints, including coarse spatial resolutions, limited ecological indicators, and extensive missing data, some previous studies selected distinctive core factors derived from remote sensing data or model simulation results [34,46], and inadequately characterized the system.
In contrast to these studies, we defined the basin’s complex system as an ecological–economic–social system and constructed an index system based on ecosystem and socio-economic development characteristics to generate an improved index system. To obtain higher-resolution coupling coordination degree results, we used county-level panel data with a low missingness rate and utilized multi-source satellite remote sensing data to compensate for the indicator deficiencies. The selected satellite remote sensing data have been widely used in global sustainable development studies. The JRC GSW data provide high-resolution, high-accuracy surface water observations for water resource management and flood control [47,48]. The MODIS NPP and LAI data are effective indicators for ecosystem function and vegetation activity [49,50]. The Landscan data offer consistent long-term active population density data that can be used to assess social vitality and population migration [51]. We also analyzed the effects of changes in urbanization rate, cropland area, and vegetation area on the coupling coordination degree to explore how to resolve conflicts between the basin’s fragile ecosystem and intense human activity to achieve sustainable development across the basin. This framework allowed us to assess the coupling coordination in a basin complex system, and the results show that integrating multi-source datasets is a feasible approach for global sustainable development studies.

4.2. Divergent Characteristics of the Coupling Coordination Relationship

We found that counties with high ecological–economic–social coupling coordination were mainly concentrated in the lower reaches. Since 2001, the coupling coordination degree has experienced a significant increasing trend overall. Our findings are consistent with those of previous studies [11,12,13,14], while providing more detailed results. The lower reaches are located in a warm temperate monsoon climate zone, characterized by sufficient hydrothermal conditions and high ecosystem quality [34]. Meanwhile, these counties are the most economically and societally developed areas in the basin, with the best economic conditions and the densest populations [52]. The high ecosystem quality and socio–economic development level led to the high coupling coordination. Counties with low coupling coordination were distributed in the Hehuang Valley–Longzhong Plateau–Ningxia Plain and Lvliang Mountains–eastern Mu Us Sandy Land zones. These zones are ecologically fragile areas: the former is situated in an agro-pastoral ecotone, where the economy relies on agriculture and pastoralism [53,54], while the latter is an energy and chemical industry base. Conflict between the fragile ecosystem and industrial development resulted in the low coupling coordination degree. To advance sustainable development, the Natural Forest Protection Project (started in 1998), Grain for Green Program (started in 2000), and Three-North Shelter Forest Program (started in 1978) have been implemented to achieve coordinated improvement of ecosystems and human well-being [23,55]. The continued implementation of the national ecological protection and restoration programs has promoted the two zones to High–High clustering areas for changes in the coupling coordination degree.
The coupling coordination patterns along the two-dimensional graphs of urbanization rate vs. per capita vegetation area, urbanization rate vs. per capita cropland area, and per capita vegetation area vs. per capita cropland area indicate that changes to human land use and vegetation area could support sustainable development in ecologically fragile areas of the basin. Most counties in the upper and middle reaches are located in arid and semi-arid climate zones, where ecosystems are sensitive to climate change and human activity [29,34]. Therefore, adequate cropland and vegetation areas should be preserved to sustain urbanization through adequate food security and ecosystem functions, and urban areas must be regulated with an appropriate range [15]. In this study, we identified a target range of 20–50% but this is primarily applicable to counties in the upper and middle reaches. In the upper and middle reaches, over-extended urbanization has led to encroachment of built-up land into cropland and vegetation areas, intensifying conflicts between industry, human populations, food production, and ecosystems [22].
The percentage change in coupling coordination degree along the two-dimensional graphs of percentage change in urbanization rate vs. per capita vegetation area, urbanization rate vs. per capita cropland area, and per capita vegetation area vs. per capita cropland area indicated potential management directions for human land use and ecological restoration processes in ecologically fragile areas of the basin. In the context of urban expansion, stable or increased cropland and vegetation areas promoted ecological–economic–social coupling coordination. On the one hand, urban expansion brings about industrial development and population agglomeration, which increase employment and improve human well-being [17]. On the other hand, urban built-up land encroaches upon cropland and vegetation areas. Ecological restoration can not only expand the vegetation area but also reserve land resources for managing the “occupation–compensation balance” of the encroached cropland [56]. Ecological restoration plays a crucial role in reconciling human–land conflicts, making it the key factor in improving the coupling coordination degree. If vegetation and cropland areas decrease, ecosystem services and agricultural resources could become limited, and regional sustainable development becomes more dependent on external inputs to compensate [57].

4.3. Core Role of Ecological Protection and Restoration in Sustainable Development in the Basin

The geographically weighted regression results further confirmed the role of ecological restoration and cropland management. Ecological restoration plays a dominant role in strengthening the coupling coordination degree in the upper and middle reaches. As critical ecological security barriers, the upper and middle reaches have been continuously implementing ecological protection and restoration programs. These programs have not only provided ecosystem services for economic and societal development by enhancing water and soil conservation [58], but have also improved the well-being of rural residents by promoting employment and the development of locally distinctive agriculture, pastoralism, and ecotourism [59]. These effects are especially evident in the Hehuang Valley on the northeastern Tibetan Plateau, and in the eastern Tengger Desert–Mu Us Sandy Land–Lvliang Mountain zone.
The effect of cropland changes on changes in the coupling coordination degree exhibited spatial heterogeneity. The Liupan Mountains area, located in the southwestern part of the middle reaches, is an agricultural zone. Long-term cultivation has led to soil erosion and ecological degradation [60]. Since 2001, this region has been implementing cropland fragmentation and quality governance strategies, and refining local distinctive agriculture development, which have improved agriculture development quality, supporting economic and societal development [60]. The Hehuang Valley and Ningxia Plain have the densest populations and the most developed agriculture in Qinghai Province and Ningxia Province, respectively. Cropland reduction and fragmentation have limited the coupling coordination degree in these areas [46]. The eastern Tengger Desert–southwestern Mu Us Sandy Land zone is characterized by a fragile ecosystem and water scarcity. Cropland expansion has encroached on vegetation areas and exacerbated water scarcity [61], which has intensified human–land conflict and suppressed the coupling coordination degree in this zone. In the Shandong Peninsula urban agglomeration, cropland expansion encroached on vegetation areas [62], which had a negative impact on the coupling coordination degree.
Urban expansion has strengthened the coupling coordination degree in the middle and lower reaches, particularly in the eastern Shandong Peninsula urban agglomeration and the energy and chemical industry base in the northeastern part of the middle reaches. Urbanization has not only promoted industrial structure upgrading but also enhanced the environmental governance capacity in these zones [17,20]. The ecological protection implemented in the upper reaches has limited the effect of urban expansion on coupling coordination.
Notably, the changes in vegetation and green areas were driven by the combined effects of human land use, CO2 fertilization, climate change, nitrogen deposition, and natural recovery [50]. In China, vegetation area expansion and greening are largely driven by ecological restoration programs in ecologically fragile areas, which have been associated with mitigation of vegetation degradation and climate change effects [63]. Consequently, we used the change in vegetation area (including forest and grassland areas) to indicate ecological restoration in the driving effect analysis. In addition, the multi-source satellite remote sensing data used in the study were aggregated with county-level data to achieve spatial integration with the panel data. Our findings are limited to the administrative scale, and a finer research scale is needed in future studies.

5. Conclusions

In this study, we integrated multi-source satellite remote sensing data with county-level panel data to assess the ecological–economic–social coupling coordination degree and its change trend across the Yellow River Basin during the period of 2001–2020 and investigated the effects of human land use changes and ecological restoration on the coupling coordination degree. Our conclusions are as follows:
The overall ecological–economic–social coupling coordination degree was low, with an average value of 0.22, but experienced a significant increase between 2001 and 2020. Counties with a high coupling coordination degree were mainly concentrated in the lower reaches, areas with high ecosystem quality and socio-economic development levels, while counties with a low coupling coordination degree were mainly located in the upper and middle reaches, which have fragile ecosystems.
Adequate cropland and vegetation areas should be preserved to sustain regional sustainable development across the basin. In the context of urban expansion, increasing or maintaining stable cropland and vegetation areas was essential for safeguarding food security and the provision of ecosystem services.
Ecological restoration played a dominant role in strengthening coupling coordination in the upper and middle reaches. The continuous implementation of ecological protection and restoration programs enhanced ecosystem services for sustainable development and improved the well-being of rural residents in these regions.
This study not only investigated the effects of human land use changes and ecological restoration on ecological–economic–social coupling coordination across the study area but also provided a method for deconstructing the basin’s complex system by integrating multi-source datasets, which could be used in future global sustainable development studies. However, these findings are confined to the internal coupling coordination relationship at the administrative scale; future studies will need to refine a framework and the associated methods to assess the coupling coordination relationship of cross-administrative regions and develop multi-source Big Earth Data to support them.

Supplementary Materials

The following supporting information can be downloaded at: https://www.mdpi.com/article/10.3390/land15091729/s1, Table S1. Statistical results of multiple linear regression; Table S2. Statistical results of multicollinearity diagnostics; Table S3. Geostatistical results of Geographically Weighted Regression; Table S4. Geostatistical results of Ordinary Least Squares.

Author Contributions

Conceptualization, J.T. and G.Z.; methodology, J.T.; formal analysis, Y.L. and H.C.; data curation, M.Y.; writing—original draft preparation, Y.L.; writing—review and editing, J.T. and S.Z.; visualization, H.C.; project administration, G.Z.; funding acquisition, J.T. All authors have read and agreed to the published version of the manuscript.

Funding

This research was funded by the Humanities and Social Sciences Fund of the Ministry of Education of China, grant number 21YJAZH080; the National Social Science Fund of China, grant number 22BGL017; the Development Research Center of the National Forestry and Grassland Administration of China, grant number JYC–2025–0006; Scientific Research Fund of Shandong Technology and Business University, grant number BS2026048.

Data Availability Statement

The data presented in this study are available upon request from the first author.

Conflicts of Interest

The authors declare no conflicts of interest.

References

  1. Wang, S.; Fu, B.; Piao, S.; Lü, Y.; Ciais, P.; Feng, X.; Wang, Y. Reduced sediment transport in the Yellow River due to anthropogenic changes. Nat. Geosci. 2016, 9, 38–41. [Google Scholar] [CrossRef] [Scilit]
  2. Janku, A. China: A hydrological history. Nature 2016, 536, 28–29. [Google Scholar] [CrossRef] [Scilit]
  3. Bryan, B.A.; Gao, L.; Ye, Y.; Sun, X.; Connor, J.D.; Crossman, N.D.; Stafford-Smith, M.; Wu, J.; He, C.; Yu, D.; et al. China’s response to a national land-system sustainability emergency. Nature 2018, 559, 193–204. [Google Scholar] [CrossRef] [Scilit]
  4. Wang, H.; Sun, F. Variability of annual sediment load and runoff in the Yellow River for the last 100 years (1919–2018). Sci. Total Environ. 2021, 758, 143715. [Google Scholar] [CrossRef] [Scilit]
  5. Chen, B.; Zhang, X.; Tao, J.; Wu, J.; Wang, J.; Shi, P.; Zhang, Y.; Yu, C. The impact of climate change and anthropogenic activities on alpine grassland over the Qinghai-Tibet Plateau. Agric. For. Meteorol. 2014, 189, 11–18. [Google Scholar] [CrossRef] [Scilit]
  6. Lan, H.; Peng, J.; Zhu, Y.; Li, L.; Pan, B.; Huang, Q.; Li, J.; Zhang, Q. Research on geological and surfacial processes and major disaster effects in the Yellow River Basin. Sci. China Earth Sci. 2022, 65, 234–256. [Google Scholar] [CrossRef] [Scilit]
  7. Nie, J.; Stevens, T.; Rittner, M.; Stockli, D.; Garzanti, E.; Limonta, M.; Bird, A.; Andò, S.; Vermeesch, P.; Saylor, J.; et al. Loess Plateau storage of Northeastern Tibetan Plateau-derived Yellow River sediment. Nat. Commun. 2015, 6, 8511, Correction in Nat. Commun. 2016, 7, 10831. [Google Scholar] [CrossRef] [Scilit]
  8. Fu, B.; Wang, S.; Liu, Y.; Liu, J.; Liang, W.; Miao, C. Hydrogeomorphic Ecosystem Responses to Natural and Anthropogenic Changes in the Loess Plateau of China. Annu. Rev. Earth Planet. Sci. 2017, 45, 223–243. [Google Scholar] [CrossRef] [Scilit]
  9. Peng, J.; Chen, S.; Dong, P. Temporal variation of sediment load in the Yellow River basin, China, and its impacts on the lower reaches and the river delta. Catena 2010, 83, 135–147. [Google Scholar] [CrossRef] [Scilit]
  10. Yu, B.; Zang, Y.; Wu, C.; Zhao, Z. Spatiotemporal dynamics of wetlands and their future multi-scenario simulation in the Yellow River Delta, China. J. Environ. Manag. 2024, 353, 120193. [Google Scholar] [CrossRef] [Scilit]
  11. Sui, G.; Wang, H.; Cai, S.; Cui, W. Coupling coordination analysis of resources, economy, and ecology in the Yellow River Basin. Ecol. Indic. 2023, 156, 111133. [Google Scholar] [CrossRef] [Scilit]
  12. Ma, L.; Zhao, X.; Yan, B.; Fan, J.; Wang, M.; Liu, M. How does the coupling coordination between high-quality development and eco-environmental carrying capacity in the Yellow river basin over time? Front Environ. Sci. 2024, 12, 1403265. [Google Scholar] [CrossRef] [Scilit]
  13. Pang, B.; Li, X.; Fu, Y. Coupling coordination analysis and obstacle factors of water-energy-environment-economy in the Yellow River Basin. J. Clean. Prod. 2024, 468, 143108. [Google Scholar] [CrossRef] [Scilit]
  14. Feng, Y.; Zhu, A.; Liu, P.; Liu, Z. Coupling and coordinated relationship of water utilization, industrial development and ecological welfare in the Yellow River Basin, China. J. Clean. Prod. 2022, 379, 134824. [Google Scholar] [CrossRef] [Scilit]
  15. He, J.; Tang, Y.; Guo, X.; Chen, H.; Guo, W.; Sun, Y. Assessment of coupling coordination and spatial distribution characteristics between urbanization and ecosystem health in the Yellow River Basin. Land Use Policy 2025, 154, 107572. [Google Scholar] [CrossRef] [Scilit]
  16. Liu, N.; Liu, C.; Xia, Y.; Da, B. Examining the coordination between urbanization and eco-environment using coupling and spatial analyses: A case study in China. Ecol. Indic. 2018, 93, 1163–1175. [Google Scholar] [CrossRef] [Scilit]
  17. Xia, Z.; Li, C.; Zhang, F.; Yan, Y.; Sun, J.; Ma, D.; Guo, Z. Spatial–temporal heterogeneous analysis of the coupling coordination between new urbanization and urban ecological resilience. Int. J. Urban Sci. 2025, 30, 864–892. [Google Scholar] [CrossRef] [Scilit]
  18. Liu, Y.; Zhang, Z.; Huang, X. A novel coupling cloud decision-making framework for investigating population-economy-water consumption nexus in the Inner Mongolia reaches of the Yellow River, China. Environ. Impact Assess. Rev. 2023, 98, 106923. [Google Scholar] [CrossRef] [Scilit]
  19. Ren, J.; Ma, R.; Huang, Y.; Wang, Q.; Guo, J.; Li, C.; Zhou, W. Identifying the trade-offs and synergies of land use functions and their influencing factors of Lanzhou-Xining urban agglomeration in the upper reaches of Yellow River Basin, China. Ecol. Indic. 2024, 158, 111279. [Google Scholar] [CrossRef] [Scilit]
  20. Zhang, S.; Huang, C.; Li, X.; Song, M. The spatial–temporal evolution and influencing factors of the coupling coordination of new-type urbanization and ecosystem services value in the Yellow River Basin. Ecol. Indic. 2024, 166, 112300. [Google Scholar] [CrossRef] [Scilit]
  21. Wu, X.; Wei, Y.; Fu, B.; Wang, S.; Zhao, Y.; Moran, E.F. Evolution and effects of the social-ecological system over a millennium in China’s Loess Plateau. Sci. Adv. 2020, 6, eabc0276. [Google Scholar] [CrossRef] [Scilit]
  22. Shen, W.; Li, Y.; Qin, Y.; Cheng, J. Influencing mechanism of climate and human activities on ecosystem health in the middle reaches of the Yellow River of China. Ecol. Indic. 2023, 150, 110191. [Google Scholar] [CrossRef] [Scilit]
  23. Lu, F.; Hu, H.; Sun, W.; Zhu, J.; Liu, G.; Zhou, W.; Zhang, Q.; Shi, P.; Liu, X.; Wu, X.; et al. Effects of national ecological restoration projects on carbon sequestration in China from 2001 to 2010. Proc. Natl. Acad. Sci. USA 2018, 115, 4039–4044. [Google Scholar] [CrossRef] [Scilit]
  24. Wu, X.; Wang, S.; Fu, B.; Feng, X.; Chen, Y. Socio-ecological changes on the Loess Plateau of China after Grain to Green Program. Sci. Total Environ. 2019, 678, 565–573. [Google Scholar] [CrossRef] [Scilit]
  25. Pradhan, P.; Costa, L.; Rybski, D.; Lucht, W.; Kropp, J.P. A Systematic Study of Sustainable Development Goal (SDG) Interactions. Earth’s Future 2017, 5, 1169–1179. [Google Scholar] [CrossRef] [Scilit]
  26. Burke, M.; Driscoll, A.; Lobell, D.B.; Ermon, S. Using satellite imagery to understand and promote sustainable development. Science 2021, 371, eabe8628. [Google Scholar] [CrossRef] [Scilit]
  27. Ariken, M.; Zhang, F.; Liu, K.; Fang, C.; Kung, H.-T. Coupling coordination analysis of urbanization and eco-environment in Yanqi Basin based on multi-source remote sensing data. Ecol. Indic. 2020, 114, 106331. [Google Scholar] [CrossRef] [Scilit]
  28. Li, W.; An, M.; Wu, H.; An, H.; Huang, J.; Khanal, R. The local coupling and telecoupling of urbanization and ecological environment quality based on multisource remote sensing data. J. Environ. Manag. 2023, 327, 116921. [Google Scholar] [CrossRef] [Scilit]
  29. Tao, J.; Xie, Y.; Zhou, H.; Xu, Y.; Zhao, G. Cross-County Characteristics of Water–Ecology–Economy Coupling Coordination in the Wuding River Watershed, China. Land 2022, 11, 2283. [Google Scholar] [CrossRef] [Scilit]
  30. Li, J.; Sun, W.; Li, M.; Linlin, M. Coupling coordination degree of production, living and ecological spaces and its influencing factors in the Yellow River Basin. J. Clean. Prod. 2021, 298, 126803. [Google Scholar] [CrossRef] [Scilit]
  31. Wang, Y.; Song, J.; Sun, H. Coupling interactions and spatial equilibrium analysis of water-energy-food in the Yellow River Basin, China. Sustain. Cities Soc. 2023, 88, 104293. [Google Scholar] [CrossRef] [Scilit]
  32. He, X.; Cai, C.; Tang, J.; Shi, J.; Yang, R. Analysis of coupling coordination and obstacle factors between tourism development and ecosystem services value: A case study of the Yellow River Basin, China. Ecol. Indic. 2023, 157, 111234. [Google Scholar] [CrossRef] [Scilit]
  33. Omer, A.; Elagib, N.A.; Zhuguo, M.; Saleem, F.; Mohammed, A. Water scarcity in the Yellow River Basin under future climate change and human activities. Sci. Total Environ. 2020, 749, 141446. [Google Scholar] [CrossRef] [Scilit]
  34. Tao, J.; Xu, Y.; Cong, N.; Li, C.; Zhao, G.; Miao, C. Divergent climatic effects on forest greenness modulated by temperature and precipitation gradients in the Yellow River Basin, China. Ecol. Indic. 2024, 158, 111553. [Google Scholar] [CrossRef] [Scilit]
  35. Pekel, J.-F.; Cottam, A.; Gorelick, N.; Belward, A.S. High-resolution mapping of global surface water and its long-term changes. Nature 2016, 540, 418–422. [Google Scholar] [CrossRef] [Scilit]
  36. Zhao, M.; Heinsch, F.A.; Nemani, R.R.; Running, S.W. Improvements of the MODIS terrestrial gross and net primary production global data set. Remote Sens. Environ. 2005, 95, 164–176. [Google Scholar] [CrossRef] [Scilit]
  37. Myneni, R.B.; Hoffman, S.; Knyazikhin, Y.; Privette, J.L.; Glassy, J.; Tian, Y.; Wang, Y.; Song, X.; Zhang, Y.; Smith, G.R.; et al. Global products of vegetation leaf area and fraction absorbed PAR from year one of MODIS data. Remote Sens. Environ. 2002, 83, 214–231. [Google Scholar] [CrossRef] [Scilit]
  38. Yuan, Y.; Wang, M.; Zhu, Y.; Huang, X.; Xiong, X. Urbanization’s effects on the urban-rural income gap in China: A meta-regression analysis. Land Use Policy 2020, 99, 104995. [Google Scholar] [CrossRef] [Scilit]
  39. Zhang, X.; Sun, S.; Yao, S. Spatiotemporal distribution and dynamic evolution of grain productivity efficiency in the Yellow River Basin of China. Environ. Dev. Sustain. 2024, 26, 12005–12030. [Google Scholar] [CrossRef] [Scilit]
  40. Best, J. Anthropogenic stresses on the world’s big rivers. Nat. Geosci. 2019, 12, 7–21, Correction in Nat. Geosci. 2019, 12, 148. [Google Scholar] [CrossRef] [Scilit]
  41. Lebakula, V.; Sims, K.; Reith, A.; Rose, A.; McKee, J.; Coleman, P.; Kaufman, J.; Urban, M.; Jochem, C.; Whitlock, C.; et al. LandScan Global 30 Arcsecond Annual Global Gridded Population Datasets from 2000 to 2022. Sci. Data 2025, 12, 495. [Google Scholar] [CrossRef] [Scilit]
  42. Tremblay, J.C.; Ainslie, P.N. Global and country-level estimates of human population at high altitude. Proc. Natl. Acad. Sci. USA 2021, 118, e2102463118. [Google Scholar] [CrossRef] [Scilit]
  43. Shannon, C.E. A mathematical theory of communication. Bell Syst. Tech. J. 1948, 27, 379–423. [Google Scholar] [CrossRef] [Scilit]
  44. Liu, Y.; Song, H.; An, Z.; Sun, C.; Trouet, V.; Cai, Q.; Liu, R.; Leavitt, S.W.; Song, Y.; Li, Q.; et al. Recent anthropogenic curtailing of Yellow River runoff and sediment load is unprecedented over the past 500 y. Proc. Natl. Acad. Sci. USA 2020, 117, 18251–18257. [Google Scholar] [CrossRef] [Scilit]
  45. Tian, G.; Li, J.; Wu, Z.; Zhao, Q.; Xia, Q.; Zhang, J.; Niu, X. Unveiling the resilience of the water-energy-food nexus: A context-specific framework and evolutionary insights for the Yellow River Basin. Agric. Water Manag. 2025, 315, 109514. [Google Scholar] [CrossRef] [Scilit]
  46. Hu, X.; Dong, C.; Zhang, Y. Exploring How Human-Land Conflict Affects Cropland Fragmentation. Land Degrad. Dev. 2025, 36, 2315–2334. [Google Scholar] [CrossRef] [Scilit]
  47. Sheffield, J.; Wood, E.F.; Pan, M.; Beck, H.; Coccia, G.; Serrat-Capdevila, A.; Verbist, K. Satellite Remote Sensing for Water Resources Management: Potential for Supporting Sustainable Development in Data-Poor Regions. Water Resour. Res. 2018, 54, 9724–9758. [Google Scholar] [CrossRef] [Scilit]
  48. Hakimdavar, R.; Hubbard, A.; Policelli, F.; Pickens, A.; Hansen, M.; Fatoyinbo, T.; Lagomasino, D.; Pahlevan, N.; Unninayar, S.; Kavvada, A.; et al. Monitoring Water-Related Ecosystems with Earth Observation Data in Support of Sustainable Development Goal (SDG) 6 Reporting. Remote Sens. 2020, 12, 1634. [Google Scholar] [CrossRef] [Scilit]
  49. Mondal, P.; McDermid, S.S.; Qadir, A. A reporting framework for Sustainable Development Goal 15: Multi-scale monitoring of forest degradation using MODIS, Landsat and Sentinel data. Remote Sens. Environ. 2020, 237, 111592. [Google Scholar] [CrossRef] [Scilit]
  50. Piao, S.; Wang, X.; Park, T.; Chen, C.; Lian, X.; He, Y.; Bjerke, J.W.; Chen, A.; Ciais, P.; Tømmervik, H.; et al. Characteristics, drivers and feedbacks of global greening. Nat. Rev. Earth Environ. 2020, 1, 14–27. [Google Scholar] [CrossRef] [Scilit]
  51. Lloyd, C.T.; Sorichetta, A.; Tatem, A.J. High resolution global gridded data for use in population studies. Sci. Data 2017, 4, 170001. [Google Scholar] [CrossRef] [Scilit]
  52. Xu, F.; Xu, H.; Yan, F. Spatial-Temporal Characteristics and Obstacle Factors of Industry Ecology in the Lower Yellow River. Pol. J. Environ. Stud. 2023, 32, 901–912. [Google Scholar] [CrossRef] [Scilit]
  53. Shi, F.; Liu, S.; Sun, Y.; An, Y.; Zhao, S.; Liu, Y.; Li, M. Ecological network construction of the heterogeneous agro-pastoral areas in the upper Yellow River basin. Agric. Ecosyst. Environ. 2020, 302, 107069. [Google Scholar] [CrossRef] [Scilit]
  54. Lian, J.; Li, Y.; Wang, X.; Li, Y.; Zhang, Y.; Feng, J.; Su, N.; Li, Y. Climate and land use change driving divergent surface water dynamics in the Northern China agro-pastoral ecotone. J. Hydrol. Reg. Stud. 2026, 63, 103098. [Google Scholar] [CrossRef] [Scilit]
  55. Xia, P.; Zheng, H.; Hu, T.; Xu, Z.; Peng, J. Linking perceptions of ecological restoration projects’ impacts on ecosystem services and human well-being for achieving regional sustainability. Appl. Geogr. 2025, 178, 103570. [Google Scholar] [CrossRef] [Scilit]
  56. Liu, Y.; Zhang, C.; Xie, M.; Xie, J. Optimal ecological restoration strategy development based on value-cost trade-offs. Glob. Ecol. Conserv. 2025, 58, e03500. [Google Scholar] [CrossRef] [Scilit]
  57. Wang, Z.; Xu, M.; Penny, G.; Hu, H.; Zhang, X.; Tian, S. Impact of revegetation and agricultural intensification on water storage variation in the Yellow River Basin. J. Hydrol. 2024, 635, 131218. [Google Scholar] [CrossRef] [Scilit]
  58. Ren, D.; Liu, S.; Wu, Y.; Xiao, F.; Patil, S.D.; Dallison, R.J.H.; Feng, S.; Zhao, F.; Qiu, L.; Wang, S.; et al. Quantifying natural and anthropogenic impacts on streamflow and sediment load reduction in the upper to middle Yellow River Basin. J. Hydrol. Reg. Stud. 2024, 53, 101788. [Google Scholar] [CrossRef] [Scilit]
  59. Wang, J.; Xiao, H.; Hu, M. Spatial spillover effects of forest ecological security on ecological well-being performance in China. J. Clean. Prod. 2023, 418, 138142. [Google Scholar] [CrossRef] [Scilit]
  60. Li, X.; Meng, X.; Ma, C.; Liang, H.; Lu, S. Promotion of cropland conservation in ecologically fragile areas of the Yellow River Basin: Based on a land consolidation policy. J. Rural Stud. 2026, 124, 104180. [Google Scholar] [CrossRef] [Scilit]
  61. Chen, B.; Liu, S.; Yu, S.; Chen, W.; He, X.; Wang, Y. Cropland expansion is threatening terrestrial water storage in dryland watersheds. J. Clean. Prod. 2025, 501, 145333. [Google Scholar] [CrossRef] [Scilit]
  62. Du, L.; Dong, C.; Kang, X.; Qian, X.; Gu, L. Spatiotemporal evolution of land cover changes and landscape ecological risk assessment in the Yellow River Basin, 2015–2020. J. Environ. Manag. 2023, 332, 117149. [Google Scholar] [CrossRef] [Scilit]
  63. Chen, C.; Park, T.; Wang, X.; Piao, S.; Xu, B.; Chaturvedi, R.K.; Fuchs, R.; Brovkin, V.; Ciais, P.; Fensholt, R.; et al. China and India lead in greening of the world through land-use management. Nat. Sustain. 2019, 2, 122–129. [Google Scholar] [CrossRef] [Scilit]
Figure 1. (a) Yellow River Basin boundary and counties in the upper, middle, and lower reaches. (b) Elevation pattern of the study area.
Land 15 01729 g001aLand 15 01729 g001b
Figure 2. Research framework and methodology of the study.
Land 15 01729 g002
Figure 3. Spatial patterns of the ecological–economic–social coupling coordination degree and its Anselin Local Moran’s I in 2001–2020.
Land 15 01729 g003
Figure 4. Spatial patterns of the ecological–economic–social coupling coordination degree along urbanization rate–cropland area (a), urbanization rate–vegetation area (b), and vegetation area–cropland area (c) gradients.
Land 15 01729 g004
Figure 5. Spatial patterns of changes in ecological–economic–social coupling coordination degree and its Anselin Local Moran’s I in 2001–2020.
Land 15 01729 g005
Figure 6. Spatial patterns of percentage change in ecological–economic–social coupling coordination degree along percentage change gradients for urbanization rate–cropland area (a), urbanization rate–vegetation area (b), and vegetation area–cropland area (c).
Land 15 01729 g006
Figure 7. Geographically weighted regression coefficients of the effects of percentage change in urbanization rate (a), cropland area (b), and vegetation area (c) on that of the ecological–economic–social coupling coordination degree in 2001–2020.
Land 15 01729 g007aLand 15 01729 g007bLand 15 01729 g007c
Disclaimer/Publisher’s Note: The statements, opinions and data contained in all publications are solely those of the individual author(s) and contributor(s) and not of MDPI and/or the editor(s). MDPI and/or the editor(s) disclaim responsibility for any injury to people or property resulting from any ideas, methods, instructions or products referred to in the content.