Article

High-Standard Farmland Construction and Agricultural Carbon Performance: Asymmetric Effects on Carbon Mitigation and Sequestration

1
School of Public Administration, Xi’an University of Architecture and Technology, Xi’an 710055, China
2
School of Business Administration, Southwestern University of Finance and Economics, Chengdu 611130, China
3
School of Economics, Southwestern University of Finance and Economics, Chengdu 611130, China
4
School of Economics, Xinjiang College of Science & Technology, Korla 841000, China
*
Author to whom correspondence should be addressed.
Land 2026, 15(9), 1662; https://doi.org/10.3390/land15091662
Submission received: 9 July 2026 / Revised: 18 August 2026 / Accepted: 31 August 2026 / Published: 8 September 2026
(This article belongs to the Section Land Use, Impact Assessment and Sustainability)

Abstract

High-Standard Farmland Construction (HSFC) is widely expected to support both food security and low-carbon agriculture in China, yet prevailing assessments treat agricultural carbon performance (ACP) as a single aggregate, obscuring the structural asymmetry between emission mitigation and carbon sequestration. This study examines whether HSFC simultaneously reduces agricultural emissions and enhances carbon sequestration. Using a city-level panel of the Yangtze River Economic Belt (2007–2022), this study treats HSFC as a quasi-experiment and decomposes ACP into carbon sequestration performance (CSP) and carbon mitigation performance (CMP). The results show that HSFC robustly improves overall ACP and CSP, while its effect on CMP is statistically insignificant. Further decomposition indicates that HSFC promotes ACP through both efficiency change and technological change, though these gains are concentrated primarily in the sequestration dimension. Mechanism analysis shows that farmland scale management improves both efficiency and technology adoption, whereas agricultural socialized services promote both channels with a particularly pronounced effect on technological progress; neither channel, however, delivers a strong mitigation effect. In addition, the CSP-enhancing effect is robust across mechanization levels and in major grain-producing areas, whereas it is statistically absent in the upstream reaches characterized by fragmented terrain, and no significant CMP effect emerges in any subgroup. These findings provide new evidence on the climate consequences of farmland policies and offer implications for better aligning food security with agricultural decarbonization.

1. Introduction

Balancing food security with climate change mitigation has become a defining challenge for global agriculture [1]. As a major strategy to optimize land resource allocation, agricultural land consolidation has evolved from simply expanding arable land to comprehensive agrarian restructuring, emphasizing ecological restoration and carbon management [2]. In China, High-Standard Farmland Construction (HSFC) represents the most extensive land consolidation initiative, aimed at simultaneously upgrading farmland infrastructure and enhancing ecological carrying capacity. Existing studies have shown that HSFC contributes to higher grain yield and quality [3,4], reduces farmland abandonment [5], and promotes grain cultivation [6]. Some studies also suggest that HSFC can improve agricultural green production [7,8] or support agricultural carbon mitigation [9]. These findings indicate that HSFC may generate important climate-related co-benefits in addition to its production effects. Taken together, this literature can be divided into three main research directions, including production effects, land use effects, and the environmental effects of HSFC. However, research on combining carbon emissions and carbon sequestration in the same performance framework is limited. There is no consensus on whether HSFC intervention measures reduce emissions, enhance carbon sequestration, or both.
However, the existing literature still has several important limitations. First, most studies evaluate the environmental effects of HSFC using aggregate indicators of green productivity or low-carbon development, without adequately distinguishing between different dimensions of carbon performance. In particular, the agricultural ecosystem acts concurrently as a carbon source and a carbon sink, and the existing studies largely treat carbon emissions merely as an undesirable output within an input–output framework. Although a few scholars have begun to incorporate carbon sequestration as a desirable output [10], they have not systematically examined whether HSFC exerts differential impacts on carbon mitigation versus carbon sequestration. A policy that enhances land quality and production conditions may strengthen carbon sinks without necessarily reducing emission flows. Overlooking this distinction could therefore obscure the true carbon effects of HSFC. Second, most existing studies rely on macro-statistical data or field survey methods [11,12]. Macro-statistical data usually cannot accurately reflect post-construction soil fertility conditions and may further suffer from inconsistent statistical standards and delayed updates. Field survey data, meanwhile, are typically limited in sample size and often lack the randomness required for representative sampling. Third, current studies generally focus on whether HSFC improves agricultural performance, but pay less attention to how such effects are generated. Specifically, there is limited evidence on whether the influence of HSFC on agricultural carbon performance operates mainly through efficiency improvements, technological progress, or both. Similarly, the internal mechanisms through which HSFC affects carbon performance remain underexplored, and discussions of heterogeneous effects across different regional contexts are often insufficient.
To address these gaps, this study examines the impact of HSFC on agricultural carbon performance (ACP) in the Yangtze River Economic Belt (YEB), and whether its effects differ between carbon mitigation performance (CMP) and carbon sequestration performance (CSP). The YEB provides an appropriate setting for this analysis because it is characterized by a dual role as a major grain-producing area and a critical ecological zone, with substantial internal variation in production conditions and resource endowments. Based on multi-source geospatial data, this study identifies the spatial distribution of HSFC and evaluates ACP by combining the biennial non-radial directional distance function (NDDF) with the Luenberger index. More importantly, this study explicitly distinguishes between CMP and CSP, and further explores their source decomposition, transmission mechanisms, and heterogeneous effects. The marginal contributions of this study are threefold. First, the analytical paradigm was shifted from “monolithic carbon performance” to “structural carbon asymmetry” in this study. By decomposing ACP, the underlying asymmetric effects of HSFC on CSP and CMP were exposed, thereby providing a more comprehensive assessment of the environmental consequences of HSFC. Second, this study improves policy evaluation by applying GIS techniques to accurately identify HSFC boundaries, overcoming the statistical ambiguities and uncertainty in traditional macro-panel and investigation data. Third, by combining source decomposition, mechanism analysis, and heterogeneity analysis, it clarifies how HSFC affects ACP and under what conditions these effects vary. The findings provide new insights into the climate implications of farmland improvement policies and offer a refined evidence base for designing strategies that synergize food security with agricultural decarbonization.

2. Background and Theoretical Analysis

2.1. Policy Background

China’s HSFC policy has evolved from pilot exploration to nationwide implementation, shifting from a primary focus on quantitative expansion to an integrated emphasis on both quality and ecological sustainability. Prior to 2011, relevant government departments had not established specialized documents defining specific measures, construction standards, or target objectives for HSF. Since 2011, the 12th Five-Year Plan explicitly introduced the initiative for the first time, followed by the subsequent issuance of the “National HSFC Plan (2021–2030)” and the “General Principles for HSFC” (GB/T 30600-2022) [13]. These documents progressively established a comprehensive construction standard system centered on “field consolidation, irrigation and drainage infrastructure, road accessibility, ecological conservation, and soil fertility enhancement” (Table 1). Specifically, HSFC comprises two main components. The first one is farmland infrastructure construction, which includes field consolidation, irrigation and drainage, field roads, ecological environmental conservation and farmland power transmission and distribution. This component aims to address shortcomings in agricultural infrastructures, enhance resource utilization efficiency and disaster resilience, as well as promote green transformation in agricultural production. The second one is farmland productivity improvement projects, which encompasses soil amendment, elimination of restrictive soil layers and soil fertility enhancement. These efforts target the removal of constraints on crop growth, strengthen soil fertility and ecological functions.
The policy’s implementation reflects a clear engineering integration and multi-objective orientation, aligning with both the national food security strategy and the requirements for agricultural green and low-carbon development as well as ecological civilization advancement. Therefore, a systematic evaluation on how HSFC impacts low-carbon agricultural growth holds significant theoretical importance and provides critical insights for optimizing future land consolidation policies.

2.2. Theoretical Analysis

HSFC is designed to strengthen agricultural production capacity through land leveling, irrigation and drainage improvement, and soil amendment. These interventions improve the physical and chemical properties of cultivated land, thereby creating favorable conditions for higher biomass production and soil organic carbon accumulation [14]. From this perspective, HSFC is expected to enhance carbon sequestration performance (CSP) by reinforcing the carbon sink function of farmland ecosystems. This expectation aligns with international evidence: land consolidation programs in Europe have similarly been found to improve soil quality and ecological conditions, although their carbon outcomes depend critically on project design and post-consolidation management [1]. By contrast, its effect on carbon mitigation performance (CMP) is less direct. Although improved field conditions may facilitate more efficient input use, and existing studies suggest that HSFC can reduce fertilizer use [12,15], HSFC does not inherently target emission reduction. The construction process itself, together with more intensive mechanized farming after upgrading, may increase energy use and carbon emissions [16]. Moreover, without complementary green cultivation technologies, production expansion may generate additional greenhouse gas emissions from input use and crop production processes [17]. Global assessments further caution that enhanced agricultural carbon sinks can deliver meaningful climate benefits, yet realizing these benefits requires managing the trade-off between sequestration gains and emission increases from intensified production [18]. This trade-off is evident in the Chinese context, where productivity improvements from farmland upgrading have not automatically translated into proportionate emission reductions [9]. Therefore, HSFC is expected to improve overall agricultural carbon performance (ACP), but its effect is likely to be stronger on sequestration than on mitigation. This leads to the first hypothesis:
H1. 
HSFC significantly improves ACP, but its effect is stronger on CSP than on CMP.
According to productivity frontier theory, variations in ACP can be decomposed into efficiency change (EC) and technological change (TC) [19]. This decomposition is analytically powerful because it separates “catch-up” gains (i.e., those arising from more efficient use of existing technologies from “frontier-shifting” gains (i.e., driven by the adoption of new technologies). This distinction has been increasingly applied to environmental and carbon performance assessment, where understanding whether improvements stem from better resource allocation or from technological innovation carries distinct policy implications [20]. The framework is particularly informative for the present study because it allows the asymmetric carbon effects of HSFC to be traced to their structural sources. HSFC can improve EC by optimizing land use, reducing fragmentation, and enhancing the allocation efficiency of land, water, and other production factors. At the same time, better infrastructure and improved cultivation conditions may lower the cost of adopting advanced technologies, thereby promoting TC. However, these gains are unlikely to be distributed evenly across carbon dimensions. The ecological improvements generated by HSFC, such as better soil quality and water regulation, directly support carbon accumulation and thus favor CSP. By contrast, meaningful progress in CMP depends more on the adoption of explicit emission-reducing technologies and practices, which are not the primary focus of current HSFC standards. As a result, the productivity gains induced by HSFC are more likely to be translated into sequestration-related outcomes than into mitigation-related outcomes. Accordingly, the second hypothesis is proposed:
H2. 
HSFC improves ACP through both EC and TC, but these gains are mainly reflected in CSP rather than CMP.
The effects of agricultural infrastructure policies depend not only on direct engineering investment, but also on the organizational and institutional arrangements through which such investment is translated into production outcomes [2,21]. Induced innovation theory suggests that improved and consolidated farmland can reduce the transaction costs of land transfer and the operational barriers to mechanized and specialized production [22]. International experience with land consolidation in Europe and Asia further demonstrates that the realization of productivity gains critically depends on whether scale enlargement and supporting service provision are aligned with the consolidated land base [1]. From an institutional economics perspective, the policy effect is thus mediated by the degree to which organizational arrangements align with the consolidated physical infrastructure and whether they incorporate environmental objectives. In this process, HSFC is expected to operate through two main channels. The first is farmland scale management. By reducing fragmentation and promoting contiguous cultivation, HSFC facilitates larger-scale operations and improves input allocation efficiency, mainly through EC [14]. The second is agricultural socialized services. Better field conditions and expanded operational scale increase demand for machinery services, technical extension, precision fertilization, and integrated farm management, which can contribute to both EC and TC [23,24]. However, because current service markets remain largely oriented toward yield enhancement rather than explicit emission reduction, these mechanisms are more likely to improve CSP than CMP. Accordingly, the third hypothesis is proposed:
H3. 
HSFC influences ACP through farmland scale management and agricultural socialized services, but these effects differ across EC, TC, and carbon sub-dimensions.

3. Materials and Methods

3.1. Study Area

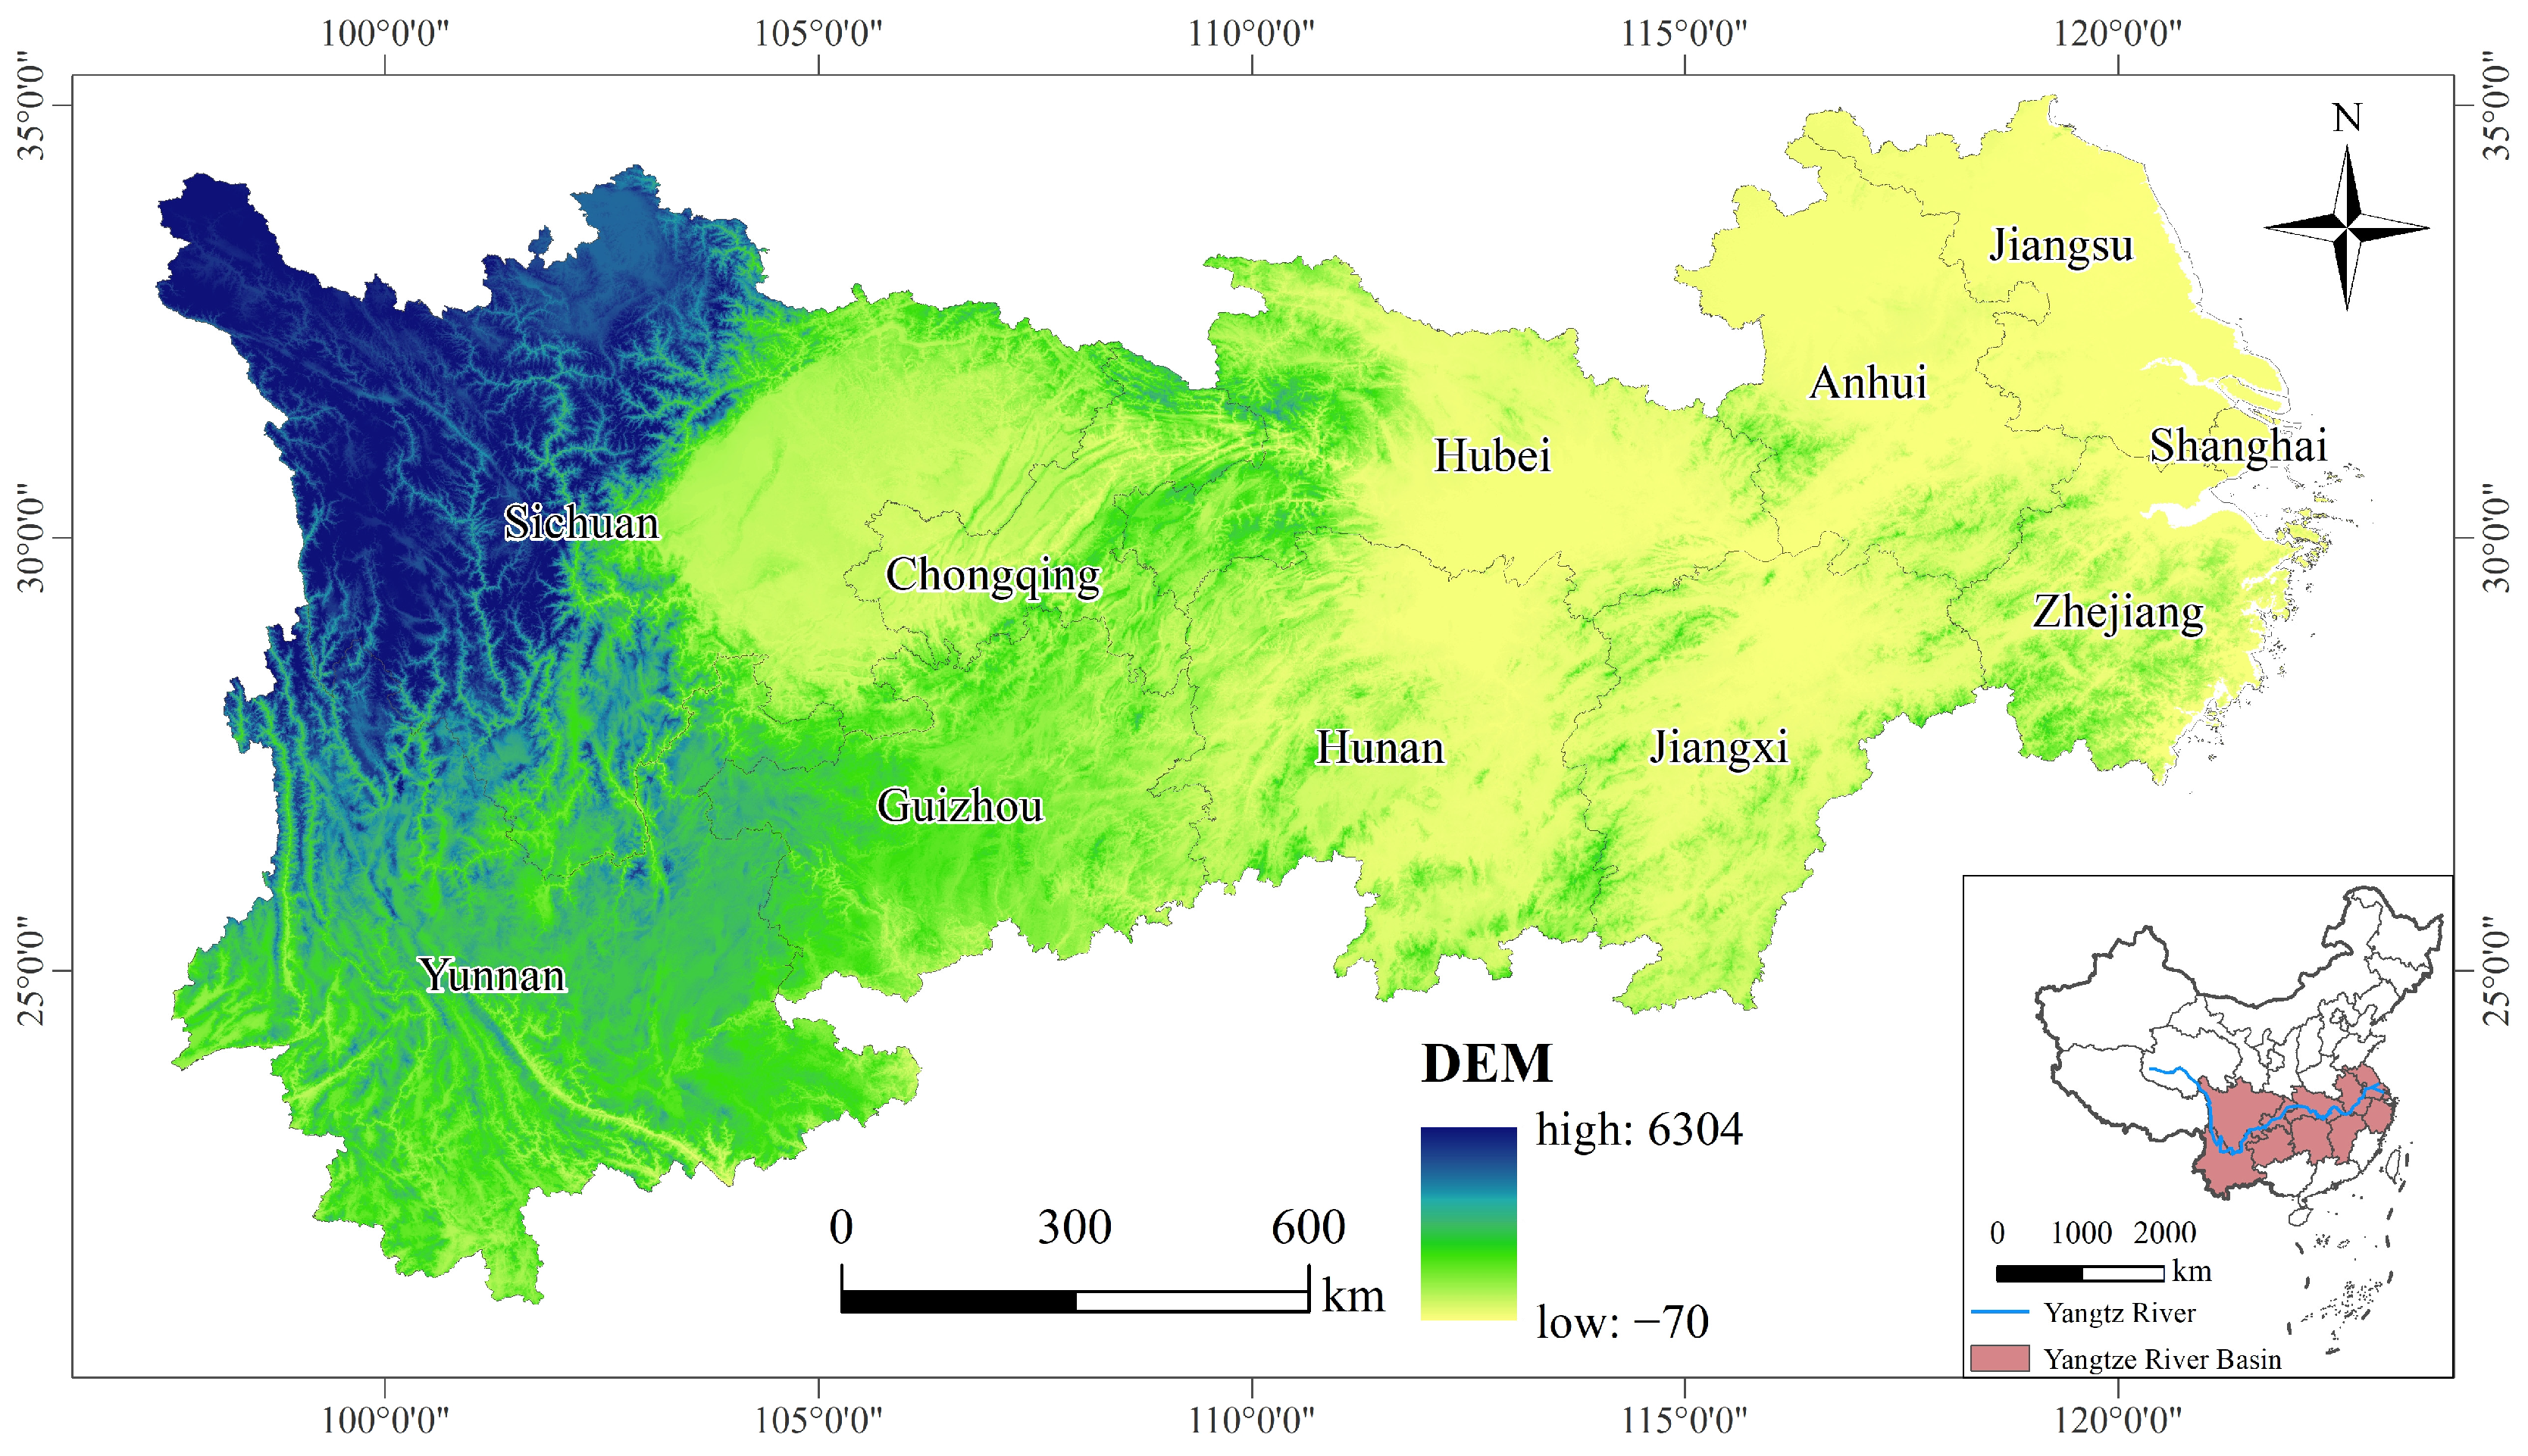
This study focuses on the Yangtze River Economic Belt (YEB) as the study area, which is located along the Yangtze River in China, encompassing 11 provincial-level administrative units and 130 cities. Characterized by a well-developed river network, the YEB predominantly comprises farmland with medium to high quality. Although this region occupies only 20% of the nation’s land area, it produces over 40% of the country’s agricultural products. It has six major grain-producing areas, including Anhui, Jiangsu, Jiangxi, Hubei, Hunan, and Sichuan, accounting for half of the country’s total. Thus, achieving comprehensive low-carbon growth in agriculture within the YEB is critical for ensuring national food security, which makes it a priority region for the implementation of HSFC projects. Topographically, the YEB slopes from higher elevations in the west to lower ones in the east (Figure 1). The upper reaches consist largely of fragmented and sloped farmlands, where inadequate infrastructure (such as field roads and irrigation and drainage systems) poses challenges to the development of agricultural modernization. In contrast, the middle and lower reaches feature predominantly flat terrain, but they are susceptible to soil acidification, eutrophication and significant flood risks, thereby intensifying pressures on disaster mitigation. By the end of 2020, approximately 266 million mu (about 17.7 million hectares) of HSFC land had been established in the YEB. However, how is the actual construction quality of HSF? Has it truly driven comprehensive low-carbon transformation in agriculture? These issues still necessitate systematic empirical validation.

3.2. HSFC Data Processing

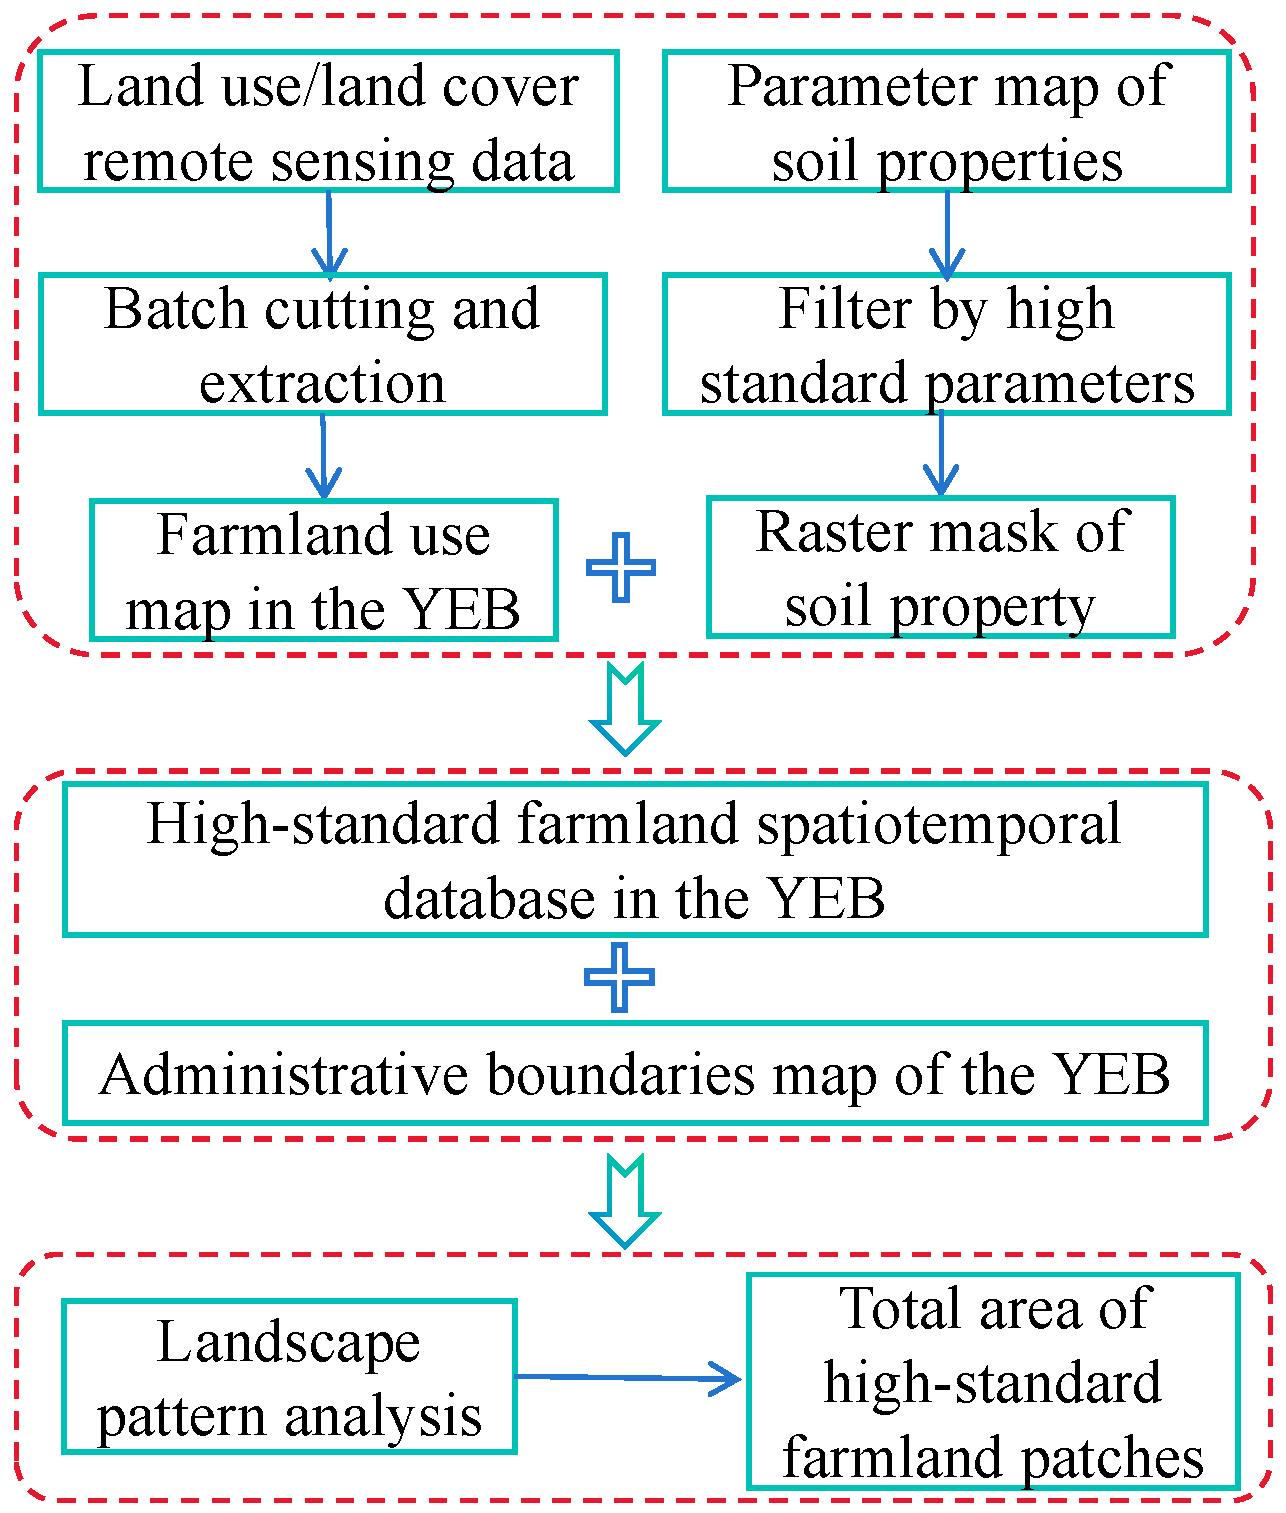
Due to the timeliness and difficulty in obtaining macro-statistical and survey data, some scholars have applied remote sensing data to HSFC research [25]. Integrating multi-source remote sensing data (such as land use and soil properties) with landscape metrics, this study establishes a spatiotemporal database of HSFC across the YEB and quantifies its area for each city. As illustrated in Figure 2, the analytical procedure is structured as follows: (1) extract a regional farmland grid from land use/land cover satellite remote sensing images; (2) set soil-parameter thresholds to iteratively filter and resample a soil mask; (3) overlay the farmland grid with the soil mask to identify high-standard parcels; (4) compute the patch area of each city-level unit using Fragstats 4.3 software. Finally, this procedure integrates land use/land cover imagery with soil-property thresholds to identify high-standard parcels, which are then aggregated to the city level, yielding 2080 city-year observations over 2007–2022. The rationality of this method has been validated in the Supporting Material. Several potential sources of measurement error deserve acknowledgement: the 30 m land-cover raster may misclassify small or narrow parcels; the interpolated soil-property layers smooth local heterogeneity; and the threshold-based screening of high-standard parcels is necessarily schematic relative to plot-level engineering verification. To gauge the resulting uncertainty, the extracted farmland area was cross-validated against land use information from the Second and Third National Land Resources Surveys, and the identification procedure was further validated in the Supplementary Material.
It should be noted that the soil property parameters selected in this study primarily include soil pH, soil organic carbon (SOC) content and bulk density. The pH value is one of the most critical chemical properties of soil, as it influences numerous other chemical, physical, and biological characteristics, serving as a fundamental indicator of soil quality [26]. SOC significantly affects soil thermal properties and moisture retention. The depletion of SOC in farmland will lead to reduced soil fertility, land degradation and even desertification, while also increasing carbon dioxide emissions into the atmosphere [26]. Bulk density serves as an important measure of soil structural quality and fertility level. Higher bulk density indicates greater soil compaction, whereas lower values suggest higher porosity and looser structure [27]. Given that the cultivated layer of farmland typically does not exceed 30 cm in thickness, this study focuses exclusively on the mean values of soil properties within the 0–30 cm depth interval. According to the “General Rules for HSFC” (GB/T 30600-2022) [13], the standard soil pH in the middle and lower reaches of the YEB should range between 5.5 and 7.5, with soil organic carbon (SOC) being no less than 20 g/kg. However, accounting for the complex topography and heterogeneous soil types across the YEB, this study adopts a slightly more flexible pH threshold, ranging from 5.5 to 8.5. Furthermore, to accommodate the predominantly mountainous and hilly terrain in the upstream region specified by the guidelines, the SOC threshold was adjusted to a minimum of 12 g/kg. Additionally, given the strong correlation between soil bulk density and overall farmland quality, the national standard stipulates that the land quality grade should reach 4.5 or higher in the middle and lower reaches, and 5.0 or higher in the upstream. Consequently, the suitable bulk density ranges in this study are defined as 1.1–1.4 g/cm3 for the middle-lower reaches, and 1.3–1.4 g/cm3 for the upstream.
Notably, the landscape analysis process mainly focused on the total patch area of HSFC land (CA). In the subsequent regression, the ratio of CA to the total farmland area serves as the proxy variable for HSFC. CA is calculated as:
CA = i = 1 N a i
where a i represents the area of patch i, and N represents the total number of patches.

3.3. Measurement of Agricultural Carbon Performance

This study combines a biennial non-radial directional distance function (NDDF) and Luenberger index to measure and decompose ACP. The biennial NDDF approach resolves the issue of infeasibility resulting from technological change in cross-period mixed models, while also providing non-oriented and non-radial measurements along with variable-specific efficiency evaluations [28]. As an additive productivity indicator, the Luenberger index is fully compatible with the biennial NDDF framework, allowing straightforward decomposition of total factor productivity changes by factor and by source. This integration significantly reduces computational complexity while enhancing analytical clarity.
Consider a production system comprising I decision-making units (DMUs). Each DMU uses N inputs, denoted by x = ( x i 1 , x i 2 , x i n ) R N + , to jointly produce M desirable outputs y = ( y i 1 , y i 2 , y i m ) R M + and K undesirable outputs b = ( b i 1 , b i 2 , b i k ) R K + in each period of t. According to Zhou et al. [20], a NDDF model that incorporates undesirable outputs can be formulated as follows:
D ( x , y , b ; g ) = sup { ω T β : ( ( x , y , b ) + g · d i a g ( β ) ) T }
where ω T = ( ω n x , ω m y , ω k b ) T 0 represents the normalized weight vector related to the number of input and output factors. The direction vector g = ( g x , g y , g b ) specifies the expected direction for efficiency improvement, which is reducing inputs and undesirable outputs while increasing desirable outputs. β T = ( β n x , β m y , β k b ) T 0 is the scaling factor, representing the inefficiency values.
In order to reduce the potential linear unsolvable problem of cross-period production, this study refers to the existing research [28,29] and combines biennial production technology with NDDF to solve model (2). For DMU i in the t-th period, D i B ( x i n t , y i m t , b i k t ; g i t ) can be solved through linear programming based on the following model:
{ D i B ( x i n t , y i m t , b i k t ; g i t ) = M a x [ β i t : ( β i t = n = 1 N ω n x β i n t + m = 1 M ω m y β i m t + k = 1 K ω k b β i k t ) ] s . t . i = 1 I λ i n t x i n t + i = 1 I λ i n t + 1 x i n t + 1 x i n t β i n t g i n t i = 1 I λ i m t y i m t + i = 1 I λ i m t + 1 y i m t + 1 y i m t + β i m t g i m t i = 1 I λ i k t b i k t + i = 1 I λ i k t + 1 b i k t + 1 = b i k t β i k t g i k t λ i t 0 ; β i n t 0 ; β i m t 0 ; β i k t 0 }
where λ i t is a weight variable used to construct the frontier of production technology. When λ i t 0 , it indicates constant returns to scale (CRS). Notably, the weight values of ω T are obtained by taking the average number of all input and output factors, as most previous studies have done [20,28]. Recognizing the dual role of agricultural ecosystems as both a “carbon source” and a “carbon sink”, this study incorporates three types of outputs: the economic desirable output (agricultural output value, AOV), the ecological desirable output (farmland carbon sequestration service of, CS) and the undesirable output (agricultural carbon emissions, CE). Among them, CS was calculated based on the Integrated Valuation of Ecosystem Services and Trade-offs (InVEST) model, and CE integrated the emissions of three agricultural greenhouse gases of carbon dioxide, methane, and nitrous oxide. The detailed accounting methods for CS and CE can be found in the Supporting Material. Input factors include five key elements of agricultural production: labor (number of agricultural employees, L), land (crop sowing area, SA), machinery (total agricultural machinery power, M), fertilizer (net application amount, F) and irrigation (effective irrigated area, IA). Accordingly, the weight assigned to each input factor is 1/15, while the weights for the desirable outputs and undesirable output are set as 1/6 and 1/3, respectively.
Following Zhang (2022) [28], this study uses biennial non-radial Luenberger productivity indicators to measure the ACP of the YEB. The specific calculation form is as follows:
A C P i = D i B ( x i n t , y i m t , b i k t ; g i t ) D i B ( x i n t + 1 , y i m t + 1 , b i k t + 1 ; g i t + 1 )
A C P i can be further decomposed into efficiency change (EC) and technical change (TC):
E C i = D i t ( x i n t , y i m t , b i k t ; g i t ) D i t + 1 ( x i n t + 1 , y i m t + 1 , b i k t + 1 ; g i t + 1 )
T C i = [ D i B ( x i n t , y i m t , b i k t ; g i t ) D i t ( x i n t , y i m t , b i k t ; g i t ) ] [ D i B ( x i n t + 1 , y i m t + 1 , b i k t + 1 ; g i t + 1 ) D i t + 1 ( x i n t + 1 , y i m t + 1 , b i k t + 1 ; g i t + 1 ) ]
If E C i > 0 , it means an improvement in efficiency between period t and t + 1; if T C i > 0 , it reflects technological progress over the same interval. Technological progress and efficiency enhancement are the fundamental sources behind the advancement of ACP.
Moreover, because both the NDDF and the Luenberger index are additive in structure, ACP admits a variable-specific decomposition following the approach of [30]:
A C P = A C P L + A C P S A + A C P M + A C P F + A C P I A + A C P A O V + A C P C S + A C P C E = A C P X + A C P A O V + A C P C S + A C P C E
where A C P X , A C P A O V , A C P C S and A C P C E respectively represent the comprehensive input performance, economic performance, carbon mitigation performance (CMP) and carbon sequestration performance (CSP).
Similarly, EC and TC can be further decomposed as follows:
E C = E C L + E C S A + E C M + E C F + E C I A + E C A O V + E C C S + E C C E = E C X + E C A O V + E C C S + E C C E
T C = T C L + T C S A + T C M + T C F + T C I A + T C A O V + T C C S + T C C E = T C X + T C A O V + T C C S + T C C E
where E C X , E C A O V , E C C S and E C C E respectively represent the comprehensive input efficiency change, economic efficiency change, carbon mitigation efficiency change and carbon sequestration efficiency change; T C X , T C A O V , T C C S and T C C E respectively represent the comprehensive input technical change, economic technical change, carbon mitigation technical change and carbon sequestration technical change.

3.4. Empirical Model

This study treats the HSFC policy as a quasi-natural experiment and employs a difference-in-differences (DID) approach to assess its impact on ACP in the YEB. As the policy represents a long-term, nationwide land consolidation initiative with continuously evolving implementation scales, a continuous DID is finally adopted for the empirical analysis. The baseline regression model is constructed as follows:
A C P i t = β 0 + β 1 H r a t i o i × p o s t t + ρ X i t + λ t + α i + ε i t
where H r a t i o i denotes the ratio of the total area of HSFC land patches to the total farmland area. p o s t t is a time dummy variable indicating the implementation of this policy. Since the HSFC policy entered a standardized nationwide implementation phase starting in 2011, p o s t t takes the value of 1 for the year 2011 and onward, and 0 otherwise. X i t refers to a set of control variables. β 1 is the coefficient of interest to be estimated and β 0 is the constant term. λ t and α i represent year fixed effects and city fixed effects, respectively. ε i t is the error term.
Parallel trend testing is an essential prerequisite for applying DID models. Drawing on established empirical practices [31], this study conducts a parallel trend test by estimating the dynamic effects of the HSFC policy on ACP. The model is specified as follows:
A C P i t = β 0 + t = 2007 t = 2020 β t H r a t i o i × y e a r t + ρ X i t + λ t + α i + ε i t
where y e a r t denotes the year dummy variable. The year 2010, the period immediately preceding the implementation of the HSFC policy, is selected as the reference year. The coefficient β t captures the estimated effect of the interaction between the area ratio and the year dummy in each period. All other variables and parameters remain consistent with those in the baseline model.

3.5. Variables and Data Sources

The land use/land cover raster data employed in this study are derived from the CLCD30 series data product [32], which has a spatial resolution of 30 m × 30 m. The farmland area for each city was extracted through batch processing based on this raster dataset. To mitigate potential errors, the extracted data were integrated with land use information from the Second and Third National Land and Resources Surveys, and cross-validated according to the mean ratio. Soil property parameters, including pH, SOC and BD, were obtained from the National Earth System Science Data Center (http://www.geodata.cn), part of China’s National Science and Technology Infrastructure Platform, at a resolution of 250 m × 250 m. Administrative boundary vector data were sourced from the Resource and Environment Science and Data Center of the Chinese Academy of Sciences (https://www.resdc.cn).
In the empirical analysis, this study incorporates a set of control variables that may influence ACP. These include: (1) Socio-economic factors: economic development level (EL), agricultural development level (AL), financial support for agriculture (FS), industrial structure (IS), urbanization rate (UR) and environmental regulation intensity (ER). The specific definitions of these variables are provided in Table 2. The data are primarily drawn from provincial and municipal statistical yearbooks and government bulletins. (2) Natural climate factors: mean annual temperature (MT), mean annual sunshine duration (MR) and mean annual precipitation (MP), all of which are logarithmically processed. The data are sourced mainly from the China Meteorological Science Data Center (https://data.cma.cn/). The mechanism analysis in this study encompasses two dimensions of farmland scale management and agricultural socialized services. “Fields leveling and spatially concentrated” represents one of the key objectives of HSFC. This process of consolidating contiguous plots facilitates large-scale operations, thereby enhancing agricultural production efficiency. This study employs the Aggregation Index (AI) to characterize the spatial contiguity of farmland plots, which can be derived through landscape pattern analysis. The measurement formula is as follows:
A I = g i m a x g i
where g i represents the number of grids of the same patch type adjacent to patch i, and m a x g i denotes the maximum number of grids of the same patch type adjacent to patch i. AI examines the connectivity between patches of each landscape type; a lower value indicates a more fragmented landscape [33]. Regarding agricultural socialized services, this study uses the output value of professional and support activities for agriculture, forestry, animal husbandry and fishery as the proxy variable, which is incorporated into the model in its logarithmic form for estimation.
Furthermore, in order to eliminate the potential interference of the land transfer policy, a provincial-level land transfer rate variable is introduced in the robustness test. Data on the area of contracted farmland transferred and the total area of transferred contracted farmland are obtained from the China Rural Management Statistical Annual Report, compiled by the Department of Rural Cooperative Economic Guidance and the Department of Policy and Reform under the Ministry of Agriculture and Rural Affairs. Descriptive statistics for the main variables used in this study are presented in Table 2.

4. Results

4.1. Baseline Regression

The results in Table 3 present the baseline regression results examining the impact of HSFC on ACP and its sub-dimensions in the YEB. Regarding the overall performance, the estimated coefficient of Hratio × post in the first column is positive and statistically significant at the 1% level, indicating that HSFC has generated a significant improvement in aggregate ACP. The magnitude of this effect is also economically meaningful. Specifically, a one-standard-deviation increase in the ratio of HSFC area is associated with an approximately 1.6 (0.088 × 18.263) percentage-point increase in ACP, equivalent to roughly 37% of the sample mean and 0.14 standard deviations of ACP, suggesting that the policy effect is not negligible at the scale of actual implementation. This aggregate improvement can be understood from the functional orientation of HSFC. Since its standardized implementation in 2011, the HSFC policy has enhanced comprehensive grain production capacity by improving farmland infrastructure, such as field consolidation, road rehabilitation, and power facilities, thereby facilitating mechanized agricultural production [4]. Furthermore, the policy has optimized farmland ecological patterns through measures such as promoting water-saving irrigation and establishing shelterbelt networks, achieving notable outcomes in agricultural carbon mitigation and ecological efficiency improvement [9,14], thereby effectively promoting sustainable agricultural production.
Across the sub-dimensions of ACP (Columns 2–4 of Table 3), the baseline results reveal a differentiated pattern: Economic performance is significantly positive at the 10% level, and carbon sequestration performance (CSP) passes the statistical significance test at the 1% level, indicating that HSFC contributes to higher grain yields and, more robustly, improves agricultural ecological efficiency, which aligns with previous research findings [4,34]. The core objective of HSFC is to enhance comprehensive grain production capacity and protect farmland ecosystems through measures such as increasing shelterbelt networks and improving soil quality, thereby promoting economic performance and CSP in agricultural production. However, the estimated coefficient of carbon emission mitigation performance (CMP) is not statistically significant. A possible explanation is the persistent path dependence of investment redundancy in the implementation process of HSFC, which can be confirmed by the same insignificant estimated results of comprehensive input performance. In addition, the limited adoption of green farming technologies alongside rapid production expansion implies an underlying “rebound effect”: the increased agrochemical reliance and structural energy inputs could inadvertently increase agricultural carbon emissions, offsetting potential mitigation benefits.
On the whole, HSFC exerts a positive overall impact on ACP, but its effects diverge across sub-dimensions, especially as it significantly enhances CSP but shows no statistically significant effect on CMP. Accordingly, H1 is supported.

4.2. Parallel Trend Test

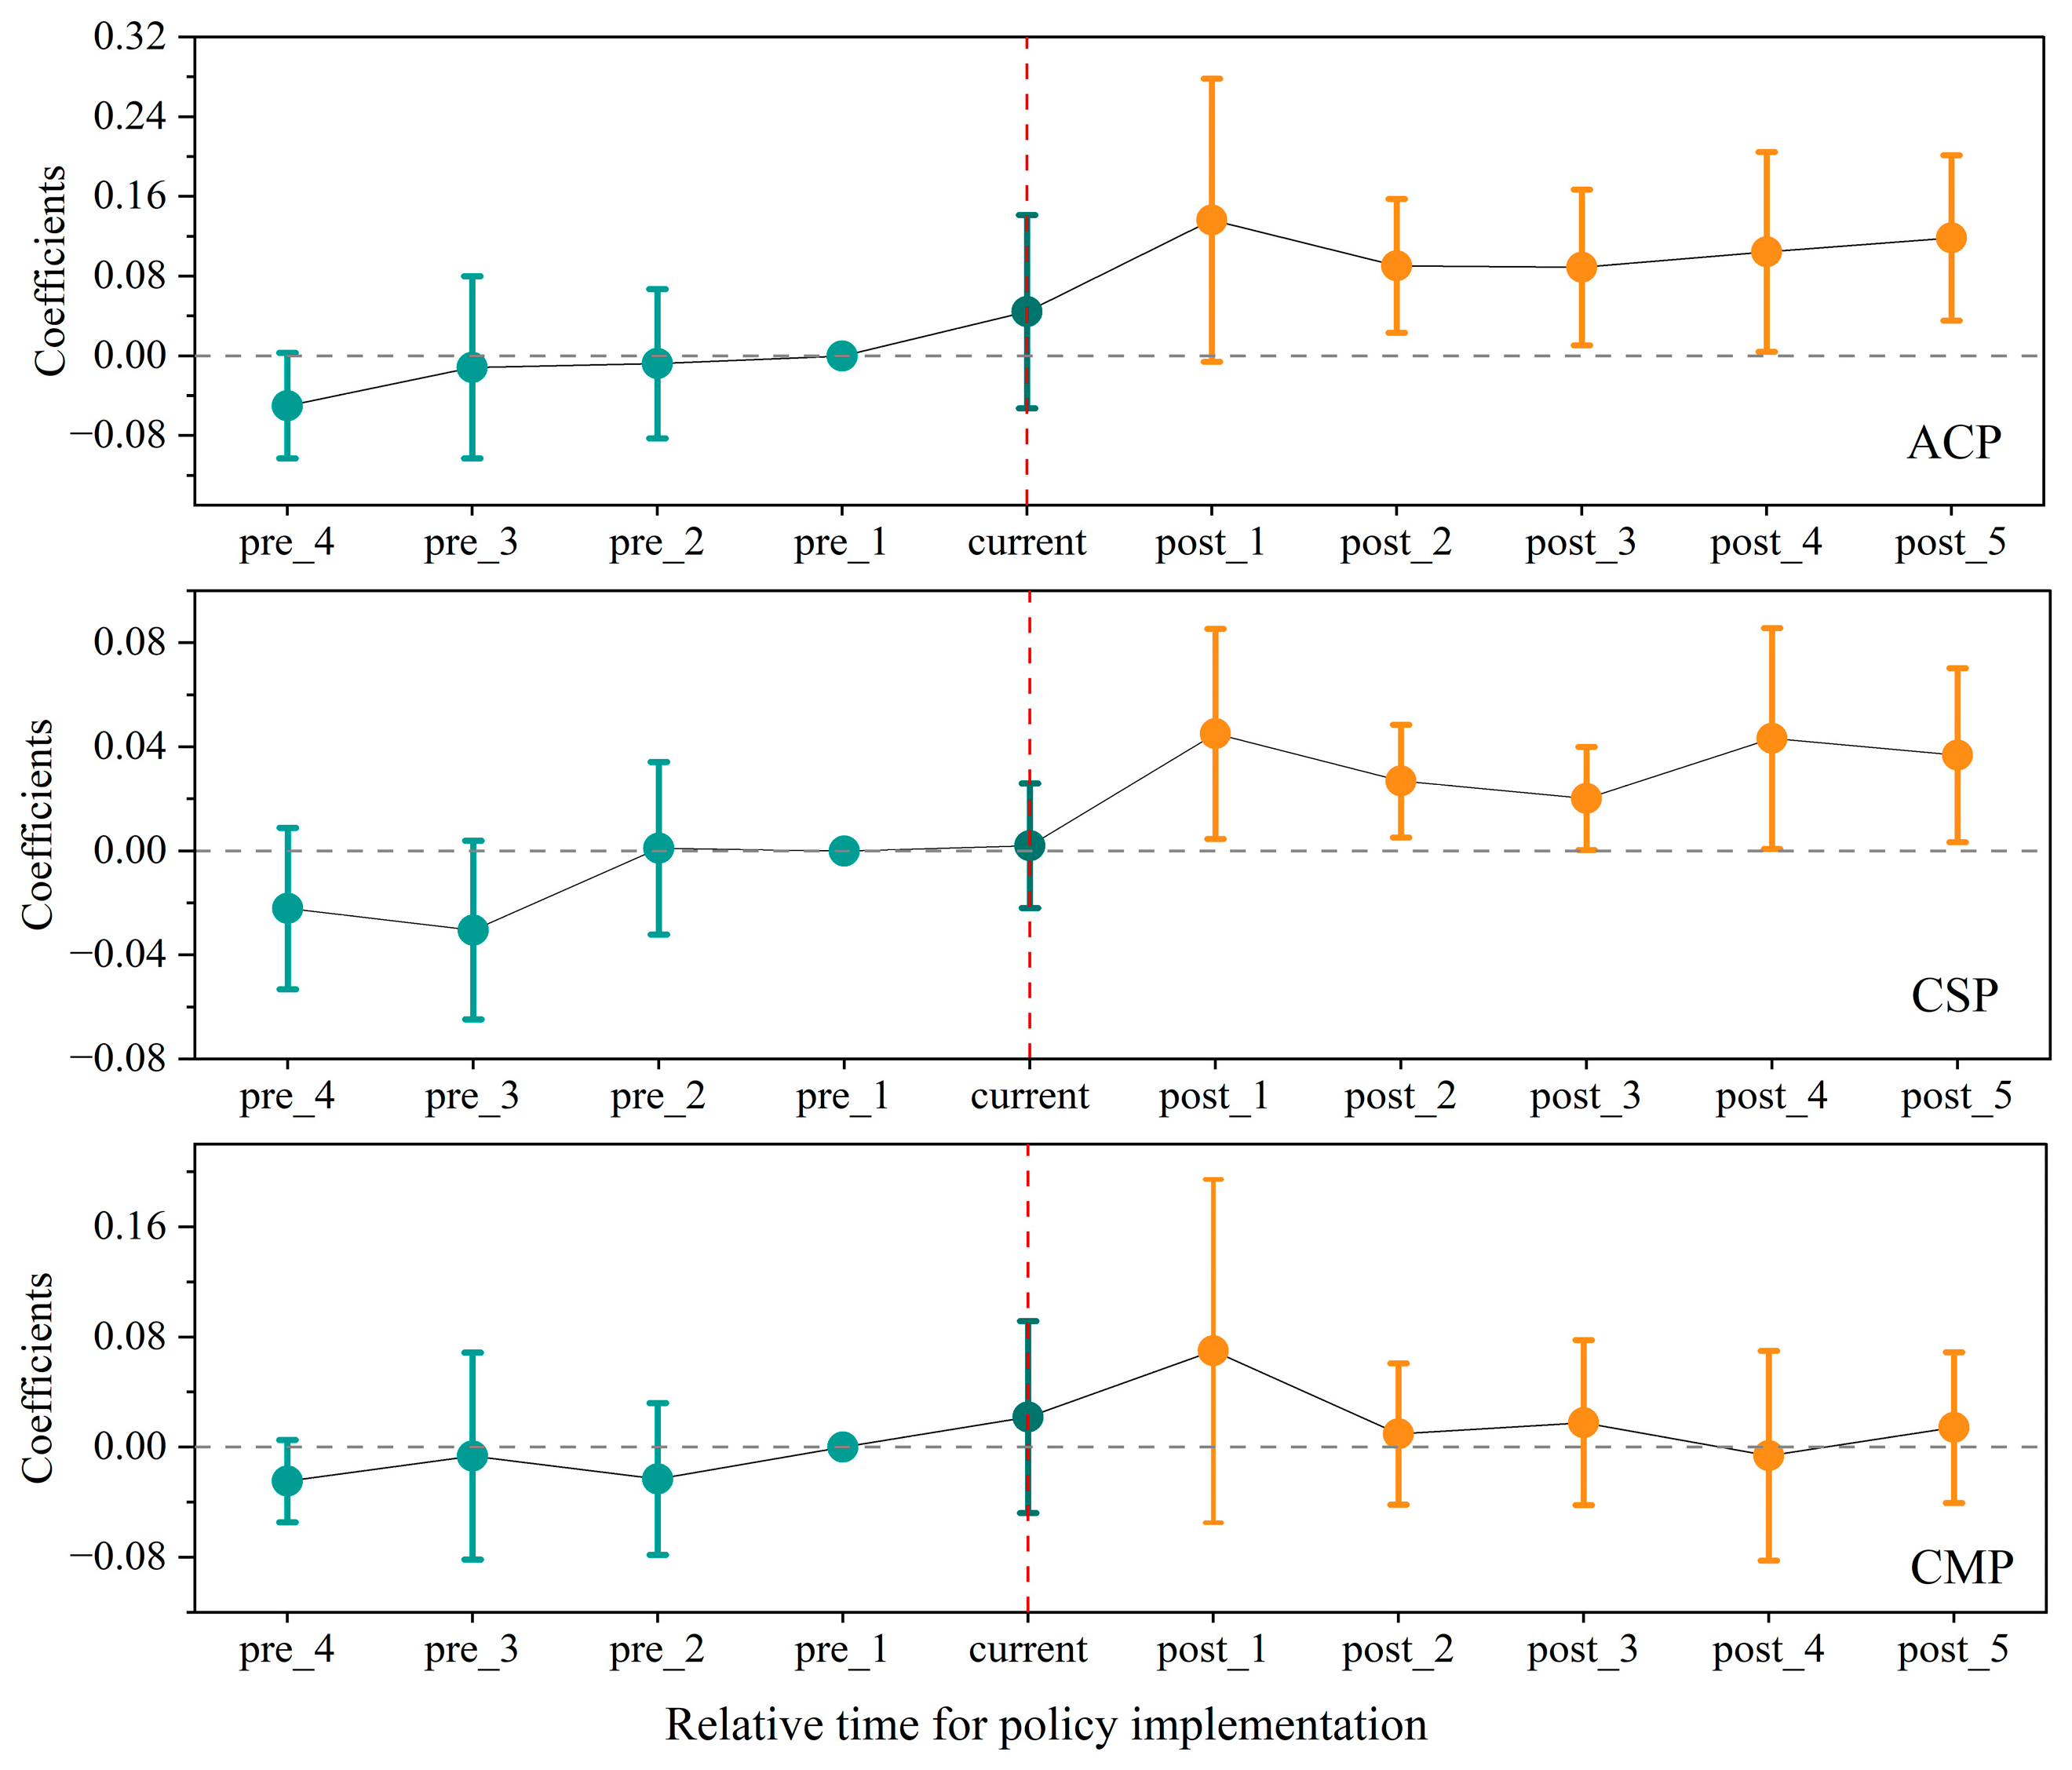
A fundamental prerequisite for applying the DID model is that the treatment and control groups must satisfy the parallel trends assumption prior to the policy intervention. Following the previous research [31], this test evaluates whether the coefficients are statistically insignificant in the pre-policy period and become significant afterwards. This study uses the year prior to the policy implementation (namely 2010) as the baseline to examine the parallel trend for ACP, CSP and CMP. As shown in Figure 3, pre_1 to pre_4 denote the four periods prior to policy implementation, current represents the year of policy implementation, and post_1 to post_5 denote the first five periods following implementation. The results for ACP and CSP display broadly similar dynamic patterns. Before the policy took effect, all estimated coefficients were statistically insignificant, indicating the absence of systematic pre-trends between the treatment and control groups. After policy implementation, however, most coefficients become positive, indicating that HSFC generally exerts a favorable effect on both ACP and CSP. It is notable that the policy impact displays a certain time lag, as significant improvements in ACP do not emerge until the third year after implementation. This delayed effect can be explained by two main factors. First, the initial implementation phase faced challenges including gradual fund allocation, evolving construction standards, and a prevailing emphasis on construction over maintenance. Second, agricultural production cycles are inherently long, and projects like land consolidation and soil improvement typically require time before their effects on productivity and ecological performance become observable. By contrast, the coefficients for CMP are near zero and statistically insignificant throughout the post-policy period, indicating that HSFC has not produced a significant mitigation effect on agricultural carbon emissions. This finding further supports the main conclusion of this study that the carbon performance gains from HSFC are driven primarily by enhanced carbon sequestration rather than by direct emission mitigation. Admittedly, graphical inspection alone cannot rule out small residual pre-treatment differences; however, the pre-policy coefficients are individually insignificant and display no systematic trend, and the pre-policy placebo test in the next section further alleviates the concern that such residual differences drive the post-policy findings.

4.3. Robustness Test

This study conducts a series of robustness tests on the baseline regressions from five perspectives, as reported in Table 4. (i) To further rule out the pre-existing trends, a pre-policy placebo was performed using only the sample period before the actual policy implementation (i.e., before 2011), with 2009 artificially set as the policy intervention year. The results in Panel A show that the estimated effects on ACP and CSP are statistically insignificant, suggesting that no policy effect existed prior to the formal implementation of HSFC. (ii) To alleviate estimation bias caused by measurement errors, the ratio of newly added HSFC area is used to replace the original HSFC area ratio. The estimation results show that the coefficients on ACP and CSP remain positive and statistically significant at no less than the 5% level, confirming the robustness of the baseline findings to alternative measurement of the core explanatory variable. (iii) This study further considers possible interference from other agriculture-supporting policies, including the fertilizer reduction policy and the land transfer policy (see Panel C and D). In 2015, the Ministry of Agriculture and Rural Affairs issued the “Action Plan for Zero Growth in Fertilizer and Pesticide Use by 2020”, followed by the “Action Plan for Fertilizer Reduction by 2025” in 2022. To avoid potential bias arising from these policy interventions, observations from 2015 onward are excluded and the model is re-estimated. The estimated coefficients for ACP and CSP are 0.089 and 0.132, respectively, both significant at the 1% level, and remain consistent with the baseline results. Furthermore, to exclude the potential influence of the land transfer policy, the land transfer rate (trans) is added as an additional control variable in the baseline model. The land transfer rate is measured as the ratio of the area of contracted farmland transferred by households to the total area of contracted farmland [34,35]. The results show that the estimated coefficients for ACP and CSP remain significantly positive at the 1% level, further supporting the baseline conclusion. (iv) To eliminate possible disturbances to agricultural production caused by the COVID-19 pandemic, the observations for 2020 are excluded from the sample. The estimation results for ACP and CSP remain robust after this adjustment. As for CMP, the estimated coefficients remain statistically insignificant across all five robustness tests, which is consistent with the baseline findings.
To further stringently test the asymmetric effect in carbon performance, this study employs the stacked regression method, combining the two dependent variables for estimation and constructing interaction terms between the core variables and equation indicator variables, as formula (13) shown.
Y i t = θ 0 + θ 1 H r a t i o i × p o s t t + θ 2 H r a t i o i × p o s t t × t y p e + ρ 1 X i t + ρ 2 X i t × t y p e + λ t × t y p e + α i × t y p e + ε i t
where a binary indicator type distinguishing the two carbon dimensions was introduced and interact it with the policy variable. When the value of Y is equal to CSP, the type is 1, otherwise it is 0. The coefficient θ2 on the interaction term captures the difference in HSFC effects between CSP and CMP. The results in Table 5 show that the coefficient on the interaction term is positive and statistically significant, regardless with or without control variables. This indicates that the effect of HSFC on CSP is significantly larger than that on CMP. Furthermore, the Wald test statistic for the interaction term is 23.53 (p < 0.001) and 27.74 (p < 0.001), significantly rejecting the null hypothesis that the same coefficient for CSP and CMP are the same. Thus, this study provides formal statistical evidence supporting the presence of structurally divergent carbon effects.

4.4. Source Decomposition of Asymmetric Carbon Effects

To unbox the fundamental drivers of ACP, the data in Table 6 reports the decomposed impacts of the HSFC policy on efficiency and technological change. Regarding aggregate performance, the estimated coefficients for overall EC and TC are significantly positive at the 1% and 5% levels, respectively. This structural decomposition indicates that the overarching carbon-performance dividends of the HSFC are powered by a dual mechanism: optimizing the allocation of agricultural resources (EC) and pushing the frontier of production technology outward (TC). Delving into the structural asymmetric effects on CS and CE, the decomposition further demystifies the distinct trajectories of sequestration and mitigation. The estimated coefficients for the sequestration-related components ( E C C S and T C C S ) are significantly positive at the 1% and 10% levels. This robust “dual-engine” propulsion implies that the ecological enhancements brought by HSFC not only tangibly shift the technological frontier of CS but also enable operational catch-up to best practices, thereby consistently translating into profound CS gains. Conversely, the fundamental source effects for CE ( E C C E and T C C E ) remain remarkably weak and statistically insignificant. This underlying stagnation suggests that the persistent failure to unlock CMP is fundamentally rooted in a structural deficit within the HSFC framework. Specifically, the policy currently lacks the necessary technological breakthroughs and green managerial optimizations required to effectively curb agricultural emissions amid scaled-up production. Thus, H2 has been verified.

4.5. Mechanism Analysis

Given that ACP originates from either efficiency improvement or technological progress, the mechanism analysis examines two aspects of farmland scale management and agricultural socialized services. From the perspective of farmland scale management (Table 7), the estimated coefficient of Hratio × post on AI is 0.034 and statistically significant at the 1% level, indicating a significant increase in the concentration index of contiguous field management after the implementation of HSFC policy. Subsequent regressions reveal that such scale expansion significantly elevates both EC and TC, though the effect on EC is more pronounced than that on TC. This suggests that HSFC not only optimizes resource allocation and operational workflows, such as reducing mechanical idling and streamlining field maneuvers, but also facilitates the adoption of improved cultivation technologies. Notably, AI robustly fosters CSP and also yields a significant but relatively weaker effect on CMP. This asymmetry in magnitude implies that while contiguous land provides a superior physical substrate for soil carbon sequestration (e.g., through enhanced organic matter retention), the associated efficiency and technological gains translate into more limited emission mitigation benefits, as the “rebound effect” of scaled-up energy consumption may partially offset potential emission reductions.
From the perspective of agricultural socialized services (Table 8), the regression result of Hratio × post on lnPSAOV is significant at the 10% level, indicating that HSFC also enhances the level of agricultural socialized services. Critically, unlike scale management, the expansion of socialized services significantly drives both EC and TC, with the effect on TC being particularly pronounced. This distinction underscores that external service providers act as conduits for knowledge diffusion and technological spillovers. By providing professionalized interventions, such as integrated pest management, precision harvesting, and smart irrigation, socialized services effectively introduce advanced “soft” technologies and management models that individual households could not otherwise access [24]. Moreover, while socialized services significantly improve CSP, their effect on CMP is comparatively weaker and only marginally significant. This pattern suggests that although the service market provides some emission mitigation benefits, a structural imbalance persists within the current service landscape. Specifically, the contemporary agricultural service market is predominantly oriented toward yield-enhancing and carbon-sequestering technologies (e.g., formula fertilization and water-saving irrigation), while specialized emission-reduction services remain relatively undersupplied. Consequently, while HSFC facilitates the “greening” of farmland through sequestration, its capacity to fully mobilize the service market for breaking the carbon-emission bottleneck remains limited. It should be noted that these mechanism regressions identify plausible transmission channels rather than formally validated causal mediation; the results should be interpreted as suggestive evidence on how the policy effects propagate.
Based on the above analysis, H3 is generally supported. Overall, these mechanism regressions can provide suggestive evidence on how the policy effects propagate.

4.6. Heterogeneity Analysis

The results in Table 9 report the results of the heterogeneity analysis from the three dimensions. First, considering that regional disparities in baseline mechanization levels may influence the carbon effects, the sample was divided into high- and low-mechanization groups based on the median of total agricultural machinery power. The results indicate that HSFC significantly enhances CSP in both groups, with comparable coefficient magnitudes, though the effect is statistically more robust in the high-mechanization group (significant at the 1% level versus 10% for the low-mechanization group). This suggests that the policy’s CSP-enhancing effect is broadly applicable across mechanization levels rather than being disproportionately concentrated in less-mechanized areas. Second, based on the classification of agricultural functional zones, the sample was stratified into major grain-producing areas and non-major producing areas2. The CSP coefficient is positive and significant at the 1% level in major producing areas (0.050), while the point estimate in non-major producing areas is larger (0.084) but does not reach statistical significance, potentially reflecting the greater heterogeneity and smaller sample size of these regions. Third, the heterogeneity was estimated by natural geographical location along the YEB, namely upstream, midstream and downstream3. The CSP coefficients are significantly positive at the 1% level in both midstream and downstream regions, whereas the upstream coefficient is negative and statistically insignificant. The upstream result may reflect the particular challenges of implementing HSFC in regions characterized by fragmented terrain and sloping farmland, where construction costs are higher and ecological trade-offs more complex. Meanwhile, the downstream reaches, endowed with superior baseline infrastructure, exhibit a comparable CSP effect to midstream areas.
Crucially, the estimated coefficients for CMP remain statistically insignificant across all heterogeneous subsamples, aligning with the baseline finding of stagnant emission mitigation. Notably, the CMP estimate is negative but not statistically significant in the low-mechanization group, while a significant positive effect of HSFC on CSP exists in the same group. This opposing directional pattern provides a meaningful empirical indication of the asymmetric impact identified in this study. In less-developed regions with limited mechanization, rapid infrastructure upgrading and subsequent production expansion tend to rely heavily on increased agricultural inputs and energy consumption. This inadvertently intensifies the emission burden, thereby rendering the HSFC policy particularly unfavorable for CMP in this specific context. From an institutional perspective, these patterns may also reflect fiscal and administrative implementation capacity: high-mechanization and major grain-producing areas typically possess stronger agricultural extension systems and better-maintained infrastructure, which facilitate the realization of HSFC’s sequestration benefits, whereas upstream regions face binding terrain constraints and higher unit construction costs.

5. Discussion

The empirical results reveal that HSFC significantly enhances overall ACP in the YEB, but such enhancement is characterized by a clear structural asymmetry: HSFC generates a significant positive effect on CSP, but the effect on CMP remains statistically insignificant. This asymmetry challenges the conventional assumption that farmland infrastructure upgrades automatically yield comprehensive low-carbon benefits. Instead, HSFC currently contributes more to strengthening the carbon sink function of agricultural systems rather than functioning as an immediately effective emission-reduction policy.
A key reason for this pattern is that HSFC is originally designed to improve the physical and ecological basis of agricultural production through measures such as land leveling, field consolidation, irrigation and drainage improvement, and soil enhancement. These interventions not only support grain productivity, but also create favorable conditions for soil carbon accumulation and the enhancement of farmland ecological functions. As a result, the positive effects of HSFC are more likely to be reflected in CSP. This interpretation is broadly consistent with previous studies showing that HSFC can improve agricultural ecological efficiency and support low-carbon agricultural development by optimizing production conditions and ecological patterns [9,36]. By contrast, the insignificant effect on CMP indicates that improved production conditions do not automatically translate into measurable mitigation of agricultural emissions. Adopting sustainable agricultural technologies usually requires higher initial investment and technology learning costs [37], and HSFC projects are difficult to change farmers’ high carbon behavior patterns without supporting measures. In some localities, HSFC implementation may still place insufficient emphasis on green development, and agricultural production continues to follow extensive modes of operation that prioritize output growth and rely heavily on material and energy inputs. In particular, both the farmland construction and the subsequent reorganization of agricultural production depend strongly on mechanized operations, which themselves constitute an important source of agricultural carbon emissions [16]. Moreover, this study adopts a broader carbon accounting framework that includes carbon dioxide, methane, and nitrous oxide. Since rice cultivation is a major source of methane emissions [17], and the YEB is one of China’s principal rice-producing regions, higher yields induced by HSFC may partly offset any mitigation gains achieved through improved input efficiency. This may explain why our findings differ from those of Guo and Zhang [9], likely due to differences in carbon accounting scope and the distinction between sequestration and mitigation.
The source decomposition and mechanism analyses further clarify why HSFC mainly improves CSP rather than CMP. The results show that HSFC enhances overall ACP through both efficiency improvement and technological progress, but these gains are primarily translated into sequestration-related outcomes. Farmland scale management improves both efficiency and technology adoption—albeit more strongly on the efficiency side—by reducing fragmentation and optimizing operational organization, while agricultural socialized services promote both channels with a particularly pronounced effect on technological diffusion. However, neither channel produces a strong mitigation effect on CMP. This suggests that the organizational and technological changes induced by HSFC are more compatible with enhancing soil and ecological carbon sinks than with directly reducing emission sources. The heterogeneity analysis further supports this interpretation. The CSP-enhancing effect is robust across mechanization levels and in major grain-producing areas, whereas the null effect in the upstream reaches—characterized by fragmented terrain and sloping farmland—indicates that implementation constraints can offset the policy’s sequestration potential in ecologically fragile regions. Conversely, the consistently insignificant mitigation effects across all subsamples suggest that the constraints on emission reduction are structural rather than regional. These patterns also resonate with international evidence on land consolidation. A systematic review of land consolidation projects worldwide shows that their environmental effects are ambivalent and depend critically on whether explicit land management measures are embedded in the projects [1]; similarly, a global assessment demonstrates that while agricultural land holds substantial carbon sequestration potential, translating this potential into actual emission reductions requires dedicated institutional frameworks and monitoring systems that remain underdeveloped in many regions [18]. In this sense, the asymmetry documented here—strong sequestration co-benefits without significant mitigation—is not unique to China’s HSFC but reflects a general challenge of translating farmland improvement into emission reduction.
Taken together, these findings provide a more nuanced understanding of the carbon implications of HSFC. While the policy does improve ACP, its current carbon benefits are mainly sequestration-oriented rather than mitigation-oriented. This has important policy implications. If HSFC is expected to contribute more substantially to agricultural carbon mitigation goals, it should be complemented by more targeted measures, such as fertilizer-use optimization, methane control in rice cultivation, low-emission machinery upgrading, and the development of specialized green agricultural service systems. Only by combining farmland improvement with direct emission-control measures can HSFC generate more balanced gains in both carbon sequestration and carbon mitigation.

6. Conclusions and Policy Implications

6.1. Research Conclusions

This study provides a nuanced assessment of the HSFC policy’s impact on ACP within China’s YEB. Using multi-source remote sensing data from 2007 to 2022 in the YEB, ACP was measured under the dual constraints of carbon emission mitigation and carbon sequestration by applying the biennial NDDF and the Luenberger index. A continuous DID model was further employed to systematically evaluate the policy effects. The main findings are as follows: Firstly, HSFC significantly improves overall ACP, but its effects differ across sub-dimensions. In particular, HSFC significantly enhances CSP, while its effect on CMP is not statistically significant. This indicates that the carbon benefits of HSFC are currently realized mainly through strengthening the sink function of agricultural systems rather than through directly reducing agricultural emissions. Secondly, source decomposition further shows that HSFC promotes ACP through both efficiency improvement and technological progress, but these gains are primarily translated into sequestration-related outcomes. In addition, mechanism analysis indicates that farmland scale management improves ACP mainly through efficiency enhancement, whereas agricultural socialized services promote both efficiency enhancement and technological progress; neither channel, however, delivers a strong mitigation effect on CMP. Moreover, the heterogeneity analysis reveals that the CSP-enhancing effect is robust across mechanization levels and in major grain-producing areas, whereas it is statistically absent in the upstream reaches characterized by fragmented terrain, and no significant CMP effect emerges in any subgroup. Overall, HSFC should be understood as a land-improvement policy with significant carbon co-benefits, but these benefits are more sequestration-oriented than mitigation-oriented.

6.2. Policy Implications

As a major Chinese practice in land consolidation, HSFC plays a substantial role in promoting agricultural low-carbon development; however, its effects vary across carbon dimensions and exhibit mechanistic variations. Based on the results of this study, the following policy recommendations are proposed:
(1)
Given the empirical finding that HSFC significantly enhances CSP but not CMP, HSFC implementation should be more closely integrated with green production objectives and targeted emission-reduction measures. In addition to improving land quality, irrigation systems, and agricultural infrastructure, greater attention should be paid to post-construction management, input reduction, and energy-use optimization.
(2)
HSFC should be combined with more targeted emission mitigation policies. Since the insignificant mitigation effect is partly associated with continued dependence on machinery, agrochemical inputs, and methane emissions from rice cultivation, complementary measures are needed, including low-emission machinery upgrading, fertilizer and pesticide reduction, water-saving irrigation, and methane-control technologies in paddy fields. At the same time, monitoring systems for agricultural greenhouse gas emissions should be improved to support more accurate policy design.
(3)
Given the heterogeneous effects across regions, differentiated policy arrangements should be adopted according to local conditions. The sequestration benefits of HSFC appear broadly applicable across regions, but implementation in ecologically fragile and topographically fragmented areas—such as the upstream reaches of the YEB—faces higher construction costs and greater ecological trade-offs, and therefore calls for adapted technical standards and stricter ecological screening; emission-intensive areas, in turn, would benefit from more coordinated policies that balance productivity enhancement, ecological restoration, and emission control.

6.3. Limitations and Future Research

This study has several limitations that suggest directions for future research. First, HSFC is identified from multi-source remote sensing data and landscape metrics rather than official project registries; despite cross-validation against national land survey information, such an indicator captures physical farmland conditions rather than administrative enrollment, and future work could exploit project-level administrative data when they become available. Second, although the carbon accounting framework adopted here is broader than that of earlier studies, it still relies on estimated emission factors, which may introduce measurement error in CMP; process-based models or ground-level monitoring could refine these estimates. Finally, the analysis focuses on the YEB; replications in other major agricultural regions and systematic comparisons with land consolidation programs in Europe and elsewhere would enhance the external validity of the findings.

Supplementary Materials

The following supporting information can be downloaded at: https://www.mdpi.com/article/10.3390/land15091662/s1. Table S1. The indicator system for agricultural carbon emission and the corresponding emission coefficients [38,39,40,41,42,43,44,45]. Table S2. Methane emission coefficients during the growth cycle of rice in various provinces of the YEB (unit: g (CH4)/m2). Table S3. The average carbon density of four carbon pools corresponding to farmland in various regions of the YEB. (Unit: Mg (C)/ha) [46,47]. Figure S1. The linear fitting result for provincial HSFC stimulated area and statistical HSFC data. Figure S2. The spatial distribution of HSFC land area ratio within the YEB in 2007 and 2022. Figure S3. The variation trend of agricultural carbon performance (ACP), efficiency change (EC) and technical change (TC) in the YEB during 2007–2022 [48,49].

Author Contributions

Conceptualization, C.Z. and W.F.; methodology, C.Z. and H.D.; software, R.X.; validation, C.Z., W.F. and H.D.; formal analysis, C.Z.; data curation, R.X.; writing—original draft preparation, C.Z.; writing—review and editing, C.Z. and H.D.; supervision, W.F. All authors have read and agreed to the published version of the manuscript.

Funding

This research was funded by the Shaanxi Provincial Social Science Foundation Annual Project, grant number 2025QBR079, and the Xi’an Social Science Planning Fund Project, grant number Y26QL03.

Data Availability Statement

The raw data supporting the conclusions of this manuscript will be made available by the authors upon request.

Conflicts of Interest

The authors declare no conflicts of interest.

Abbreviations

The following abbreviations are used in this manuscript:
HSFCHigh-Standard Farmland Construction
ACPAgricultural carbon performance
CSPCarbon sequestration performance
CMPCarbon mitigation performance
YEBthe Yangtze River Economic Belt
NDDFNon-radial directional distance function
ECEfficiency change
TCTechnical change

Notes

1
The map of China in Figure 1 is based on the standard map with review number GS(2019)1697, which is downloaded from the Standard Map Service website of the Map Technical Review Center under the Ministry of Natural Resources, with no modifications to the base map boundaries.
2
As mentioned in Section 3.1, the major grain-producing areas in the YEB include six provinces: Anhui, Jiangsu, Hubei, Hunan, Jiangxi, and Sichuan.
3
The upstream includes Yunnan, Guizhou, Sichuan, and Chongqing, the midstream includes Hubei, Hunan, and Jiangxi, and the downstream includes Shanghai, Zhejiang, Jiangsu, and Anhui.

References

  1. Janečková Molnárová, K.; Sklenička, P.; Bohnet, I.C.; Lowther-Harris, F.; van den Brink, A.; Movahhed Moghaddam, S.; Fanta, V.; Zástěra, V.; Azadi, H. Impacts of land consolidation on land degradation: A systematic review. J. Environ. Manag. 2023, 329, 117026. [Google Scholar] [CrossRef] [Scilit] [PubMed]
  2. Jiang, Y.; Long, H.; Tang, Y.; Deng, W. Deciphering how promoting land consolidation for village revitalization in rural China: A comparison study. J. Rural Stud. 2024, 110, 103349. [Google Scholar] [CrossRef] [Scilit]
  3. Gong, Y.; Zhang, Y.; Chen, Y. The Impact of High-Standard Farmland Construction Policy on Grain Quality from the Perspectives of Technology Adoption and Cultivated Land Quality. Agriculture 2023, 13, 1702. [Google Scholar] [CrossRef] [Scilit]
  4. Hao, S.; Wang, G.; Yang, Y.; Zhao, S.; Huang, S.; Liu, L.; Zhang, H. Promoting grain production through high-standard farmland construction: Evidence in China. J. Integr. Agric. 2024, 23, 324–335. [Google Scholar] [CrossRef] [Scilit]
  5. Li, R.; Zhou, W.; Guo, S.; Song, J.; Xu, D. The impact of high-standard farmland construction on farmland abandonment by farm households: Evidence from rural China. Appl. Econ. 2025, 58, 2246–2262. [Google Scholar] [CrossRef] [Scilit]
  6. Xu, D.; Chen, M.; Li, R. How high-standard farmland construction can affect farmers’ grain cultivation behavior: Evidence from rural China. Habitat Int. 2025, 160, 103384. [Google Scholar] [CrossRef] [Scilit]
  7. Liu, H.; Zhang, W. Spatial and temporal variation and convergence in the efficiency of high-standard farmland construction: Evidence in China. J. Clean. Prod. 2024, 452, 142200. [Google Scholar] [CrossRef] [Scilit]
  8. Wang, X.; Shi, W.; Yu, Q.; Deng, X.; Zuo, L.; Shi, X.; Wang, M.; Li, J. Well-facilitated farmland improves nitrogen use efficiency and reduces environmental impacts in the Huang-Huai-Hai Region, China. J. Integr. Agric. 2025, 24, 3264–3281. [Google Scholar] [CrossRef] [Scilit]
  9. Guo, Z.; Zhang, X. The impact of China’s high-standard farmland construction plan on low-carbon development in agriculture. Sustain. Futures 2025, 10, 100934. [Google Scholar] [CrossRef] [Scilit]
  10. Ge, K.; Xu, H.; Liu, X.; Ke, S.; Tang, Y.; Lu, X. Dynamic evolution, regional disparities, and spatial convergence of high-standard farmland construction efficiency under rural industrial revitalization. Environ. Dev. Sustain. 2025, 1–30. [Google Scholar] [CrossRef] [Scilit]
  11. Wang, Q.; Yin, Q. How does sustainable farmland construction affect agricultural modernization? Evidence from high-standard farmland construction in China. Environ. Dev. Sustain. 2026, 1–29. [Google Scholar] [CrossRef] [Scilit]
  12. Liu, M.; Wang, B.; Xu, D. The impact of high-standard farmland construction on fertilizer reduction among farmers from a triple-scale perspective. J. Environ. Manag. 2026, 401, 128778. [Google Scholar] [CrossRef] [Scilit] [PubMed]
  13. GB/T30600-2022; Well-Facilitated Farmland Construction—General Rules. China National Standardization Administration: Beijing, China, 2022.
  14. Zheng, H.; Yuan, Z.; Li, Y.; Du, Y. The Impact of High-Standard Farmland Construction (HSFC) Policy on Green Agricultural Development (GAD): Evidence from China. Agriculture 2025, 15, 252. [Google Scholar] [CrossRef] [Scilit]
  15. Liu, Y.; Liao, W.; Zhang, X.; Qiu, H. Impact of high standard farmland construction policy on chemical fertilizer reduction: A case study of China. Front. Environ. Sci. 2023, 11, 1256028. [Google Scholar] [CrossRef] [Scilit]
  16. Zhuang, M.; Wang, X.; Yang, Y.; Wu, Y.; Wang, L.; Lu, X. Agricultural machinery could contribute 20% of total carbon and air pollutant emissions by 2050 and compromise carbon neutrality targets in China. Nat. Food 2025, 6, 513–522. [Google Scholar] [CrossRef] [Scilit] [PubMed]
  17. Shen, N.; Tan, J.; Wang, W.; Xue, W.; Wang, Y.; Huang, L.; Yan, G.; Song, Y.; Li, L. Long-term changes of methane emissions from rice cultivation during 2000–2060 in China: Trends, driving factors, predictions and policy implications. Environ. Int. 2024, 191, 108958. [Google Scholar] [CrossRef] [Scilit] [PubMed]
  18. Frank, S.; Derci Augustynczik, A.L.; Havlík, P.; Boere, E.; Ermolieva, T.; Fricko, O.; Di Fulvio, F.; Gusti, M.; Krisztin, T.; Lauri, P.; et al. Enhanced agricultural carbon sinks provide benefits for farmers and the climate. Nat. Food 2024, 5, 742–753. [Google Scholar] [CrossRef] [Scilit] [PubMed]
  19. Färe, R.; Shawna, G.; Norris, M.; Zhang, Z. Productivity Growth, Technical Progress, and Efficiency Change in Industrialized Countries. Am. Econ. Rev. 1994, 84, 66–83. Available online: https://www.jstor.org/stable/2117971 (accessed on 30 August 2026).
  20. Zhou, P.; Ang, B.W.; Wang, H. Energy and CO2 emission performance in electricity generation: A non-radial directional distance function approach. Eur. J. Oper. Res. 2012, 221, 625–635. [Google Scholar] [CrossRef] [Scilit]
  21. Wang, Y.; Li, Y. Promotion of degraded land consolidation to rural poverty alleviation in the agro-pastoral transition zone of northern China. Land Use Policy 2019, 88, 104114. [Google Scholar] [CrossRef] [Scilit]
  22. Olmstead, A.L.; Rhode, P. Induced Innovation in American Agiculture: A Reconsideration. J. Polit. Econ. 1993, 101, 100–118. [Google Scholar] [CrossRef] [Scilit]
  23. Zhang, Y.; Zhang, X.; Zhou, W.; Li, J.; Weng, Z.; Gao, X. The Impact of and Mechanism behind High-Standard Farmland Construction in Farmland Abandonment: A Moderated Mediating Analysis. Land 2024, 13, 846. [Google Scholar] [CrossRef] [Scilit]
  24. Lu, H.; Wu, J.; Wang, G.; Song, G.; Ye, J.; Yang, Y. Socialized Agricultural Services and Cultivated Land Use Resilience in China: Evolutionary Trends, Impact Mechanism, and Policy Implications. Land Degrad. Dev. 2025, 36, 4093–4105. [Google Scholar] [CrossRef] [Scilit]
  25. Liu, F.; Yan, H.; Kuang, W.; Hu, Y. Effectiveness of China’s High-Standard Farmland Projects in Improving Farmland Productivity Using Remote Sensing. Land Degrad. Dev. 2025, 36, 6137–6146. [Google Scholar] [CrossRef] [Scilit]
  26. Wei, S.; Dai, Y.; Liu, B.; Zhu, A.; Duan, Q.; Wu, L.; Ji, D.; Ye, A.; Yuan, H.; Zhang, Q.; et al. A China data set of soil properties for land surface modeling. J. Adv. Model. Earth Syst. 2013, 5, 212–224. [Google Scholar] [CrossRef] [Scilit]
  27. Panagos, P.; De Rosa, D.; Liakos, L.; Labouyrie, M.; Borrelli, P.; Ballabio, C. Soil bulk density assessment in Europe. Agric. Ecosyst. Environ. 2024, 364, 108907. [Google Scholar] [CrossRef] [Scilit]
  28. Zhang, N. Carbon Total Factor Productivity, Low Carbon Technology Innovation and Energy Efficiency Catch-up: Evidence from Chinese Thermal Power Enterprises. Econ. Res. J. 2022, 158–174. Available online: https://erj.ajcass.com/#/issue?id=109219&year=2022&issue=2/ (accessed on 30 August 2026). (In Chinese)
  29. Pastor, J.T.; Asmild, M.; Lovell, C.A.K. The biennial Malmquist productivity change index. Socio-Econ. Plan. Sci. 2011, 45, 10–15. [Google Scholar] [CrossRef] [Scilit]
  30. Fujii, H.; Managi, S.; Matousek, R. Indian bank efficiency and productivity changes with undesirable outputs: A disaggregated approach. J. Bank. Finance 2014, 38, 41–50. [Google Scholar] [CrossRef] [Scilit]
  31. Nunn, N.; Qian, N. The Potato’s Contribution to Population and Urbanization: Evidence from a Historical Experiment. Q. J. Econ. 2011, 126, 593–650. [Google Scholar] [CrossRef] [Scilit] [PubMed]
  32. Yang, J.; Huang, X. The 30 m annual land cover dataset and its dynamics in China from 1990 to 2019. Earth Syst. Sci. Data 2021, 13, 3907–3925. [Google Scholar] [CrossRef] [Scilit]
  33. He, H.S.; DeZonia, B.E.; Mladenoff, D.J. An aggregation index (AI) to quantify spatial patterns of landscapes. Landsc. Ecol. 2000, 15, 591–601. [Google Scholar] [CrossRef] [Scilit]
  34. Cao, A.; Guo, L.; Li, H. How does land renting-in affect chemical fertilizer use? The mediating role of land scale and land fragmentation. J. Clean. Prod. 2022, 379, 134791. [Google Scholar] [CrossRef] [Scilit]
  35. Zang, D.; Yang, S.; Li, F. The Relationship between Land Transfer and Agricultural Green Production: A Collaborative Test Based on Theory and Data. Agriculture 2022, 12, 1824. [Google Scholar] [CrossRef] [Scilit]
  36. Zhu, J.; Wang, M.; Zhang, C. Impact of high-standard basic farmland construction policies on agricultural eco-efficiency: Case of China. Natl. Account. Rev. 2022, 4, 147–166. [Google Scholar] [CrossRef] [Scilit]
  37. Schnack, A.; Bartsch, F.; Osburg, V.-S.; Errmann, A. Sustainable agricultural technologies of the future: Determination of adoption readiness for different consumer groups. Technol. Forecast. Soc. Change 2024, 208, 123697. [Google Scholar] [CrossRef] [Scilit]
  38. Chen, X.; Ma, C.; Zhou, H.; Liu, Y.; Huang, X.; Wang, M.; Cai, Y.; Su, D.; Muneer, M.A.; Guo, M.; et al. Identifying the main crops and key factors determining the carbon footprint of crop production in China, 2001–2018. Resour. Conserv. Recycl. 2021, 172, 105661. [Google Scholar] [CrossRef] [Scilit]
  39. Dubey, A.; Lal, R. Carbon Footprint and Sustainability of Agricultural Production Systems in Punjab, India, and Ohio, USA. J. Crop Improv. 2009, 23, 332–350. [Google Scholar] [CrossRef] [Scilit]
  40. Zhao, R.; Qin, M. Temporospatial Variation of Partial Carbon Source/Sink of Farmland Ecosystem in Coastal China. J. Ecol. Rural Environ. 2007, 1–6+11. (In Chinese) [Google Scholar]
  41. Cui, Y.; Khan, S.U.; Deng, Y.; Zhao, M. Spatiotemporal heterogeneity, convergence and its impact factors: Perspective of carbon emission intensity and carbon emission per capita considering carbon sink effect. Environ. Impact Assess. Rev. 2022, 92, 106699. [Google Scholar] [CrossRef] [Scilit]
  42. Streets, D.G.; Bond, T.C.; Carmichael, G.R.; Fernandes, S.D.; Fu, Q.; He, D.; Klimont, Z.; Nelson, S.M.; Tsai, N.Y.; Wang, M.Q.; et al. An inventory of gaseous and primary aerosol emissions in Asia in the year 2000. J. Geophys. Res. Atmos. 2003, 108, 8809. [Google Scholar] [CrossRef] [Scilit]
  43. Cao, G.; Zhang, X.; Wang, D.; Zheng, F. Inventory of Emissions of Pollutants from Open Burning Crop Residue. J. Agro-Environ. Sci. 2005, 24, 800–804. (In Chinese) [Google Scholar]
  44. West, T.O.; Marland, G. A synthesis of carbon sequestration, carbon emissions, and net carbon flux in agriculture: Comparing tillage practices in the United States. Agric. Ecosyst. Environ. 2002, 91, 217–232. [Google Scholar] [CrossRef] [Scilit]
  45. Min, J.; Hu, H. Calculation of Greenhouse Gases Emission from Agricultural Production in China. Chin. J. Popul. Resour. Environ. 2012, 22, 21–27. (In Chinese) [Google Scholar]
  46. Sharp, R.; Douglass, J.; Wolny, S.; Arkema, K.; Bernhardt, J.; Bierbower, W.; Chaumont, N.; Denu, D.; Fisher, D.; Glowinski, K.; et al. InVEST 3.9.2. User’s Guide; Stanford University: Stanford, CA, USA, 2020. [Google Scholar]
  47. Zhu, C.; Fan, W.; Wu, X.; Zhang, Z.; Chen, Y. Spatial mismatch and the attribution analysis of carbon storage demand and supply in the Yangtze River Economic Belt, China. J. Clean. Prod. 2024, 434, 140036. [Google Scholar] [CrossRef] [Scilit]
  48. Gong, B. Agricultural productivity convergence in China. China Econ. Rev. 2020, 60, 101423. [Google Scholar] [CrossRef] [Scilit]
  49. Chen, S.; Gong, B. Response and adaptation of agriculture to climate change: Evidence from China. J. Dev. Econ. 2021, 148, 102557. [Google Scholar] [CrossRef] [Scilit]
Figure 1. Location map of the Yangtze River Economic Belt (YEB)1.
Land 15 01662 g001
Figure 2. Technical flowchart for HSFC spatiotemporal database construction and area statistics.
Land 15 01662 g002
Figure 3. The parallel trend test results for ACP, CSP and CMP. ACP: agricultural carbon performance; CSP: carbon sequestration performance; CMP: carbon mitigation performance. The confidence interval of the regression results in the figure is 90%.
Land 15 01662 g003
Table 1. Main components of HSFC policy.
Construction
Project
Construction
Content
Construction Purpose
Farmland infrastructure construction projectField consolidationPlanning, leveling and consolidating farmland plots, optimizing their spatial layout to achieve relative concentration.
Irrigation and drainagePreventing farmland hazards and improving irrigation water use efficiency and water productivity.
Field roadsReasonably determining field road density to meet agricultural production needs and agricultural mechanization requirements.
Ecological environment conservationImproving soil and water conservation capacity and enhancing farmland ecological functions.
Power transmission and distributionBeing integrated with field roads, irrigation and drainage projects, to support modern farmland construction and management.
Farmland productivity improvement projectSoil improvementImproving sandy, clayey, saline-alkali, and acidified soils, thereby enhancing farmland soil quality.
Elimination of restrictive soil layersEliminating constraints imposed by restrictive soil layers on crop root growth and water-air movement.
Soil fertility enhancementMaintaining or improving farmland productivity through measures such as straw returning, organic fertilizer application, green manure cultivation, deep plowing, and subsoiling.
Note: This table is compiled based on the “National HSFC Plan (2021–2030)” and the “General Rules for HSFC” (GB/T 30600-2022) [13].
Table 2. Definition of main variables and descriptive statistical results.
VariablesDefinitions (Unit)Obs.MeanStandard
Deviation
Explained
variables
ACPBiennial non-radial Luenberger productivity indicators (%)20804.32711.568
CSPCarbon sequestration performance (%)20801.5215.941
CMPCarbon mitigation performance (%)20800.9707.248
Explanatory
variable
HratioRatio of HSFC area to total farmland area (%)208055.23618.263
Mechanism variablesAIAgglomeration index of farmland208069.52115.174
PSAOVOutput value of professional and support activities for agriculture, forestry, animal husbandry, fishery (108 yuan)208012.22216.423
Control
variables
ELper capita GDP (104 yuan)20804.6763.392
ALTotal output value of agriculture, forestry, animal husbandry and fishery/primary industry employees (104 yuan)208033.36950.477
FSRatio of agricultural, forestry and water affairs expenditure to total fiscal expenditure (%)20804.3665.673
ISRatio of the output value of the secondary and tertiary industries to GDP (%)208012.3084.420
URUrbanization rate of permanent population (%)208086.5767.905
ERPercentage of word frequency related to environmental regulations (%)208050.28314.748
MTAnnual average temperature (°C)20800.3780.172
MRAnnual sunshine duration (hours)208016.6511.978
MPAnnual average precipitation (mm)20801640.743374.648
Table 3. Baseline regression results of HSFC on agricultural carbon performance.
ACPComprehensive Input PerformanceEconomic PerformanceCSPCMP
Harto × post0.088 ***0.0010.021 *0.048 ***0.018
(0.025)(0.008)(0.013)(0.014)(0.015)
Control variablesYesYesYesYesYes
City fixedYesYesYesYesYes
Year fixedYesYesYesYesYes
N20802080208020802080
R20.1920.2080.2350.2150.081
Note: * and *** represent the significance levels of 10% and 1%, respectively. Robust standard errors are reported in parentheses. Please refer to Table 2 for symbol abbreviations in Table 2.
Table 4. The robustness test results.
Robustness Test StrategyACPCSPCMP
Panel A: assuming 2009 is the policy year−0.079−0.011−0.038
(0.050)(0.029)(0.035)
N520520520
R20.2140.2360.169
Panel B: using the ratio of newly added HSFC area0.192 **0.323 ***−0.052
(0.094)(0.050)(0.066)
N195019501950
R20.1930.2330.090
Panel C: excluding the fertilizer reduction policy interference0.139 ***0.064 ***0.041
(0.034)(0.014)(0.028)
N117011701170
R20.1940.2080.131
Panel D: excluding the land transfer policy interference0.084 ***0.041 ***0.021
(0.024)(0.012)(0.017)
trans0.0340.060 **−0.028
(0.045)(0.027)(0.027)
N208020802080
R20.1920.2170.081
Panel E: eliminating samples of 20200.096 ***0.050 ***0.022
(0.026)(0.014)(0.018)
N195019501950
R20.1870.2080.072
Note: ** and *** represent the significance levels of 5% and 1%, respectively. Robust standard errors are reported in parentheses. The fixed effects of city and year have been controlled. The control variables are the same as Table 3.
Table 5. The results of further asymmetric effect test.
(1)(2)
YY
Hratio × post0.0060.018
(0.017)(0.018)
Hratio × post × type0.048 ***0.030 ***
(0.009)(0.006)
Control variablesNoYes
City fixedYesYes
Year fixedYesYes
F statistic23.53 ***27.74 ***
_cons−0.031−17.746
(0.540)(17.730)
N41604160
R20.1280.136
Note: *** represents the significance levels of 1%. Robust standard errors are reported in parentheses.
Table 6. The source decomposition results of asymmetric carbon effects.
ECTC E C C S T C C S E C C E T C C E
Hratio × post0.034 ***0.043 *0.028 **0.026 *0.021−0.015
(0.013)(0.023)(0.014)(0.015)(0.015)(0.018)
Control variablesYesYesYesYesYesYes
City fixedYesYesYesYesYesYes
Year fixedYesYesYesYesYesYes
N208020802080208020802080
R20.2270.2100.2130.2310.1300.093
Note: *, ** and *** represent the significance levels of 10%, 5% and 1%, respectively. Robust standard errors are reported in parentheses.
Table 7. The mechanism analysis for farmland scale management.
AIECTCCSPCMP
Hratio × post0.034 ***0.026 **0.038 *0.047 ***0.003
(0.013)(0.013)(0.023)(0.013)(0.016)
AI 0.235 ***0.144 ***0.210 ***0.086 **
(0.023)(0.052)(0.027)(0.037)
_cons67.680 ***−17.381 ***−7.197 **−15.023 ***−5.105 **
(0.549)(1.648)(3.597)(2.010)(2.563)
Control variablesYesYesYesYesYes
City fixedYesYesYesYesYes
Year fixedYesYesYesYesYes
N20802080208020802080
R20.9040.2650.2150.2390.074
Note: *, ** and *** represent the significance levels of 10%, 5% and 1%, respectively. Robust standard errors are reported in parentheses.
Table 8. The mechanism analysis of agricultural socialized services.
lnPSAOVECTCCSPCMP
Hratio × post0.002 *0.033 **0.039 *0.052 ***0.004
(0.001)(0.013)(0.022)(0.013)(0.016)
lnPSAOV 0.433 *1.508 ***0.883 ***0.677 *
(0.262)(0.506)(0.253)(0.365)
_cons1.704 ***−2.196 ***−0.046−2.285 ***−0.435
(0.055)(0.628)(1.257)(0.826)(0.932)
Control variablesYesYesYesYesYes
City fixedYesYesYesYesYes
Year fixedYesYesYesYesYes
N20802080208020802080
R20.8700.2280.2150.2140.073
Note: *, ** and *** represent the significance levels of 10%, 5% and 1%, respectively. Robust standard errors are reported in parentheses.
Table 9. The heterogeneity analysis results.
Agricultural MechanizationAgricultural Functional AreasNatural Geographical Location
HighLowMajor Production AreaNon-Major Production AreaUpstreamMidstreamDownstream
CSP0.050 ***0.050 *0.050 ***0.084−0.0590.041 ***0.045 ***
(0.010)(0.029)(0.010)(0.076)(0.069)(0.015)(0.008)
N104010401472608752672656
R20.3300.1890.3850.1500.0440.3630.648
CMP0.005−0.0030.0060.0500.0460.0020.012
(0.022)(0.024)(0.017)(0.056)(0.119)(0.018)(0.028)
N104010401472608752672656
R20.0620.1340.0550.2000.1670.0700.163
Note: ***, * represent the significance levels of 1% and 10%, respectively. Robust standard errors are reported in parentheses. The fixed effects of city and year have been controlled. The control variables are the same as Table 3.
Disclaimer/Publisher’s Note: The statements, opinions and data contained in all publications are solely those of the individual author(s) and contributor(s) and not of MDPI and/or the editor(s). MDPI and/or the editor(s) disclaim responsibility for any injury to people or property resulting from any ideas, methods, instructions or products referred to in the content.