1. Introduction
Historic districts (HDs) are not merely physical repositories of urban heritage; they are also places where cultural memory, spatial experience, and public life are continuously perceived, practiced, and reproduced [
1,
2,
3,
4]. Accordingly, the emphasis in HD renewal has shifted from the restoration of individual buildings and the upgrading of physical infrastructure to the overall streetscape and its associated cultural and human-scale experiences [
5,
6]. From a human-scale perspective, street-level perception is particularly important in HDs since it mediates how cultural heritage is recognized and how visual qualities are experienced in everyday life [
7,
8]. Previous studies have mainly focused on several dimensions relevant to HD renewal, such as inherent cultural character, perceived spatial organization, and visual comfort [
9,
10]. However, these dimensions tend to be examined separately, with limited effort to integrate them within a diagnostic framework.
This study proposes a multidimensional framework for diagnosing streetscape perception in HD renewal, incorporating three related but non-interchangeable dimensions: cultural character recognition (CCR), spatial order (SO), and visual comfort (VC). The rationale for integrating these dimensions is due to the hypothesis that satisfactory performance in one dimension does not necessarily compensate for deficiencies in another. For example, although physical upgrading may improve the spatial order and visual comfort of a historic streetscape, the extensive use of modern materials and façades may weaken the recognizability of its cultural character and associated historical atmosphere. An integrated assessment is therefore required to identify dimension-specific and overlapping deficiencies that may be overlooked when the three dimensions are examined separately in existing studies. Moreover, such an assessment can provide a replicable and fine-scale basis for identifying perceptual deficiencies and supporting evidence-based renewal decisions in HDs [
11,
12].
Traditional assessments of HDs mainly rely on field surveys, expert scoring, and questionnaires [
3,
6,
13]. These methods are indispensable for subjectively interpreting the cultural value of an HD, yet they are often labor-intensive and costly, resulting in limited spatial coverage [
14,
15,
16,
17]. Recent advances in street-view imagery (SVI), computer vision (CV), and urban artificial intelligence (AI) have provided new opportunities to assess the built environment [
18,
19,
20]. In particular, SVI has become an important data source for human-scale urban studies as it records the urban environment at the street level [
12,
19,
21,
22]. Biljecki and Ito [
14] reviewed its applications in urban analytics and GISscience, including vegetation assessment, transportation analysis, health studies, and environmental-quality assessment. Compared with remote-sensing imagery, SVI captures visible elements that can be directly perceived by pedestrians, including building façades, sidewalks, vegetation, sky visibility and signage [
3,
8,
23,
24]. CV methods further extend the analytical capacity of SVI. Representative semantic segmentation models, such as DeepLab, fully convolutional networks (FCNs), and U-Net, have been extensively used to extract pixel-level visual elements in the literature [
13,
20,
25,
26]. Image classification tasks have been performed to infer subjective perceptions of streetscapes, including beauty, safety, vitality, wealth, depression, and boredom [
3,
9,
27,
28,
29]. These methods enable large-scale street-view images to be transformed into reproducible indicators and spatial maps, making them particularly suitable for streetscape assessments that require broader spatial coverage [
15,
16,
19,
30].
Existing studies of streetscape perception can be broadly summarized into three groups relevant to HD renewal [
7,
8,
31,
32,
33,
34]. The first focuses on cultural character recognition (CCR). These studies examine how visible heritage attributes—including historic façades, traditional materials and colors, architectural details, local symbols, and streetscape form—influence the recognition of heritage value, place identity, and historic character [
3,
4,
7,
8,
13,
17].
The second focuses on spatial order (SO) perception and its influence on pedestrian experience. Spatial attributes such as openness, enclosure, street curvature, building density, height-to-width ratio and interface continuity have been examined in relation to spatial legibility, coherence, and pedestrian mobility [
6,
15,
23,
35]. Studies of HDs have shown that the balance between openness and enclosure affects how street space is perceived, while excessive enclosure may produce a sense of oppression and psychological stress [
1,
6,
9]. In historic alleyway settings, spatial openness measured by the depth-to-height ratio, building density, and street curvature has been found to affect perceived spatial harmony and legibility, suggesting that SO depends on the combined effects of openness, enclosure, and street-scale continuity [
6].
The third group examines people’s evaluative responses to overall visual comfort (VC). It has been suggested that sky visibility and the height-to-width ratio are associated with human comfort [
10,
27,
36,
37,
38]. VC is further shaped by greenery, building interfaces, road surfaces, vehicles, pedestrians, water bodies, and visually disordered elements [
39,
40,
41,
42,
43,
44,
45]. Recent street-view-based studies have also shown that green-view-related indicators, together with walkability, enclosure, imageability, and visual complexity, are useful for explaining human-scale visual environmental quality [
30,
46]. However, it should be noted that the effects of these elements on cultural and esthetic perception, emotional responses, and environmental stress may vary across road types and spatial contexts [
9,
16,
23,
45]. Therefore, streetscape assessment in HDs should not be reduced to a single score but should integrate CCR, SO, and VC within a unified framework.
In summary, three gaps remain in the literature. First, although SVI has been widely applied in urban studies, its use in integrated streetscape assessments specifically designed for HDs remains limited. Second, existing studies often examine individual dimensions such as esthetics, comfort, safety, vitality, or historic character, but pay insufficient attention to the relationships and overlapping deficiencies among CCR, SO, and VC [
46,
47,
48,
49,
50]. Third, how streetscape perception results can inform spatial diagnosis and targeted renewal decision-making has received limited attention in the literature [
6,
16].
To address these gaps, this study proposes a multidimensional framework for diagnosing streetscape perception using SVI, subjective perception evaluation, and deep-learning techniques. Taking the Pengcheng Qili historic district in Xuzhou as a case study, the framework assesses CCR, SO, and VC. First, subjective perception judgments were collected through pairwise comparisons of sampled street-view images, and the Bradley–Terry model [
25,
42] was used to construct perception scores and grade labels. Second, three ResNet50 classification models [
9,
39] were trained to extend the subjective evaluations from the annotated samples to street-view images throughout the study area. Finally, point-level aggregation, spatial mapping, spatial statistical analysis, and multidimensional profile classification were applied to identify the spatial distribution of single- and multidimensional perceptual deficiencies and provide evidence for differentiated renewal strategies. By linking subjective evaluation with deep learning prediction and spatial diagnosis, the study provides a replicable approach for supporting perception-oriented renewal decisions in HDs. It should be noted that this study focuses on internal perceptual differentiation within a historic-district context, rather than distinguishing historic districts from ordinary urban areas.
2. Materials and Methods
2.1. Study Area
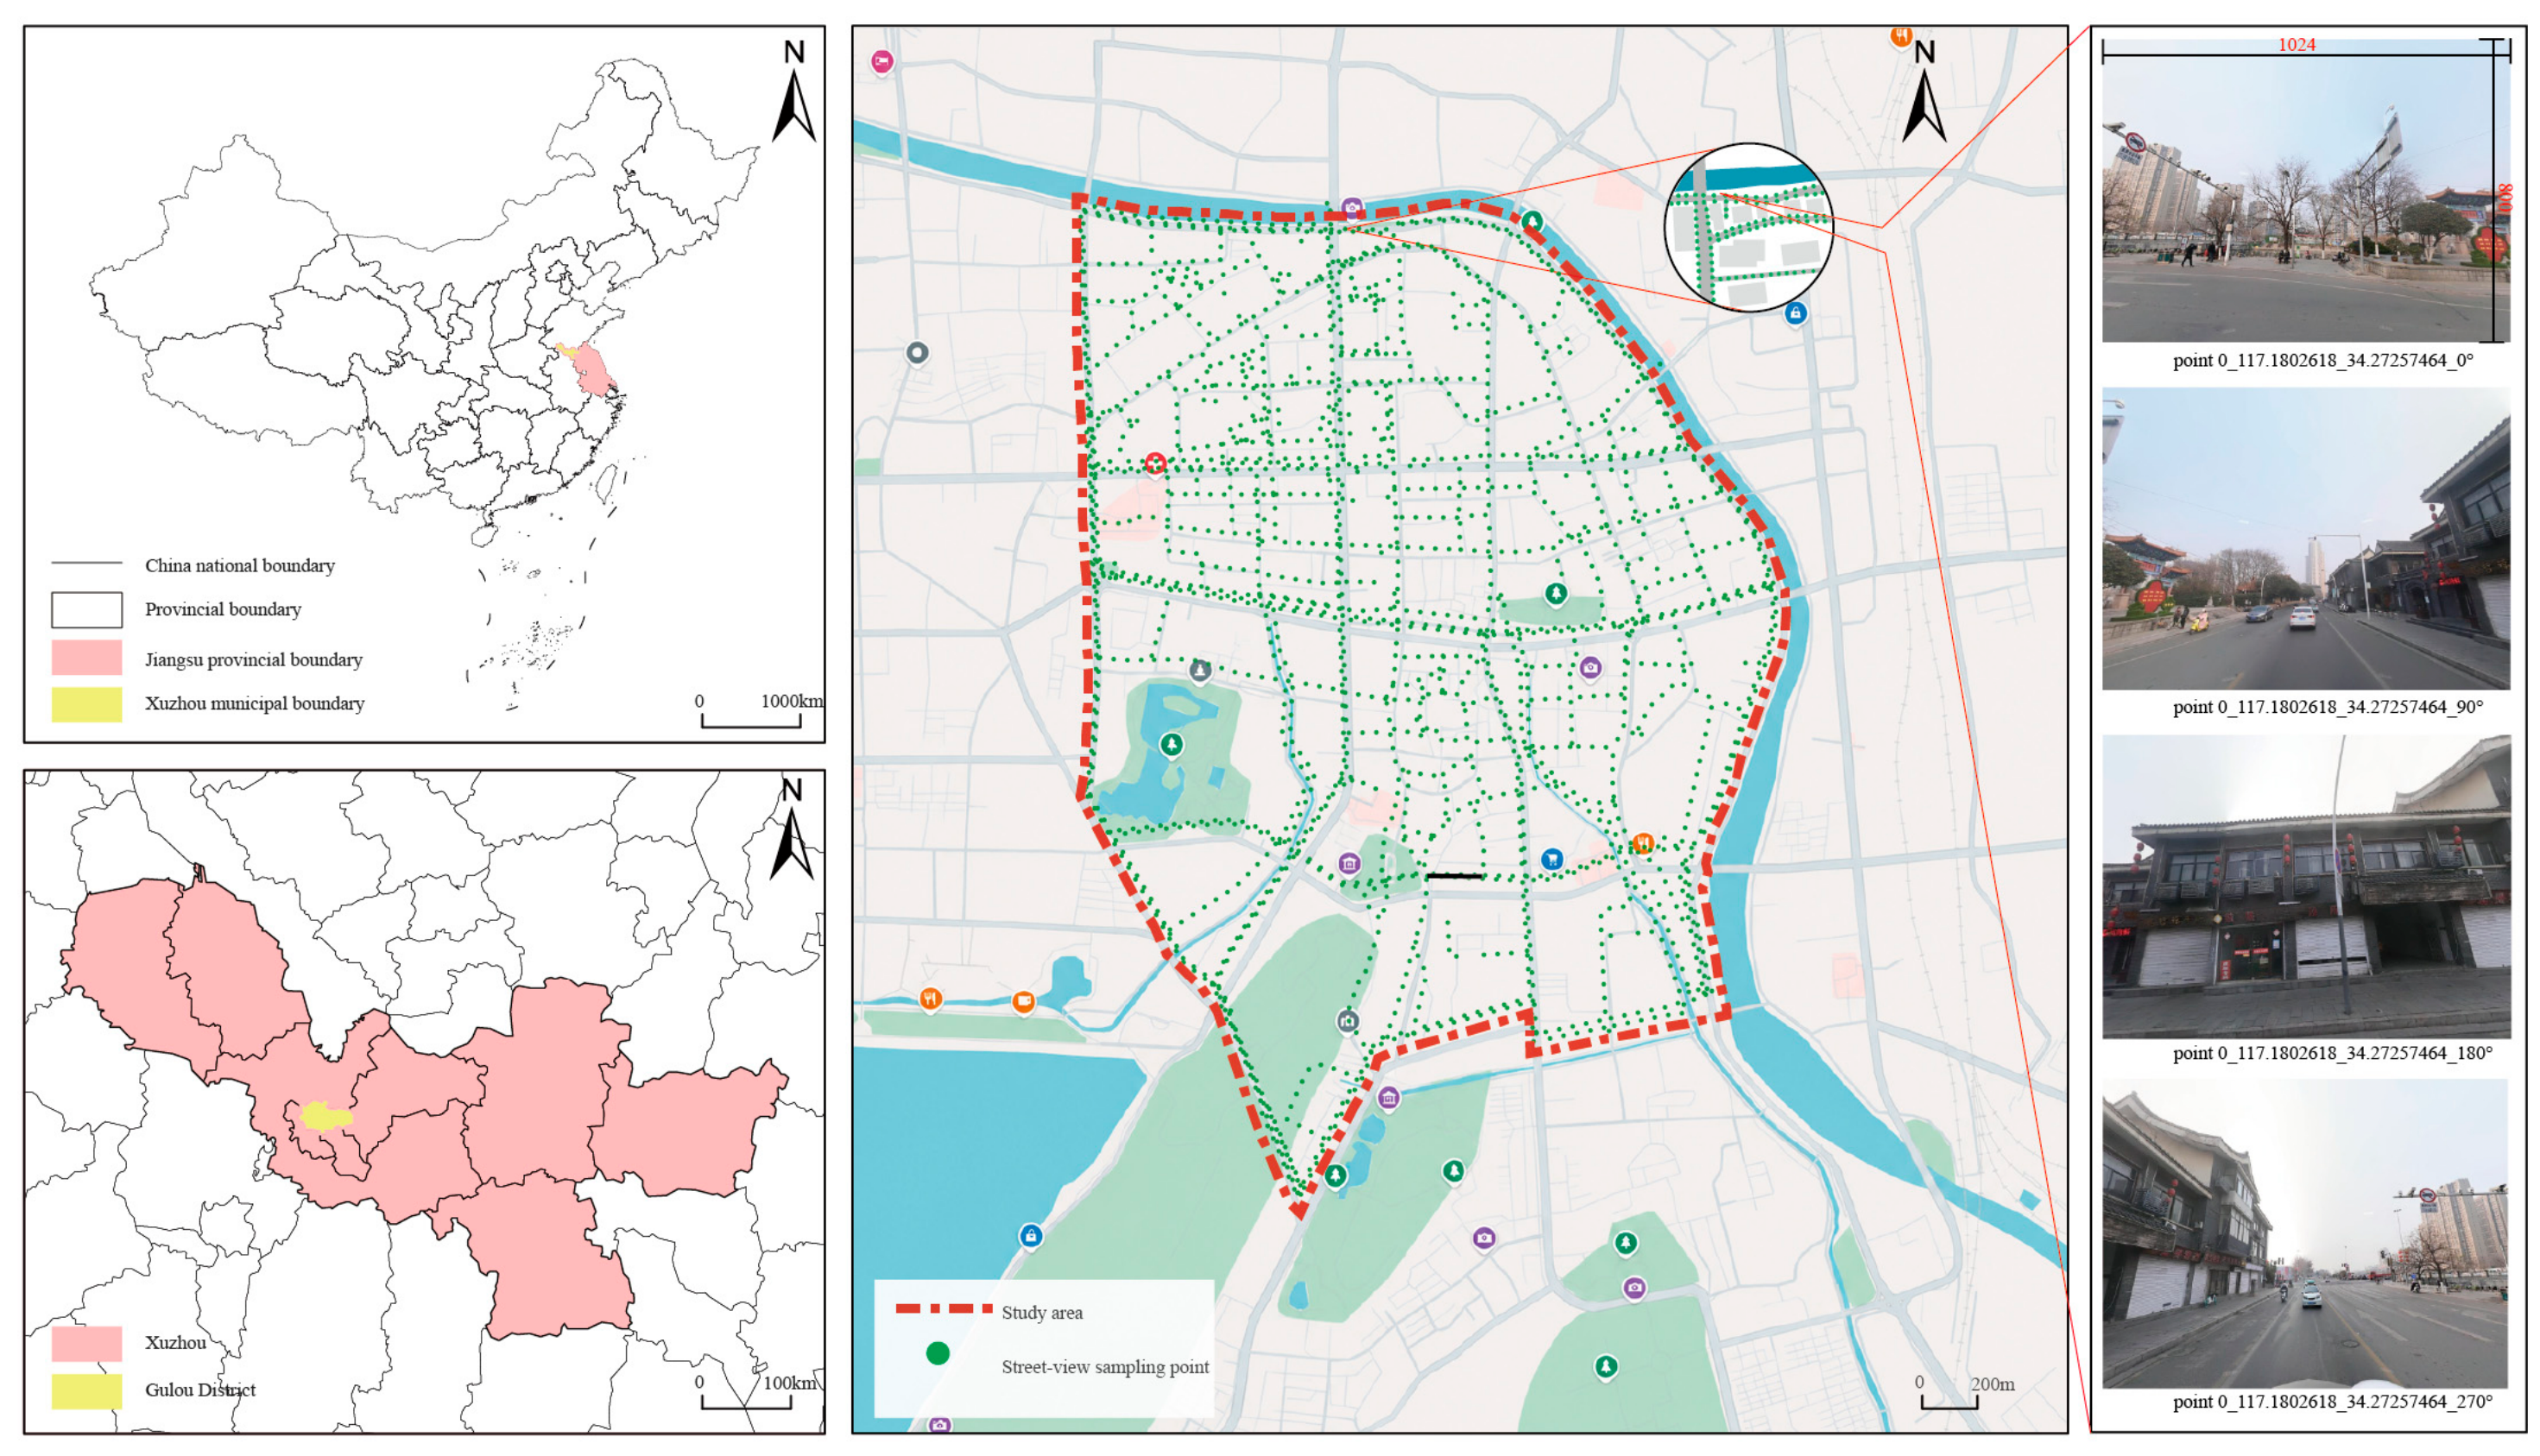
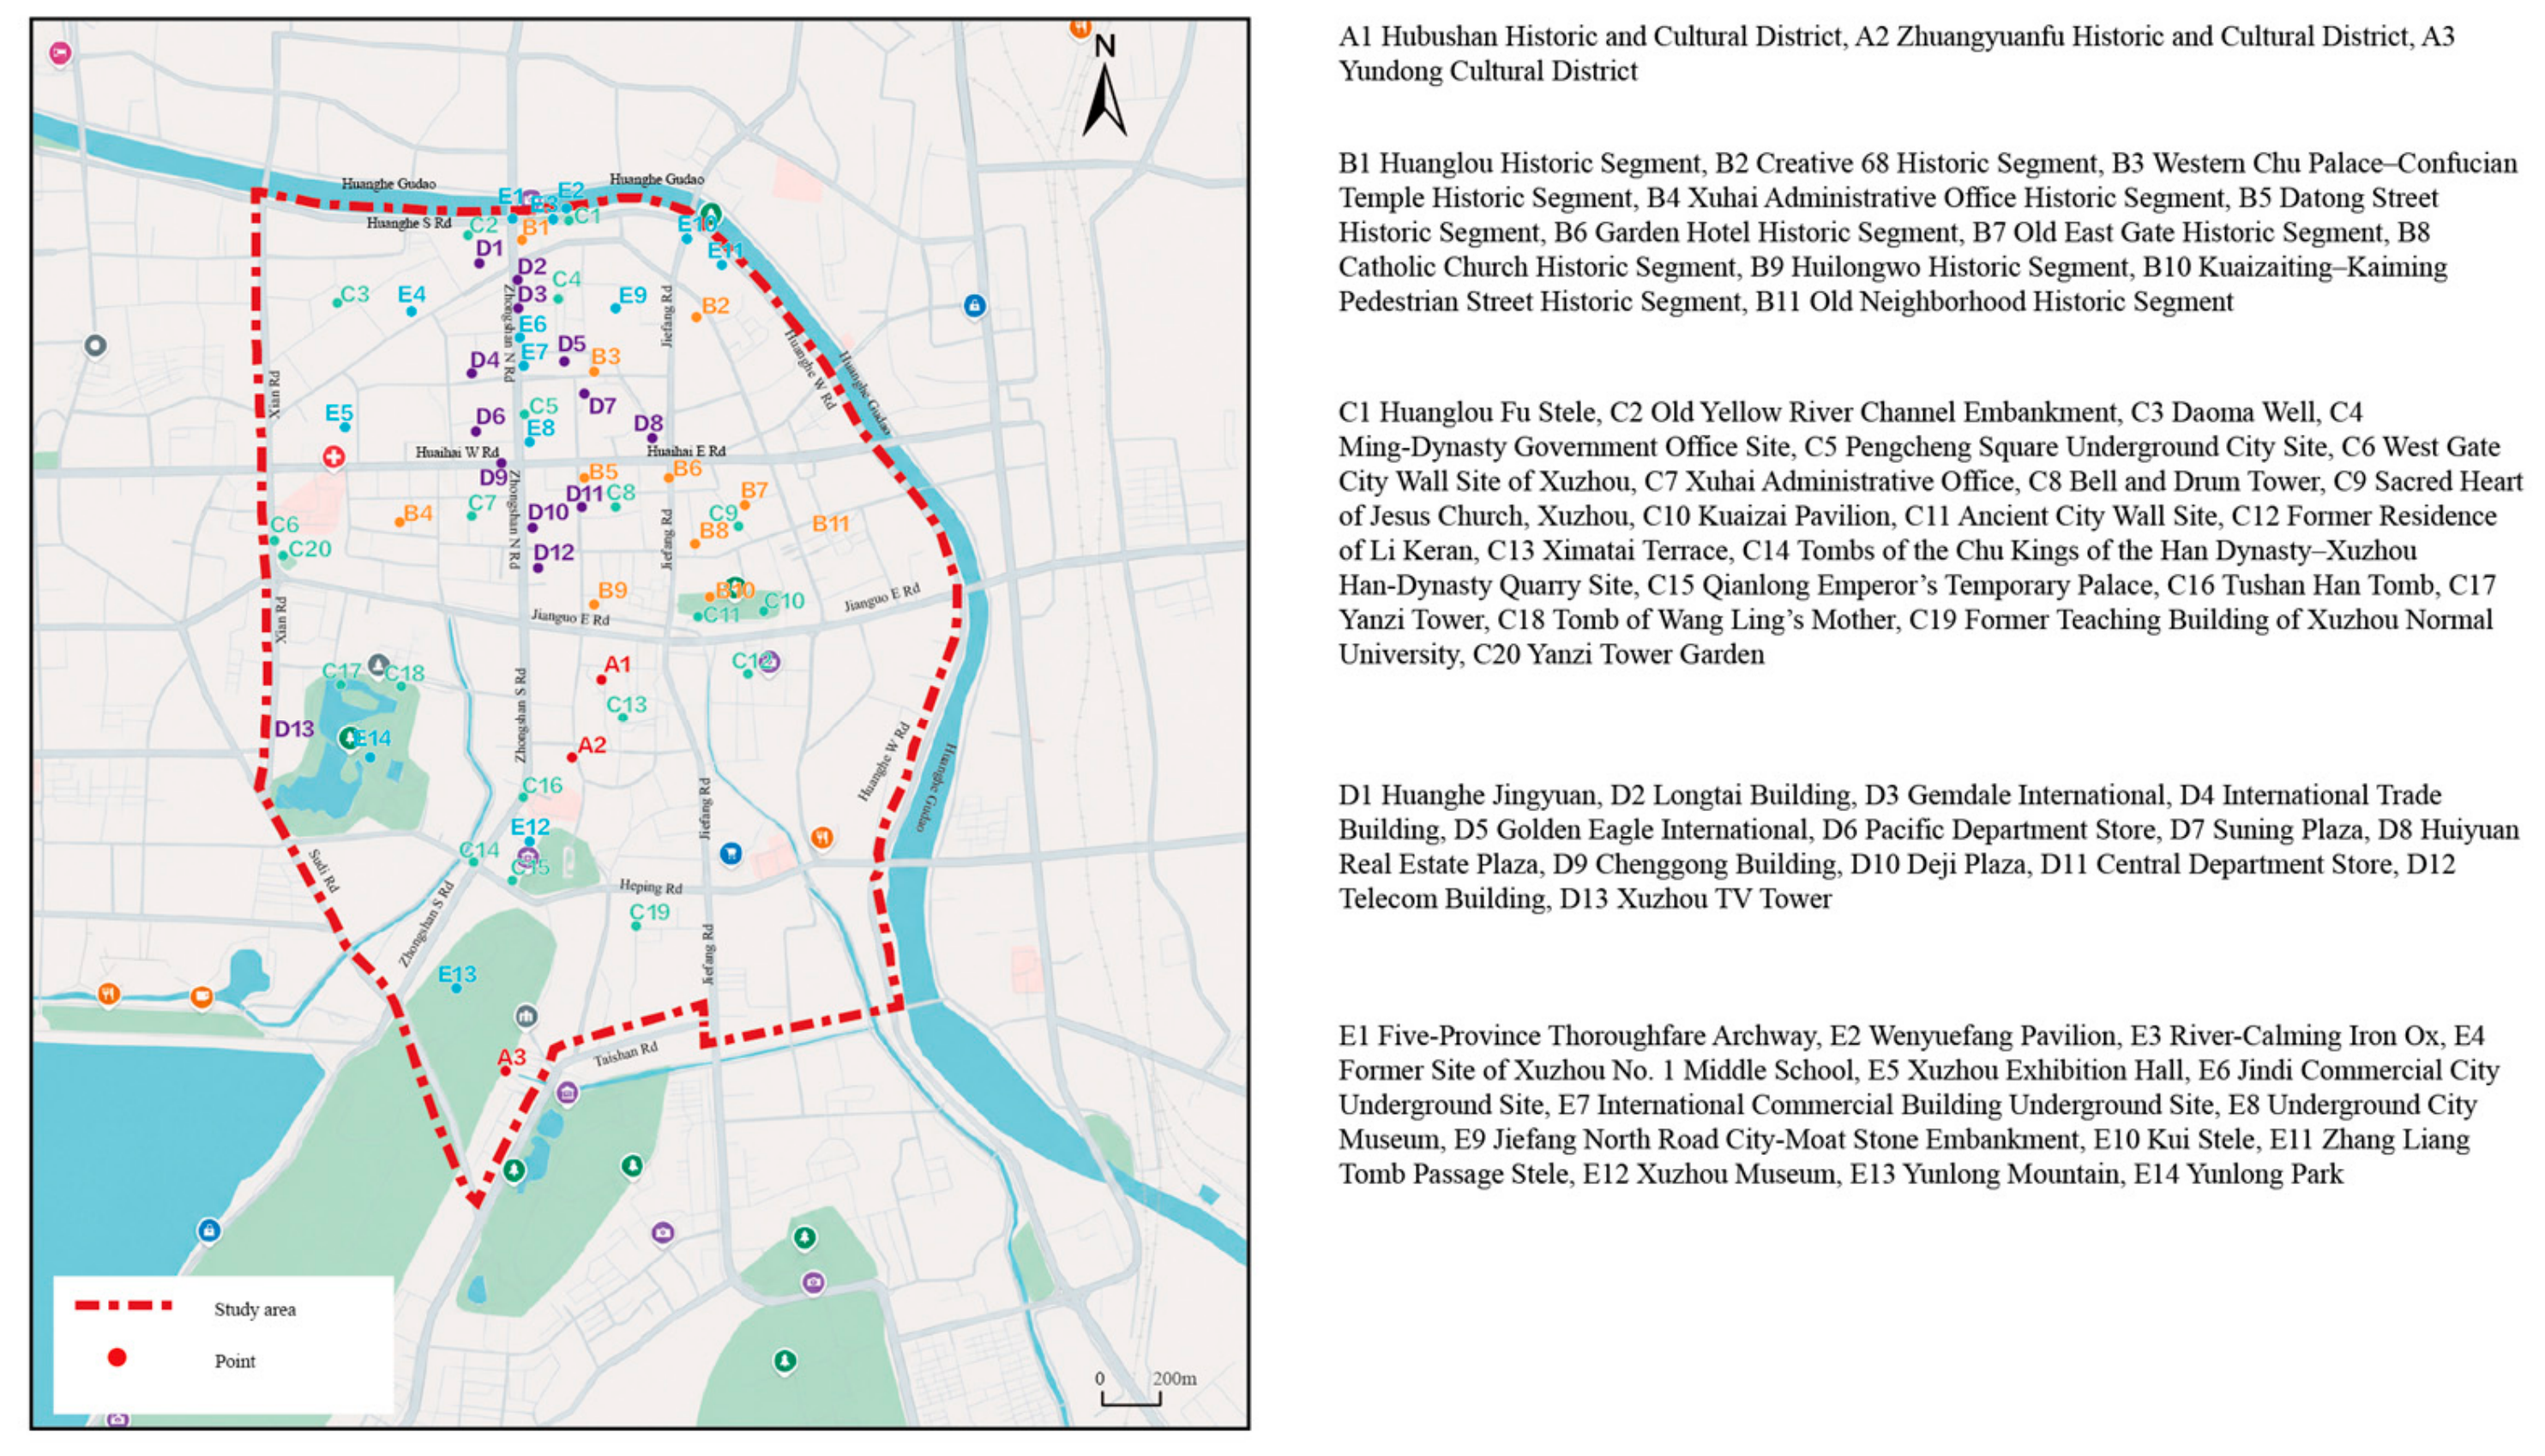
This study selected the Pengcheng Qili historic district in Xuzhou, China, as the case study area (
Figure 1), as the area contains numerous cultural heritage resources (
Figure 2) and is currently undergoing active urban renewal. Pengcheng Qili refers to an approximately 3.5 km long historic and cultural urban axis. This axis connects important historical and cultural nodes such as the Underground City Site Museum (E8 in
Figure 2), Huilongwo (B9 in
Figure 2), Kuaizaiting Park (B10 in
Figure 2), Hubushan (A1 in
Figure 2), and Huanglou Park (B1 in
Figure 2). In addition, the Huanghe Gudao forms a riverine corridor that partially encircles the study area and constitutes an important landscape and spatial boundary of Pengcheng Qili. The area contains 97 heritage assets and 235 historical remains, making it central to Xuzhou’s historical memory and urban identity. As a key urban renewal project, the city aims to integrate historic conservation, cultural tourism, commercial activity, and everyday residential life. The street environments within the area are diverse, including traditional alleys, historic street frontages, commercial streets, and neighborhood streets in residential areas. These characteristics make Pengcheng Qili a suitable case for evaluating CCR, SO, and VC using SVI and applying the proposed multidimensional framework.
2.2. Multidimensional Perception Framework
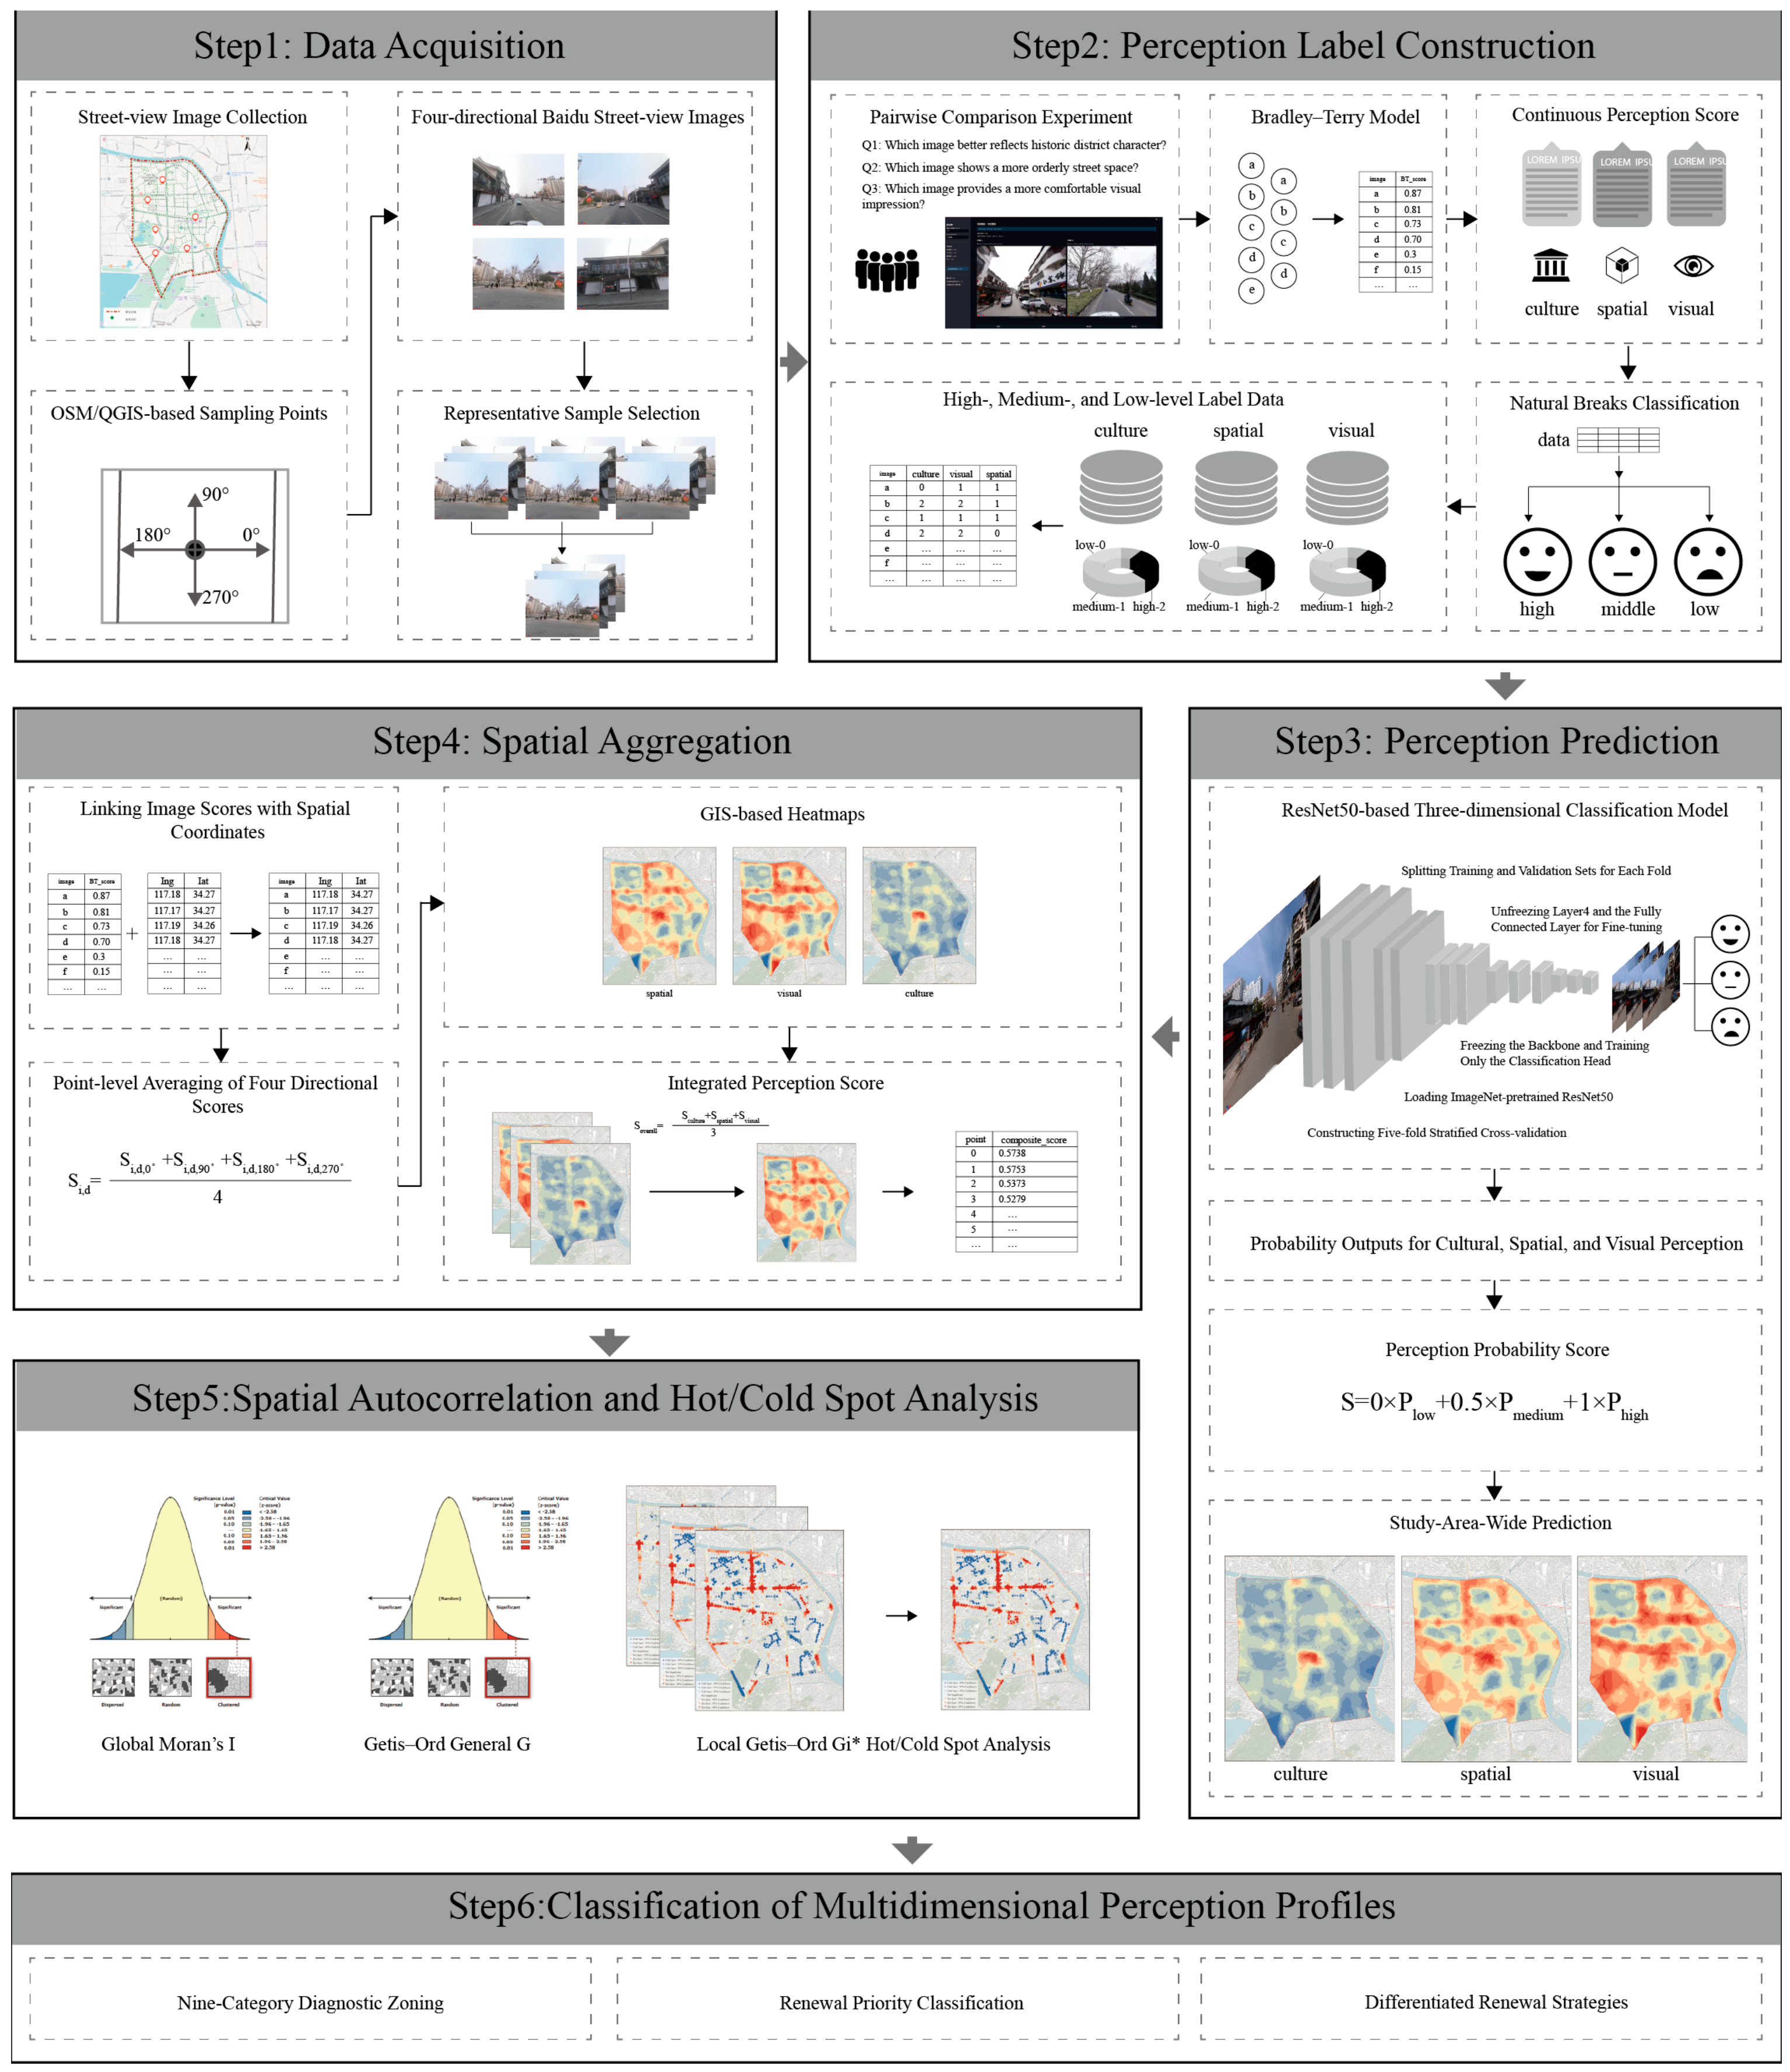
This study develops a multidimensional streetscape perception diagnostic workflow for HD renewal (
Figure 3). Based on SVI and subjective perception evaluations, the workflow uses deep learning models to estimate CCR, SO, and VC across the study area. It further integrates GIS-based mapping and spatial statistical analysis methods to convert image-level predictions into spatial diagnostic results that can support evidence-based renewal decision-making. The overall workflow includes six main steps.
2.3. Data Sources
During the data acquisition stage, this study used SVI data, subjective perception evaluations, and geographic coordinates to construct the dataset for multidimensional streetscape perception diagnosis in the Pengcheng Qili historic district [
4,
6,
7]. First, street networks were obtained from OpenStreetMap (OSM) and processed using QGIS 3.40.14 [
51] to generate sampling points at 50 m intervals along the road network (
Figure 1). Based on these sampling points, SVI was collected in four directions from Baidu Street View (
https://api.map.baidu.com/panorama/v2, (accessed on 14 May 2026), with the images mainly acquired in 2022. In total, 2243 sampling points and 8693 valid street-view images were obtained, covering the principal streets within the study area [
17,
46]. The data sources and sample construction statistics are shown in
Table 1.
2.4. Perception Label Construction
This study conceptualized street-level perception using three dimensions: cultural character recognition (CCR), spatial order (SO), and visual comfort (VC) (
Table 2). Although interrelated, they are not interchangeable aspects of streetscape perception in HDs. The subsequent perception–prediction models were designed to classify SVI according to each of these three dimensions. To select representative images for subjective evaluation, the original images were divided into nine sequential groups based on the sampling-point numbers, with up to 1000 images in each group. A histogram-difference method was then used to select images with relatively distinct visual characteristics. Low-quality, duplicate, and severely occluded images, as well as images containing limited streetscape information, were further removed through manual screening. Finally, 910 representative street-view images were retained for subjective perception evaluation.
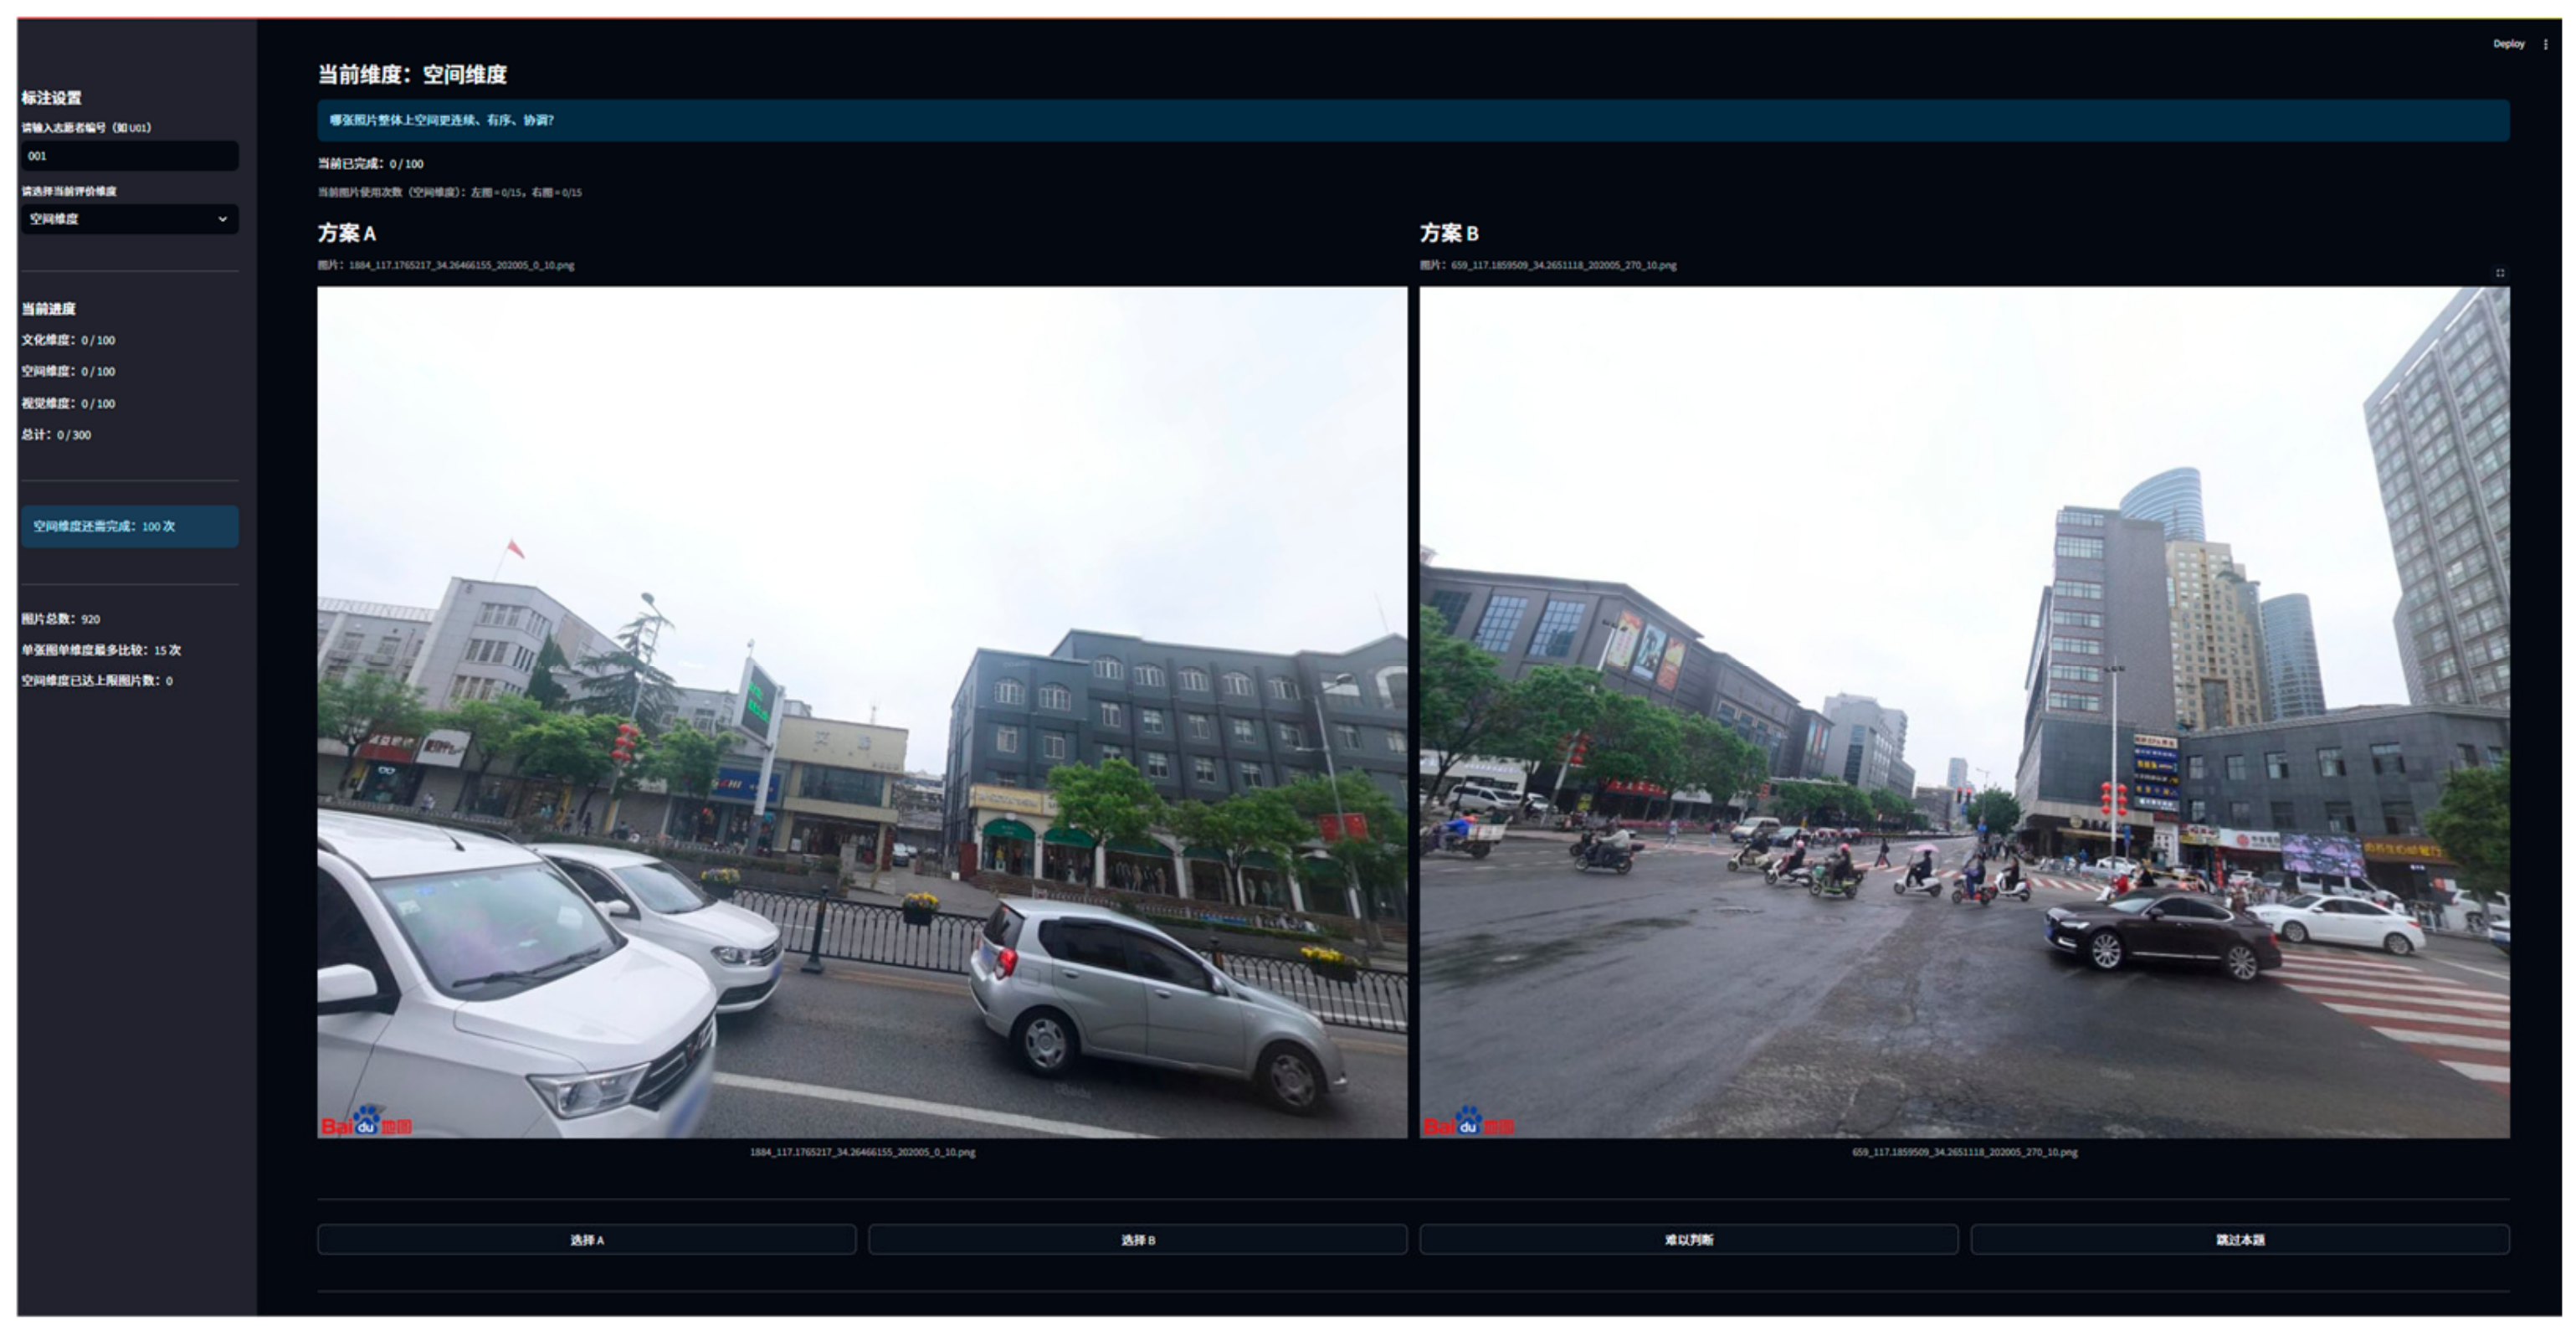
To better capture relative perceptual differences among SVI, this study adopted pairwise comparison rather than direct scoring, and data were collected through a local annotation system built using Streamlit 1.40.1 (
Figure 4). Three questions were designed to correspond to CCR, SO, and VC, respectively:
Q1 Cultural Character Recognition (CCR): Which image better reflects the historic and cultural character of the district?
Q2 Spatial Order (SO): Which image presents a more orderly and coherent street space?
Q3 Visual Comfort (VC): Which image provides a more comfortable visual experience?
Figure 4.
Screenshot of the Streamlit-based pairwise comparison interface used for the subjective evaluation of cultural character recognition, spatial order, and visual comfort.
Figure 4.
Screenshot of the Streamlit-based pairwise comparison interface used for the subjective evaluation of cultural character recognition, spatial order, and visual comfort.
Participants selected one of the two images according to the corresponding question or chose “difficult to judge” when necessary. Each participant was asked to complete 100 comparisons for each dimension, resulting in a target of 300 comparisons per participant. Each image was included in up to 15 pairwise comparisons for each dimension. In total, 71 volunteers, including 34 women and 37 men, participated in the evaluation. The participants were primarily architecture students, whose disciplinary training provided familiarity with spatial and visual assessment. The sample also included local participants who were familiar with the study area. A total of 20,475 valid pairwise-comparison records were obtained. Responses marked as “difficult to judge” were excluded from the win–loss matrix and were not treated as ties in the BT estimation, because they reflected ambiguous perceptual differences between image pairs. The proportions of “difficult to judge” responses were 53.74% for CCR, 27.87% for SO, and 22.85% for VC (
Table A1). The higher uncertainty observed for CCR resulted in fewer images meeting the screening criteria, contributing to its lower retention rate compared with SO and VC. This screening helped retain samples with clearer relative preferences and more stable BT scores for model training.
The pairwise-comparison records obtained from the subjective evaluation were converted into latent perception scores using the Bradley–Terry (BT) model [
25,
42]. Because the questionnaire recorded pairwise preferences between images rather than absolute ratings of individual images, the BT model provided a statistical basis for estimating the perceptual quality of each SVI. After the estimated scores were screened according to the number of valid win–loss comparisons, the proportion of “difficult to judge” responses, and score stability, 501 images were retained for CCR, 735 for SO, and 768 for VC. The detailed statistics of the BT-based screening process, including the number of retained samples, valid comparisons, and score uncertainty indicators for each dimension, are provided in
Appendix A Table A1. Although the number of valid images varied among the three dimensions, the retained sample sizes were broadly consistent with street-view perception studies, supporting their use for subsequent model training [
27]. The Jenks natural breaks [
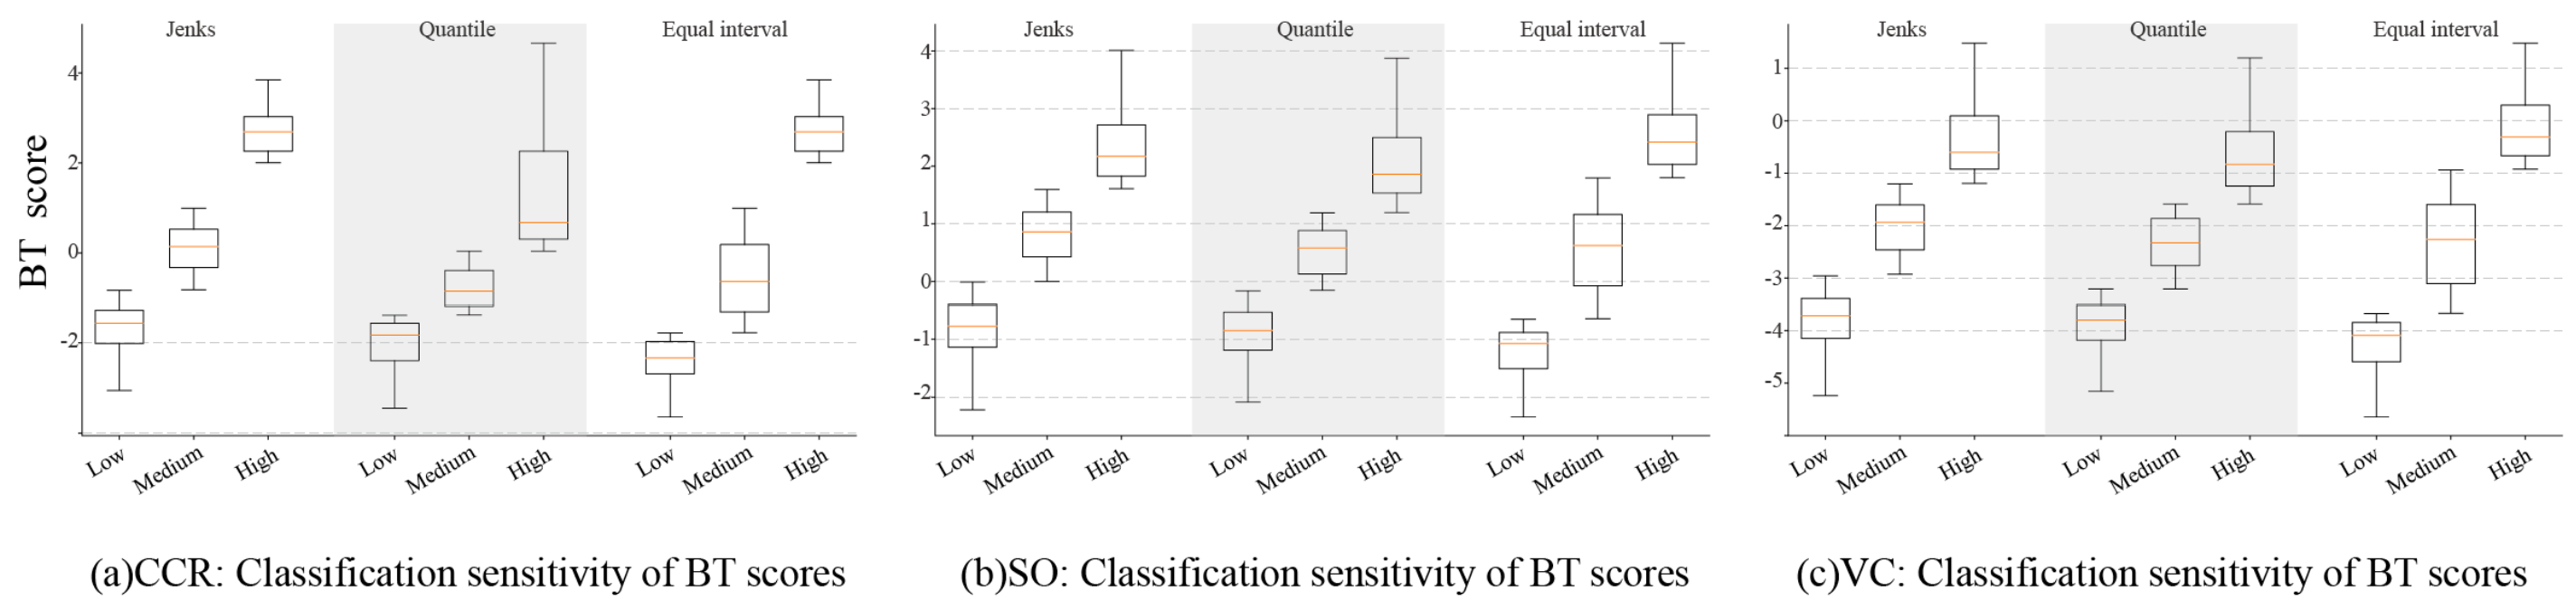
52] method was then applied separately to each dimension to divide the retained BT scores into high, medium, and low perception grades. This method minimizes variation within classes and maximizes differences between classes without requiring equally sized groups. To examine the sensitivity of this classification choice, Jenks natural breaks were compared with quantile and equal-interval classification using the retained BT scores for each dimension. Classification performance was evaluated using the within-class sum of squares (WCSS) and goodness of variance fit (GVF), with lower WCSS and higher GVF indicating greater within-class homogeneity and a better fit to the empirical score distribution. The resulting classification labels were used to train three separate ResNet50 models for CCR, SO, and VC. In addition, the spatial coordinates of the sampling points were used to map the model-predicted perception scores to their corresponding geographic locations and generate spatial distribution maps for the three dimensions.
2.5. ResNet50-Based Perception Prediction
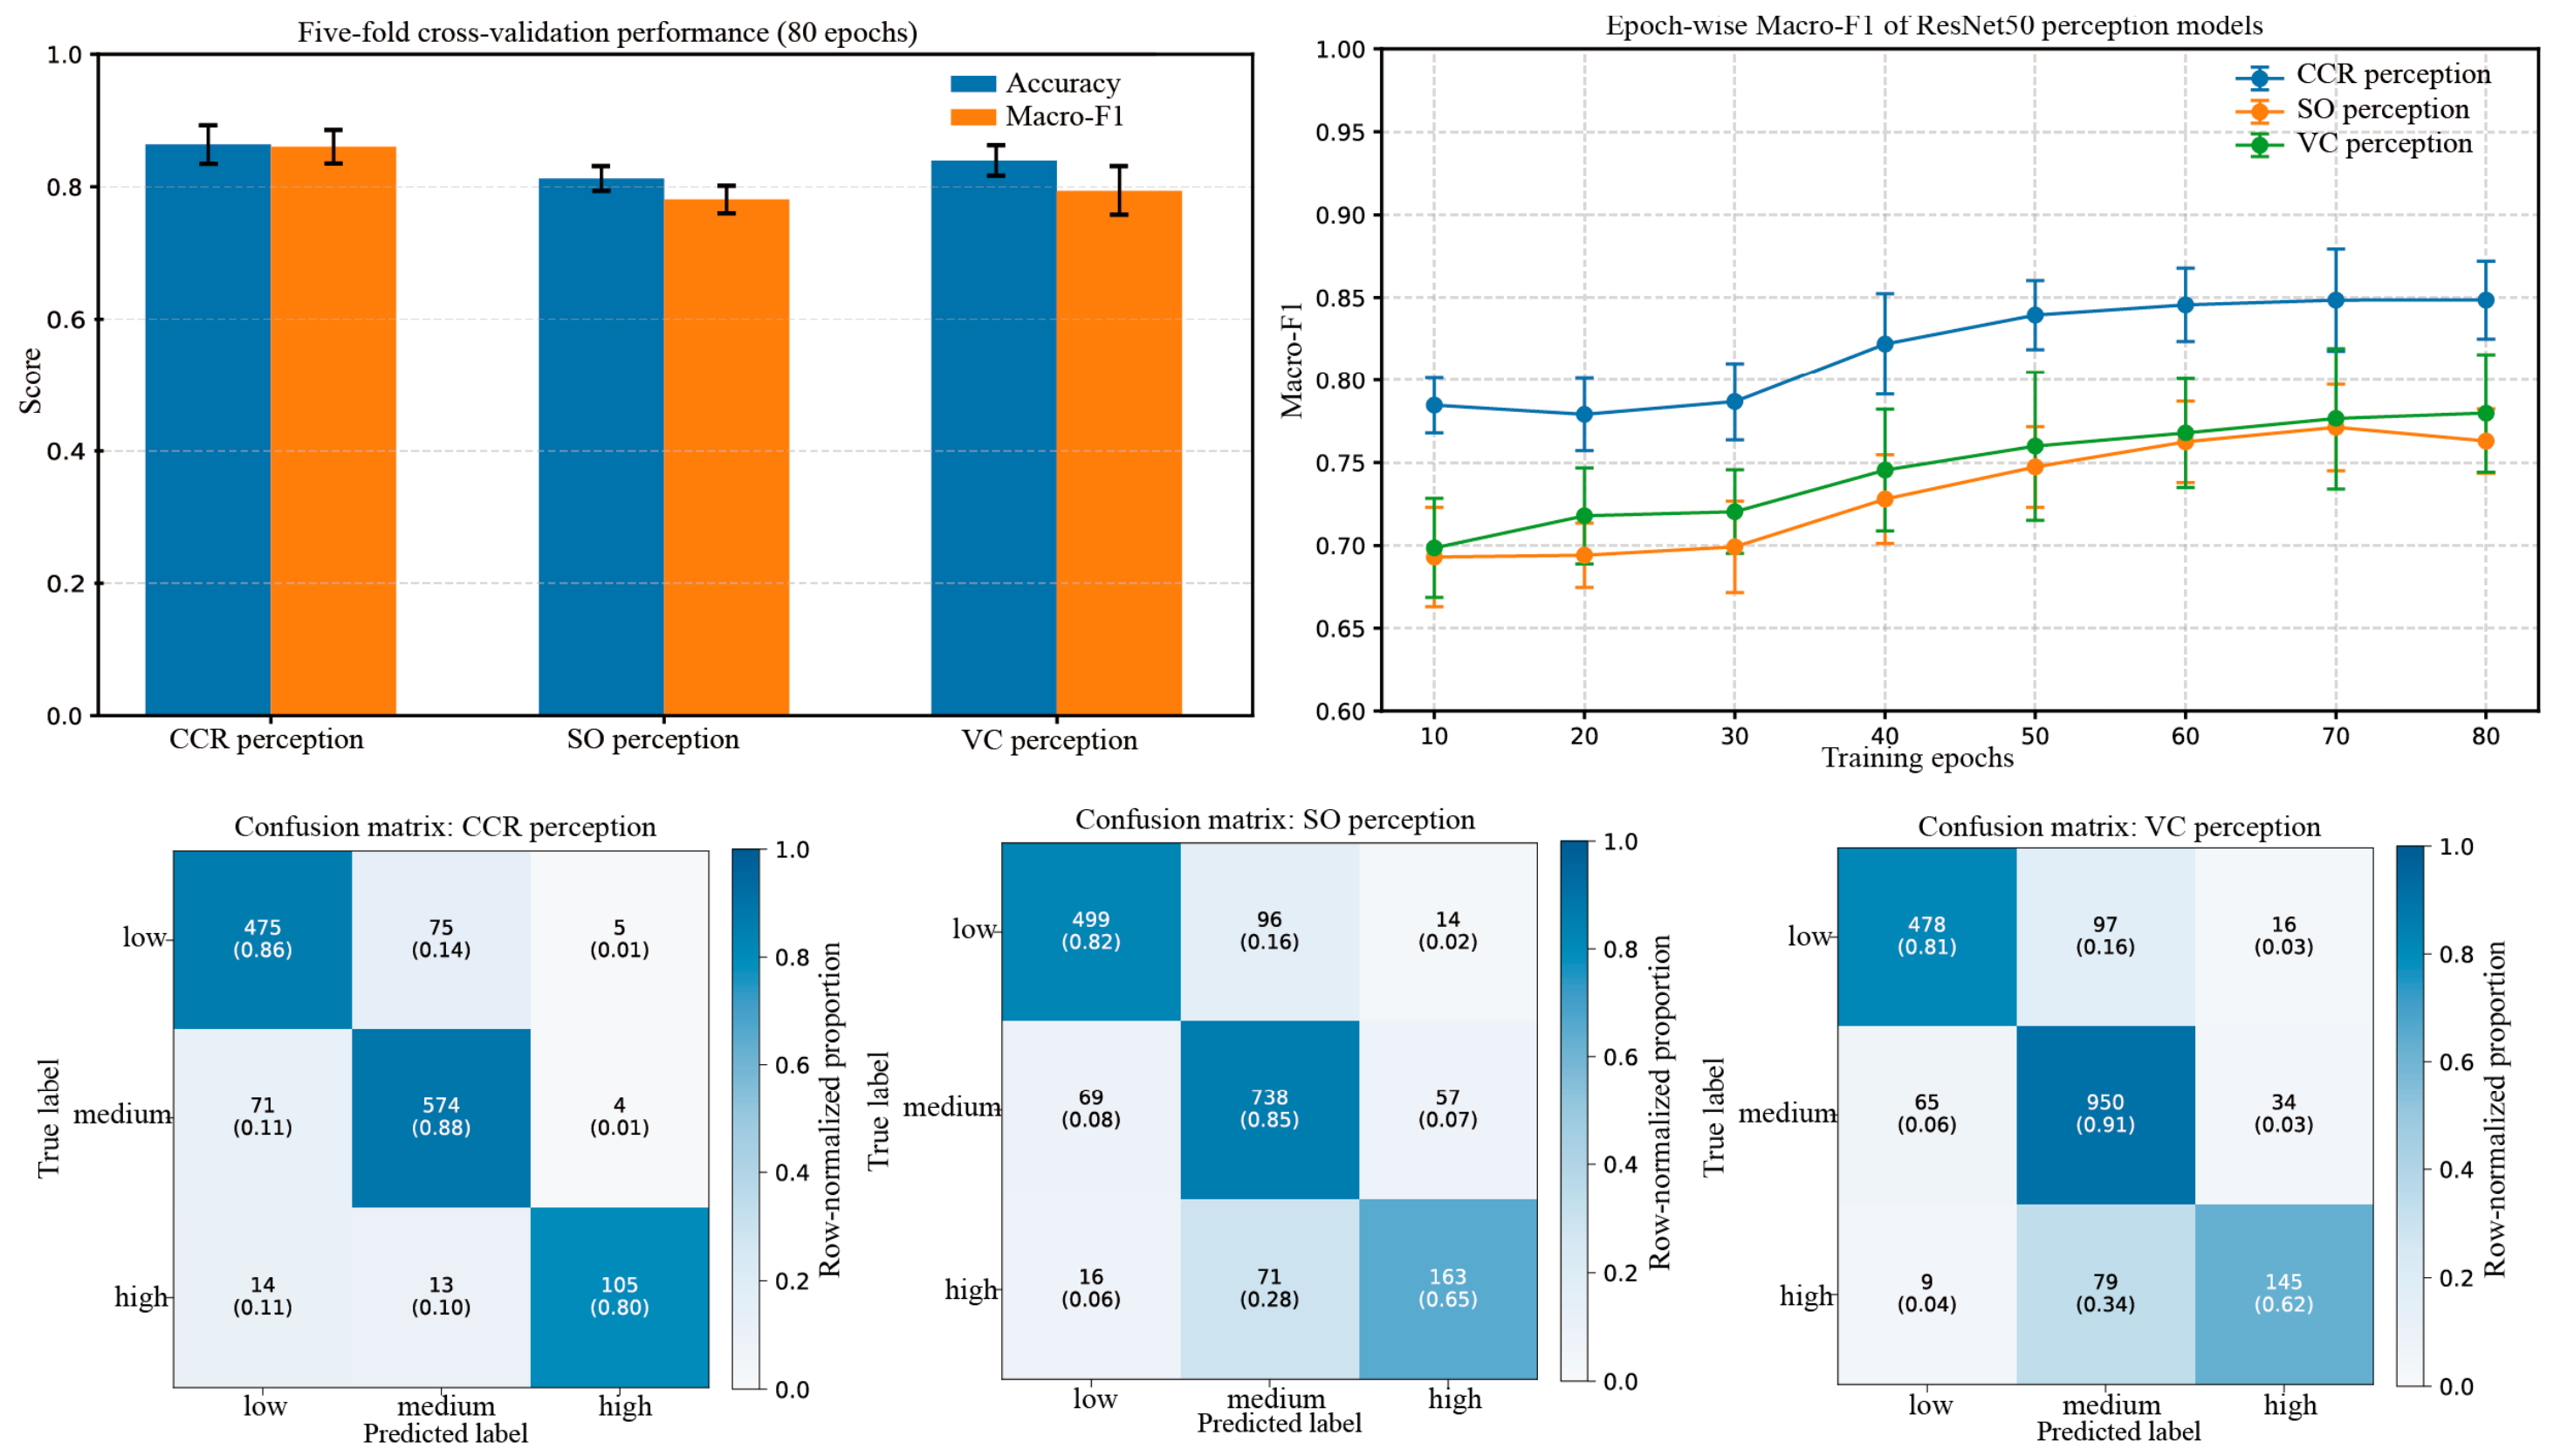
During the perception–prediction stage, three separate ResNet50 models with ImageNet-pretrained weights were adopted to identify high, medium, and low perception grades for CCR, SO, and VC. ResNet50 was selected because its residual architecture, combined with ImageNet-based transfer learning, is suitable for extracting robust visual features from complex SVI in the present studies [
9,
39]. The final fully connected layer of each model was replaced with a classification head containing a dropout layer and a three-class linear output layer to adapt the model to the three-class classification task. A two-stage transfer-learning strategy was used during training. In the first stage, the ResNet50 backbone was frozen, and only the newly added classification layer was trained. In the second stage, the high-level feature block (“layer4”) and the classification layer of ResNet50 were unfrozen and fine-tuned using a smaller learning rate. Only layer4 and the classification head were unfrozen during the second stage to adapt the high-level semantic representations to the streetscape perception task while retaining the general low-level visual features learned from ImageNet and reducing the risk of overfitting under the limited annotated sample size. The learning rates were set to 1 × 10
−3 for the first stage and 1 × 10
−5 for the fine-tuning stage (
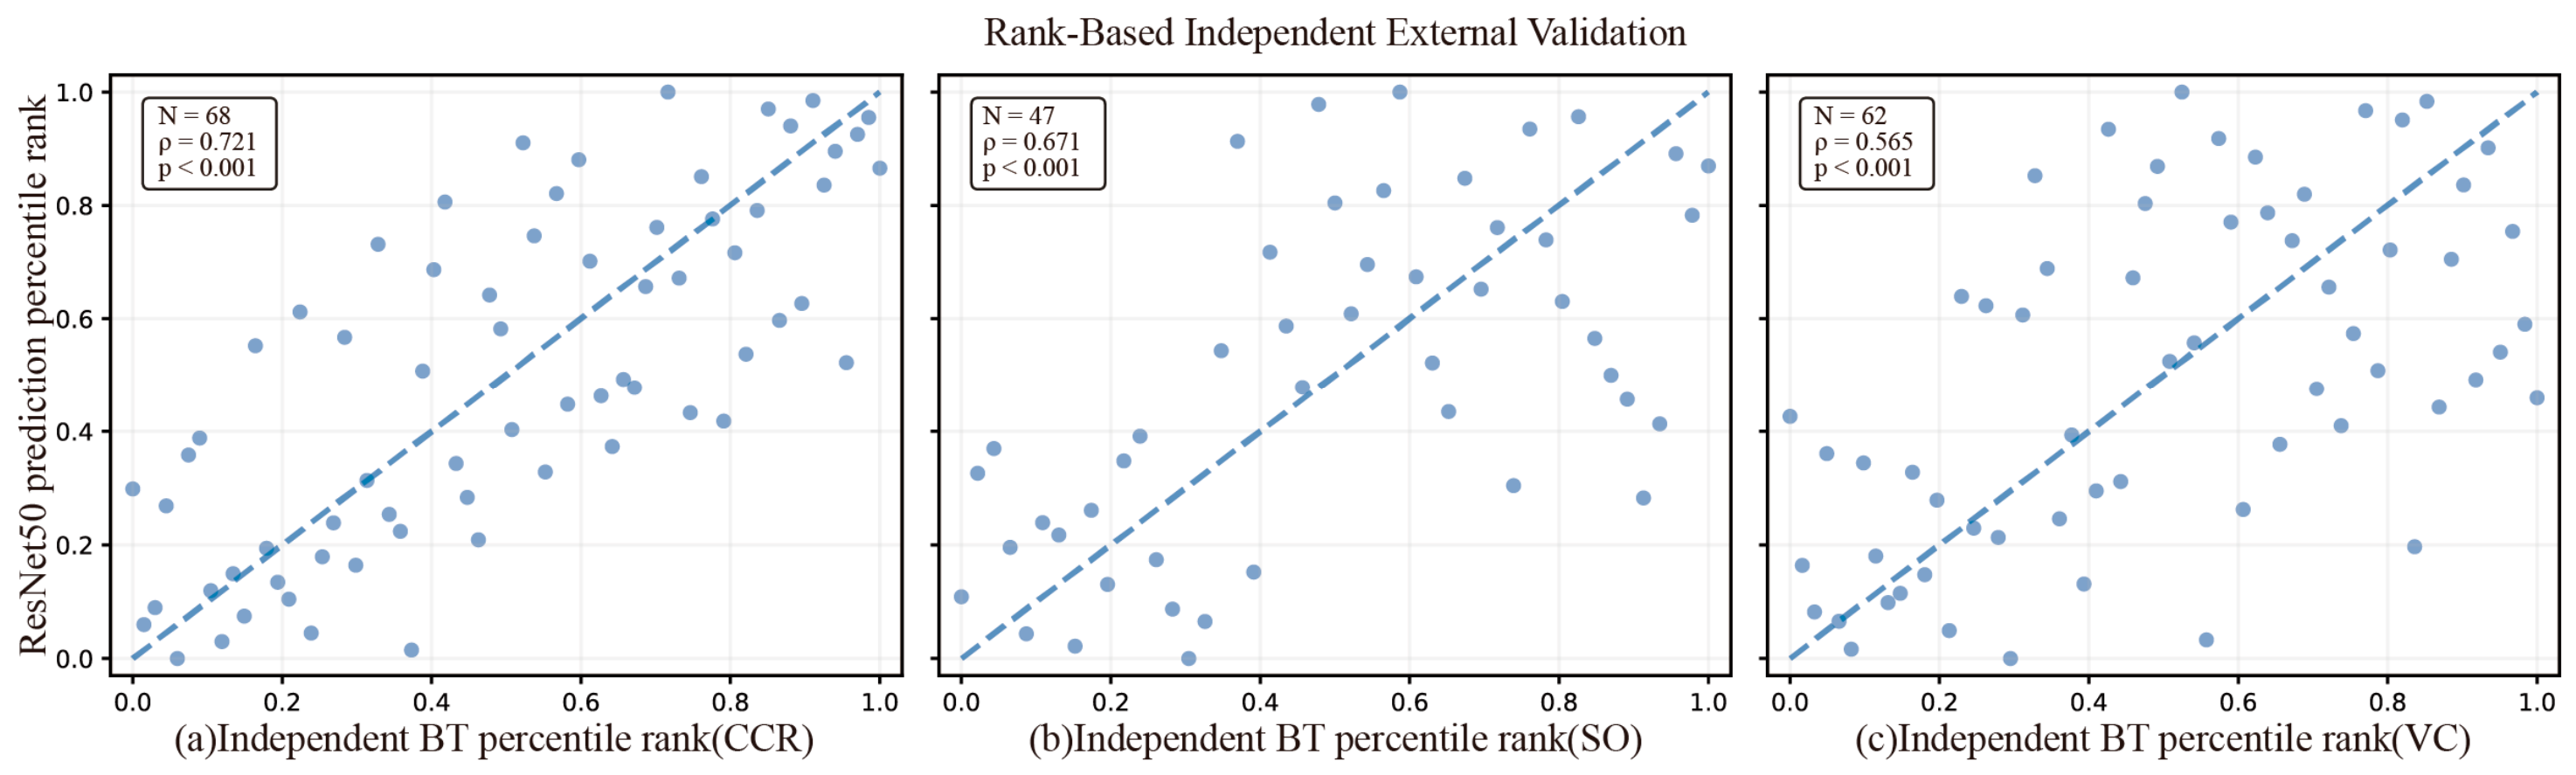
Table A2). The loss function was cross-entropy loss with label smoothing, which was used to reduce model overconfidence and sensitivity to uncertainty in the subjective perception labels. Model performance was evaluated using five-fold stratified cross-validation to ensure relatively balanced proportions of low-, medium-, and high-grade samples in each fold. The evaluation metrics included accuracy, Macro-F1, precision, recall, and confusion matrices, with Macro-F1 used as the primary indicator for model evaluation and selection since it assigns equal importance to the three classes. To improve model training with limited local samples, supplementary street-view images from other historic districts were included to enrich the representation of typical historic-district features. These images were used only for feature learning, while the final prediction, spatial analysis, and profile interpretation were conducted for the Pengcheng Qili historic district. To further examine model transferability, an independent external validation was subsequently conducted using 100 different collected images from historic districts in Jiangsu Province that were not used for model training, cross-validation, or model selection. A separate pairwise-comparison experiment was conducted for the three perception dimensions, with each participant completing 50 comparisons per dimension and each image appearing approximately seven times in aggregate across all participants. Independent perceptual scores were estimated using the BT model. Because BT scores represent relative preferences within the external sample, Spearman rank correlation between the independent BT assessments and model-predicted scores was used as the primary external-validation measure. Detailed training parameters, including the optimizer, batch size, learning rates, data-augmentation operations, random seed, learning-rate scheduler, and model-selection criterion, are provided in
Table A2.
After model validation, the trained ResNet50 models were applied to all SVI in the Pengcheng Qili historic district. For each image, each model produced three estimated class probabilities, namely P
low, P
medium, and P
high. To convert the classification output into a probability-weighted ordinal index, this study calculated the perception score using the following formula:
which can be simplified as follows:
The value of S ranges from 0 to 1, with higher values indicating higher predicted perceptual quality and lower values indicating lower predicted perceptual quality. The predicted scores for CCR, SO, and VC were then linked to the corresponding geographic coordinates of the sampling points and were aggregated at the point level, as described in
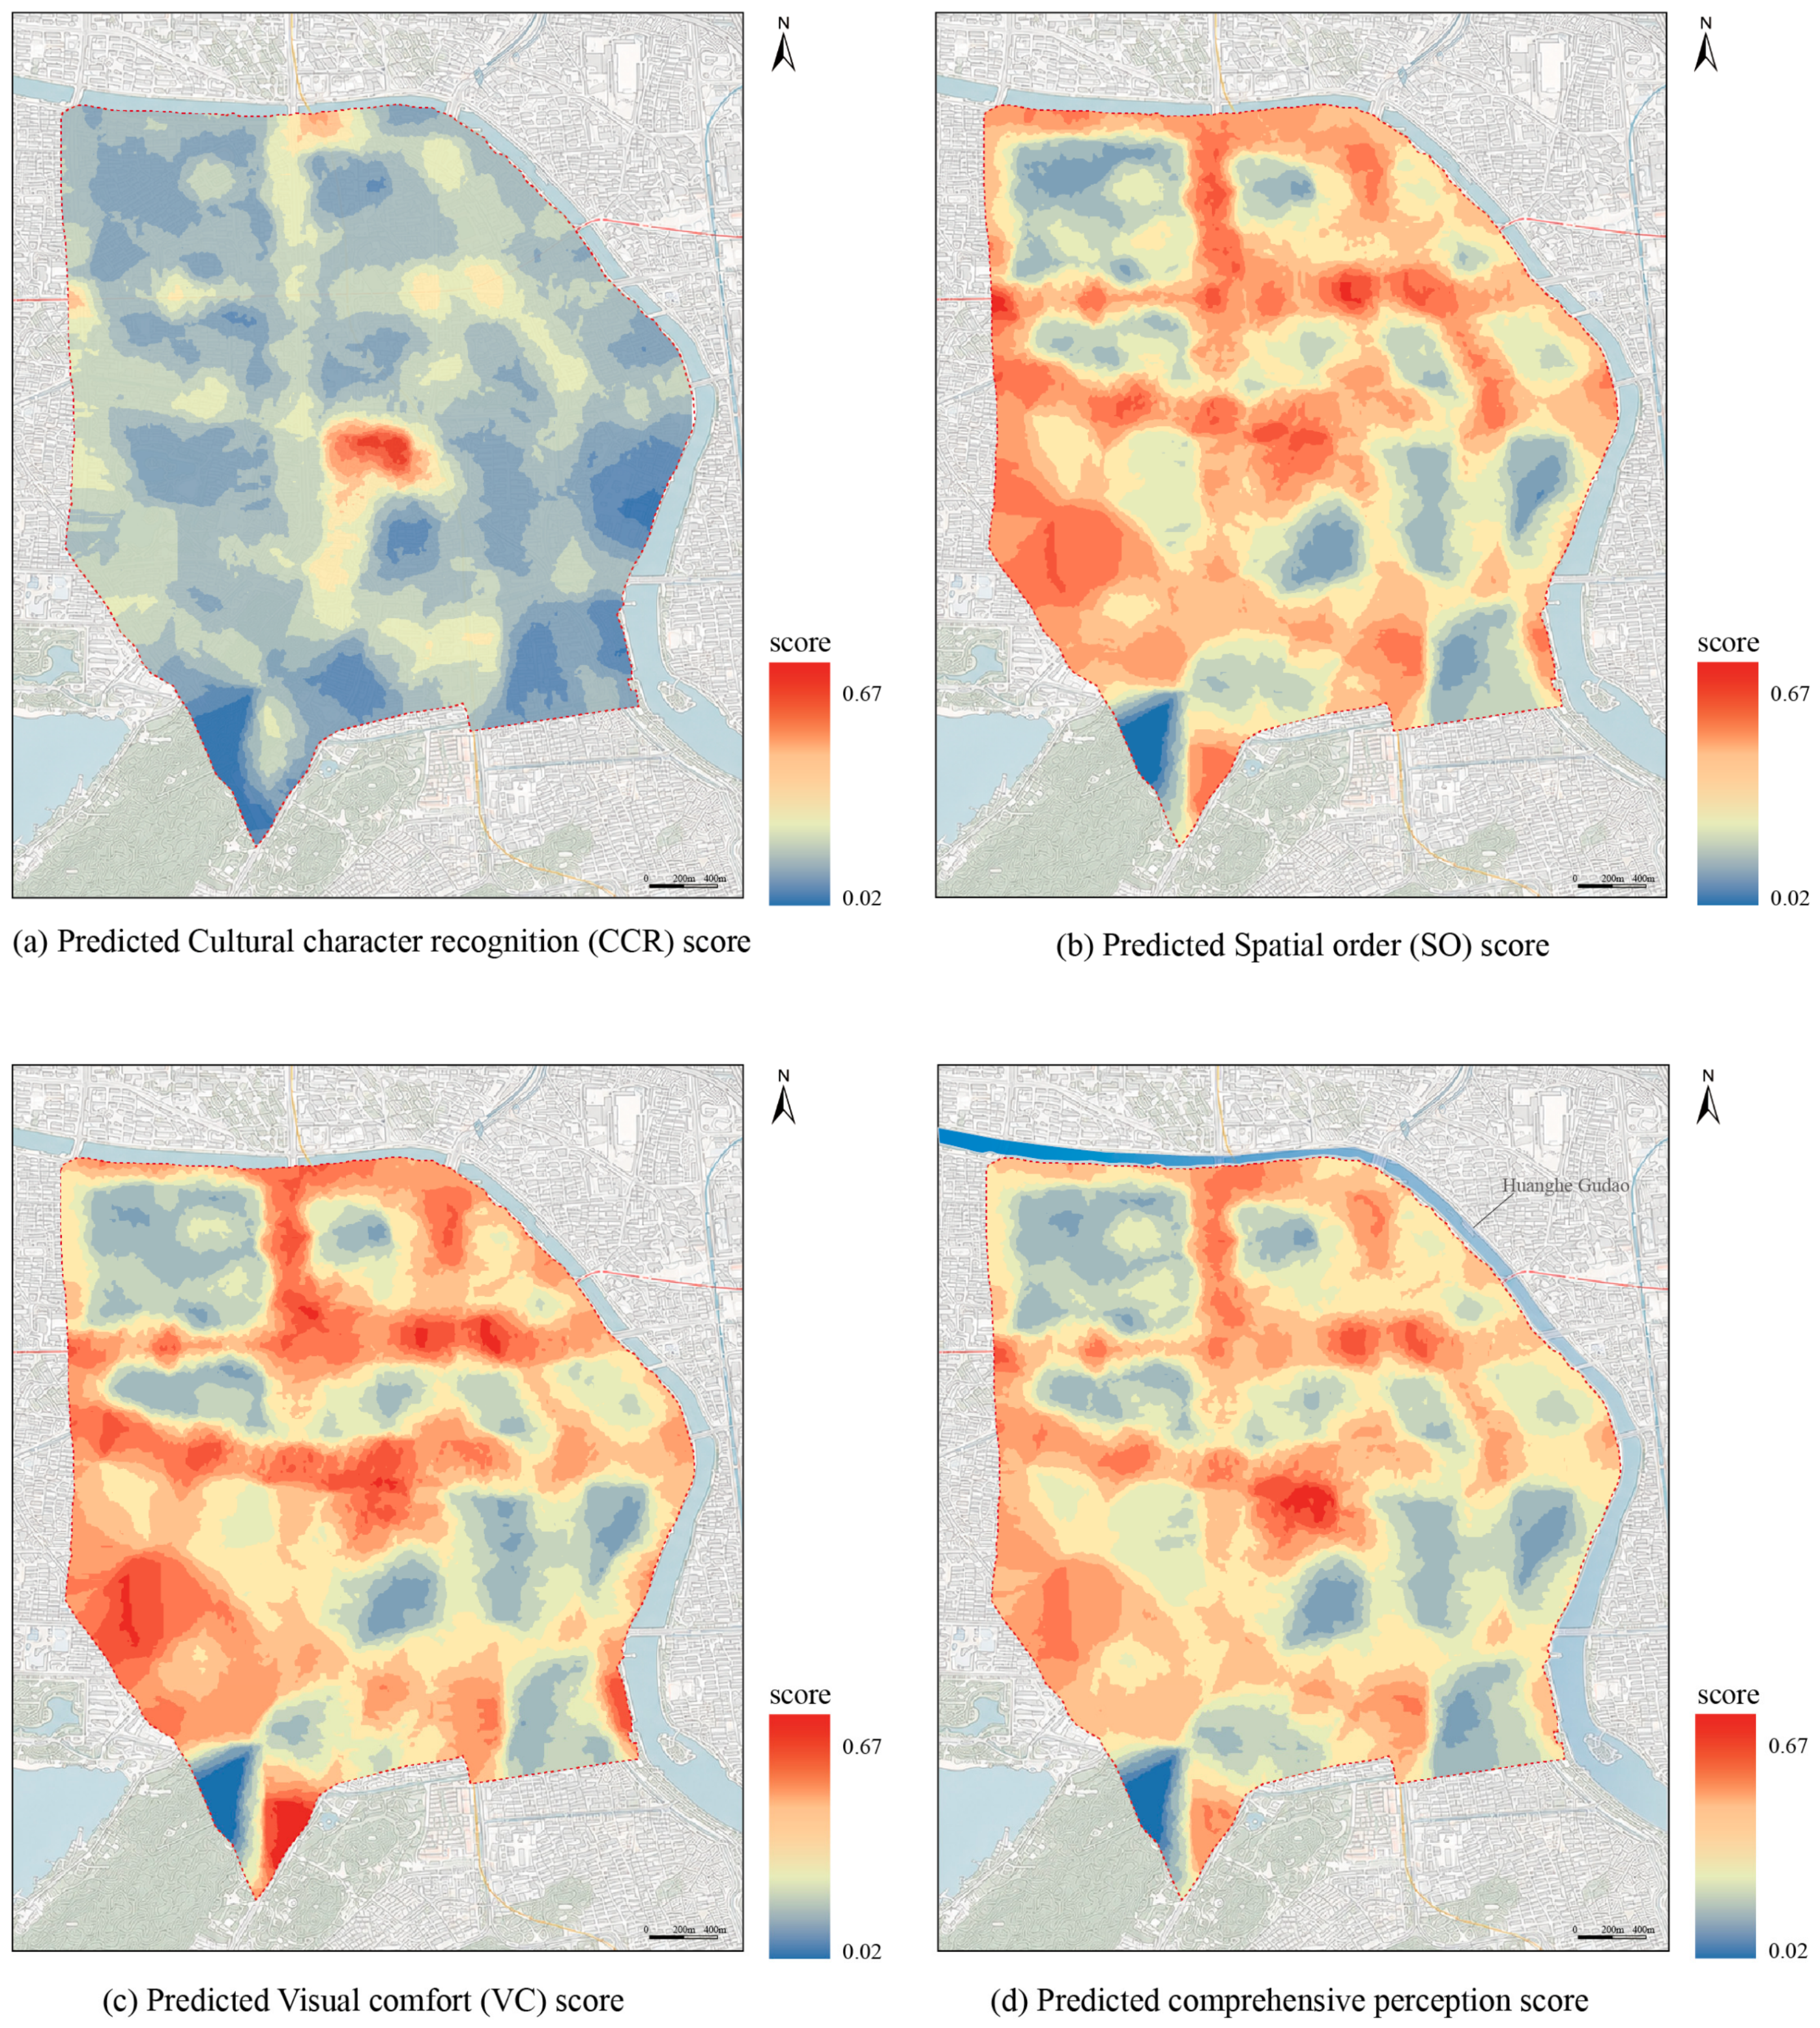
Section 2.6. The resulting point-level scores were used to generate spatial distribution maps for the three dimensions in ArcGIS 10.7.
2.6. Point-Level Aggregation and Spatial Mapping
The spatial aggregation stage was used to convert the model-prediction results into point-level spatial units for HD renewal. The perception–prediction models first output image-level perception scores for CCR, SO, and VC. Each image-level score was then linked to the geographic coordinates of its corresponding sampling point. Because a single sampling point usually contained SVI from four directions, this study averaged the perception scores from the four directions to obtain the final point-level score for the corresponding dimension. This procedure reduces the influence of view-specific occlusion, local lighting conditions, or temporary traffic factors and provides a more balanced representation of the overall streetscape perception at that location.
Here, S
i,d denotes the point-level perception score at sampling point (i) for dimension d, where d represents CCR, SO, or VC. This aggregation was intended to characterize the overall streetscape perception at each sampling location rather than orientation-specific perceptual differences. Although averaging may attenuate directional variation, retaining a consistent four-view aggregation reduces the influence of view-specific occlusion, lighting, and temporary traffic conditions and provides a comparable point-level measure for subsequent spatial analysis. After obtaining the point-level scores for the three dimensions, the results were visualized in GIS. For descriptive visualization, point-level perception scores were interpolated using the Kriging method in ArcGIS 10.7 with the software’s default parameter settings to generate continuous perception surfaces. The interpolation was used only for visualization, whereas the subsequent spatial autocorrelation and hot-spot analyses were conducted using the original point-level perception scores. This allowed the visualization of areas with relatively high, medium, and low predicted scores for each perception dimension. To provide a supplementary overview, the three dimension-specific perception scores were further aggregated into a comprehensive perception score:
Here, Sculture, Sspatial, and Svisual denote the scores for CCR, SO, and VC, respectively.
Note that equal weights were assigned because there was no established basis for prioritizing one dimension over another. To examine the sensitivity of the comprehensive score to this assumption, three alternative weighting scenarios were additionally tested by assigning a weight of 0.50 to CCR, SO, or VC in turn, and 0.25 to each of the remaining two dimensions. Ranking stability relative to the equal-weighted baseline was evaluated using Spearman’s rank correlation, mean absolute percentile-rank change, and the overlap of sampling points within the top and bottom 10% of the rankings. These measures were used to assess overall rank consistency, the magnitude of point-level rank shifts, and the stability of the highest- and lowest-ranked locations, respectively. The comprehensive score was used only as a supplementary overview, while the main diagnostic interpretation relied on the separate CCR, SO, and VC scores and their multidimensional profiles.
2.7. Spatial Autocorrelation and Hot/Cold-Spot Analysis
To examine whether the multidimensional perception predictions exhibited spatial clustering, this study used global Moran’s I to assess the global spatial autocorrelation [
51] of the CCR, SO, VC, and comprehensive perception scores. Global Moran’s I indicates whether a variable exhibits a clustered, dispersed, or random spatial distribution across the study area. A significantly positive Moran’s I indicates that similar values tend to be spatially adjacent. In other words, high-value points tend to occur near other high-value points, while low-value points tend to occur near other low-value points. A significantly negative Moran’s I indicates spatial dispersion, whereas a value close to its expected value indicates an approximately random spatial pattern.
Using the sampling points as the spatial units of analysis, this study used the point-level CCR, SO, VC, and comprehensive scores as input variables and constructed an inverse-distance spatial-weight matrix based on the Euclidean distance. This method statistically assesses whether the multidimensional perception scores predicted by the models exhibit global spatial dependence. Significant positive spatial autocorrelation would indicate that high and low perception scores were spatially organized rather than randomly distributed, thereby providing statistical support for interpreting the spatial distribution maps and subsequent diagnostic results.
Based on the global spatial autocorrelation analysis, this study further used the Getis–Ord General G statistic to determine whether the overall spatial pattern was characterized primarily by high- or low-value clustering [
51]. If the observed General G value is higher than its expected value and the z-score is significantly positive, high values are significantly clustered. Conversely, if the observed value is lower than its expected value and the z-score is significantly negative, low values are significantly clustered. General G identifies the overall tendency towards high- or low-value clustering but does not locate the individual clusters.
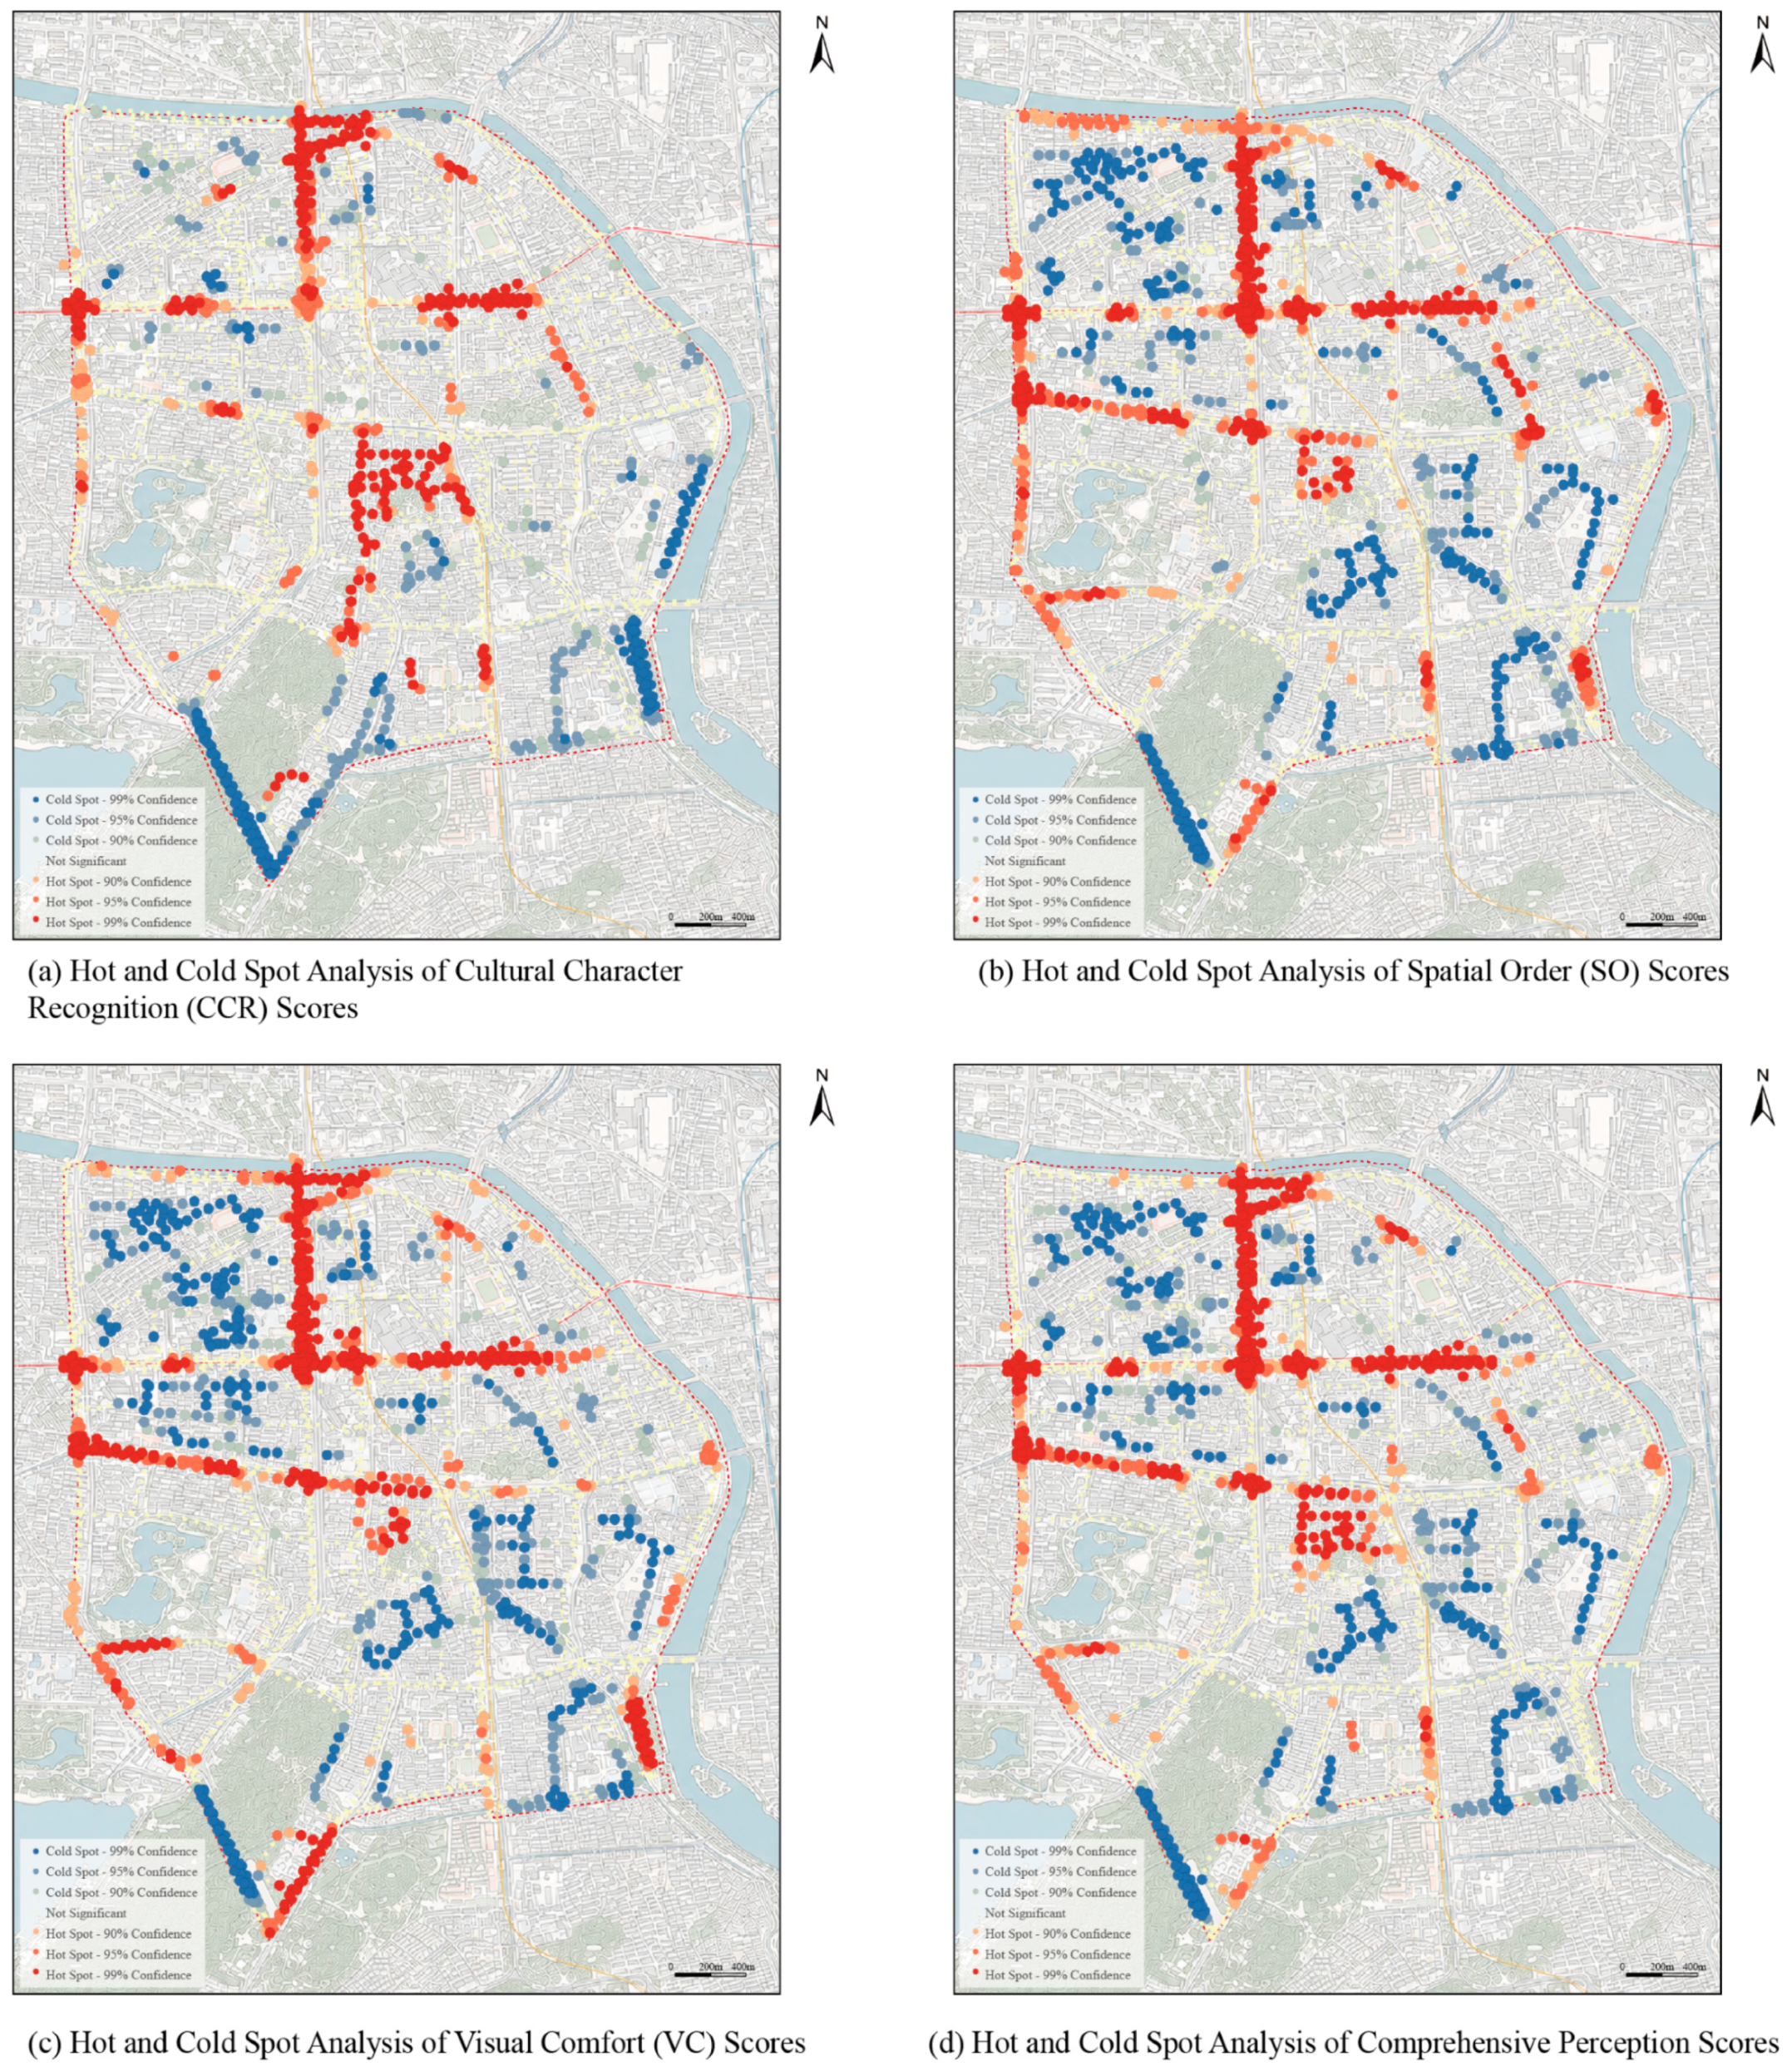
To locate the specific spatial positions of high- and low-value clusters, this study used local Getis–Ord Gi* analysis to identify hot and cold spots at different confidence levels [
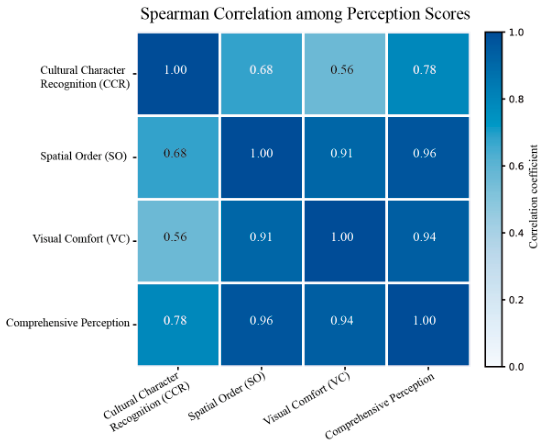
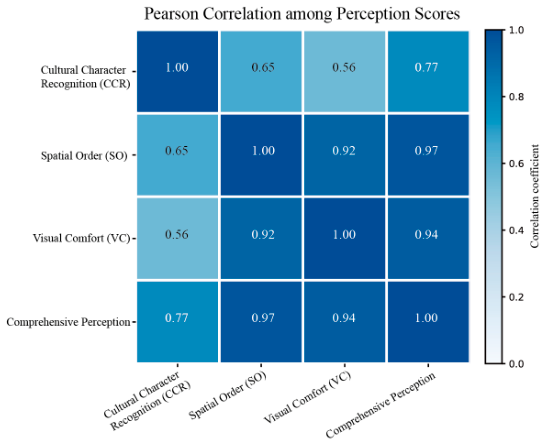
51]. Hot spots indicate significant local clustering of high perception scores, whereas cold spots indicate significant local clustering of low perception scores. These results provide spatial statistical evidence for interpreting the local concentration of perception scores and supporting the subsequent diagnostic analysis. Global Moran’s I, General G, and Getis–Ord Gi* statistics were calculated in ArcGIS using the default spatial relationship and distance settings of the corresponding tools; no distance threshold was manually specified or optimized. To evaluate the sensitivity of the spatial-autocorrelation results to alternative definitions of spatial relationships, Global Moran’s I was additionally recalculated using a 100 m fixed-distance band and eight-nearest-neighbor (K = 8) weights. In addition, Pearson correlation analysis was conducted using the point-level prediction scores of CCR, SO, and VC to further examine the relationships among the three perception dimensions, with Spearman correlation used as a robustness check. To further examine whether the pairwise associations among the three perception dimensions persisted independently of the remaining dimension, partial Spearman correlations were calculated for each pair while controlling for the third dimension.
2.8. Classification of Multidimensional Perception Profiles
To integrate the three perception dimensions while retaining their distinct information, the point-level CCR, SO, and VC scores were independently classified into low, medium, and high levels using the Jenks natural breaks method (
Table A3). The classification was conducted separately for each dimension because their score distributions differed. Each sampling point was subsequently represented by a three-dimensional perception profile comprising its respective CCR, SO, and VC levels. The Jenks classification was used as an exploratory and cartographic tool for internal relative classification. The resulting low, medium, and high levels should not be interpreted as universal perceptual thresholds, and continuous scores remained the primary measures for spatial autocorrelation and correlation analyses.
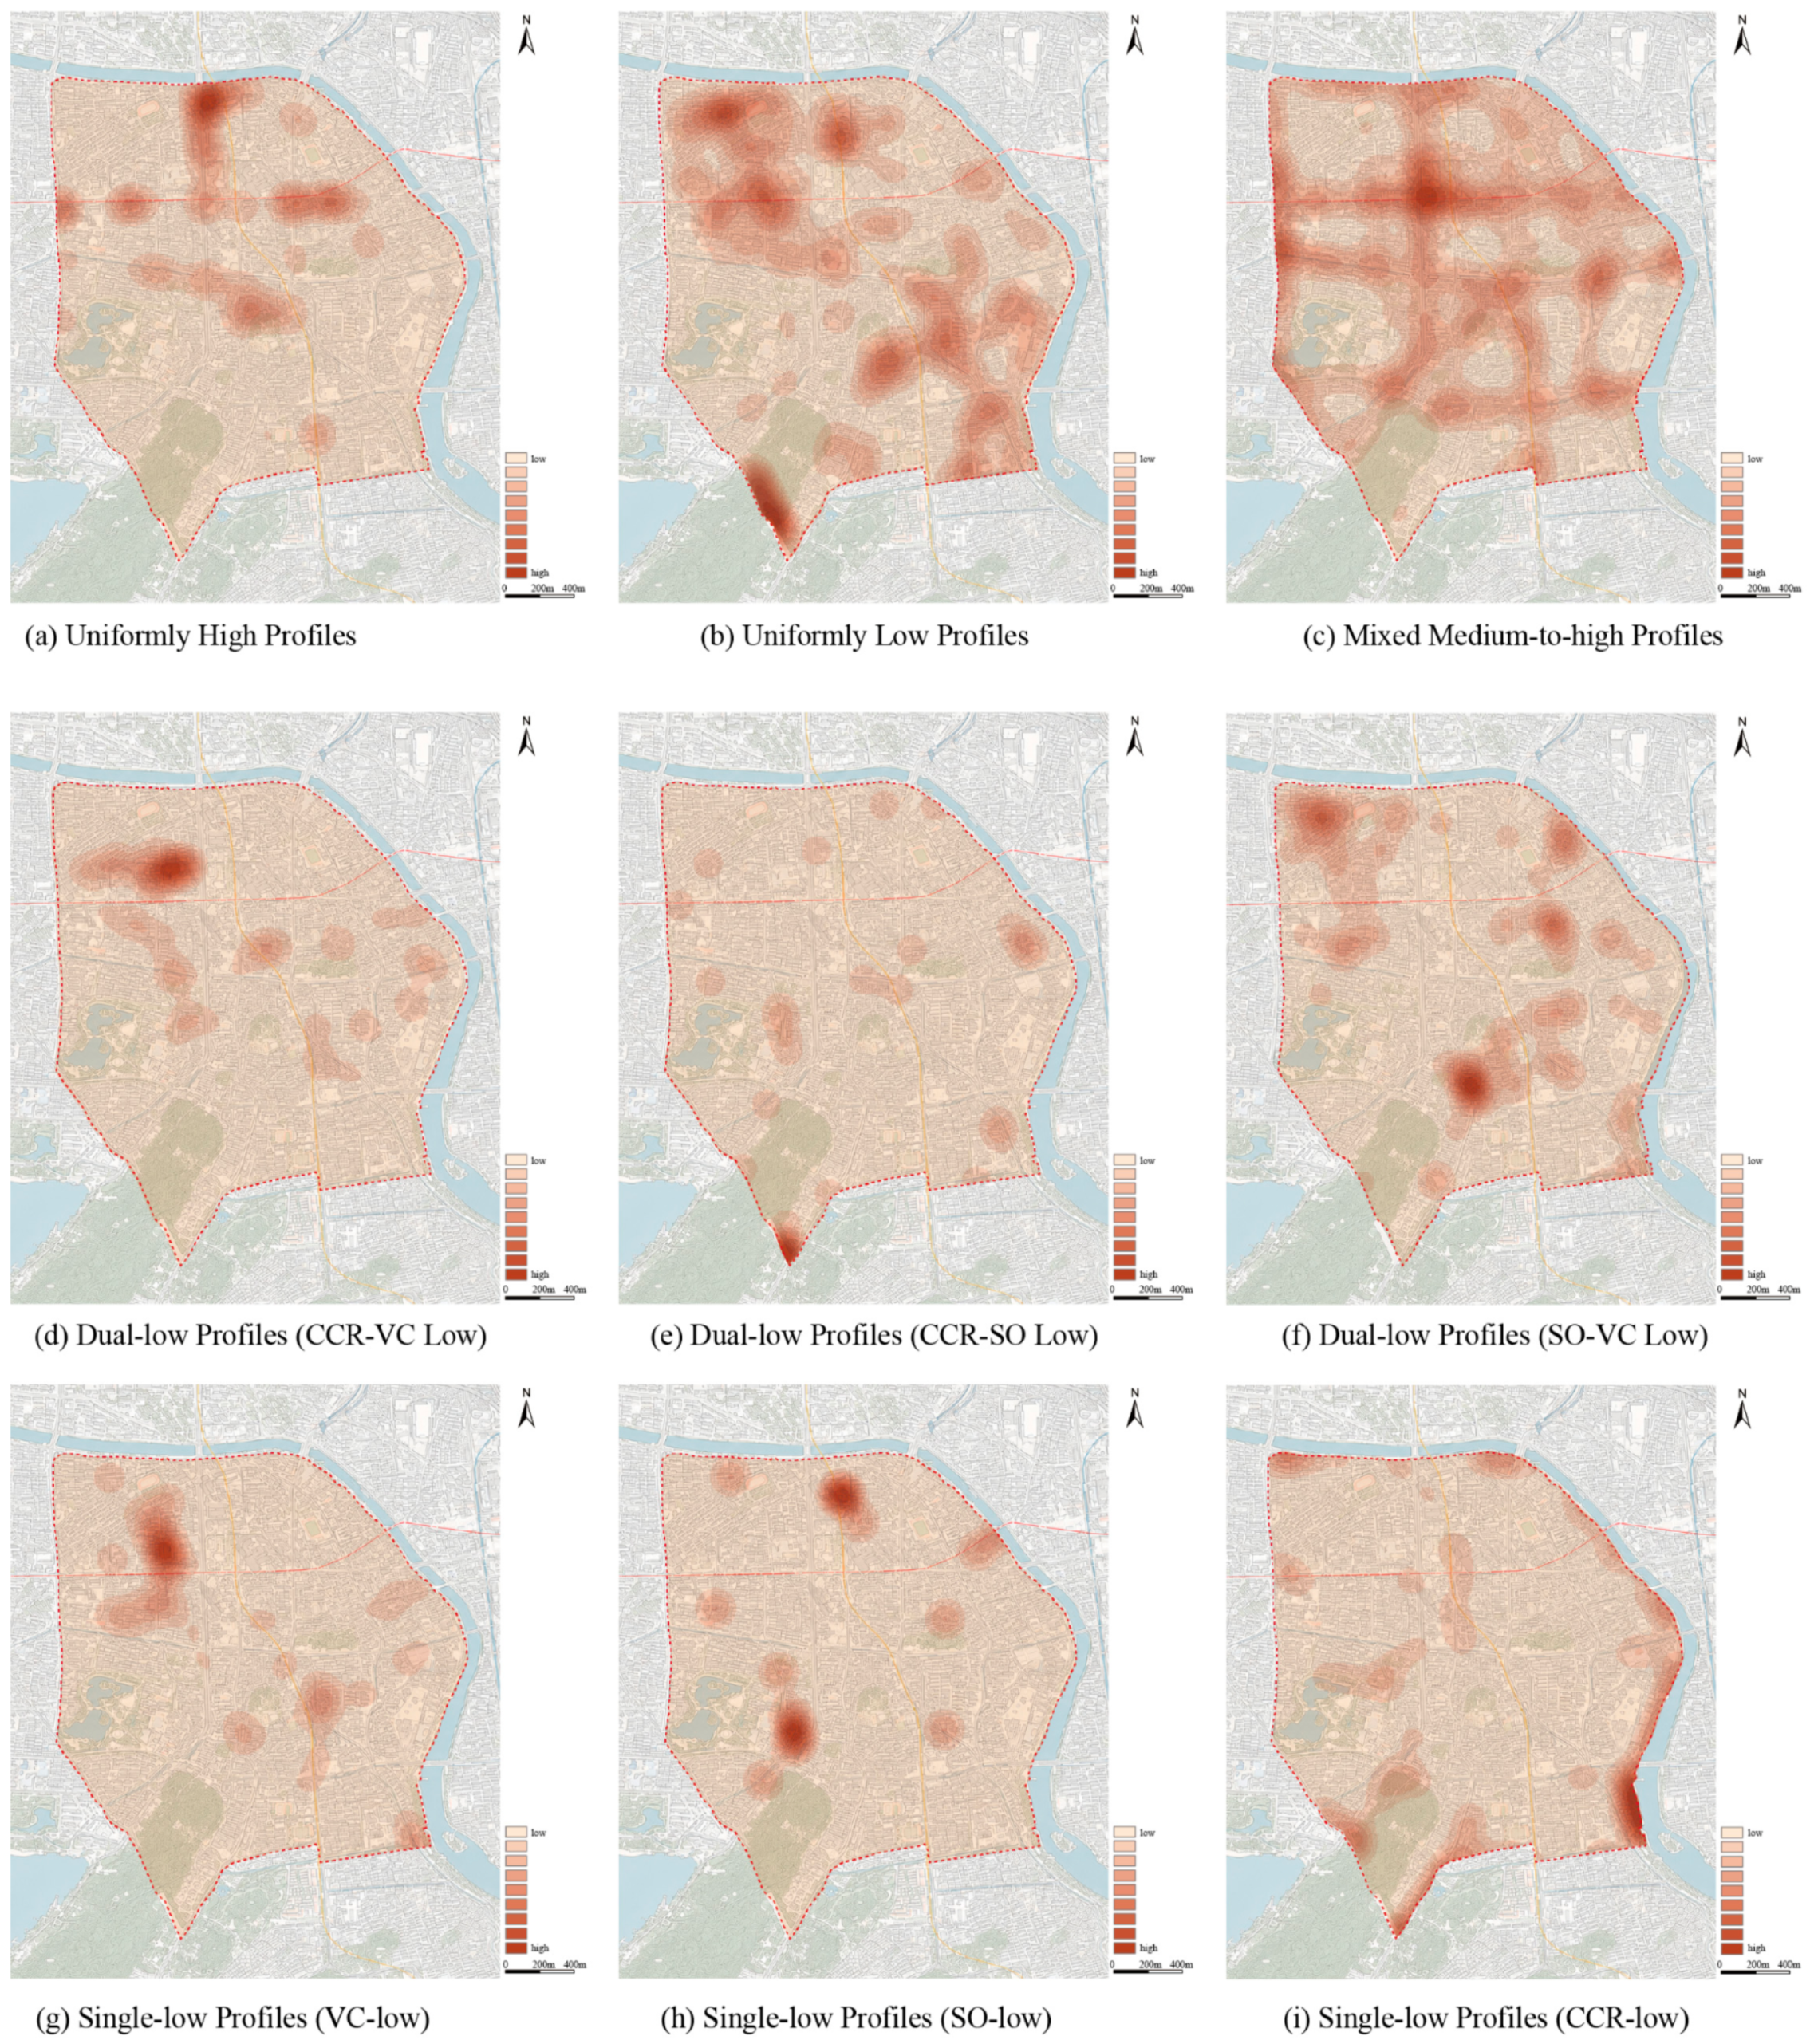
Based on the number and combination of low-value dimensions, the profiles were grouped into five general types: uniformly high profiles, mixed medium-to-high profiles, single-low profiles, dual-low profiles, and uniformly low profiles. Single- and dual-low profiles were further distinguished according to the dimensions in which low values occurred. This classification was used to interpret the multidimensional perceptual conditions of the sampling points, which may inform corresponding spatial strategies for urban renewal. Although unsupervised clustering was not applied, the profile classification preserved different combinations of CCR, SO, and VC, thereby avoiding the loss of dimension-specific information that may occur when relying only on a single comprehensive score.
5. Conclusions
Taking the Pengcheng Qili historic district in Xuzhou, China, as a case study, this paper developed a multidimensional streetscape perception diagnostic framework based on street-view imagery, subjective pairwise comparison, the Bradley–Terry model, and ResNet50-based prediction. The framework integrated three related but non-interchangeable dimensions—cultural character recognition (CCR), spatial order (SO), and visual comfort (VC)—and translated subjective perception judgments into spatially explicit diagnostic evidence through point-level aggregation, GIS mapping, and spatial statistical analysis.
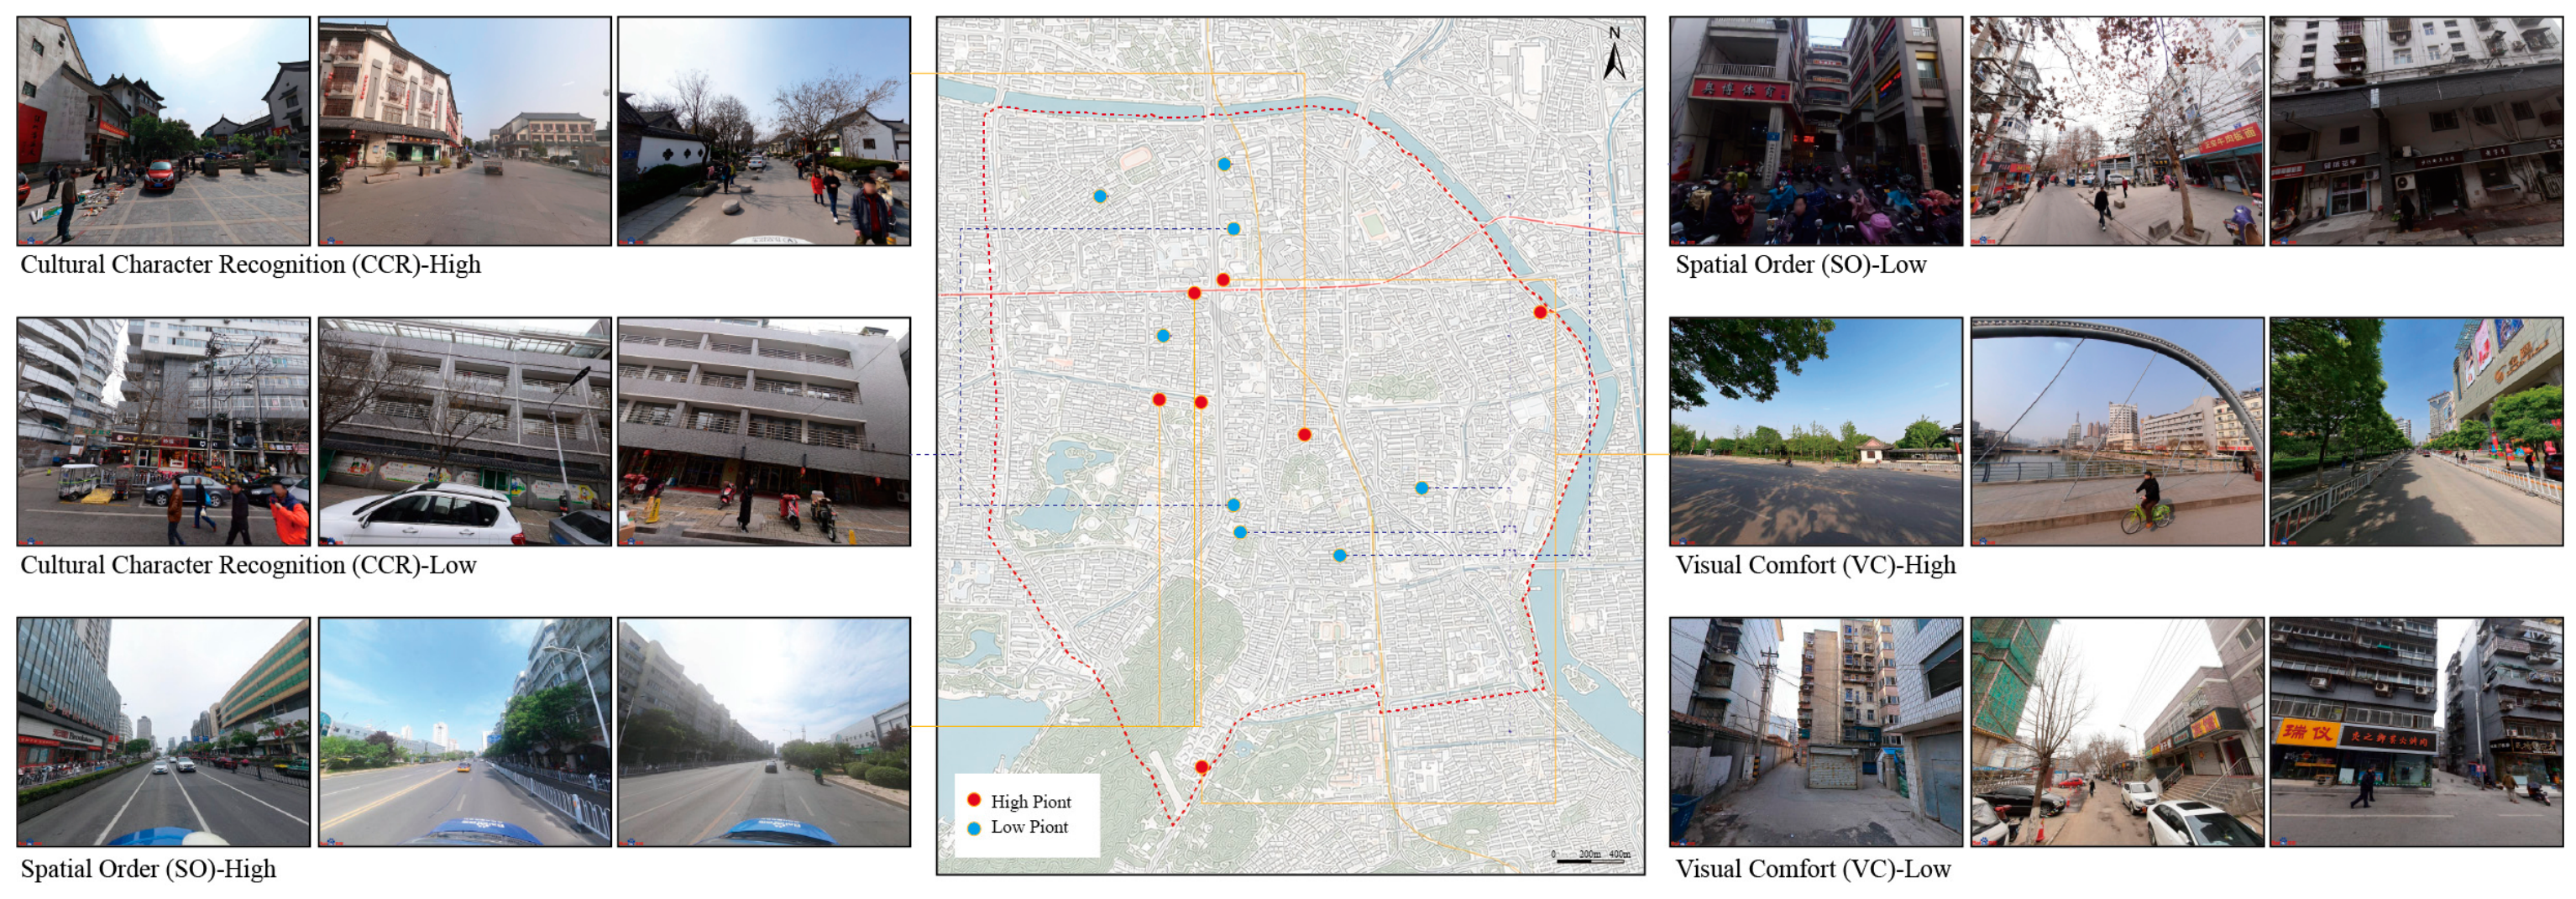
The results show that the three perception dimensions exhibited distinct but related spatial patterns. High CCR scores were mainly concentrated around historical and cultural nodes and historic street frontages, while high SO scores were more strongly associated with open and continuous roads and public spaces. VC displayed corridor-like patterns related to street-interface quality, greenery, traffic exposure, and visual order. Correlation analysis further showed that CCR, SO, and VC were significantly and positively associated, with the strongest relationship between SO and VC and more moderate relationships between CCR and the other two dimensions. These findings indicate that the three dimensions are interrelated components of streetscape perception, but they retain distinct diagnostic meanings.
Global Moran’s I, Getis–Ord General G, and local Gi* analyses confirmed significant spatial clustering in the predicted perception scores. The multidimensional profile classification further revealed that perceptual deficiencies were not limited to single dimensions. Mixed medium-to-high profiles (
Figure 12c) accounted for the largest proportion of classified points, while uniformly low profiles represented a considerable share. Among the single-low profiles, CCR-low was the most frequent subtype, indicating that weakened cultural character recognition is a prominent issue in the study area.
Overall, the proposed framework provides a reproducible and spatially explicit approach for diagnosing streetscape perception in historic districts. Independent external validation further showed significant correspondence between model predictions and human-derived perceptual rankings across all three dimensions. Future studies could further compare ResNet50 with alternative architectures, such as Vision Transformers, particularly when larger annotated datasets become available, to examine whether different feature-learning mechanisms improve the discrimination of perceptually ambiguous classes. By linking deep learning prediction, spatial statistical analysis, inter-dimensional correlation analysis, and multidimensional profile interpretation, the framework supports a shift from generalized streetscape beautification toward conservation-oriented, profile-based, and context-sensitive renewal.