1. Introduction
Shaping and managing the future of cities is becoming increasingly complex. Global climate change, inadequate urban planning policies, and natural disasters significantly increase urban vulnerability [
1,
2]. According to the United Nations, urban resilience refers to the capacity of cities and urban populations to withstand various hazards and threats, recover from disruptions, maintain essential functions, and adapt to changing conditions [
3]. In this context, the resilient city approach emphasizes the development of flexible ecological, social, economic, and governance structures that enable urban systems to prepare for and respond effectively to sudden shocks, particularly disasters [
3,
4,
5].
In coastal cities, the concentration of population and economic activities along the coastline further complicates the development of adaptive spatial systems [
6]. Even developed regions remain vulnerable to climate-related extreme events, with hurricanes such as Idalia, Florence, and Irma causing significant social and economic losses in North America [
7]. Therefore, understanding and effectively managing risks has become a fundamental component of urban planning within the context of climate change adaptation [
8]. The ability of urban settlements to adapt to changing physical, social, and economic conditions is also closely associated with reducing vulnerability and enhancing resilience [
9]. From this perspective, identifying foreseeable risks and developing appropriate preparedness measures can make a significant contribution to reducing potential losses [
1].
Data-driven tools have become increasingly important for identifying hazard-exposed areas, assessing vulnerabilities, and guiding disaster risk reduction strategies that support urban resilience. Traditional risk assessment approaches rely largely on static hazard maps derived from past events, which may limit the assessment of the dynamic and interconnected nature of contemporary risks [
10]. Consequently, recent studies have increasingly focused on integrated, indicator-based assessment frameworks that combine multidimensional components of urban resilience with multi-criteria decision-making techniques to support disaster risk management and policy prioritization [
11].
Disaster risk emerges at the intersection of hazard, exposure, and vulnerability [
12]. However, contemporary cities are exposed to multiple and interconnected hazards rather than a single source of risk, and the multi-hazard approach has therefore gained increasing importance in disaster research [
13,
14,
15]. Climate change, urbanization pressures, and technological hazards necessitate the joint consideration of natural and human-induced risks [
16]. In this context, disaster risk should be understood not merely as the potential impact of a specific physical hazard, but as a multidimensional process shaped by interactions among different hazards, vulnerabilities, and capacities.
Urban resilience is a fundamental component of this assessment. Originating in the field of ecology, the concept of resilience has evolved over time into one of the key concepts in the urban planning and disaster management literature [
17]. Urban resilience refers to the capacity of cities to maintain essential functions in the face of shocks and stresses, adapt to changing conditions, and transform when necessary [
1,
15]. Contemporary approaches do not limit resilience to post-disaster recovery, but consider it a dynamic process encompassing pre-disaster preparedness, service continuity, infrastructure robustness, and institutional capacity [
4,
13,
18]. Thus, resilience constitutes a fundamental component not only of coping with existing risks but also of adapting to uncertainties that may emerge in the future.
Managing this relationship between risk and resilience also requires effective disaster risk governance. Disaster risk governance encompasses the institutions, actors, and decision-making mechanisms involved in identifying, reducing, and managing risks [
19]. Contemporary disaster management approaches increasingly address disasters as a multi-actor and multi-level governance issue [
20,
21]. Particularly in cities exposed to multiple hazards, it is important to clearly define the roles of central government institutions, local governments, infrastructure providers, and emergency response organizations. Overlapping duties and authorities, inadequate data sharing, and institutional fragmentation may reduce the effectiveness of disaster risk management [
22]. Governance capacity is therefore regarded as one of the key determinants of disaster risk reduction and the achievement of resilience objectives [
19,
23].
This approach is also reflected in the Sendai Framework for Disaster Risk Reduction 2015–2030, in which disaster risk governance is considered a fundamental component of preparedness and risk reduction efforts [
19,
23]. With the adoption of the Sendai Framework, global monitoring and evaluation mechanisms for disaster risk reduction were restructured, and countries began regularly reporting progress in disaster losses, risk reduction policies, and institutional capacities through the Sendai Framework Monitor [
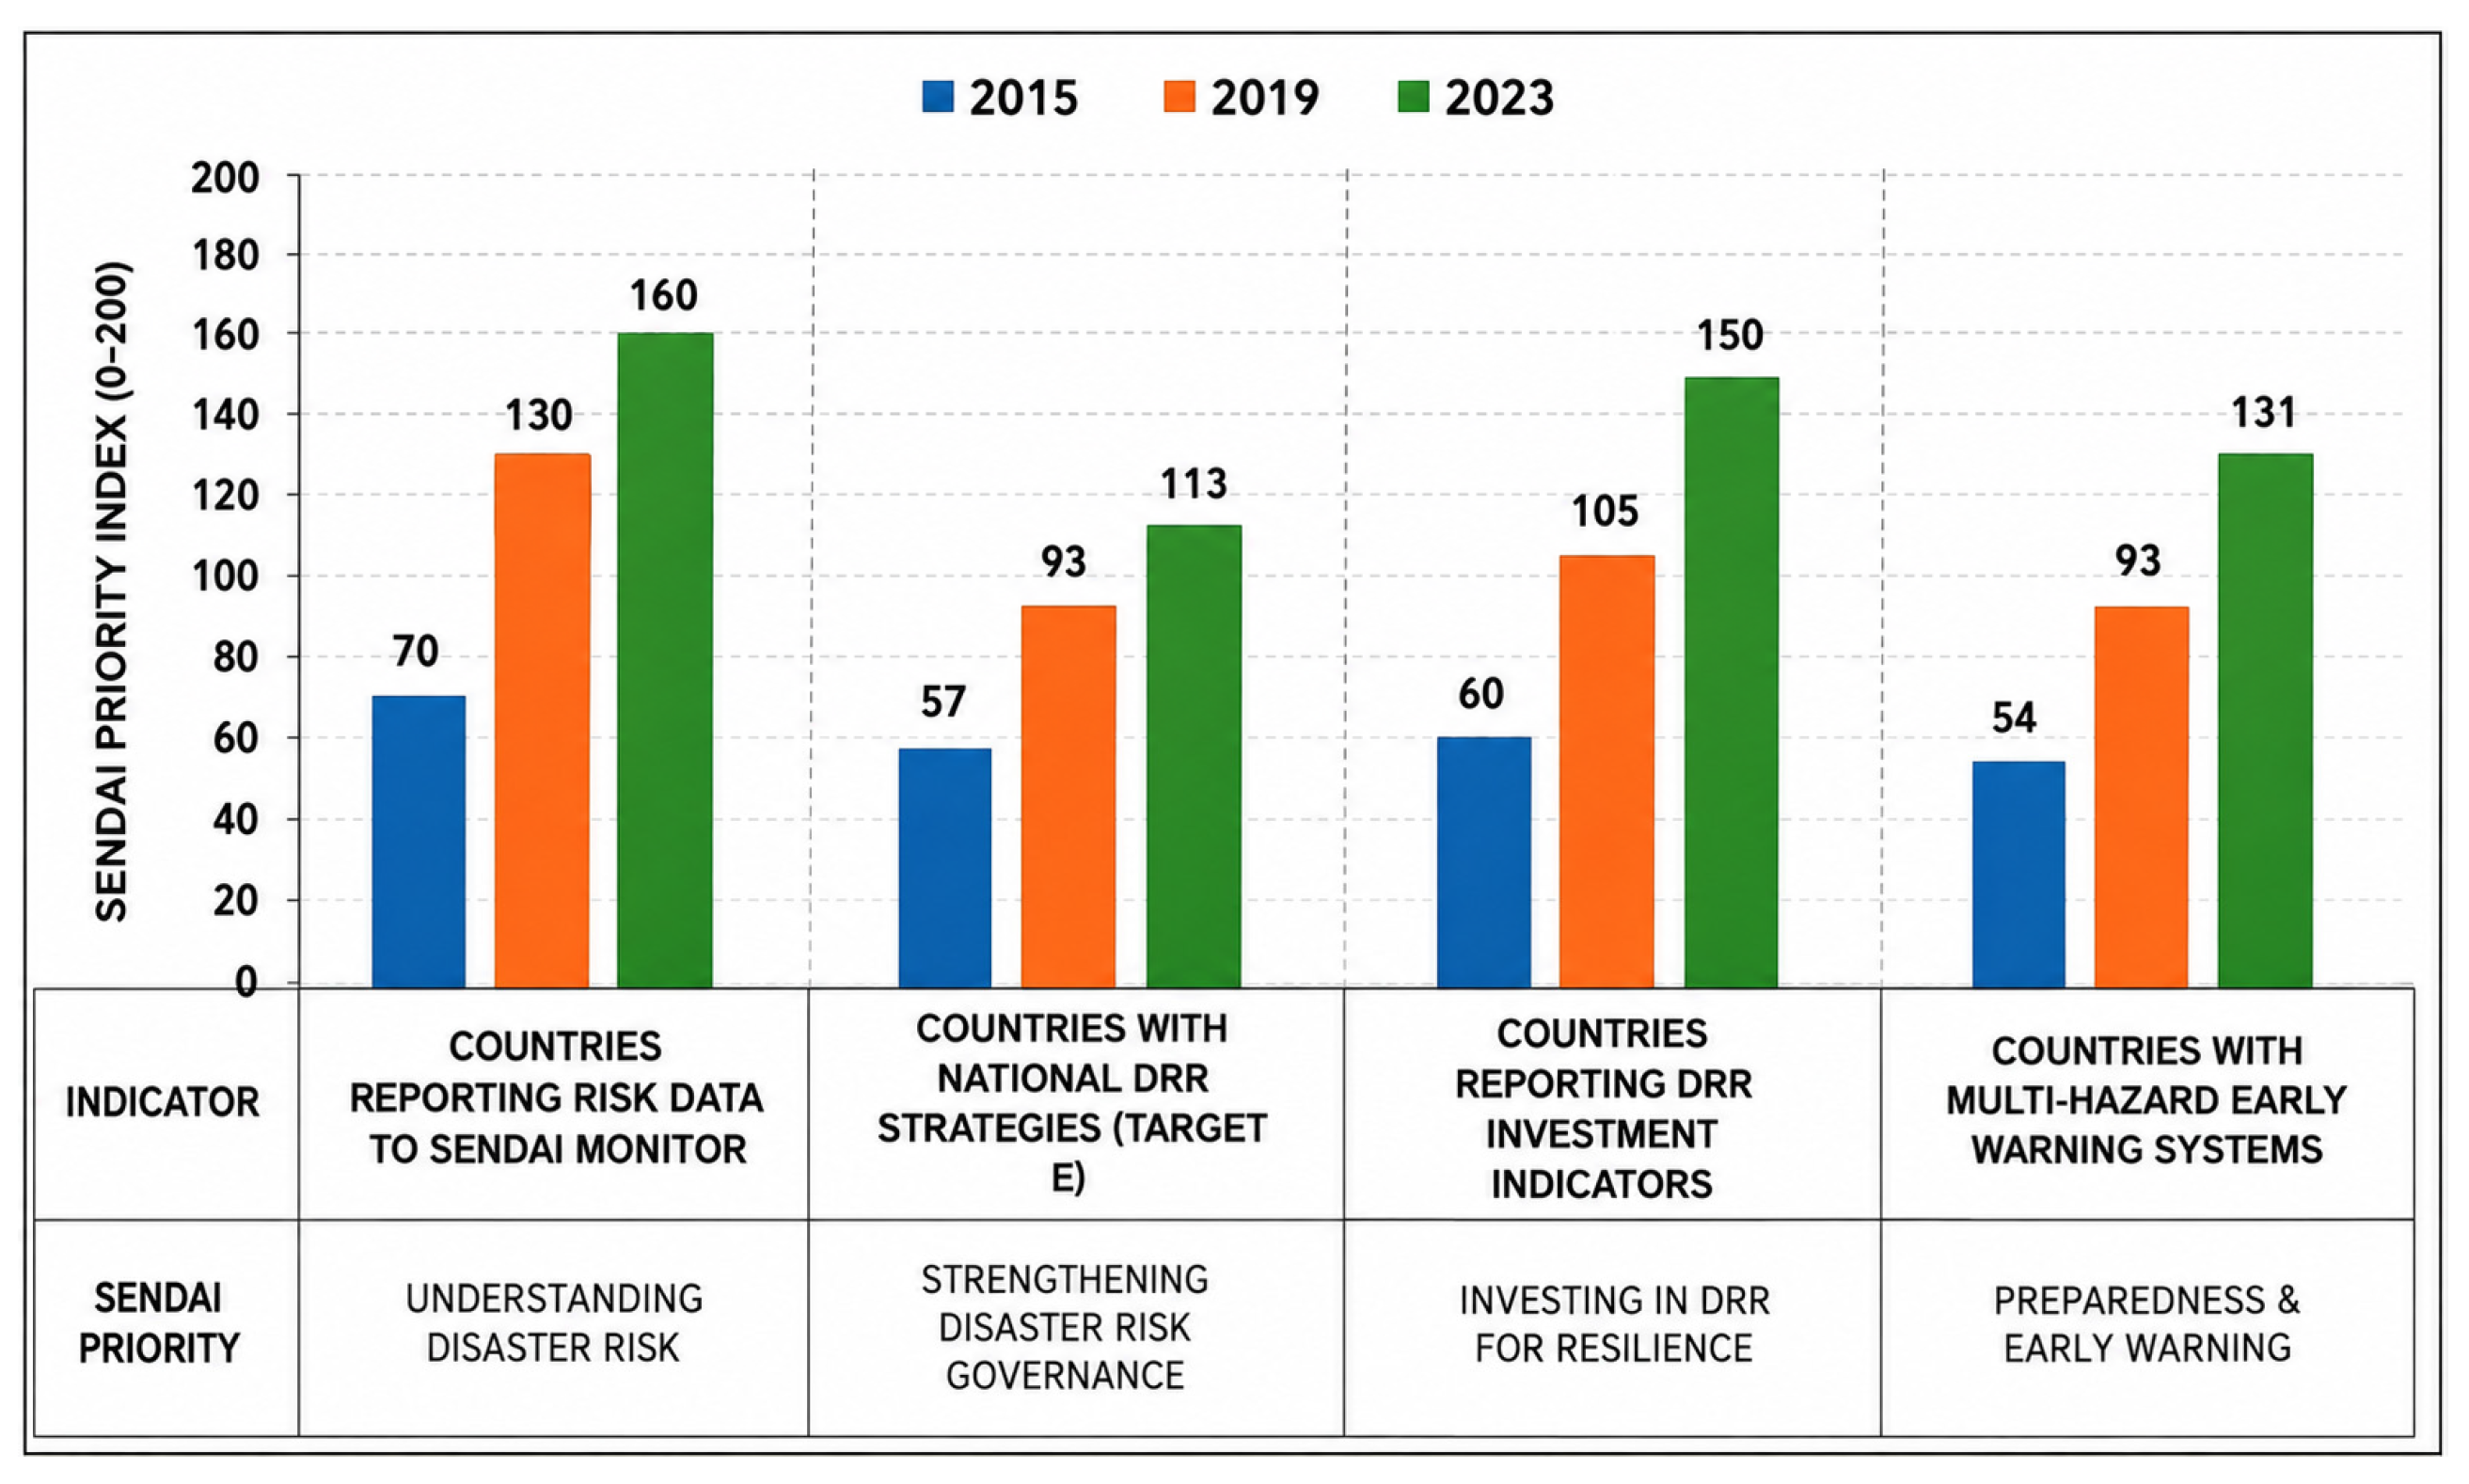
23]. Data for the 2015–2023 period indicate that, while progress has been achieved in technical areas such as improving risk knowledge and strengthening early warning systems, progress in governance-oriented mechanisms, including national and local disaster risk reduction strategies, has remained relatively limited [
24]. This indicates the need to strengthen the relationship between technical risk assessment capacity and governance processes (
Figure 1).
The literature also demonstrates that frequently recurring events such as floods and landslides are associated with deficiencies in land-use decisions, planning processes, and institutional coordination [
22,
25,
26]. Therefore, disaster risk management cannot be reduced solely to the assessment of physical hazards; the effectiveness of planning systems and governance capacity are also important components of the process. Particularly in contexts with limited economic resources, identifying risk factors and prioritizing resources for preparedness, response, and recovery activities are of critical importance [
23,
27]. In Türkiye, the 1999 Marmara Earthquake (Mw 7.6), through its severe impacts on technical and social systems, rendered many planned emergency response measures ineffective [
28,
29]. Similarly, the February 2023 Kahramanmaraş Earthquake Sequence (Mw 7.8 and 7.5) resulted in severe human losses despite existing disaster risk reduction plans [
28,
30].
These experiences demonstrate that quantitative risk assessments alone are insufficient for implementing disaster risk reduction strategies and that decision-making processes must also account for local capacities and institutional responsibilities [
20,
31]. Nevertheless, although various analytical approaches have been developed in the literature for risk, resilience, and multi-hazard assessment, applied decision-support approaches that prioritize multiple natural and human-induced risks together with local resilience capacity and relate the resulting intervention priorities to relevant institutional responsibilities remain relatively limited. Addressing this gap, this study proposes an integrated decision-support framework for identifying and spatially assessing disaster risks and resilience capacities and determining intervention priorities. For this purpose, natural, technological, and environmental risks are evaluated together with urban resilience indicators using AHP and VIKOR methods. The resulting district-level intervention priorities are then linked to institutional roles and areas of responsibility. In this way, the study aims to make visible the relationship between where intervention should be prioritized and which institutional actors bear responsibility for such interventions.
2. Materials and Methods
2.1. Zonguldak as a Case Study
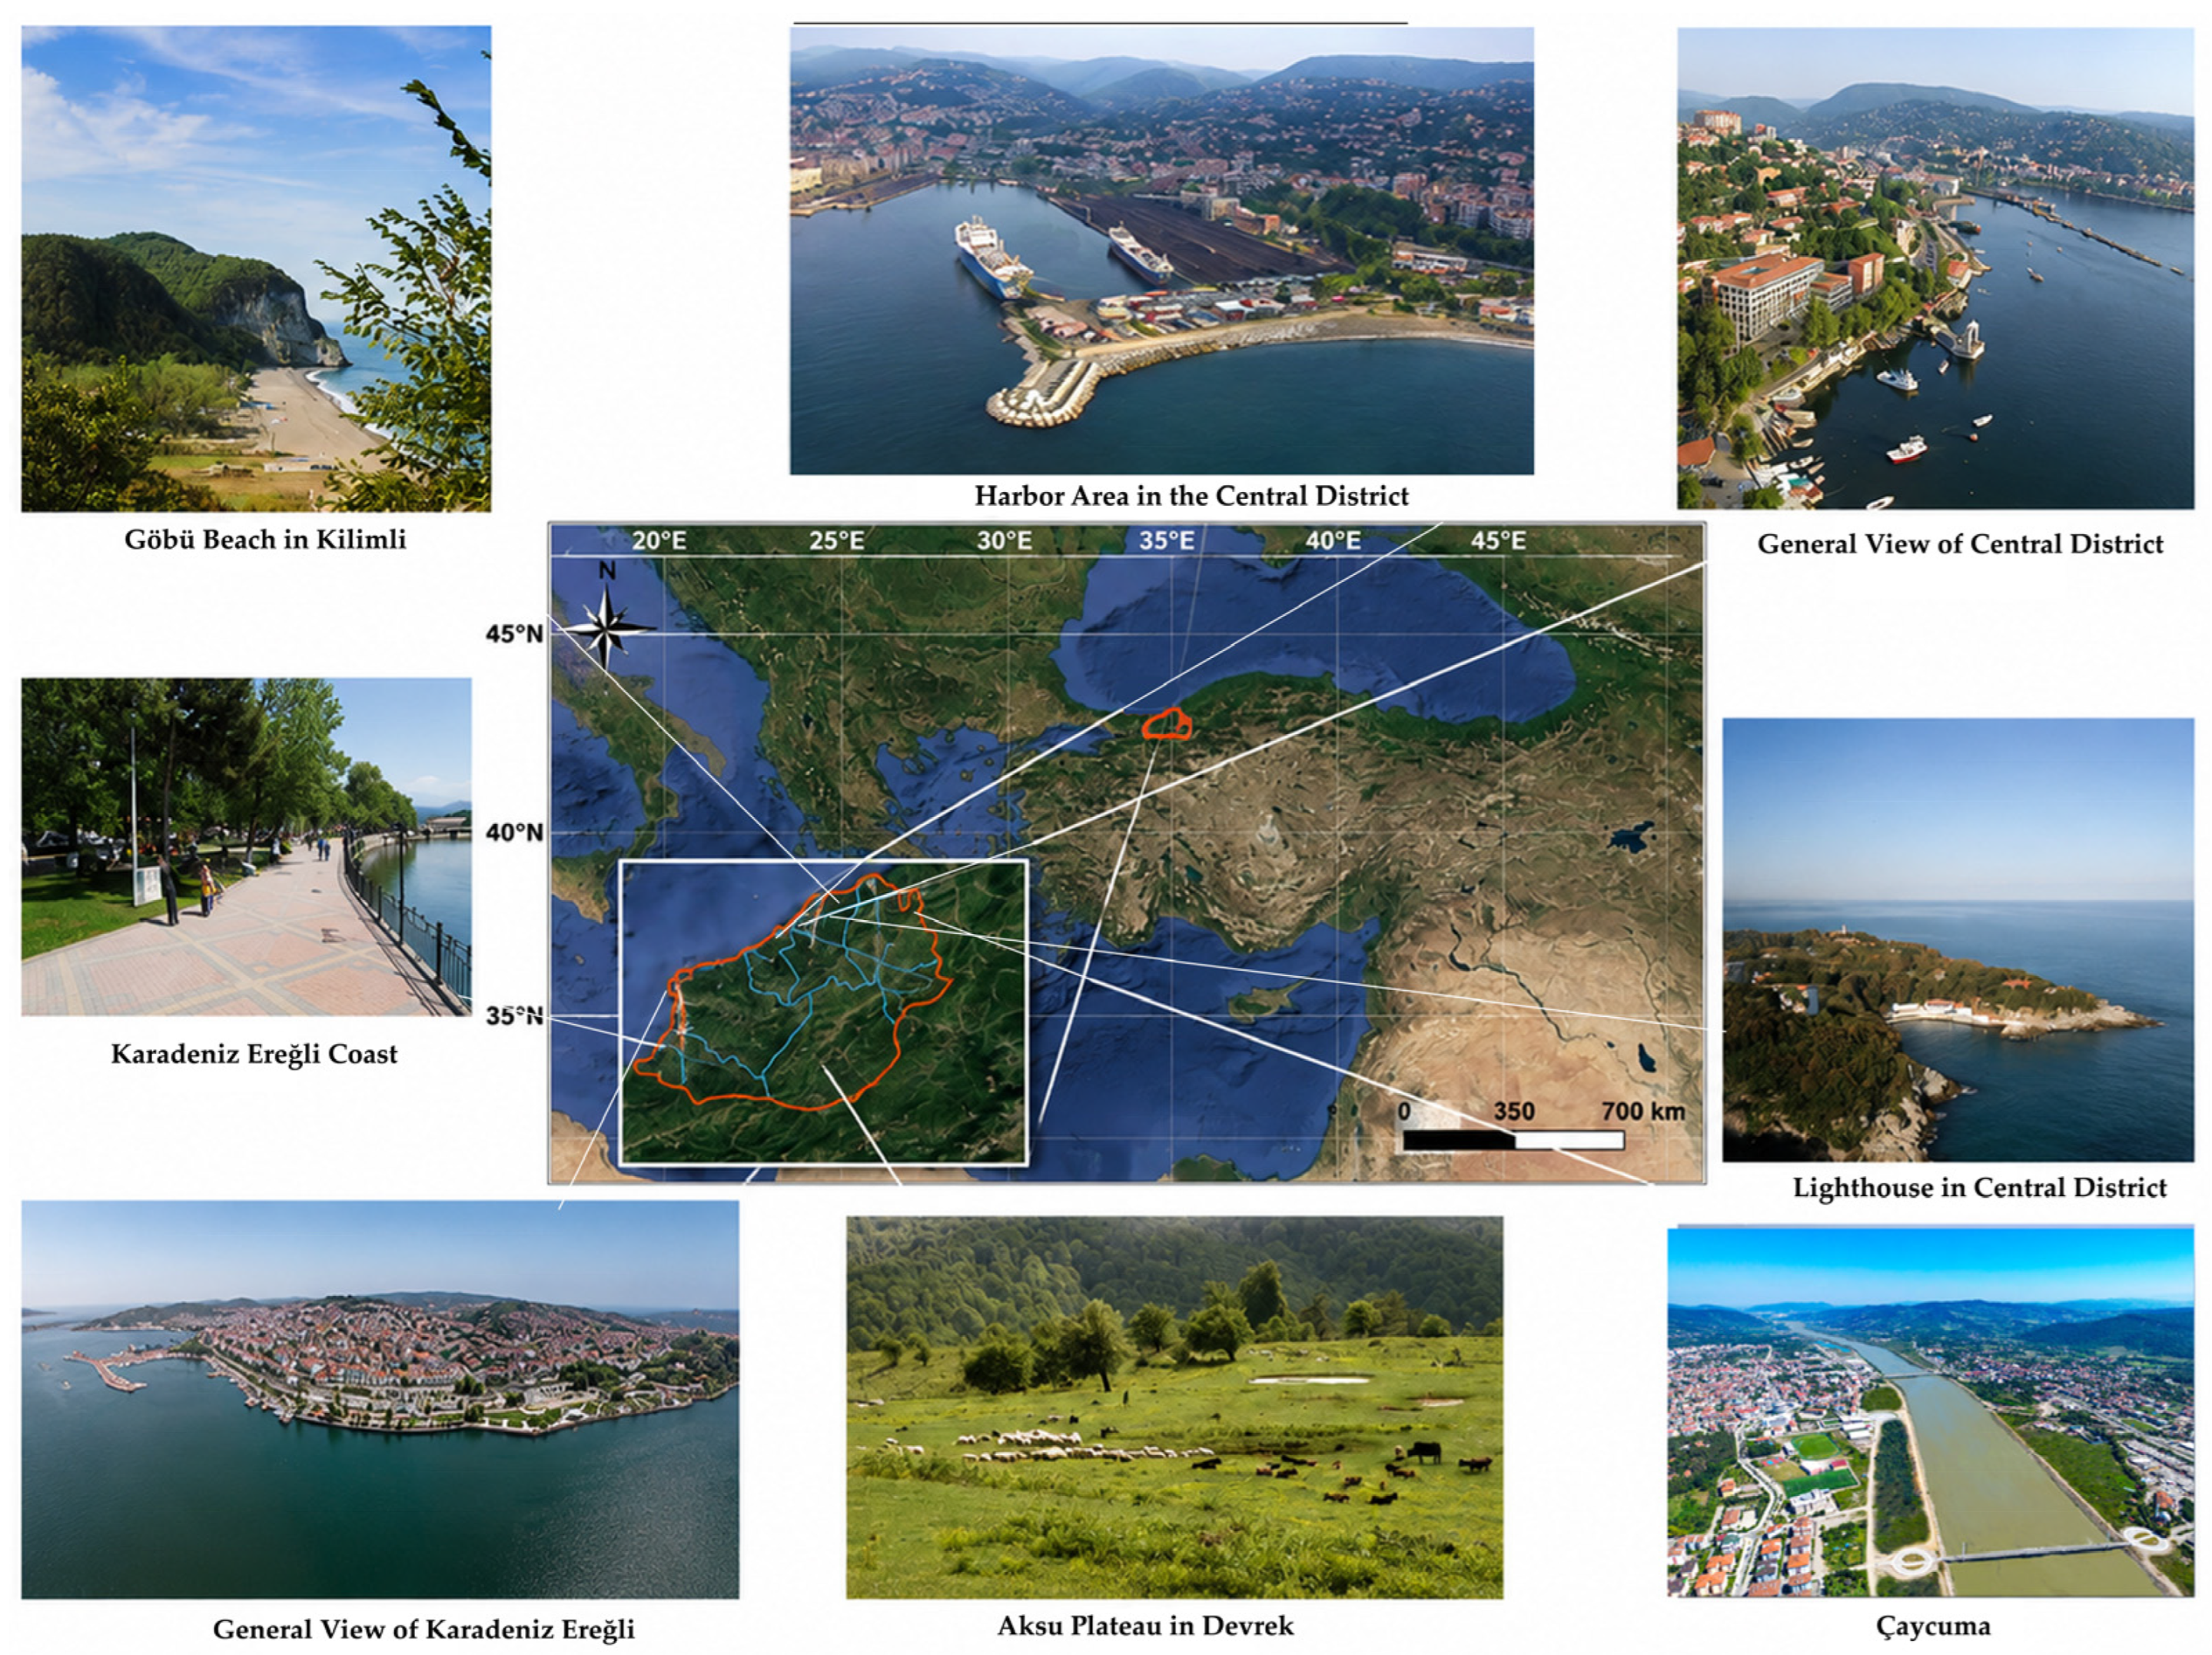
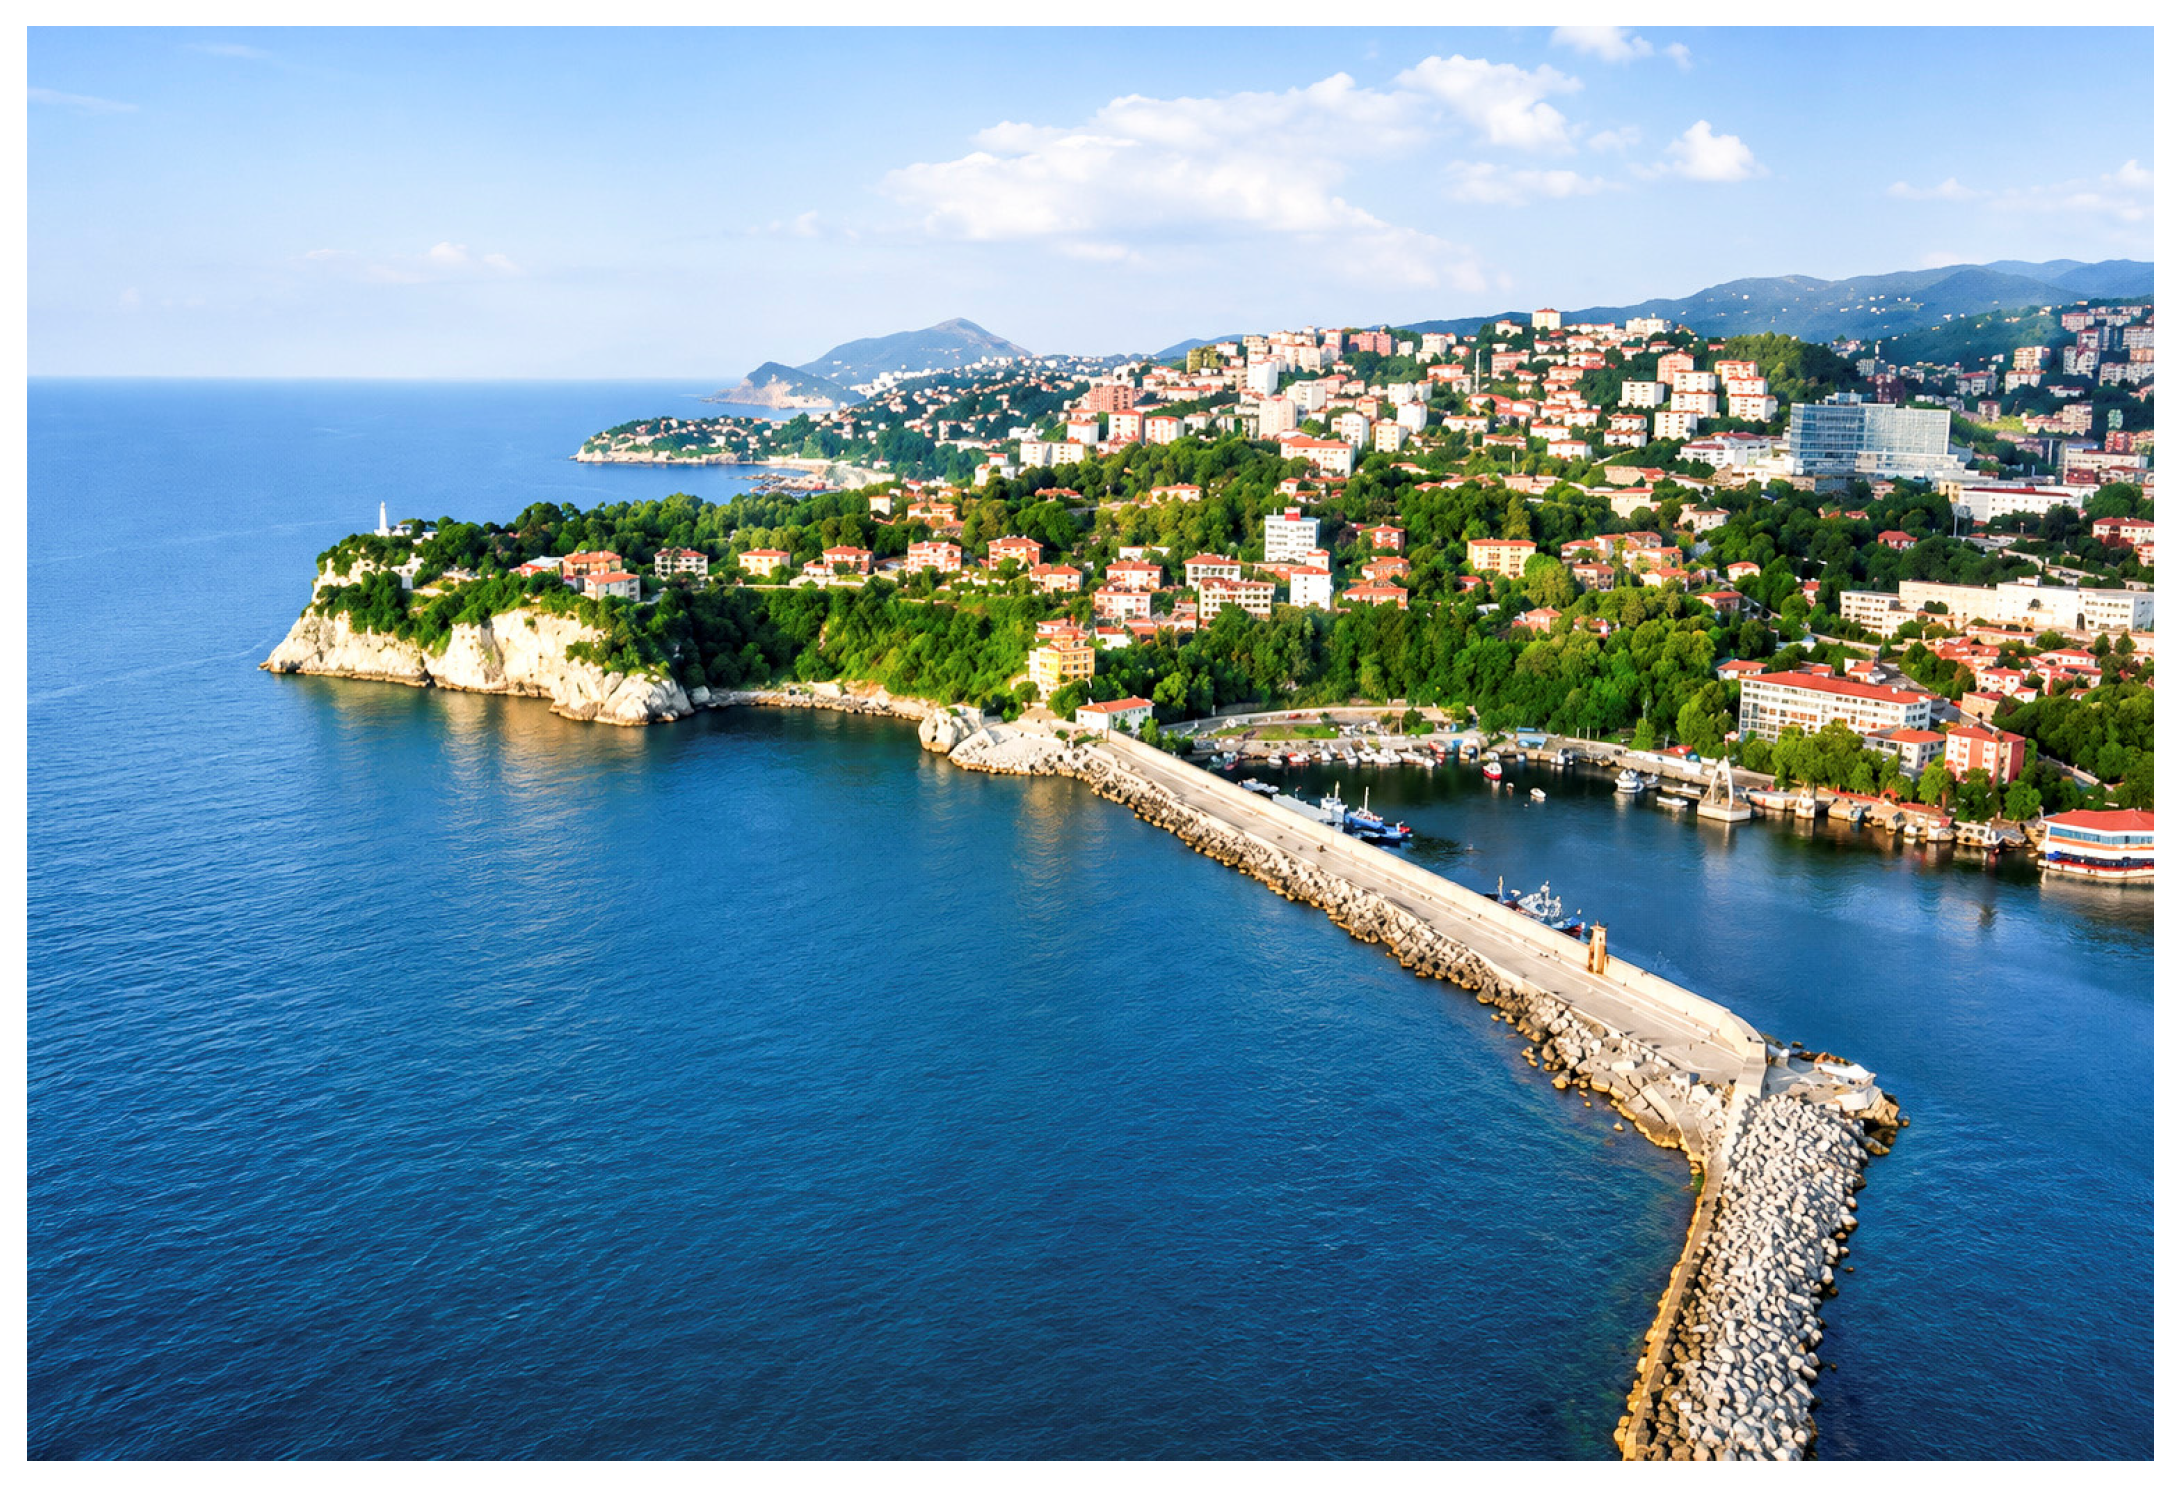
Zonguldak is a province located in northwestern Türkiye along the Black Sea coast (
Figure 2), with a population of approximately 588,000. The study area comprises eight districts of Zonguldak Province: Central District, Kozlu, Kilimli, Çaycuma, Devrek, Gökçebey, Karadeniz Ereğli, and Alaplı [
32].
As a port city, Zonguldak has an economic structure in which hard coal mining and the associated iron and steel industry play an important role [
32]. Approximately 52% of the province’s total area is covered by forests. While extensive forest areas constitute an important component of the province’s ecological character, they also shape its spatial characteristics together with its rugged topography and settlement pattern [
36,
37] (
Figure 3).
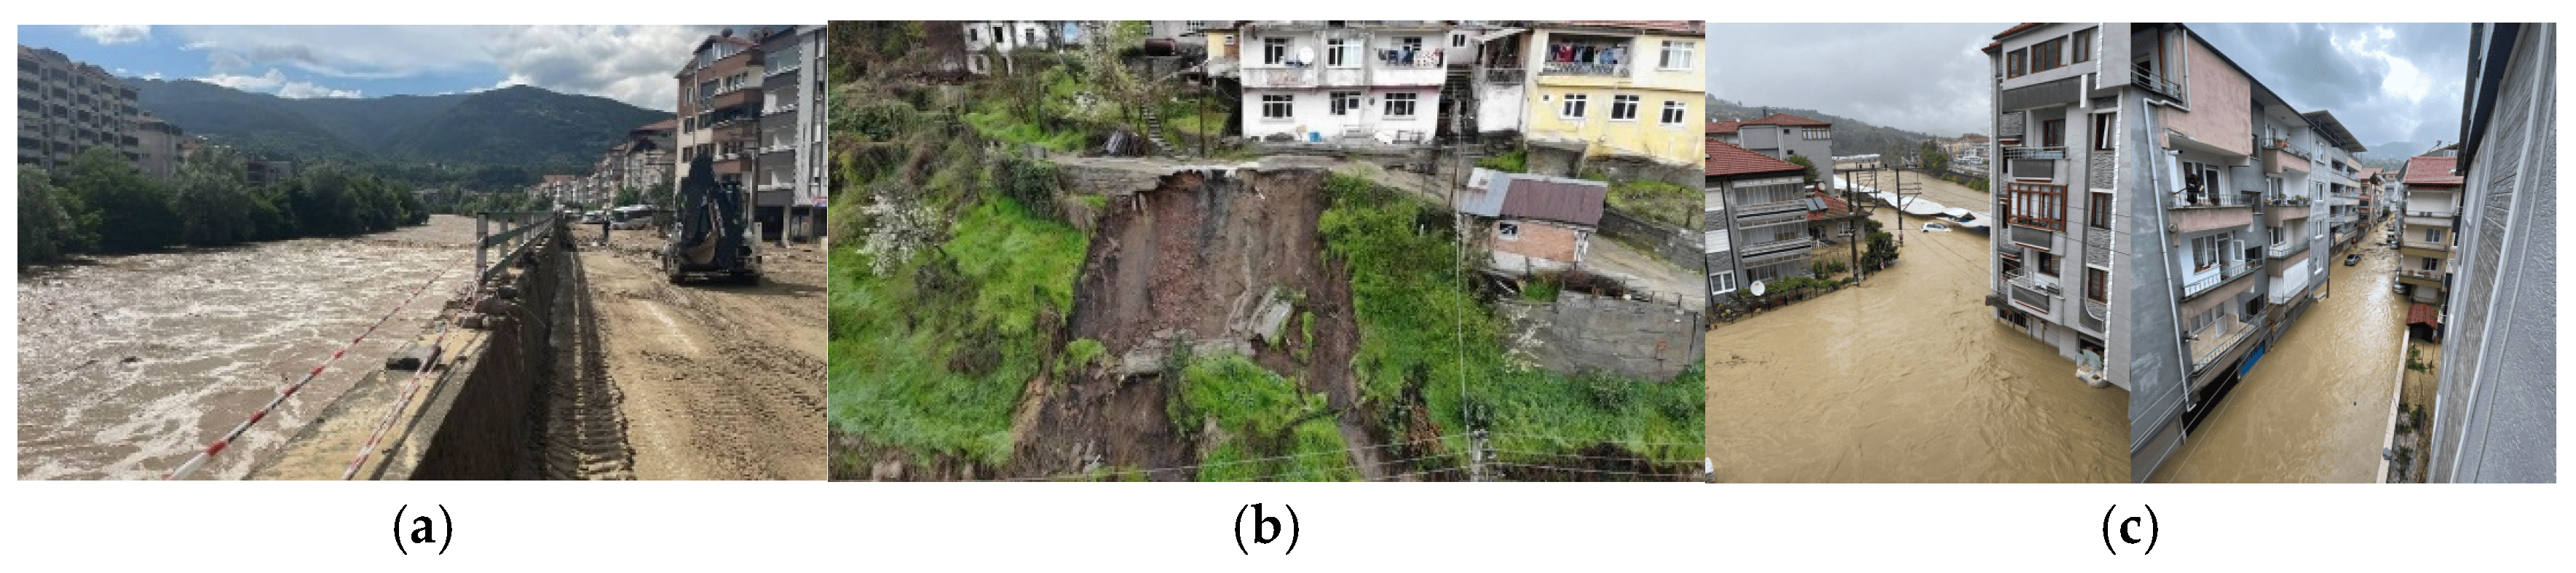
The natural environmental characteristics of Zonguldak are a major determinant of the province’s exposure to various hydro-meteorological and geological hazards. The combination of rugged topography characterized by steep slopes and the high precipitation regime of the Black Sea climate increases the frequency of landslide and flood events in particular [
38]. Past disaster events also demonstrate that these hazards have affected different settlements across the province. Floods in Çaycuma and landslide and flood events observed in other districts provide examples of the direct impacts of these hazards on settlement areas (
Figure 4a–c).
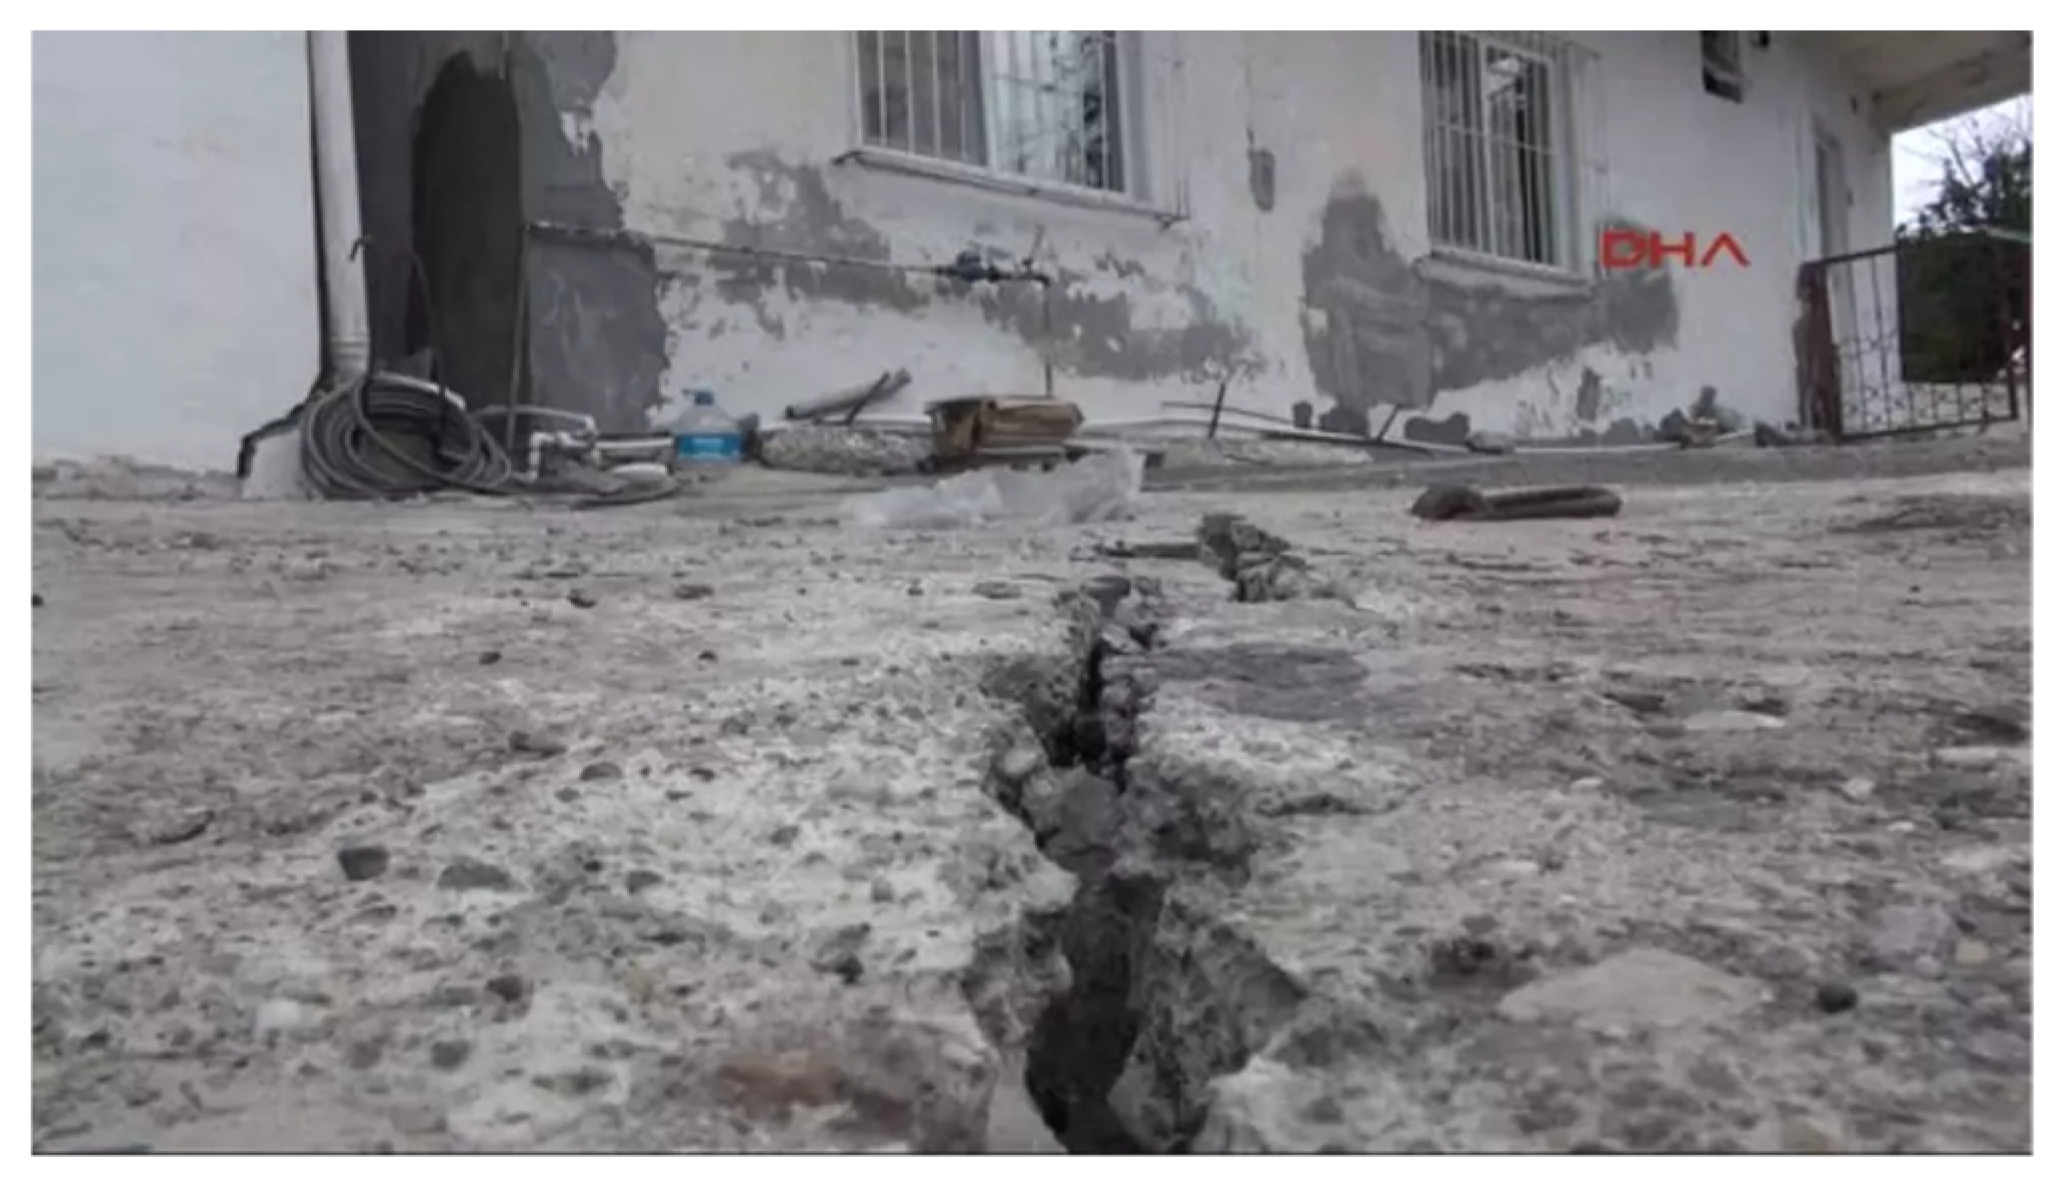
In addition to natural hazards, the province’s mining and industrial history has resulted in human-induced and technological risks becoming an important component of its disaster profile. Hard coal mining, in particular, is associated not only with mining accidents but also with ground deformation caused by mining activities. This process, locally referred to as “tasman,” manifests as surface subsidence and deformation resulting from underground mining and can cause significant damage to buildings and living environments when it occurs within settlement areas [
32,
38]. The tasman formations observed in Kozlu provide an example of this process (
Figure 5).
The industrial structure of the province also generates environmental risks. The presence of thermal power plants and iron and steel production facilities has made air pollution one of Zonguldak’s major environmental problems. In addition, climate change may further complicate the existing hazard pattern by intensifying the impacts of extreme rainfall, storms, and other hydro-meteorological events. Socio-economic problems such as unemployment, out-migration, and poverty may also constrain the capacity of local communities to cope with disasters and recover in their aftermath [
37].
In addition to landslides, floods, and mining-induced tasman events, various other types of hazards, including earthquakes, avalanches, and severe meteorological events, are observed across the province. Zonguldak’s position among the provinces in Türkiye with a disaster recurrence interval of less than five years further highlights its multi-hazard character [
38]. Zonguldak was therefore selected as a case study area where natural, technological, and environmental risks coexist within the same geographical system and resilience capacities vary among districts. These characteristics make Zonguldak an appropriate case study for applying the proposed framework, which jointly evaluates disaster risk and resilience capacity and links the resulting intervention priorities to institutional responsibilities.
2.2. Data and İndicators
The dataset and indicator framework used in this study were developed to establish an integrated decision-support structure capable of jointly evaluating disaster risk and urban resilience capacity at the district level. Accordingly, a total of thirteen indicators were considered under two main analytical dimensions: disaster risk and resilience capacity. The literature also emphasizes that risk indicators and resilience indicators should be conceptually distinguished from one another [
1,
14,
43]. While risk indicators represent physical, environmental, or technological hazards, resilience indicators reflect the capacity of urban systems to withstand disruptive events, maintain their functions, respond effectively, and recover. Therefore, the two indicator groups were defined as separate dimensions in the analysis but integrated within a common spatial decision-support framework.
Three main criteria were considered in selecting the indicators: their relevance to Zonguldak’s multi-hazard profile, their consistency with the disaster risk and urban resilience literature, and the availability of comparable and reliable data at the district level. For this purpose, the Provincial Disaster Risk Reduction Plan, regional development reports, meteorological records, environmental assessments, and the relevant literature were reviewed together. Data were obtained from relevant public institutions, primarily the Disaster and Emergency Management Authority (AFAD), Turkish State Meteorological Service (MGM), General Directorate of State Hydraulic Works (DSİ), General Directorate of Mineral Research and Exploration (MTA), and Turkish Statistical Institute (TURKSTAT). Spatial and statistical datasets were used together to represent different dimensions of disaster risk and resilience.
Seven indicators were evaluated under the risk dimension. Earthquake, landslide, flood, and extreme rainfall represent natural hazards; mining accidents and industrial accidents represent human-induced/technological hazards; and air pollution represents environmental risk. This classification aims to reflect within the analytical framework the coexistence of natural hazards and risks arising from mining and industrial activities within the same spatial system in Zonguldak. Thus, the risk dimension was not limited to natural hazards but was structured to also encompass technological and environmental risks that are significant within the province’s distinctive multi-hazard profile.
Six indicators were used under the resilience dimension: water infrastructure capacity, energy infrastructure reliability, healthcare accessibility, public transport accessibility, road infrastructure quality, and emergency response capacity. These indicators represent technical infrastructure and public service capacities that support pre-disaster preparedness, the continuity of essential services and emergency response during disasters, and post-disaster recovery processes. The continuity of critical infrastructure systems is considered one of the fundamental components of the capacity of urban systems to adapt to and recover from disasters [
1,
44].
The analytical groups of the indicators used in the study, their functional types within natural, human-induced/technological, and environmental risks and resilience capacity, the relevant literature, data sources, data types, and forms of spatial representation are presented in
Table 1.
The table also shows how each indicator is used in the analysis and the relevant areas of institutional responsibility for managing risks or ensuring resilience capacity. The data processing and classification procedure used to transform these indicators, which have different measurement units and data structures, into a common analytical scale at the district level is described in
Section 2.3.
2.3. Spatial Data Processing and Indicator Classification
The data used in this study consist of datasets related to disasters, the environment, infrastructure, and public services produced by different institutions at different spatial scales and in different formats. Spatial datasets, such as earthquake, landslide, and flood hazard data, were evaluated within a common analytical framework together with meteorological records, air quality measurements, infrastructure statistics, and public service data. The data types, sources, and their functions in the analysis are presented in detail in
Table 1. To ensure comparability, all datasets were transformed into a common spatial structure, and the eight districts of Zonguldak Province were adopted as the basic units of analysis.
Spatial data were processed using Geographic Information Systems (GIS) (ArcGIS Pro software was used) and linked to district boundaries. Official spatial data provided by the relevant public institutions were used for risk indicators such as earthquake, landslide, and flood. Data on mining activities, industrial facilities, transportation infrastructure, healthcare services, and emergency response units were spatially associated with the relevant districts, while meteorological and environmental indicators, such as rainfall and air quality, were represented at the district level using the relevant observations and statistics. Thus, data obtained from different sources and at different scales were integrated based on common district boundaries.
Since the selected indicators differ in terms of measurement units, data structures, and analytical characteristics, they are not directly comparable. For example, earthquake and landslide indicators represent hazard conditions and air pollution represents environmental pressure, while indicators such as healthcare accessibility and emergency response capacity represent resilience capacity. Therefore, before being incorporated into the multi-criteria decision-making analysis, the indicators were transformed into a common ordinal assessment scale.
For this purpose, each indicator was converted into a five-level rating system based on its quantitative or spatial values at the district level. The classes were defined as Very Low (1), Low (2), Moderate (3), High (4), and Very High (5). Depending on the characteristics of the indicator, the classification was based on threshold values defined by official institutions, classification criteria used in the relevant literature, or, where predefined thresholds were unavailable, the quantitative distribution among districts. Thus, the classification of each indicator was linked to its source data and the applicable classification procedure. Detailed information on the operationalization and classification procedures for all indicators is provided in
Supplementary Table S1. This five-level ordinal scale constitutes the basic indicator classification used in the multi-criteria decision-making analyses. For the spatial representation of the weighted composite risk and resilience scores calculated at the district level, independently of the analytical classification, the 1–5 score range was visualized using the equal interval method in three classes—low (1.00–2.33), moderate (2.34–3.66), and high (3.67–5.00)—to improve map readability. Details of the risk and resilience indicators are provided in the
Appendix A.
Within the classification system, higher scores for risk indicators represent higher levels of risk, whereas higher scores for resilience indicators represent stronger capacity. Accordingly, the two indicator groups have different preference directions within the decision model. Risk criteria were treated as cost-type criteria, while resilience criteria were treated as benefit-type criteria. This distinction ensures that, in the VIKOR analysis, higher risk levels increase the need for intervention, whereas higher resilience capacity is evaluated as reducing the need for intervention.
As a result of this data processing and classification procedure, heterogeneous datasets obtained from different sources were integrated within a common analytical structure, and a district–indicator decision matrix was constructed to enable comparison of the eight districts across thirteen indicators. The relative importance of the indicators was determined separately using AHP, and the resulting global criterion weights were used together with this decision matrix in the VIKOR analysis.
2.4. Multi-Criteria Decision-Making Framework
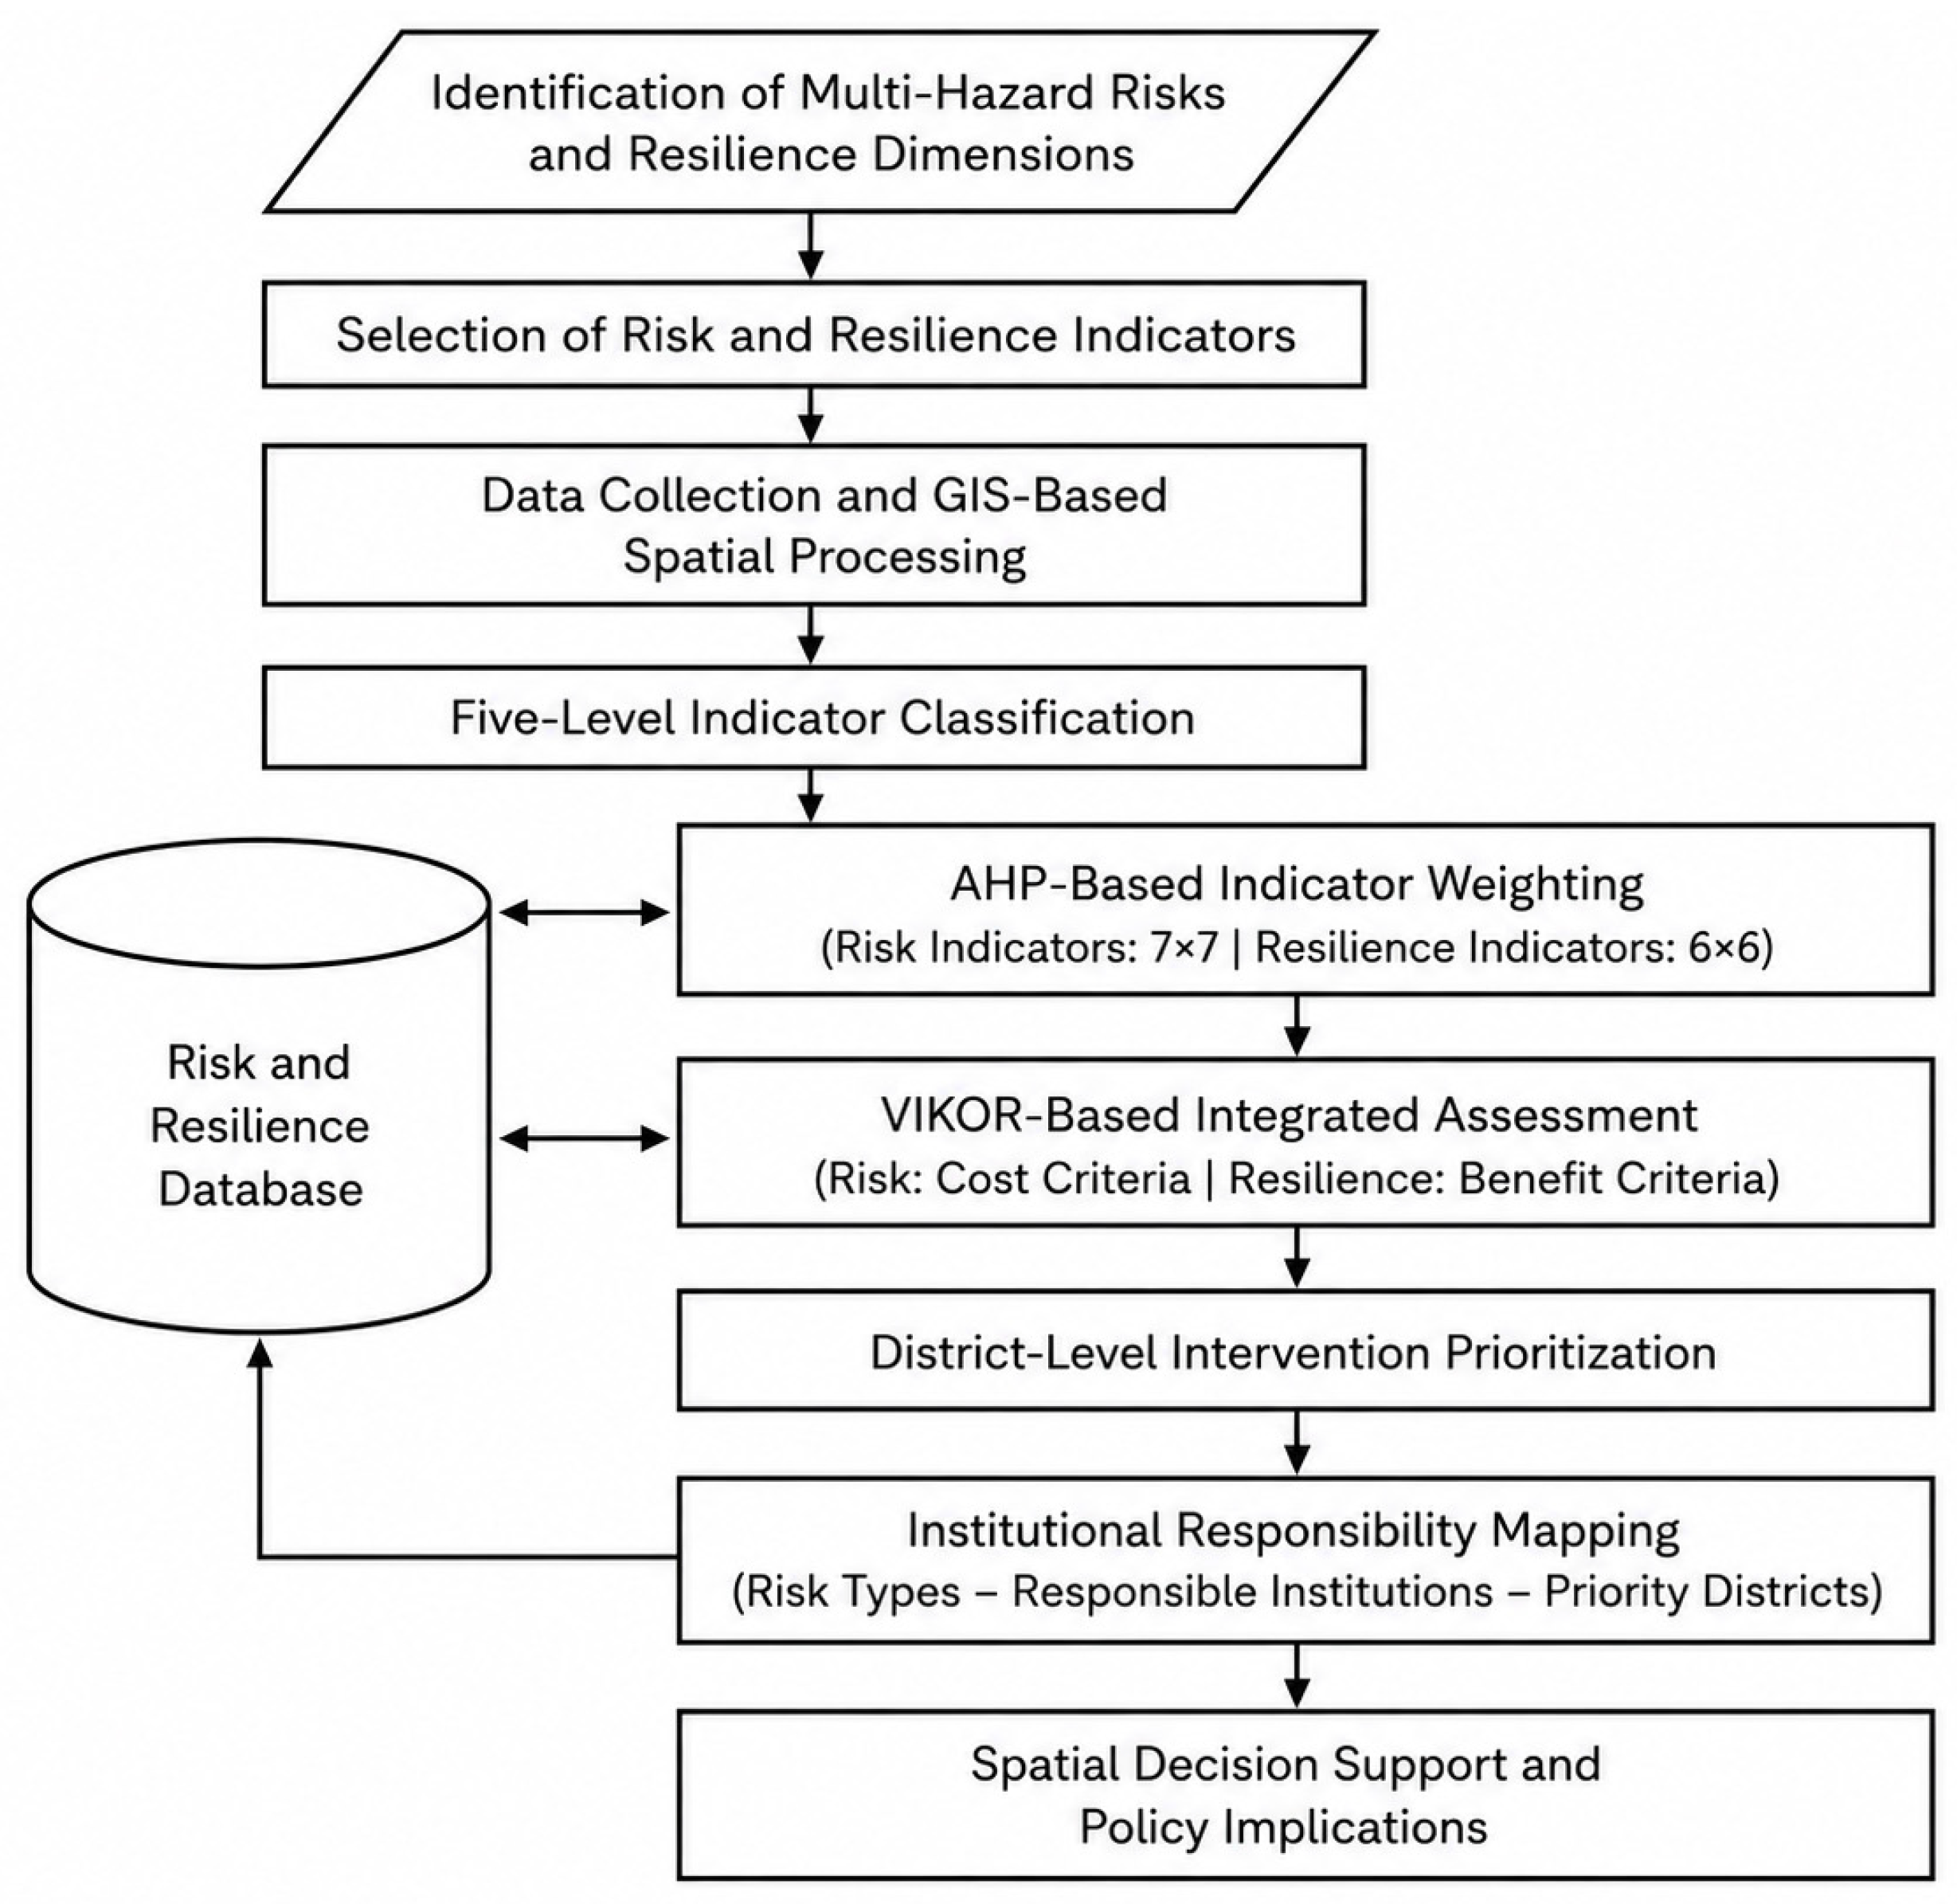
The decision matrix developed in this study was analyzed within a multi-criteria decision-making (MCDM) framework in order to jointly evaluate disaster risk and resilience capacity. The overall methodological workflow of the study is presented in
Figure 6.
The methodological framework consists of four main stages. In the first stage, indicators representing disaster risk and urban resilience capacity were identified, and data obtained from the relevant institutions were processed using Geographic Information Systems (GIS) and made comparable at the district level. In the second stage, the Analytic Hierarchy Process (AHP) was applied to determine the relative importance of the indicators. In the third stage, the global criterion weights obtained from AHP were incorporated into the VIKOR method, and the relative intervention priorities of the districts were determined. In the final stage, risk types were linked to institutional duties and responsibilities, and these relationships were visualized using Sankey diagrams.
The Analytic Hierarchy Process (AHP) was used to determine the relative importance of the indicators [
64]. AHP is a widely used multi-criteria decision-making method that enables the relative importance of different criteria within a decision problem to be determined systematically and consistently. In disaster management and urban resilience studies, different hazard types and capacity indicators do not contribute equally to the decision-making process; therefore, assuming equal importance for all indicators may lead to unrealistic results [
65,
66].
In this study, the AHP structure was developed hierarchically to preserve the conceptual distinction between risk and resilience indicators and to avoid the use of a single large comparison matrix. At the highest level, two main decision dimensions—disaster risk and resilience capacity—were defined, and in accordance with the integrated approach of the study, equal weights were assigned to both dimensions (0.50–0.50). Seven indicators were evaluated under the risk dimension and six indicators under the resilience dimension.
Pairwise comparisons of the risk indicators were constructed by considering the frequency of disaster occurrence, potential for loss of life, economic consequences, spatial extent of impacts, and the degree of difficulty associated with response and recovery processes. Resilience indicators were evaluated based on their functions in disaster preparedness, emergency response, service continuity, and post-disaster recovery processes. The relevant literature, national disaster reports, and the multi-hazard profile of Zonguldak were jointly considered in constructing the comparisons [
38,
67].
Two separate pairwise comparison matrices were constructed: a 7 × 7 matrix for the risk indicators and a 6 × 6 matrix for the resilience indicators. Comparisons were performed using Saaty’s fundamental 1–9 scale, and the local weights of the criteria were calculated using the principal eigenvector method (
Table 2) [
68].
A total of 21 pairwise comparisons were conducted for the risk indicators and 15 for the resilience indicators. The pairwise comparison matrices developed for the risk and resilience indicators, together with the resulting local and global AHP weights, are presented in
Appendix C.
The consistency of the pairwise comparison matrices was evaluated using the Consistency Index (
CI) and Consistency Ratio (
CR). To assess the reliability of the weighting structure, the maximum eigenvalue (λmax),
CI, and the Random Index (
RI) corresponding to the matrix size were used (
Table 3).
CI and
CR were calculated as follows:
A CR value below 0.10 indicates that the comparison matrix has an acceptable level of consistency [
68]. In this study, λmax = 7.172 and CR = 0.021 were calculated for the risk indicators, whereas λmax = 6.041 and CR = 0.007 were obtained for the resilience indicators. Both CR values are well below the threshold of 0.10, indicating that the pairwise comparison matrices have an acceptable level of consistency. The local weight of each indicator was multiplied by the weight of its corresponding main dimension (0.50) to obtain the global AHP weights of the thirteen indicators.
The global criterion weights obtained from AHP were subsequently incorporated into the VIKOR analysis to determine district-level intervention priorities by jointly considering disaster risk and resilience capacity.
VIKOR is a multi-criteria decision-making method that aims to generate a compromise ranking by evaluating the relative positions of alternatives with respect to the ideal solution under multiple and potentially conflicting criteria [
69]. In the VIKOR analysis, the five-level ordinal indicator values defined in
Section 2.3 constituted the decision matrix. Since risk and resilience indicators have opposite effects on intervention needs, their preference directions were defined accordingly. Higher values for risk indicators represent greater disaster risk and therefore a greater need for intervention, whereas lower values for resilience indicators represent more limited capacity and consequently a greater need for intervention. Accordingly, the ideal and anti-ideal values for each criterion were determined by considering the direction of the criterion.
The normalized distance of each district from the criterion-specific ideal solution was calculated as follows:
where
fij denotes the value of district
i for criterion
j,
fj* denotes the ideal value for the corresponding criterion, and
fj− denotes the anti-ideal value. The preference directions of the criteria were taken into account when determining the ideal and anti-ideal values, thereby incorporating the opposite effects of risk and resilience indicators on intervention needs into the decision model. Importantly, in this study, the ideal (
fj*) and anti-ideal (
fj−) values are defined with respect to intervention need rather than conventional alternative performance. Accordingly,
fj* represents the condition of greatest intervention need (higher risk and lower resilience), whereas
fj− represents the condition of lowest intervention need (lower risk and higher resilience). Under this intervention-oriented formulation, lower
Qi values indicate higher relative intervention priority.
Using the normalized criterion distances and the global criterion weights obtained from AHP,
Si and
Ri were calculated for each district.
Si represents the total weighted distance of a district from the ideal solution across all criteria, whereas
Ri represents the maximum weighted distance observed for any individual criterion.
In the next stage,
Si and
Ri were combined to calculate the VIKOR compromise ranking index
Qi:
where
S* is the minimum
Si value,
S− is the maximum
Si value,
R* is the minimum
Ri value, and
R− is the maximum
Ri value. The parameter v represents the balance between group utility and individual regret. In accordance with the balanced compromise approach commonly used in the literature, v = 0.50 was adopted in the baseline analysis [
69,
70].
The resulting Qi values represent the relative intervention priorities of the districts by jointly considering disaster risk and resilience capacity. Since the decision problem in this study was structured to prioritize intervention needs, lower Qi values indicate higher intervention priority.
A sensitivity analysis was also conducted to evaluate the robustness of the model results to changes in the selected compromise parameter and criterion weights. First, the v parameter was varied across 0.00, 0.25, 0.50, 0.75, and 1.00 to examine potential changes in district rankings. Second, the global criterion weights obtained from AHP were individually varied by ±10%, and the weights were renormalized in each scenario to assess ranking stability. In this way, the sensitivity of intervention priorities to reasonable variations in model parameters and criterion weights was tested.
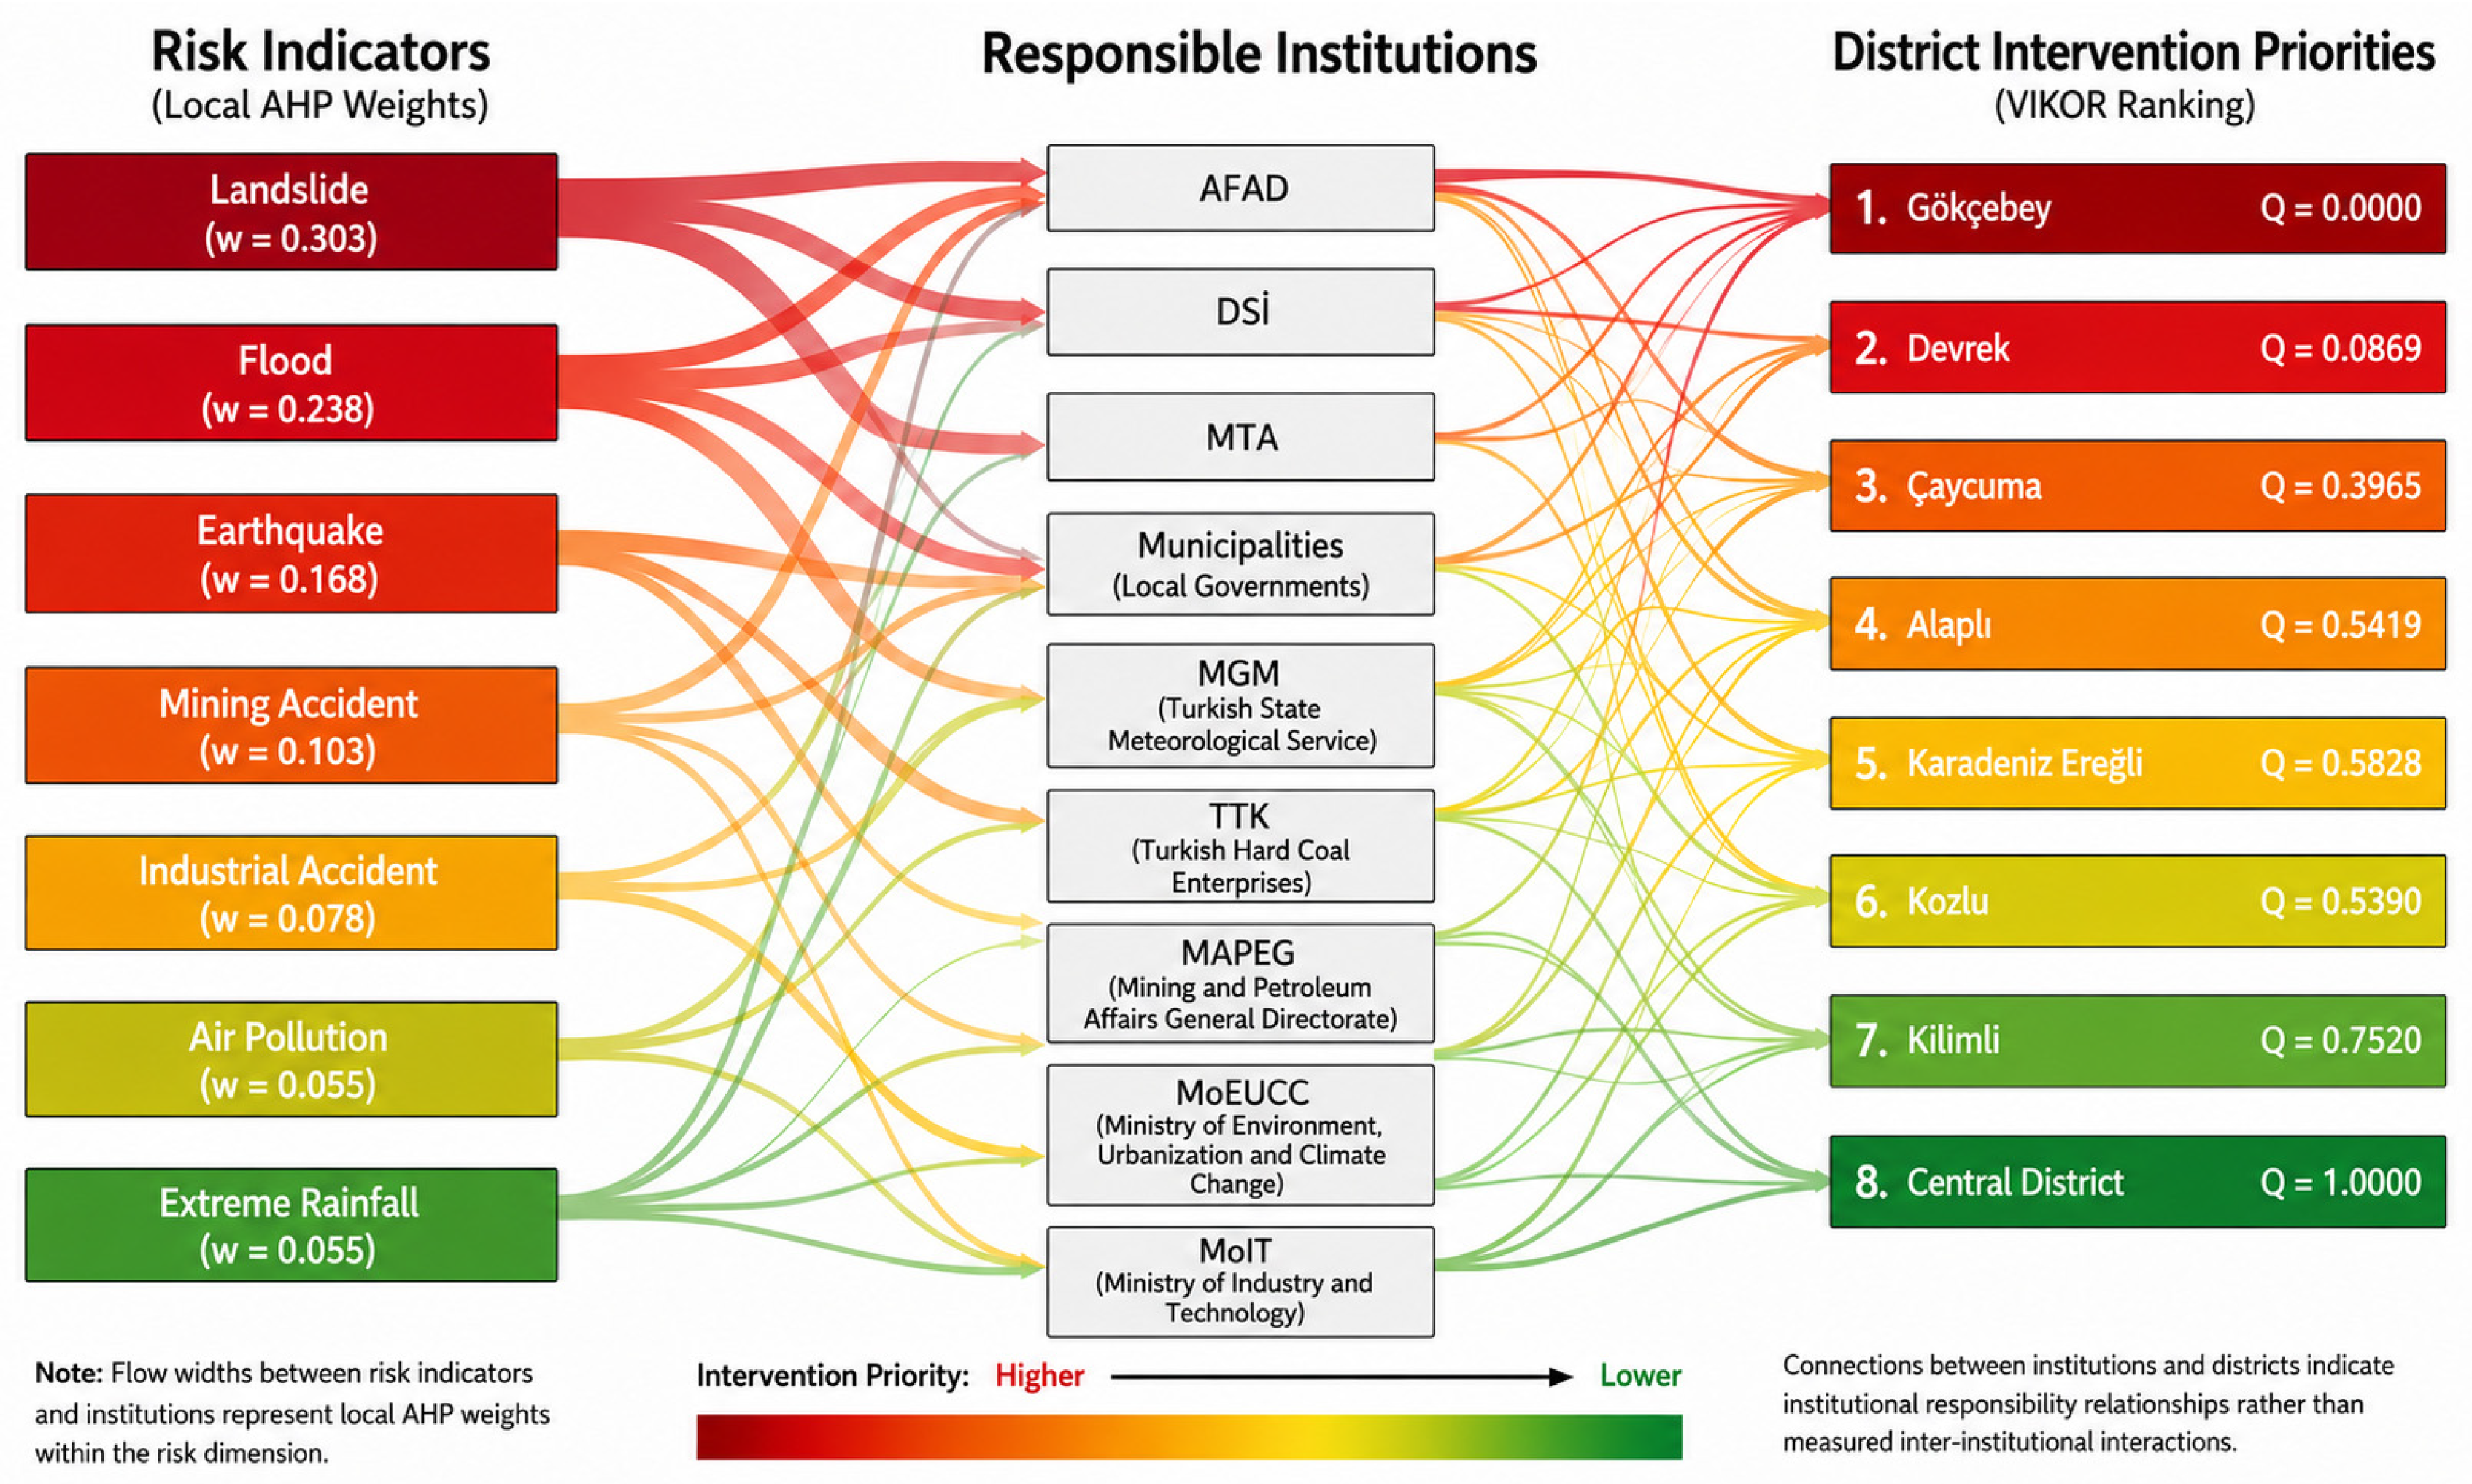
In the final stage of the analysis, the institutional responsibility dimension of disaster risk governance was addressed. Each risk indicator was matched with the relevant institutional duties and areas of responsibility, and the relationships among risk types, responsible institutions, and priority intervention areas were visualized using Sankey diagrams. The Sankey diagram was produced as an institutional responsibility mapping tool that enables risk types, formal institutional responsibilities, and intervention priorities to be displayed within a common visual structure.
3. Findings
3.1. AHP Weighting Results
The local and global criterion weights obtained from the AHP analysis are presented in
Table 4. By assigning equal weights to the main dimensions of risk and resilience, each dimension contributed 50% to the decision model. Within the risk dimension, landslide risk received the highest local weight (0.303), followed by flood risk (0.238) and earthquake risk (0.168). Within the resilience dimension, emergency response capacity and healthcare accessibility equally received the highest local weights (0.288), followed by road infrastructure quality (0.170). By combining the main dimension weights with the local criterion weights, landslide risk (0.1515), emergency response capacity (0.1439), healthcare accessibility (0.1439), and flood risk (0.1190) were identified as the indicators with the highest global weights in the decision model (
Table 4).
The consistency of the pairwise comparison matrices was evaluated separately for the risk and resilience dimensions. For the comparison matrix containing the seven risk indicators, the maximum eigenvalue (λmax) was calculated as 7.172 and the Consistency Ratio (CR) as 0.021. For the matrix containing the six resilience indicators, λmax = 6.041 and CR = 0.007 were obtained. Both CR values were well below the threshold of 0.10, indicating that the pairwise comparisons had an acceptable level of consistency.
The distribution of weights within the risk dimension highlights the prominent importance of landslide and flood hazards in Zonguldak’s disaster profile. In addition to these two hazards, the relatively high weight assigned to earthquake risk is associated with the potential loss of life, economic consequences, spatial extent of impacts, and the difficulties these hazards may create during response and recovery processes. Mining accident and industrial accident risks received intermediate weights, whereas air pollution and extreme rainfall events had lower relative weights within the risk dimension.
Within the resilience dimension, emergency response capacity and healthcare accessibility were identified as the indicators with the highest relative importance. Their being followed by road infrastructure quality highlights the importance of accessibility, response capacity, and continuity of essential services for local resilience during disasters. Within the hierarchical structure in which the risk and resilience dimensions contribute equally, the resulting global weights ensure that both high-impact hazards and indicators representing disaster response and recovery capacity play a determining role in district prioritization.
3.2. District-Level Risk and Resilience Profiles
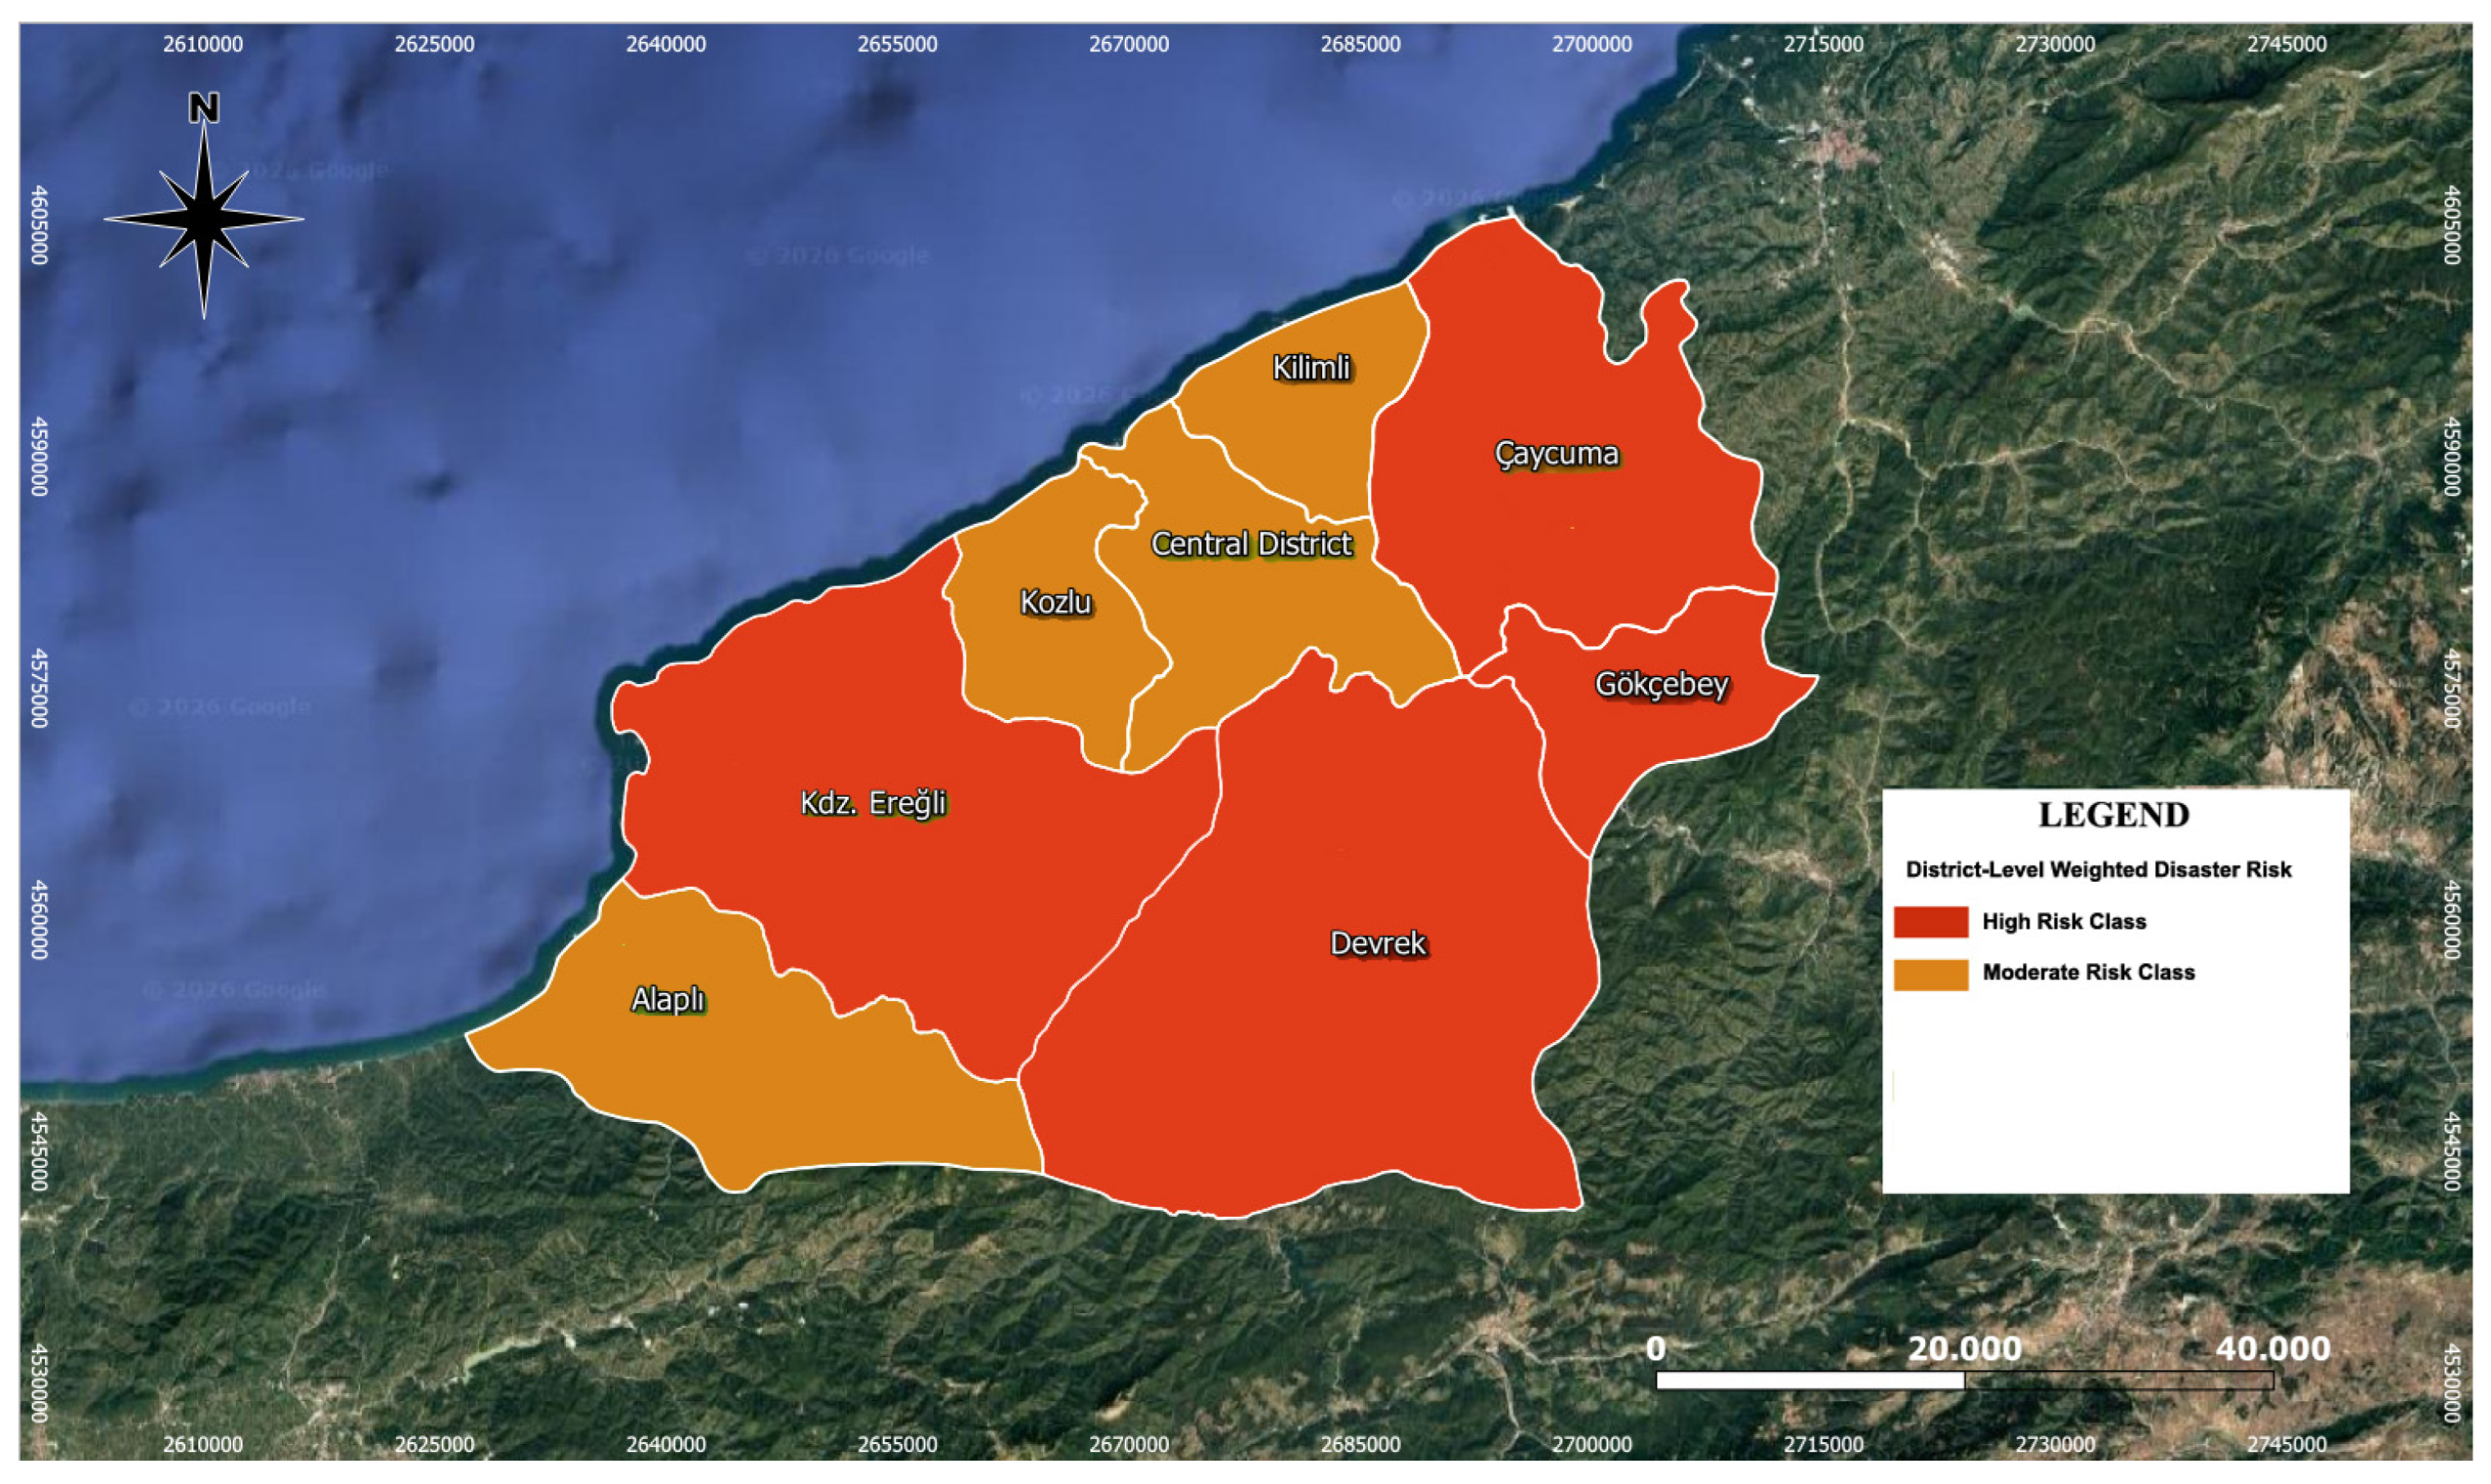
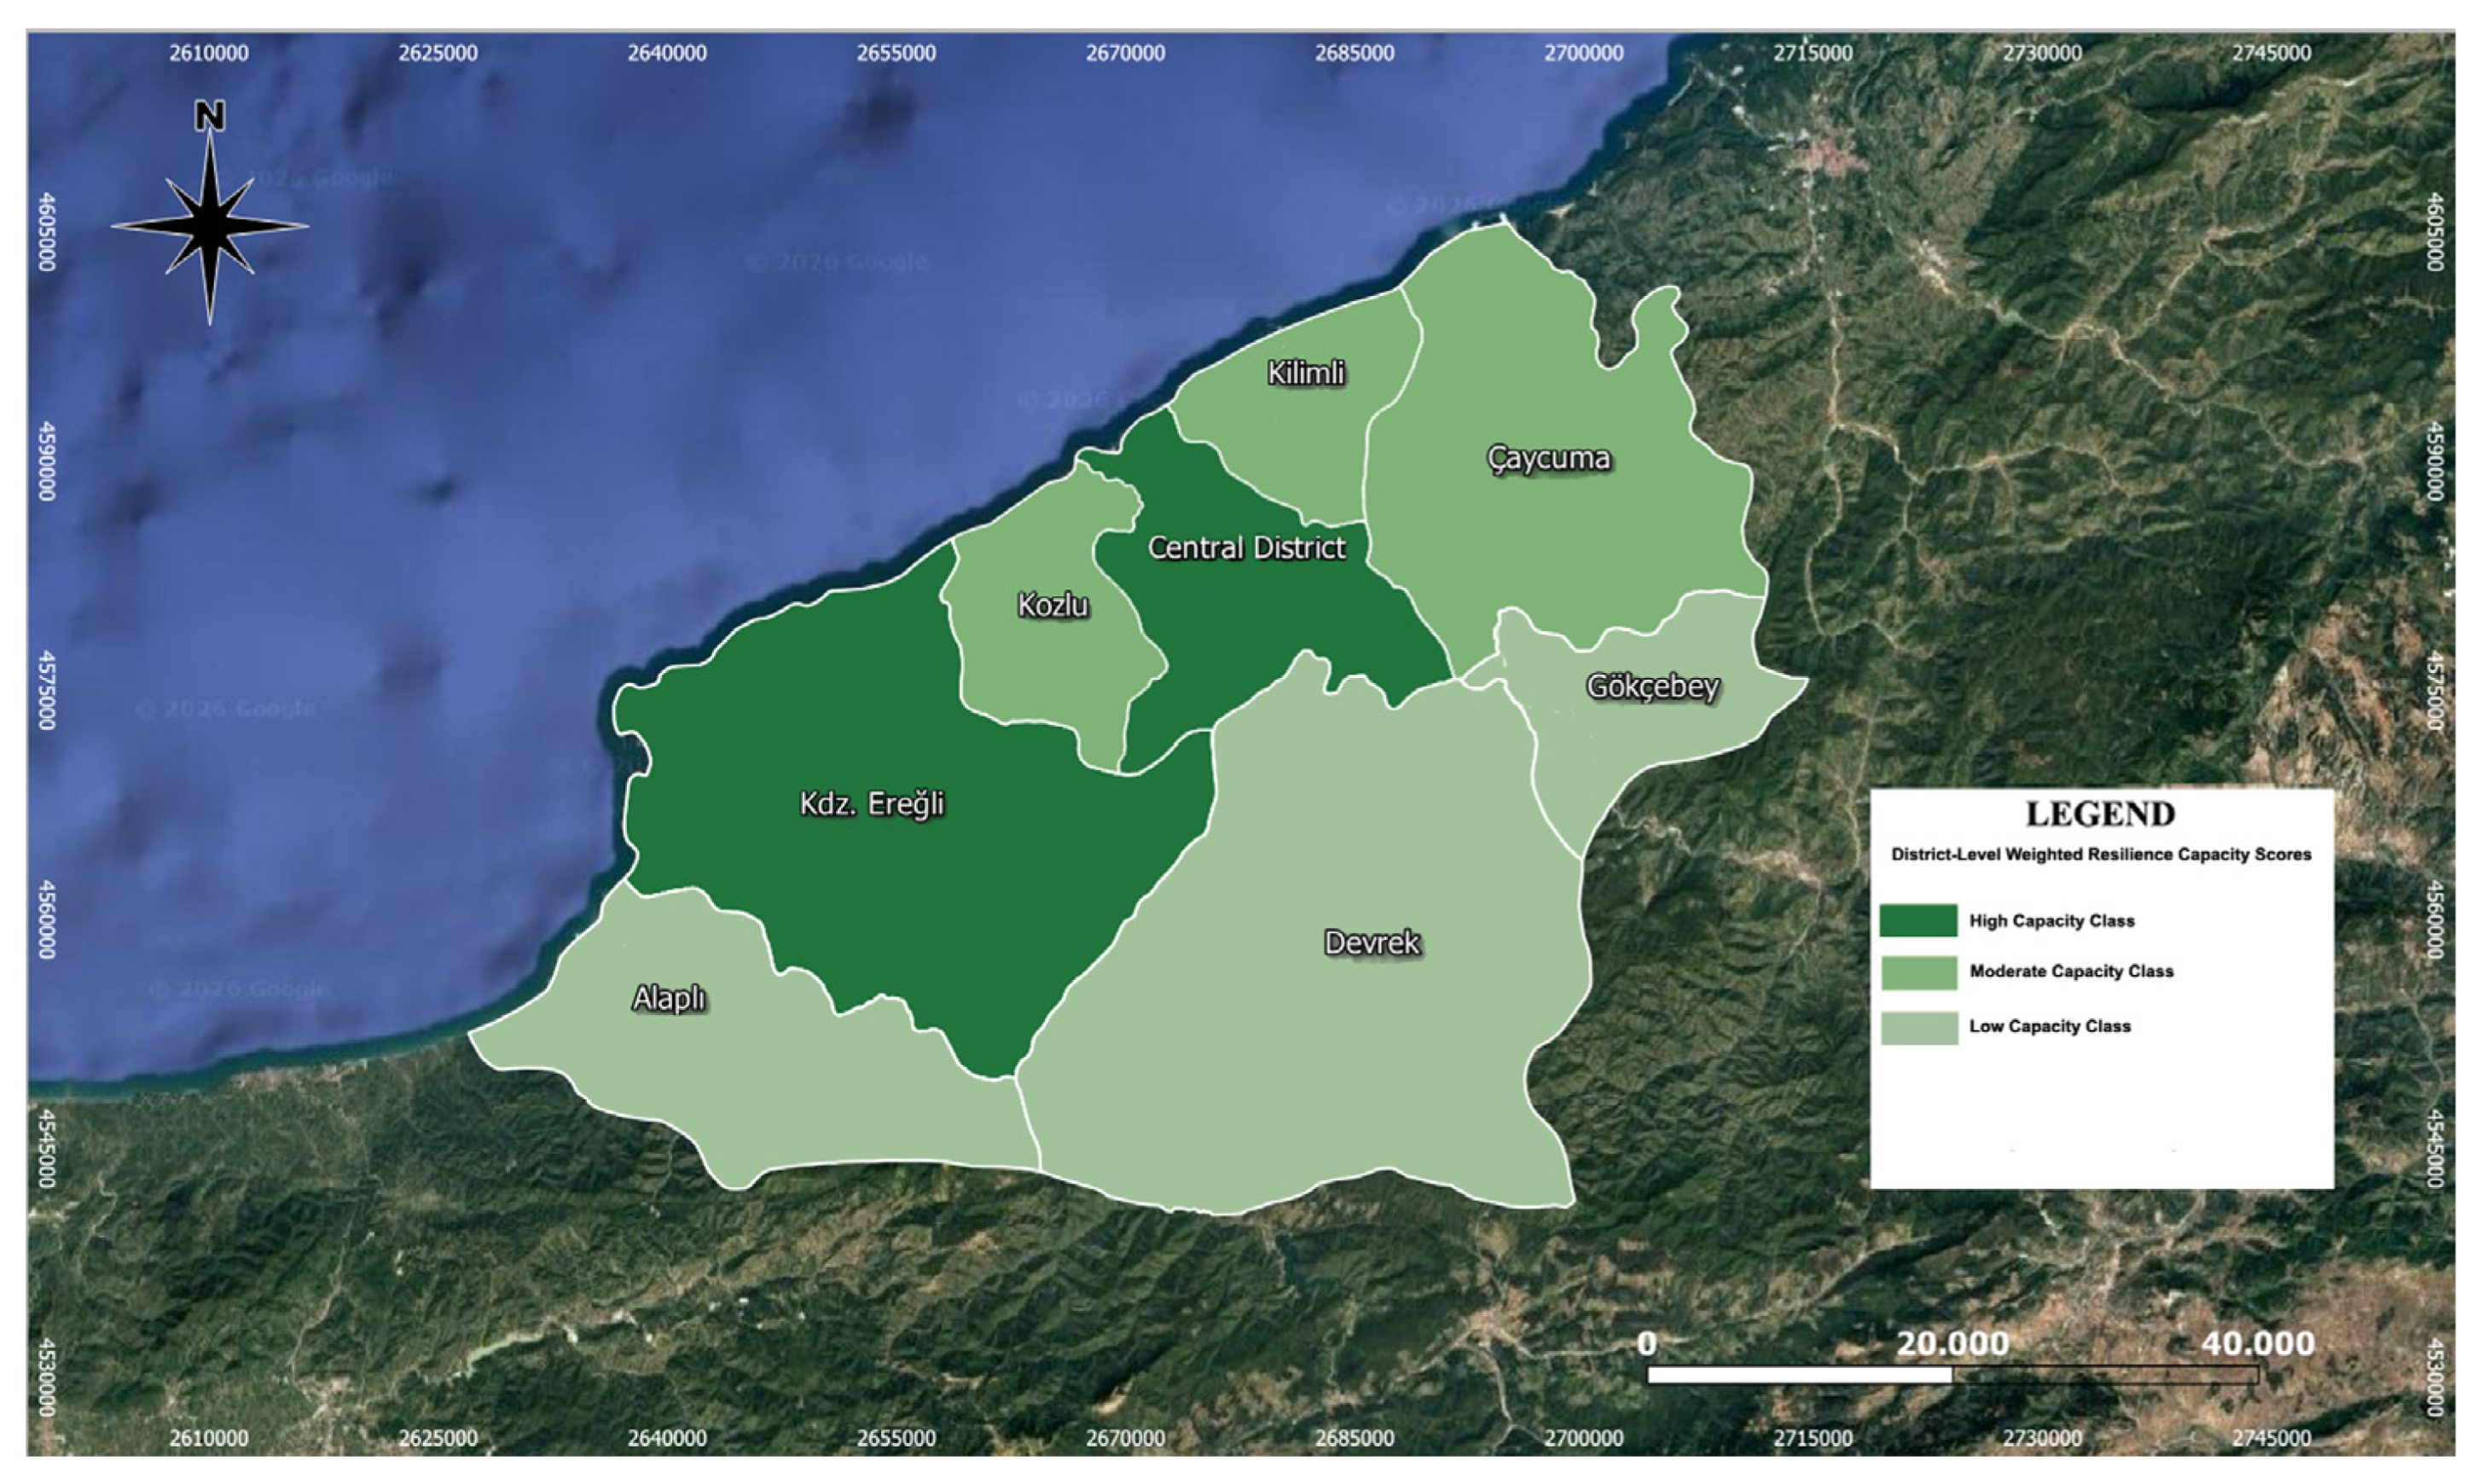
The weighted risk and resilience scores calculated at the district level reveal notable differences among the districts of Zonguldak. The spatial distributions of the risk and resilience scores are presented in the
Appendix B. In terms of risk, Devrek was identified as the district with the highest weighted risk score (4.07), followed by Gökçebey (3.82), Karadeniz Ereğli (3.79), and Çaycuma (3.71). In contrast, Central District (2.44), Kilimli (2.58), Alaplı (2.65), and Kozlu (2.79) had lower weighted risk scores. The high-risk profiles of Devrek, Gökçebey, and Çaycuma are particularly associated with their high values for landslide and flood indicators, which received relatively high weights in the AHP analysis.
In terms of resilience capacity, Central District had the highest weighted resilience score (4.90), followed by Karadeniz Ereğli (3.97) and Kozlu (3.50). The high capacity of Central District in terms of healthcare accessibility, road infrastructure quality, and emergency response capacity strengthens its overall resilience profile. In contrast, Gökçebey (1.48), Alaplı (2.05), and Devrek (2.29) were identified as the districts with the lowest weighted resilience scores. This distribution indicates that the districts differ considerably not only in their risk levels but also in their existing infrastructure and response capacities.
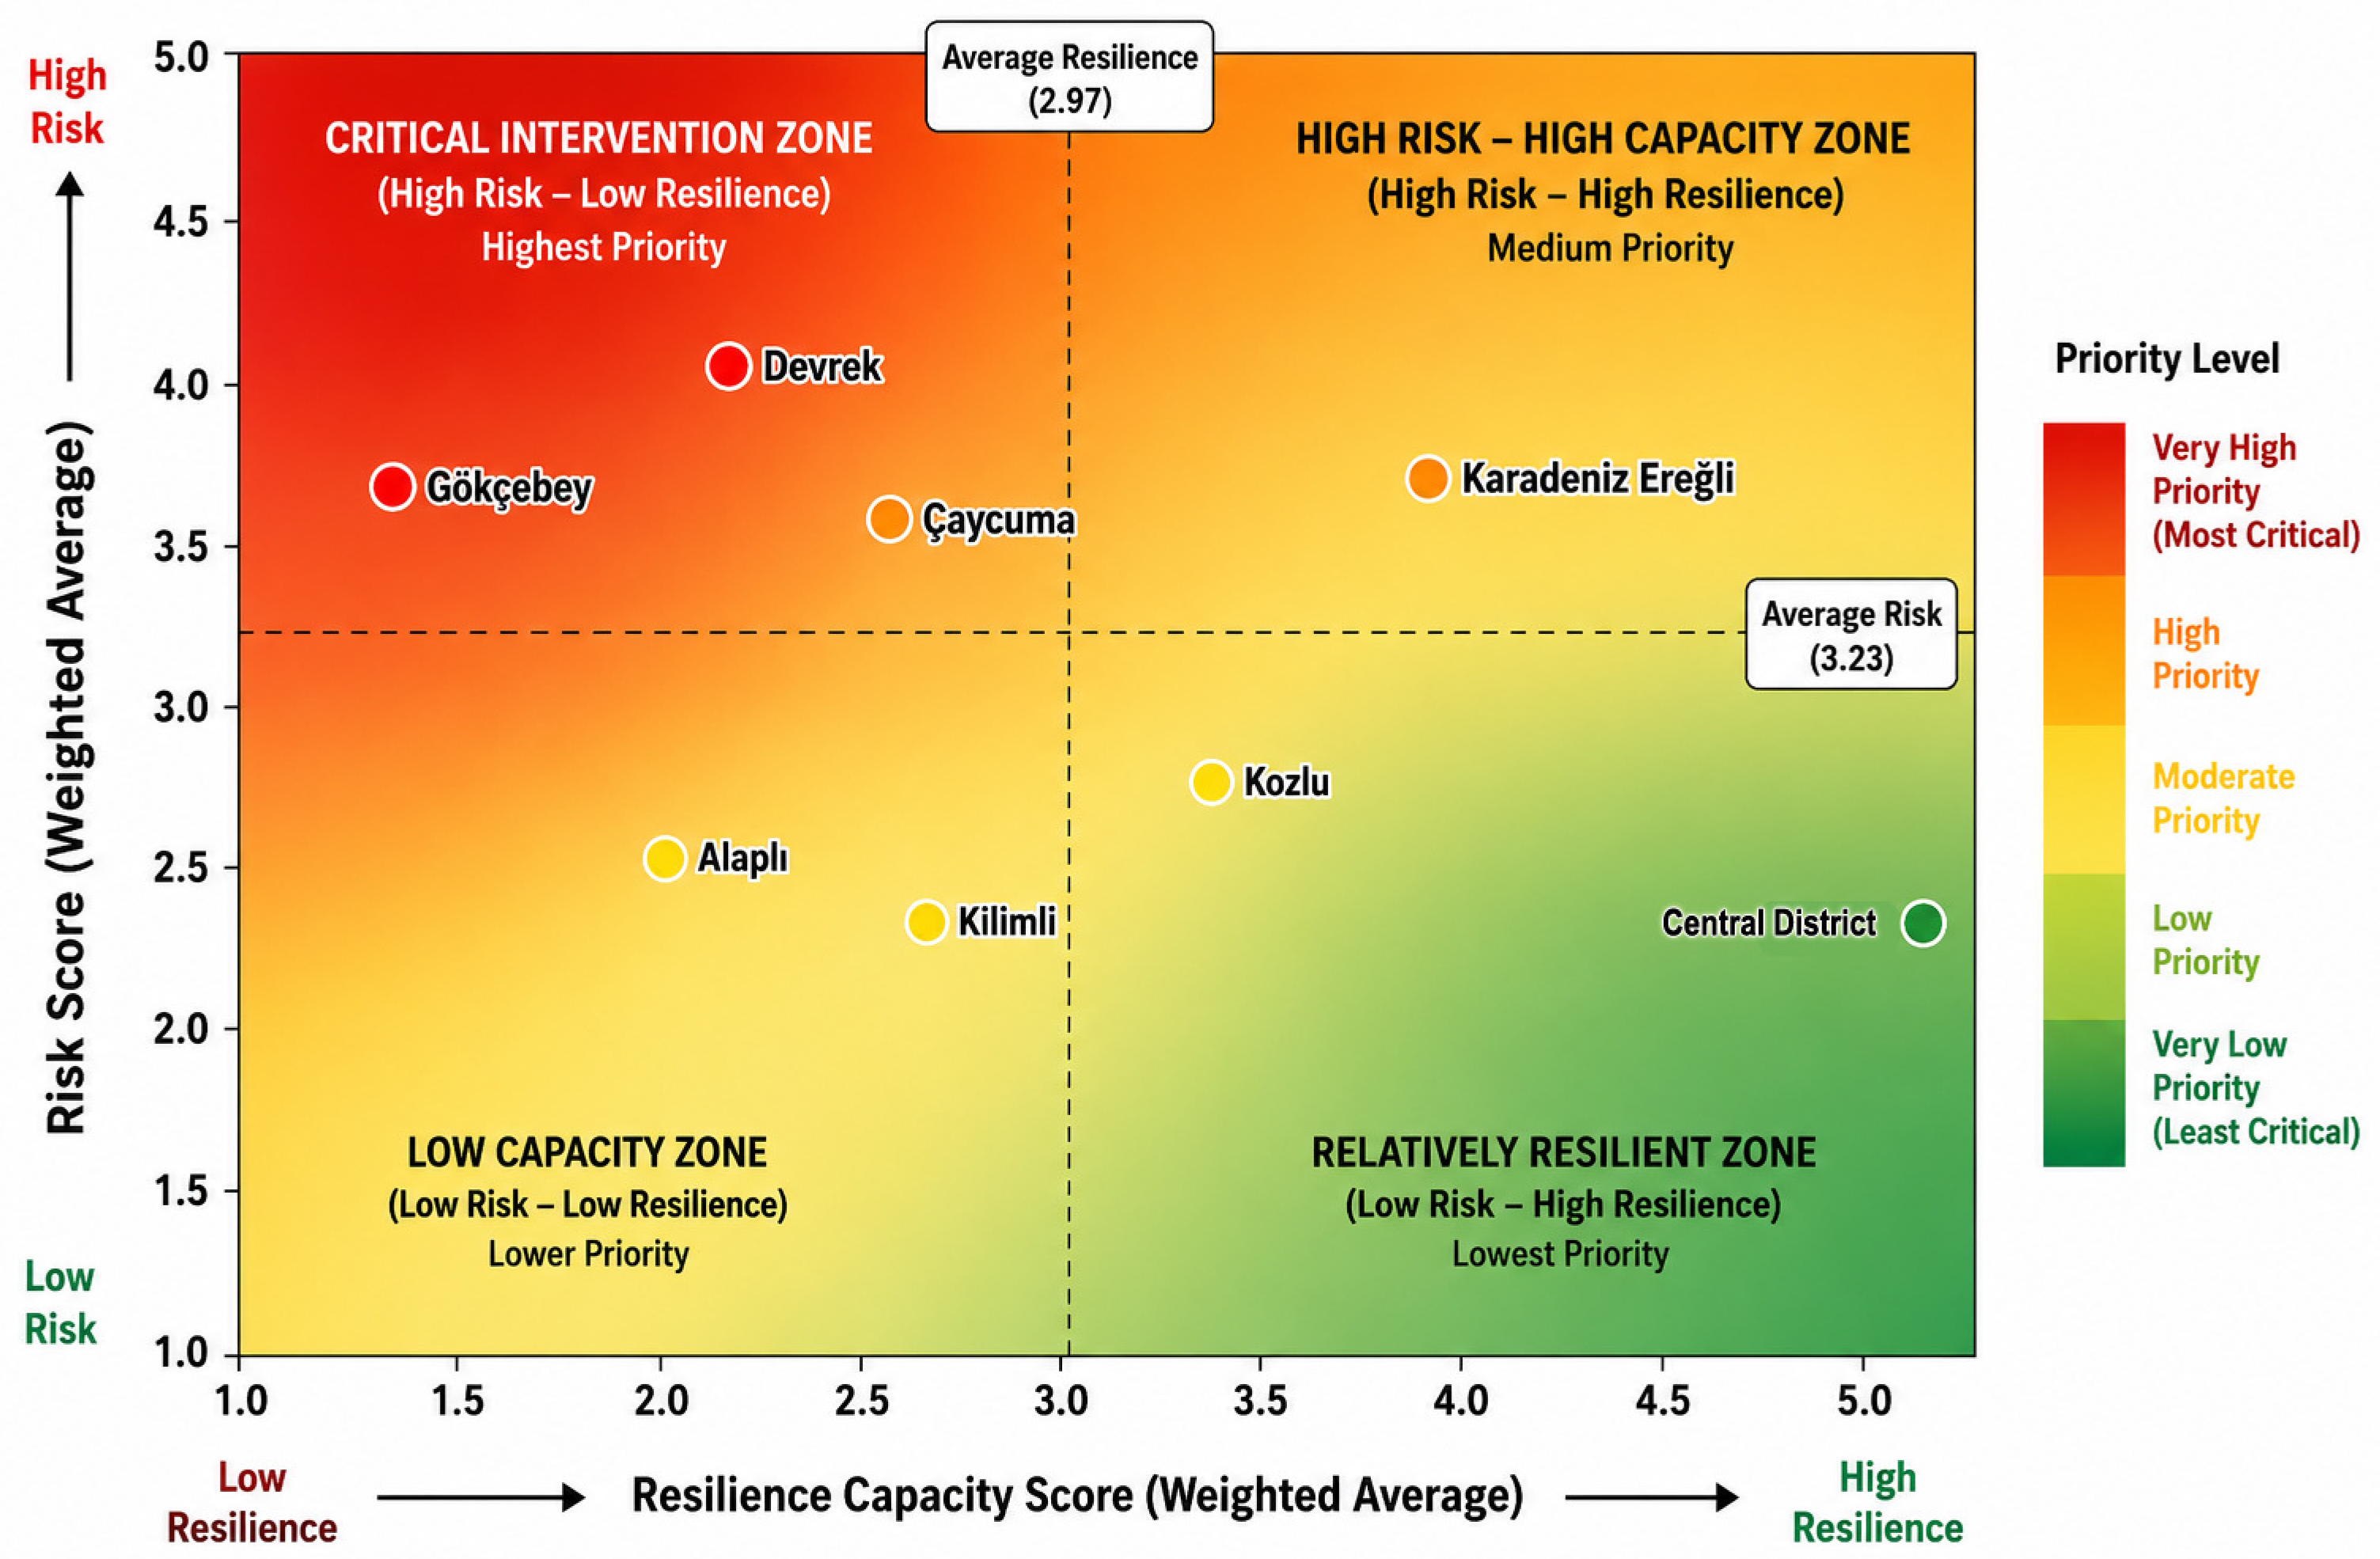
Figure 7 shows the relative positions of the districts according to their weighted risk and resilience scores. The average risk score across the districts was calculated as 3.23, while the average resilience score was 2.97, and these values were used as reference points to distinguish the four assessment zones of the matrix. Devrek, Gökçebey, and Çaycuma are located in the critical intervention zone, characterized by the combination of high risk and low resilience. In these districts, the coexistence of high-risk conditions and relatively limited resilience capacity increases the importance of disaster risk reduction and capacity-building interventions.
Despite its high risk level, Karadeniz Ereğli is positioned in the high-risk–high-capacity zone due to its strong resilience capacity. This indicates that a high risk level alone does not necessarily imply a high intervention priority and that existing resilience capacity plays a balancing role in the assessment of risk conditions. In contrast, Central District and Kozlu are positioned in the relatively resilient zone, with below-average risk and above-average resilience values. Central District, in particular, exhibits the most advantageous profile among the districts, combining a low risk score with the highest resilience capacity.
Kilimli and Alaplı are positioned in the low-risk–low-capacity zone because, despite having below-average risk levels, their resilience capacities also remain below the average. This finding demonstrates that a relatively low level of risk does not necessarily imply strong disaster resilience. Overall, the risk–resilience matrix highlights the importance of evaluating district-level disaster risk reduction needs not solely on the basis of hazard levels, but together with existing resilience capacities.
3.3. VIKOR Results and District Prioritization
Using the global criterion weights obtained from AHP and the five-level district-level indicator values, VIKOR analysis was applied to determine the relative intervention priorities of the districts for disaster risk reduction. The criterion directions were defined such that higher values for risk indicators and lower values for resilience indicators represented a greater need for intervention. In the baseline model, the parameter
v, which represents the balance between group utility and individual regret, was set to 0.50. The S, R, and Q values calculated for each district, together with the resulting intervention priority rankings, are presented in
Table 5.
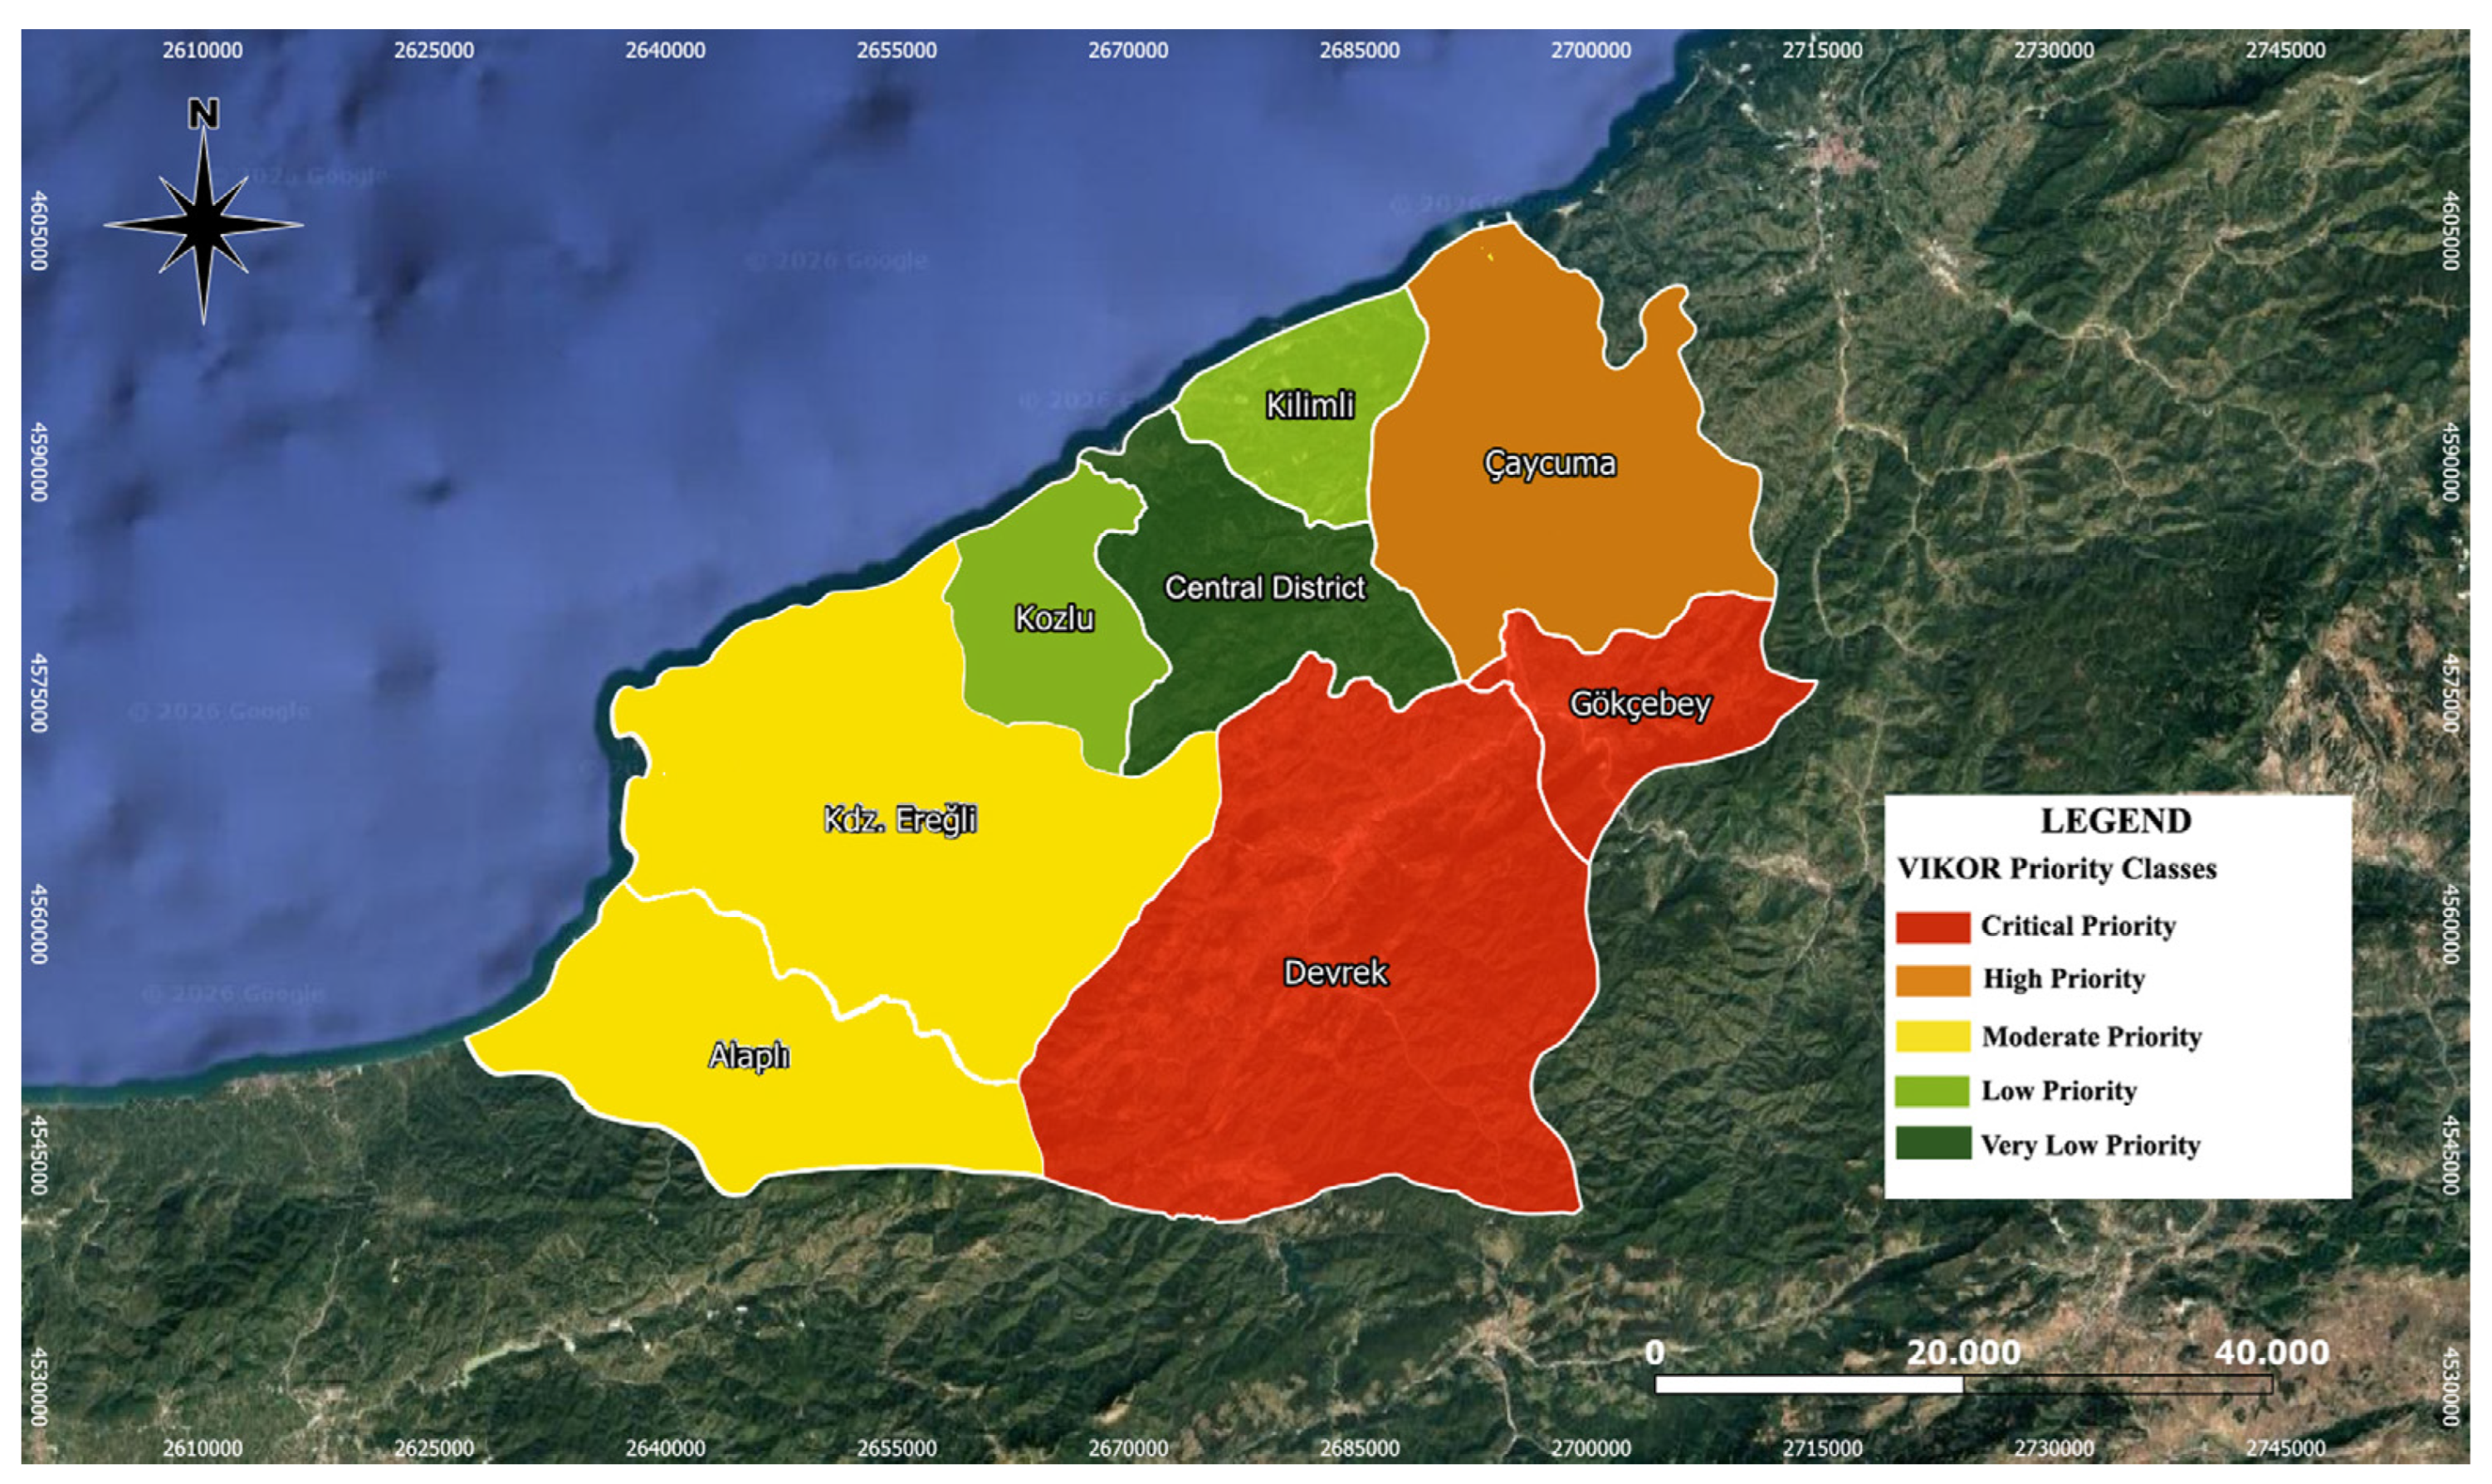
According to the VIKOR results, Gökçebey (Q = 0.0000) and Devrek (Q = 0.0869) were identified as the two districts with the highest intervention priorities. In Gökçebey, the combination of high landslide, flood, and extreme rainfall risks with low resilience capacity places the district at the top of the ranking. Similarly, in Devrek, high landslide, flood, and earthquake risks combined with relatively limited resilience capacity contributed to its second-place ranking. Consistent with the overall pattern observed in the risk–resilience profile, these results indicate that intervention needs increase in districts where high-risk conditions coincide with limited local capacity.
Çaycuma (Q = 0.3965) and Alaplı (Q = 0.5419) ranked third and fourth, respectively. In Çaycuma, particularly high landslide and flood risks increase the need for intervention. Although Alaplı has a relatively more favorable overall risk profile, limitations in its resilience capacity place the district fourth in the ranking. This finding demonstrates that the VIKOR ranking does not merely reflect overall risk levels but results from the joint consideration of risk conditions and the capacity to counterbalance them.
Karadeniz Ereğli (Q = 0.5828) and Kozlu (Q = 0.6390) ranked fifth and sixth, respectively. Despite the relatively high overall risk level of Karadeniz Ereğli, its comparatively strong position in resilience components such as healthcare accessibility, transportation infrastructure, and emergency response capacity reduces its intervention priority. Similarly, Kozlu’s resilience capacity partly offsets the influence of its risk conditions on intervention priority. This result demonstrates that high disaster risk alone does not necessarily imply high intervention priority and that existing resilience capacity plays an important role in determining the relative positions of districts.
Kilimli (Q = 0.7520) ranked seventh, while Central District (Q = 1.0000) was identified as the district with the lowest relative intervention priority. Central District’s strong profile, particularly in terms of healthcare accessibility, road infrastructure, and emergency response capacity, reduces its overall intervention need despite high values for some risk indicators. This differentiation among the districts highlights the importance of incorporating existing resilience capacities into the decision-making process rather than evaluating hazard levels alone in disaster risk-reduction policies.
Figure 8 illustrates the spatial distribution of the relative intervention priorities determined by the VIKOR analysis. For the map visualization, the Q values were classified into five equal intervals within the 0–1 range. Gökçebey and Devrek emerge as the districts with the highest intervention needs, followed by Çaycuma and Alaplı. Karadeniz Ereğli and Kozlu occupy intermediate positions, whereas Kilimli and particularly Central District show lower relative intervention priorities. The resulting spatial pattern highlights the importance of considering not only hazard intensity but also the existing resilience capacities of districts when allocating disaster risk reduction resources.
Sensitivity Analysis
A two-stage sensitivity analysis was conducted to assess the stability of the intervention priorities obtained through VIKOR against reasonable changes in the model assumptions. In the first stage, the v parameter determining the balance between group utility and individual regret was varied. In the second stage, the effects of changes in the global criterion weights obtained from AHP on district rankings were examined.
In the first stage, the compromise parameter, set at
v = 0.50 in the baseline model, was recalculated for
v = 0.00, 0.25, 0.50, 0.75, and 1.00. When
v = 0.00, the ranking depends entirely on the individual regret measure R, whereas when
v = 1.00, it depends entirely on the overall group utility measure S. Intermediate values represent different levels of compromise between these two decision approaches. The results are presented in
Table 6.
The sensitivity analysis indicates that the model is particularly stable in identifying the districts with the highest intervention priorities. Gökçebey remained first, Devrek second, and Çaycuma third under all v scenarios. Thus, the top three intervention priorities identified in the baseline model were unaffected by changes in the relative importance assigned to group utility and individual regret. This finding indicates that the VIKOR results are robust to changes in the v parameter, particularly with respect to identifying the districts to which resources should be directed as a priority.
In contrast, some ranking changes were observed within the intermediate- and lower-priority groups. Alaplı varied between fourth and sixth place, Karadeniz Ereğli between fourth and sixth, Kozlu between fifth and seventh, and Kilimli between fifth and seventh. Central District remained last under all scenarios except at v = 0.00, where it shared seventh place with Kilimli. These variations indicate that the relative positions of intermediate- and lower-priority districts are more sensitive to the importance assigned by the decision-maker to overall group utility versus maximum individual regret. Nevertheless, the unchanged positions of the three highest-priority districts indicate that the fundamental decision pattern of the model remains stable.
In the second stage of the sensitivity analysis, the dependence of the results on the criterion weights determined through AHP was evaluated. For this purpose, each of the thirteen global criterion weights was independently increased and decreased by 10%. Each modified weight set was then renormalized to sum to 1, and the VIKOR analysis was repeated using
v = 0.50. This procedure generated a total of 26 alternative weighting scenarios. The best and worst ranks attained by each district across these scenarios are presented in
Table 7.
The sensitivity analysis of the AHP weights also indicates that the overall intervention priority structure was largely preserved. Gökçebey, Devrek, and Çaycuma remained first, second, and third, respectively, across all 26 scenarios. Similarly, Kilimli retained seventh place and Central District remained eighth in every scenario. These results indicate that the positions of the districts at the upper and lower ends of the ranking were unaffected by reasonable variations in the criterion weights.
Ranking changes occurred only within the intermediate-priority group. Alaplı varied between fourth and fifth place, Karadeniz Ereğli between fourth and sixth, and Kozlu between fifth and sixth. However, these changes did not alter the overall structure of intervention priorities or the identification of the highest-priority districts. Therefore, ±10% changes in the criterion weights appear to have only a limited effect on the fundamental decision pattern of the model.
When the two sensitivity analyses are considered together, the identification of Gökçebey and Devrek as the districts with the highest intervention priorities is robust to changes in both the VIKOR compromise parameter and the AHP criterion weights. Çaycuma also retained its third-place position across all tested v values and weighting scenarios. In contrast, the relative ordering of districts within the intermediate-priority group shows some sensitivity to the decision parameters. Overall, the results indicate that the model is robust in identifying priority intervention areas, although the exact rankings of intermediate-priority districts with relatively similar performance may vary to a limited extent depending on the decision parameters.
3.4. Institutional Responsibility Mapping in Disaster Risk Governance
The institutional dimension of disaster risk governance was assessed by visualizing the relationships among risk types, responsible institutions, and district-level intervention priorities. For this purpose, the Sankey diagram links the seven risk indicators considered in the study, the institutions with duties and responsibilities for managing these risks, and the district priorities identified through the VIKOR analysis within a common visual structure (
Figure 9). This makes it possible to jointly trace which institutional areas of responsibility intersect with different risk types and how these responsibilities are associated with districts in terms of intervention priorities.
The responsibility mapping indicates that the management of disaster risks in Zonguldak involves the mandates of multiple institutions. In particular, landslide, flood, and earthquake risks intersect with the responsibilities of different institutions, including AFAD, DSİ, MTA, and local governments. For technological and environmental risks such as mining accidents, industrial accidents, and air pollution, TTK, MAPEG, the Ministry of Industry and Technology, the Ministry of Environment, Urbanization and Climate Change, and local governments are particularly prominent. This structure demonstrates that institutional responsibilities for disaster risk management are not concentrated within a single actor and that different institutions become involved depending on the type of risk.
In the diagram, the thickness of the flows from risk types to institutions represents the weights of the corresponding risk indicators obtained through AHP. The flows from institutions to district priorities visualize the relationship between the relevant institutional responsibilities and the intervention priorities determined by VIKOR. Therefore, these flows do not represent the frequency or intensity of empirically measured interactions among institutions, but rather the institutional duties and responsibility relationships defined within the scope of this study.
In particular, the fact that the prominent risks in Gökçebey and Devrek, identified as the two districts with the highest intervention priorities, fall within the mandates of multiple institutions points to the need for inter-institutional coordination in risk reduction processes. The persistence of the priority positions of these two districts in the sensitivity analyses further supports the importance of considering institutional responsibilities jointly in these areas. However, the present analysis does not measure actual levels of cooperation, information exchange, or coordination among institutions. By linking the AHP–VIKOR-based prioritization results with institutional mandates, this visualization makes explicit which institutional responsibilities intersect with priority risks and intervention areas.
Particularly for developing countries such as Türkiye, the management of financial, human, and other resources is of critical importance in disaster preparedness and response processes. Therefore, identifying the institutions and organizations responsible alongside the spatial distribution of risks and resilience capacities across settlements can facilitate the rapid and efficient implementation of strategies for allocating resources both before and after disasters.
4. Conclusions and Discussion
This study was based on the premise that assessing multiple disaster risks solely in terms of hazard levels may not be sufficient to explain intervention priorities and therefore addressed disaster risk, urban resilience capacity, and institutional responsibilities within an integrated spatial decision-support framework. The application conducted across the eight districts of Zonguldak demonstrates that the relationship between risk levels and local capacities creates a fundamental differentiation in determining intervention priorities. In this respect, the main conclusion of the study is that, in disaster-risk-reduction-policies, the question of “where risk is high” should be considered together with the question of “to what extent the local system is capable of coping with that risk.”
The AHP results identified landslides, floods, and earthquakes as the most highly weighted risks within Zonguldak’s multi-hazard structure, while emergency response capacity and healthcare accessibility emerged as the key criteria within the resilience dimension. However, the district-level VIKOR results showed that a high level of risk does not necessarily correspond to a high intervention priority. Gökçebey and Devrek ranked first and second because significant hazards in these districts coincide with limited resilience capacity. In contrast, districts with stronger infrastructure and service capacities possess greater capacity to offset the effects of risks, thereby reducing their relative intervention priorities. This finding indicates that disaster risk-reduction policies should focus not only on reducing hazards but also on strengthening the continuity of healthcare services, emergency response, transportation, and essential infrastructure systems. This finding is also supported by the urban resilience literature, which considers the continuity of critical infrastructure and essential services among the fundamental components of disaster preparedness, response, and recovery capacity [
1,
23,
43,
44,
60].
The findings also highlight the importance of assessing disaster risk within a structure jointly shaped by natural, technological, and environmental hazards. In the case of Zonguldak, landslides, floods, earthquakes, and extreme rainfall constitute the natural hazard dimension, while mining and industrial accidents represent technological risks and air pollution represents environmental pressure. This diversity demonstrates the limitations of single-hazard assessments, particularly in regions where mining and industrial activities are concentrated within the same spatial system as natural hazards. Recent multi-hazard research similarly emphasizes the need for integrated approaches that recognize that different hazards may coexist spatially and temporally and may affect shared vulnerabilities, rather than treating disasters as independent events [
6,
11,
71]. Therefore, approaching multi-hazard assessment not merely as the ranking of different hazards within the same analysis, but as an evaluation of their combined pressure on local resilience capacity, provides a more functional framework for planning.
Recent applied studies on disaster risk and urban resilience have demonstrated that multi-criteria methods provide important opportunities for determining the relative importance of hazards, quantitatively assessing urban resilience capacity, and integrating the spatial effects of multiple hazards [
25,
60,
72]. However, these approaches generally focus on assessing risk, resilience, or a particular type of hazard. The framework proposed in this study, by contrast, evaluates natural, technological, and environmental risks together with local resilience capacity, translates them into spatial intervention priorities, and links the resulting priorities to the duties and responsibilities of relevant institutions. The decision-support process therefore goes beyond determining levels of risk or resilience by making visible, within the same analytical structure, both where intervention should be prioritized and which institutional responsibilities are involved in those interventions. In this respect, the study proposes a more integrated decision-support approach extending from risk assessment to implementation and governance.
Institutional responsibility mapping complements the governance dimension of this approach. The intersections between risk types and institutional mandates demonstrate that disaster risk reduction, particularly in high-priority districts, cannot be addressed as the responsibility of a single institution. The responsibilities of AFAD, municipalities, DSİ, MTA, MGM, and relevant sectoral institutions across different risk types highlight the importance of developing risk reduction policies within a framework that considers inter-institutional coordination. This approach is also consistent with current perspectives emphasizing that disaster risk governance should be understood as a multi-actor process requiring coordination among different institutions, sectors, and levels of government [
23,
72]. The study provides a responsibility mapping that makes visible the risk and intervention areas in which institutional responsibilities intersect. In future research, obtaining data on actual inter-institutional interactions could enable this structure to be extended through social network analysis and allow governance capacity to be further assessed using network measures such as centrality, density, or betweenness.
The sensitivity analyses conducted to assess the dependence of the prioritization results on model assumptions showed that the fundamental decision structure was generally stable. Under different values of the VIKOR compromise parameter, Gökçebey and Devrek retained the first and second intervention priorities, respectively, while changes occurred primarily among medium- and low-priority districts with relatively similar performance. Similarly, in scenarios in which the global AHP weights were individually varied by ±10% and subsequently renormalized, the overall ranking remained largely stable, with notable variability occurring mainly among alternatives with similar results. This indicates that the identification of the districts with the highest intervention priorities is not excessively dependent on a single v value or a fixed combination of weights. Nevertheless, minor rank differences among districts with similar performance demonstrate that decision-support outputs should be interpreted as relative priorities supporting planning and resource allocation rather than as a definitive and immutable hierarchy.
Evaluating the model outputs within the local context is also important for interpreting the results. The identification of landslides, floods, and other hydro-meteorological hazards among the major disaster concerns in Zonguldak’s official disaster risk documents and historical disaster records is generally consistent with the high weights assigned to these risks in the model [
38]. However, this consistency should not be interpreted as an independent statistical validation of the model. Rather, official records and local disaster patterns provide a contextual comparison for assessing the extent to which the spatial priorities generated by the decision model correspond to the known risk structure of the study area. This enables the results to be interpreted not solely through mathematical rankings but also in relation to the observed disaster characteristics of the study area.
The study has several limitations. Because the indicator set was developed based on Zonguldak’s multi-hazard profile and the availability of district-level data, it does not represent all dimensions of disaster risk and resilience. In particular, socioeconomic and societal indicators such as income, age structure, educational level, social vulnerability, community cohesion, and household preparedness could not be incorporated into the model because of the limited availability of up-to-date and comparable district-level data. In addition, differences in the temporal coverage, spatial resolution, and production methods of datasets generated by different institutions impose certain limitations on comparability. The use of proxy variables rather than direct measurements for some indicators may also introduce additional uncertainty.
Transforming heterogeneous data into a common five-level ordinal scale enables different data types to be integrated within the same decision model, but may result in the loss of some detail contained in continuous data and may make the results sensitive to the classification thresholds used. Similarly, although the AHP comparisons were developed based on the literature, official reports, and the multi-hazard characteristics of the study area, different expert groups or geographical contexts may produce different weighting structures. Therefore, the resulting values should not be interpreted as absolute measures of disaster risk or resilience, but rather as decision-support outputs indicating the relative positions of the districts examined within the same data and decision structure.
This limitation also defines how the framework can be transferred to other study areas. The transferability of the proposed approach does not imply directly applying the same indicators, classification thresholds, and AHP weights used for Zonguldak to another region. Rather, what is transferable is the analytical workflow consisting of maintaining the distinction between risk and resilience, defining criterion directions, weighting the criteria through AHP, determining intervention priorities through VIKOR, and linking the results to institutional responsibilities. The indicator set and weighting structure should therefore be redefined according to the local hazard profile, data availability, and institutional conditions. This feature constitutes the modular structure of the framework, allowing it to be applied at different administrative scales and within different multi-hazard contexts.
In conclusion, this study presents an applicable spatial decision-support approach in which hazard levels, local resilience capacity, and institutional responsibilities can be considered jointly when determining disaster risk reduction priorities. The Zonguldak application demonstrates that identifying areas where high risk coincides with limited resilience capacity can provide more informative results for intervention and resource allocation than assessments based solely on hazard levels. This approach moves disaster risk reduction beyond merely mapping hazards or ranking districts and transforms it into a planning framework that jointly addresses where risk is concentrated, where capacity remains insufficient, and where institutional responsibilities intersect. Future research incorporating social vulnerability and community capacity indicators, using disaster data with higher spatial and temporal resolution, and examining actual inter-institutional interactions through network data could further strengthen both the analytical scope of the framework and its explanatory capacity for disaster risk governance.