Article

Spatial Heterogeneity of Romanian Agricultural Landscapes (2000–2024): Intensification, Polarization, and Agroecosystem Typologies

Faculty of Economics and Law, George Emil Palade University of Medicine, Pharmacy, Science, and Technology of Targu-Mures, Gheorghe Marinescu Street 38, 540139 Târgu Mures, Romania
Land 2026, 15(8), 1412; https://doi.org/10.3390/land15081412
Submission received: 3 July 2026 / Revised: 30 July 2026 / Accepted: 4 August 2026 / Published: 6 August 2026

Abstract

Romanian agricultural landscapes have undergone substantial transformation between 2000 and 2024, driven by agricultural modernization, market integration, and uneven regional development. This study assesses the opportunities and risks associated with these changes within a landscape-scale sustainability framework. Using 24 indicators describing land use, crop structure, productivity, mechanization, irrigation, input use, and socio-economic characteristics, we combined paired-sample t-tests, Principal Component Analysis (PCA), and cluster analysis to examine temporal and spatial patterns of agricultural transformation across Romanian counties. The results reveal significant increases in arable land, mechanization, labour productivity, and cereal yields, accompanied by declining agricultural employment and growing crop specialization. PCA identified six key dimensions of transformation, highlighting increasing differentiation between intensive, productivity-oriented systems and traditional agricultural structures. Cluster analysis revealed nine distinct agricultural typologies and increasing spatial polarization between highly modernized, input-intensive lowland systems and persistent grassland-based mountain agroecosystems. The comparison between 2000 and 2024 indicates stronger specialization, technological intensification, and territorial differentiation of agricultural systems. These changes create opportunities through improved labour productivity and efficiency, while also reflecting increasing landscape simplification and evolving agri-environmental management patterns. The findings emphasize the need for regionally differentiated policies that support agricultural competitiveness, territorial cohesion, and sustainable rural development.

1. Introduction

Agricultural landscapes across Europe have undergone profound transformations over recent decades, driven by economic restructuring, technological progress, and policy changes. In Central and Eastern Europe, these transformations have been particularly significant due to the transition from centrally planned economies to market-based systems, followed by integration into the European Union and the implementation of the Common Agricultural Policy [1]. More recently, these dynamics have also been shaped by the European Green Deal [2], which promotes a transition toward more sustainable and climate-resilient agricultural systems. Together, these processes have reshaped land-use patterns, production systems, and socio-economic structures, leading to increasing complexity, functional differentiation, and spatial heterogeneity of agricultural landscapes, while simultaneously raising new challenges related to environmental sustainability and resource efficiency.
In Romania, these transformations are especially pronounced. The agricultural sector is highly polarized, with many small subsistence farms coexisting alongside a limited number of large commercial enterprises. Although Romania has the largest number of farmers in the EU (around 3.5 million), about 90% of farms are smaller than 5 hectares, indicating strong structural fragmentation [3]. Over time, this structural configuration has evolved under the influence of land restitution, farm fragmentation, technological modernization, and market integration. As a result, Romanian agricultural landscapes exhibit significant heterogeneity, reflecting both historical legacies and contemporary transformation processes [4,5].
Previous research [6,7,8] has extensively documented the transformation of agricultural systems in Central and Eastern Europe, emphasizing processes such as intensification, specialization, land abandonment, and structural adjustment. These studies highlight the role of EU integration and CAP support in driving productivity growth, modernization, and increased market orientation. At the same time, previous research [9,10,11] emphasizes the persistence of regional disparities, with less-favoured areas maintaining traditional or extensive systems, while more competitive regions undergo rapid intensification and consolidation.
Despite these advances, several important research gaps remain. Most existing studies focus on individual dimensions of agricultural change, such as land-use dynamics, productivity, or socio-economic indicators, without integrating these aspects into a unified analytical framework. Furthermore, relatively few studies combine temporal analysis with spatial typologies, limiting the ability to capture both the evolution and the spatial differentiation of agricultural systems. Although spatial heterogeneity and polarization are widely acknowledged, there is a lack of multivariate, data-driven classifications of agricultural systems at sub-national scales, particularly in the case of Romania.
In this context, the main aim of this study is to analyze the temporal and spatial transformation of agricultural landscapes in Romania between 2000 and 2024, with a focus on identifying structural, functional, and socio-economic changes and their regional differentiation. To achieve this aim, the study adopts a multidimensional approach that integrates structural (land use), functional (crop production and productivity), and socio-economic indicators, providing a comprehensive perspective on agricultural transformation processes. Accordingly, the specific objectives of this study are: (i) to assess the long-term net structural changes in Romanian agricultural landscape between 2000 and 2024, highlighting how these changes contributed to increasing spatial differentiation across counties; (ii) to identify the key dimensions underlying these transformations using Principal Component Analysis; and (iii) to develop a typology of agricultural systems through cluster analysis, highlighting spatial differentiation and regional patterns.
The originality of this study lies in the integration of temporal statistical analysis (paired-sample t-tests) with multivariate methods (Principal Component Analysis and cluster analysis). This approach enables not only the identification of significant changes over time but also the detection of underlying dimensions and the classification of agricultural systems into distinct spatial typologies. By comparing the agriculture system configurations in 2000 and 2024, the study provides a long-term comparative perspective on structural change, capturing processes of intensification, specialization, and spatial polarization. Given the use of two observation years, the analysis captures net structural change rather than continuous transformation trajectories or non-linear development pathways.
The study contributes to the European literature on agricultural transformation in three ways. First, it develops an integrated indicator framework that combines land-use structure, agricultural production, technological development, input use, and socio-economic characteristics. Second, it provides a multidimensional assessment of agricultural restructuring and regional differentiation within a post-socialist context. Third, it identifies distinct agroecosystem typologies and highlights increasing spatial polarization between agricultural regions. Although focused on Romania, the proposed analytical framework may be applied to other Central and Eastern European countries undergoing similar processes of agricultural restructuring and modernization.

2. Literature Review

2.1. Agricultural Landscape Transformation: Drivers, Processes, and Spatial Differentiation

Agricultural landscape transformation is a multidimensional and spatially differentiated process shaped by the interaction of socio-political, economic, technological, and institutional drivers, whose effects vary significantly across regional contexts.
The transformation of agricultural landscapes in Central and Eastern Europe, including Romania, has been extensively documented in relation to post-socialist transition, European Union integration, and ongoing processes of intensification and structural adjustment. Following the collapse of centrally planned economies, agricultural systems underwent profound institutional and structural changes, including land restitution, farm fragmentation, and the emergence of dual farming systems combining small-scale subsistence agriculture with large commercial enterprises [7,8,12]. These transformations resulted in highly heterogeneous agricultural landscapes characterized by the coexistence of traditional and modern production systems. Historical legacies of collectivization further contributed to the consolidation of agricultural land and the loss of traditional small-scale landscape mosaics, while the post-socialist transition introduced widespread land abandonment, natural reforestation, and increasingly diverse land-use trajectories [6,12,13,14].
Long-term analyses confirm that agricultural landscapes in Romania have undergone substantial structural and functional transformations over the last century, with significant land-use changes and marked regional differences reflecting evolving socio-economic and policy contexts [5,15]. More broadly, landscape transformation in Eastern Europe is driven by multiple interacting factors—including economic, demographic, technological, institutional, and socio-cultural influences—operating across distinct historical phases, from centralized socialist systems to EU integration [12,14].
At the European level, agricultural land-use change is characterized by the coexistence of intensification and extensification processes [15]. These transformations are driven by a combination of economic, technological, institutional, and location-specific factors and are reflected not only in the expansion or contraction of agricultural land but also in changes in land-use intensity, management practices, and crop specialization [16,17]. Intensification, driven by technological modernization, mechanization, and CAP-related investments, has led to increasing productivity, farm consolidation, and the expansion of large-scale commercial farming systems [7,18,19,20]. However, intensification also involves important trade-offs between land productivity, labour productivity, and labour intensity. While higher productivity and efficiency are often achieved through technological progress and farm consolidation, these processes tend to reduce labour demand, particularly in regions where agriculture plays a key socio-economic role [21,22]. This highlights the need to consider not only economic performance but also social implications when assessing agricultural transformation. Moreover, these processes are unevenly distributed, contributing to strong spatial disparities and polarization between highly productive regions and structurally constrained areas [9,11,23]. In the Romanian context, these disparities are further reinforced by the uneven distribution of rural development support, which tends to favour more developed and urbanized areas despite policy efforts to reduce territorial inequalities [24].
Romania exemplifies these dynamics, displaying a dual agricultural structure and increasing polarization between large commercial farms and numerous small-scale holdings, whose number has declined significantly in recent years [25,26]. Land fragmentation remains a persistent feature even in agriculturally productive regions, reflecting the combined effects of land governance, institutional change, and socio-economic transformation [4]. These structural imbalances are further reflected in significant territorial disparities in agricultural performance, as illustrated by sector-specific studies showing substantial productivity gaps and declining competitiveness compared to Western European systems [27].
At a broader scale, similar transformation processes exhibit strong regional variation. In Mediterranean regions, agricultural restructuring has led to the decline of traditional landscape elements and the coexistence of intensification in lowland areas with abandonment in marginal uplands, generating pronounced spatial differentiation [28,29]. In rapidly urbanizing regions such as eastern China, landscape transformation is driven primarily by urban expansion, leading to agricultural land loss, fragmentation, and increasing landscape isolation [30,31].
Technological developments, particularly mechanization, further reinforce intensification processes through land consolidation, reduction in fragmentation, and increased production efficiency, contributing to more simplified and homogeneous landscape structures [32]. At the same time, policy and institutional frameworks play a decisive role in shaping these processes. Legislative instruments and spatial planning regulations influence land-use decisions and landscape patterns [33], while the Common Agricultural Policy promotes a transition toward “ecological modernization,” combining productivity-oriented restructuring with agri-environmental measures and generating differentiated regional outcomes [34,35].
Despite productivity gains, intensification has often led to landscape simplification and reduced ecological complexity. In this context, diversification strategies are increasingly recognized for improving sustainability and resilience in agricultural systems [36]. Landscape metrics and spatial analysis tools provide valuable insights into land-use intensity, fragmentation, and ecosystem functioning, supporting multi-scale assessments of agroecosystems.
Furthermore, advances in agricultural geography emphasize the importance of multivariate statistical methods, such as principal component analysis (PCA) and cluster analysis, for identifying agroecosystem typologies and capturing the multidimensional nature of agricultural landscapes [6,37,38].
Overall, agricultural landscape transformation is characterized by the coexistence of intensification, abandonment, and fragmentation processes, shaped by technological change, urbanization, and policy interventions. These interacting drivers generate heterogeneous spatial patterns and reinforce regional differentiation and spatial polarization.
This complexity highlights the need for integrated, multivariate, and spatially explicit analytical approaches, providing the conceptual foundation for the empirical analysis presented in this study. Recent research also emphasizes that large-scale agricultural landscapes in Central and Eastern Europe remain highly vulnerable to biodiversity loss and climate change, underscoring the need for agroecological transitions and climate-adaptive practices [39].

2.2. Bibliometric Analysis of Agricultural Landscape Transformation

To complement the literature review and identify major research trends, a bibliometric analysis of the scientific literature on agricultural landscape transformation was conducted. A total of 4486 publications were initially identified in the Web of Science Core Collection using the search query “agricultural landscape transformation”. To ensure analytical consistency and focus on the most relevant contributions, the first 1000 articles ranked by relevance were selected for further analysis. This approach is widely used in bibliometric studies to reduce dataset noise while maintaining representative coverage of influential research. The bibliometric analysis was performed using VOSviewer software (version 1.6.20), a widely used tool for visualizing bibliometric networks. A keyword co-occurrence analysis was conducted to identify the main thematic structures within the research field. Keywords with a minimum occurrence threshold of 10 were included, ensuring that only the most relevant and frequently used terms were retained. The resulting network comprised 362 keywords grouped into five distinct clusters.
Figure 1 illustrates the keyword co-occurrence network derived from the selected publications. The size of nodes reflects keyword frequency, while links indicate co-occurrence relationships. Colors represent distinct thematic clusters.
The analysis reveals a structured and multidimensional research field, organized around three main dimensions: agricultural production and intensification, land-use structure and spatial analysis, and ecological processes and environmental sustainability.
These findings confirm the interdisciplinary nature of agricultural landscape transformation research and provide a robust conceptual basis for the analytical framework adopted in this study.
A more detailed examination highlights five major thematic clusters (Figure 1). The first cluster (red) focuses on agricultural production and intensification processes, characterized by keywords such as production, agricultural systems, sustainability, resilience, technology, and innovation. This cluster reflects the economic and functional transformation of agriculture, emphasizing productivity growth, modernization, and the integration of sustainability considerations.
The second cluster (green) is associated with land-use structure and spatial analysis, including terms such as forest, landscape pattern, land cover, grassland, urbanization, GIS, remote sensing, and landscape metrics. This cluster highlights the importance of spatial approaches and geospatial technologies in analyzing land-use dynamics and agricultural transformation.
The third cluster (blue) captures the ecological and environmental dimension of agricultural landscapes, including keywords such as species, biodiversity, habitat, ecosystem, water, and soil. This cluster reflects the growing integration of ecosystem services and environmental impacts into agricultural research, particularly in the context of sustainability and climate resilience.
A fourth cluster (yellow) relates to rural and cultural landscapes, including terms such as cultural landscape, heritage, and rural systems. This cluster emphasizes the socio-cultural dimension of agricultural landscapes, highlighting the persistence of traditional systems and the role of cultural identity in shaping landscape transformation.
Finally, the fifth cluster (purple) focuses on agroecosystem functioning and efficiency, including keywords such as efficiency, plant, and system performance. This cluster reflects increasing interest in integrated approaches that consider both productivity and environmental performance within agricultural systems.
Overall, the bibliometric analysis demonstrates that agricultural landscape transformation is a complex and interdisciplinary research field, structured around the interaction between production systems, spatial patterns, and ecological processes. These dimensions align closely with the conceptual framework developed in Section 2.1, reinforcing the relevance of integrating structural, functional, and spatial indicators in the analysis of agricultural transformation.
Furthermore, the identified thematic clusters support the analytical approach adopted in this study, which combines multivariate statistical methods to examine processes of intensification, spatial polarization, and agroecosystem differentiation at the landscape scale.
Based on the literature review and bibliometric analysis, the following research hypotheses (H) are formulated:
H1. 
Romanian agricultural landscapes have experienced significant structural and functional transformations over the period 2000–2024, driven by processes of intensification, land-use change, and socio-economic restructuring.
H2. 
Significant spatial heterogeneity exists among Romanian counties, reflected in both common and divergent relationships between structural, functional, and socio-economic variables, leading to distinct agricultural typologies and patterns of spatial polarization.
Despite the growing body of literature on agricultural transformation in Romania and the CEE region, relatively few studies have examined these processes from a spatially explicit and typological perspective over a long-term period. In particular, there is limited research combining landscape-scale indicators, multivariate analysis, and temporal comparison to capture the evolution of agricultural systems.
This study addresses this gap by analyzing the transformation of Romanian agricultural landscapes between 2000 and 2024 using a combined Principal Component Analysis–cluster approach at the county level. By identifying changes in land-use structure, productivity, input use, and socio-economic characteristics, the research provides new insights into processes of intensification, polarization, and agroecosystem differentiation.

3. Materials and Methods

3.1. Variables, Data, and Sample

To achieve the aim of this study and test the formulated research hypotheses, a multidimensional analytical framework was developed to assess the structural and functional transformation of agricultural landscapes in Romania. The analysis integrates indicators related to land-use structure and crop production, agricultural mechanization and irrigation, agricultural input use, and socio-economic and structural characteristics of the agricultural sector, allowing for a comprehensive evaluation of long-term net structural change in agricultural landscape.
The empirical analysis covers two strategically significant reference years, 2000 and 2024, which capture key stages in the transformation of Romanian agriculture: the beginning of the post-socialist restructuring period and the contemporary agricultural landscape shaped by EU accession, market integration, and technological modernization. The analysis is conducted at the level of the 41 Romanian counties (NUTS 3).
Although administrative units, Romanian counties represent relevant analytical entities for landscape studies, as they reflect aggregated agro-ecological systems characterized by distinct land-use patterns, production structures, and socio-economic conditions. This territorial scale enables the identification of spatial disparities, structural heterogeneity, and regional differentiation within the national agricultural system. However, county-level (NUTS 3) units may mask intra-county heterogeneity in agricultural systems and landscape characteristics. Consequently, the analysis is intended to identify broad regional patterns and agricultural typologies rather than homogeneous local agricultural systems.
The dataset was constructed using statistical information provided by national and European sources, including the National Institute of Statistics [40] and Eurostat [41,42,43], ensuring data comparability and temporal consistency. All variables were selected based on data availability, relevance to agricultural transformation processes, and their capacity to capture both structural and functional dimensions of agroecosystems.
To capture the complexity of agricultural landscapes, a total of 24 indicators were grouped into four main categories (Table 1): land-use structure and crop production indicators, reflecting the composition and productivity of agricultural land; agricultural mechanization and irrigation indicators, capturing technological development and infrastructure; agricultural input use indicators, indicating intensity of resource utilization (amount of natural and chemical fertilizers and pesticides used); socio-economic and structural indicators, describing labor, economic performance, and demographic characteristics. These indicators allow for the simultaneous assessment of landscape structure (composition and spatial use), agricultural function (productivity and efficiency), and socio-economic context, providing a robust basis for multivariate statistical analysis.
In addition, several variables incorporated into the analysis correspond to the agri-environmental indicator framework employed by Eurostat and the Romanian National Institute of Statistics. Specifically, indicators related to irrigation practices (I15–I17), fertilizer application (I18–I19), and pesticide use (I20) provide information on the intensity of agricultural resource use and management practices, which are widely recognized as important dimensions of agricultural sustainability. Previous research [44,45,46] indicates that increasing reliance on external inputs, including fertilizers, pesticides, mechanization, and irrigation, is generally associated with agricultural intensification. While such transformations can enhance productivity and production efficiency, they may also increase pressure on natural resources and contribute to environmental challenges such as water contamination, biodiversity decline, landscape simplification, and higher greenhouse-gas emissions Therefore, these indicators provide valuable insights into the environmental pressures associated with agricultural production systems and support the assessment of agri-environmental management patterns across Romanian counties. Nevertheless, they reflect agri-environmental pressures rather than environmental performance itself, as comparable statistical data on biodiversity, ecosystem services, soil quality, or climate resilience were not available for both reference years at the NUTS 3 level.

3.2. Statistical Methods

To examine whether significant changes occurred across the variables presented in Table 1 over the study period (2024 compared to 2000), a comparative analysis was conducted using descriptive statistical measures, including mean, minimum, maximum, standard deviation, skewness, and kurtosis. Furthermore, temporal changes in agricultural performance and rural development indicators were assessed using paired-sample t-tests, which allow for the identification of statistically significant differences between the two time periods.
To identify the main patterns of agricultural transformation and reduce data dimensionality, Principal Component Analysis (PCA) was applied. A total of 21 variables (I1–I14 and I18–I24; see Table 1) were included in the analysis, as complete data were available for all 41 counties and for both reference years.
The three irrigation variables (I15–I17) were excluded from the PCA because substantial missing observations would have significantly reduced the number of counties available for multivariate analysis and compromised the comparability of the results. Since irrigation is an important dimension of agricultural intensification and climate adaptation, particularly in lowland agricultural regions, these indicators were examined separately during the interpretation of cluster characteristics. Consequently, the extracted components and typologies should be interpreted as reflecting the dominant structural, functional, socio-economic, technological, and selected agri-environmental dimensions of agricultural transformation, independently of direct irrigation effects.
To ensure consistency among variables measured on different scales, all indicators were standardized using z-score transformation, resulting in a mean of 0 and a standard deviation of 1 prior to the application of PCA. This procedure minimized the influence of scale differences on the analysis.
PCA is a widely used multivariate technique that reduces a set of correlated variables into a smaller number of uncorrelated components, capturing the maximum amount of variance in the dataset [47,48,49]. Principal components were extracted based on the eigenvalue criterion (λ > 1) and the interpretability of the factor structure. PCA was performed using Varimax rotation with Kaiser normalization to enhance the clarity and interpretability of the resulting components. The number of retained components was determined using multiple criteria, including Cattell’s scree plot, the Kaiser criterion, and the cumulative percentage of explained variance. Only those components accounting for a substantial proportion of the total variance—typically between 70% and 90%—were retained for further analysis [47,48]. Factor loadings were examined to assess the contribution of each variable to the extracted components, facilitating the identification and interpretation of underlying dimensions such as agricultural intensification, structural composition, and spatial differentiation.
Building on the PCA results, cluster analysis was performed to classify Romanian counties into homogeneous groups according to their agricultural characteristics. This approach facilitates the identification of distinct agroecosystem typologies, reflecting different development trajectories, levels of intensification, and structural configurations.
The optimal number of clusters was initially determined using hierarchical cluster analysis based on Ward’s method and Euclidean distance. Subsequently, the clustering solution was refined using the k-means algorithm to improve cluster stability and interpretability [50].
All data processing and statistical analyses were conducted using IBM SPSS Statistics, version 26.0 (IBM Corp., Armonk, NY, USA).

4. Results and Discussion

The results are first examined using paired-sample t-tests to assess significant temporal changes, followed by multivariate analysis (PCA and cluster analysis) to identify underlying dimensions and regional typologies of agricultural systems.

4.1. Assessement of Net Structural Change in Romanian Agricultural Landscapes (2000–2024)

The paired-samples t-test (Table 2) reveals significant long-term changes in the agricultural landscape structure of Romanian counties between 2000 and 2024. Given the use of two observation years, the results characterize net structural change rather than the intermediate trajectories through which these transformations occurred. The share of agricultural land (I1) declined significantly (p = 0.002), reflecting increasing competition from urban and infrastructural uses. In contrast, the share of arable land (I2) increased (p < 0.001), indicating a shift toward more intensive and homogeneous production systems. The share of pastures and meadows (I3) remained stable, highlighting the persistence of grassland-based systems, particularly in mountainous regions. At the same time, the decline in vineyards (I4) and orchards (I5) suggests a contraction of permanent crops and a reduction in traditionally specialized agricultural landscapes.
At the level of crop structure, the shares of potatoes (I8) and vegetables (I9) declined, reflecting the contraction of small-scale and diversified systems. In contrast, the expansion of wheat and rye (I6) highlights the increasing dominance of cereal-based agriculture, while the reduction in maize (I7) suggests ongoing crop restructuring. Overall, these changes indicate a shift toward more simplified and production-oriented agricultural systems, although regional disparities persist. Crop yield results further confirm this trend. Yields of wheat, rye, and maize increased significantly (p < 0.001), reflecting productivity gains associated with intensification. In contrast, potato and vegetable yields remained stable, indicating stagnation in these sectors. This divergence suggests increasing structural polarization, with productivity improvements concentrated in dominant cereal systems.
The t-test results (Table 3) indicate a significant increase in tractor density (I14) (p < 0.001), reflecting advancing mechanization, as well as improved utilization of irrigation infrastructure (I15, p = 0.001). In contrast, the overall share of irrigated land remained largely unchanged (I16, p = 0.988; I17, p = 0.094), indicating stagnation in irrigation expansion. Therefore, these findings suggest partial intensification, characterized by improved mechanization and more efficient use of existing irrigation systems, but limited progress in expanding irrigation capacity.
The t-test results (Table 4) indicate a reconfiguration of input use in Romanian agriculture between 2000 and 2024. While chemical fertilizer (I18) use remained relatively stable, the use of natural fertilizers (I19) and pesticides (I20) declined significantly. Although crop yields remained stable or increased, suggesting improved efficiency, this trend raises potential sustainability concerns, particularly regarding soil quality and long-term fertility. These patterns indicate a shift toward more efficiency-oriented agricultural systems. Based on evidence from previous studies [45,46], the decline in organic inputs and the uneven nature of these changes may increase vulnerability to soil degradation, biodiversity loss, and climate risks. This trend aligns with recent studies highlighting the need to balance productivity gains with sustainability objectives and to promote resource-efficient and resilient agricultural systems [36,39]. Consequently, the transition toward sustainable agriculture remains incomplete and spatially uneven, requiring targeted strategies to ensure long-term environmental resilience.
The t-test results (Table 5) indicate significant socio-economic changes in Romanian agriculture between 2000 and 2024. Labour productivity increased substantially (p < 0.001), reflecting improved efficiency, while the share of employees in agricultural employment also rose, suggesting partial labour formalization. In contrast, the contribution of agriculture to total GVA and employment declined markedly (p < 0.001), indicating a reduced economic role and labour reallocation toward other sectors. Taken together, these trends reflect structural transformation characterized by higher productivity but declining sectoral importance, contributing to increasing regional disparities and spatial polarization.
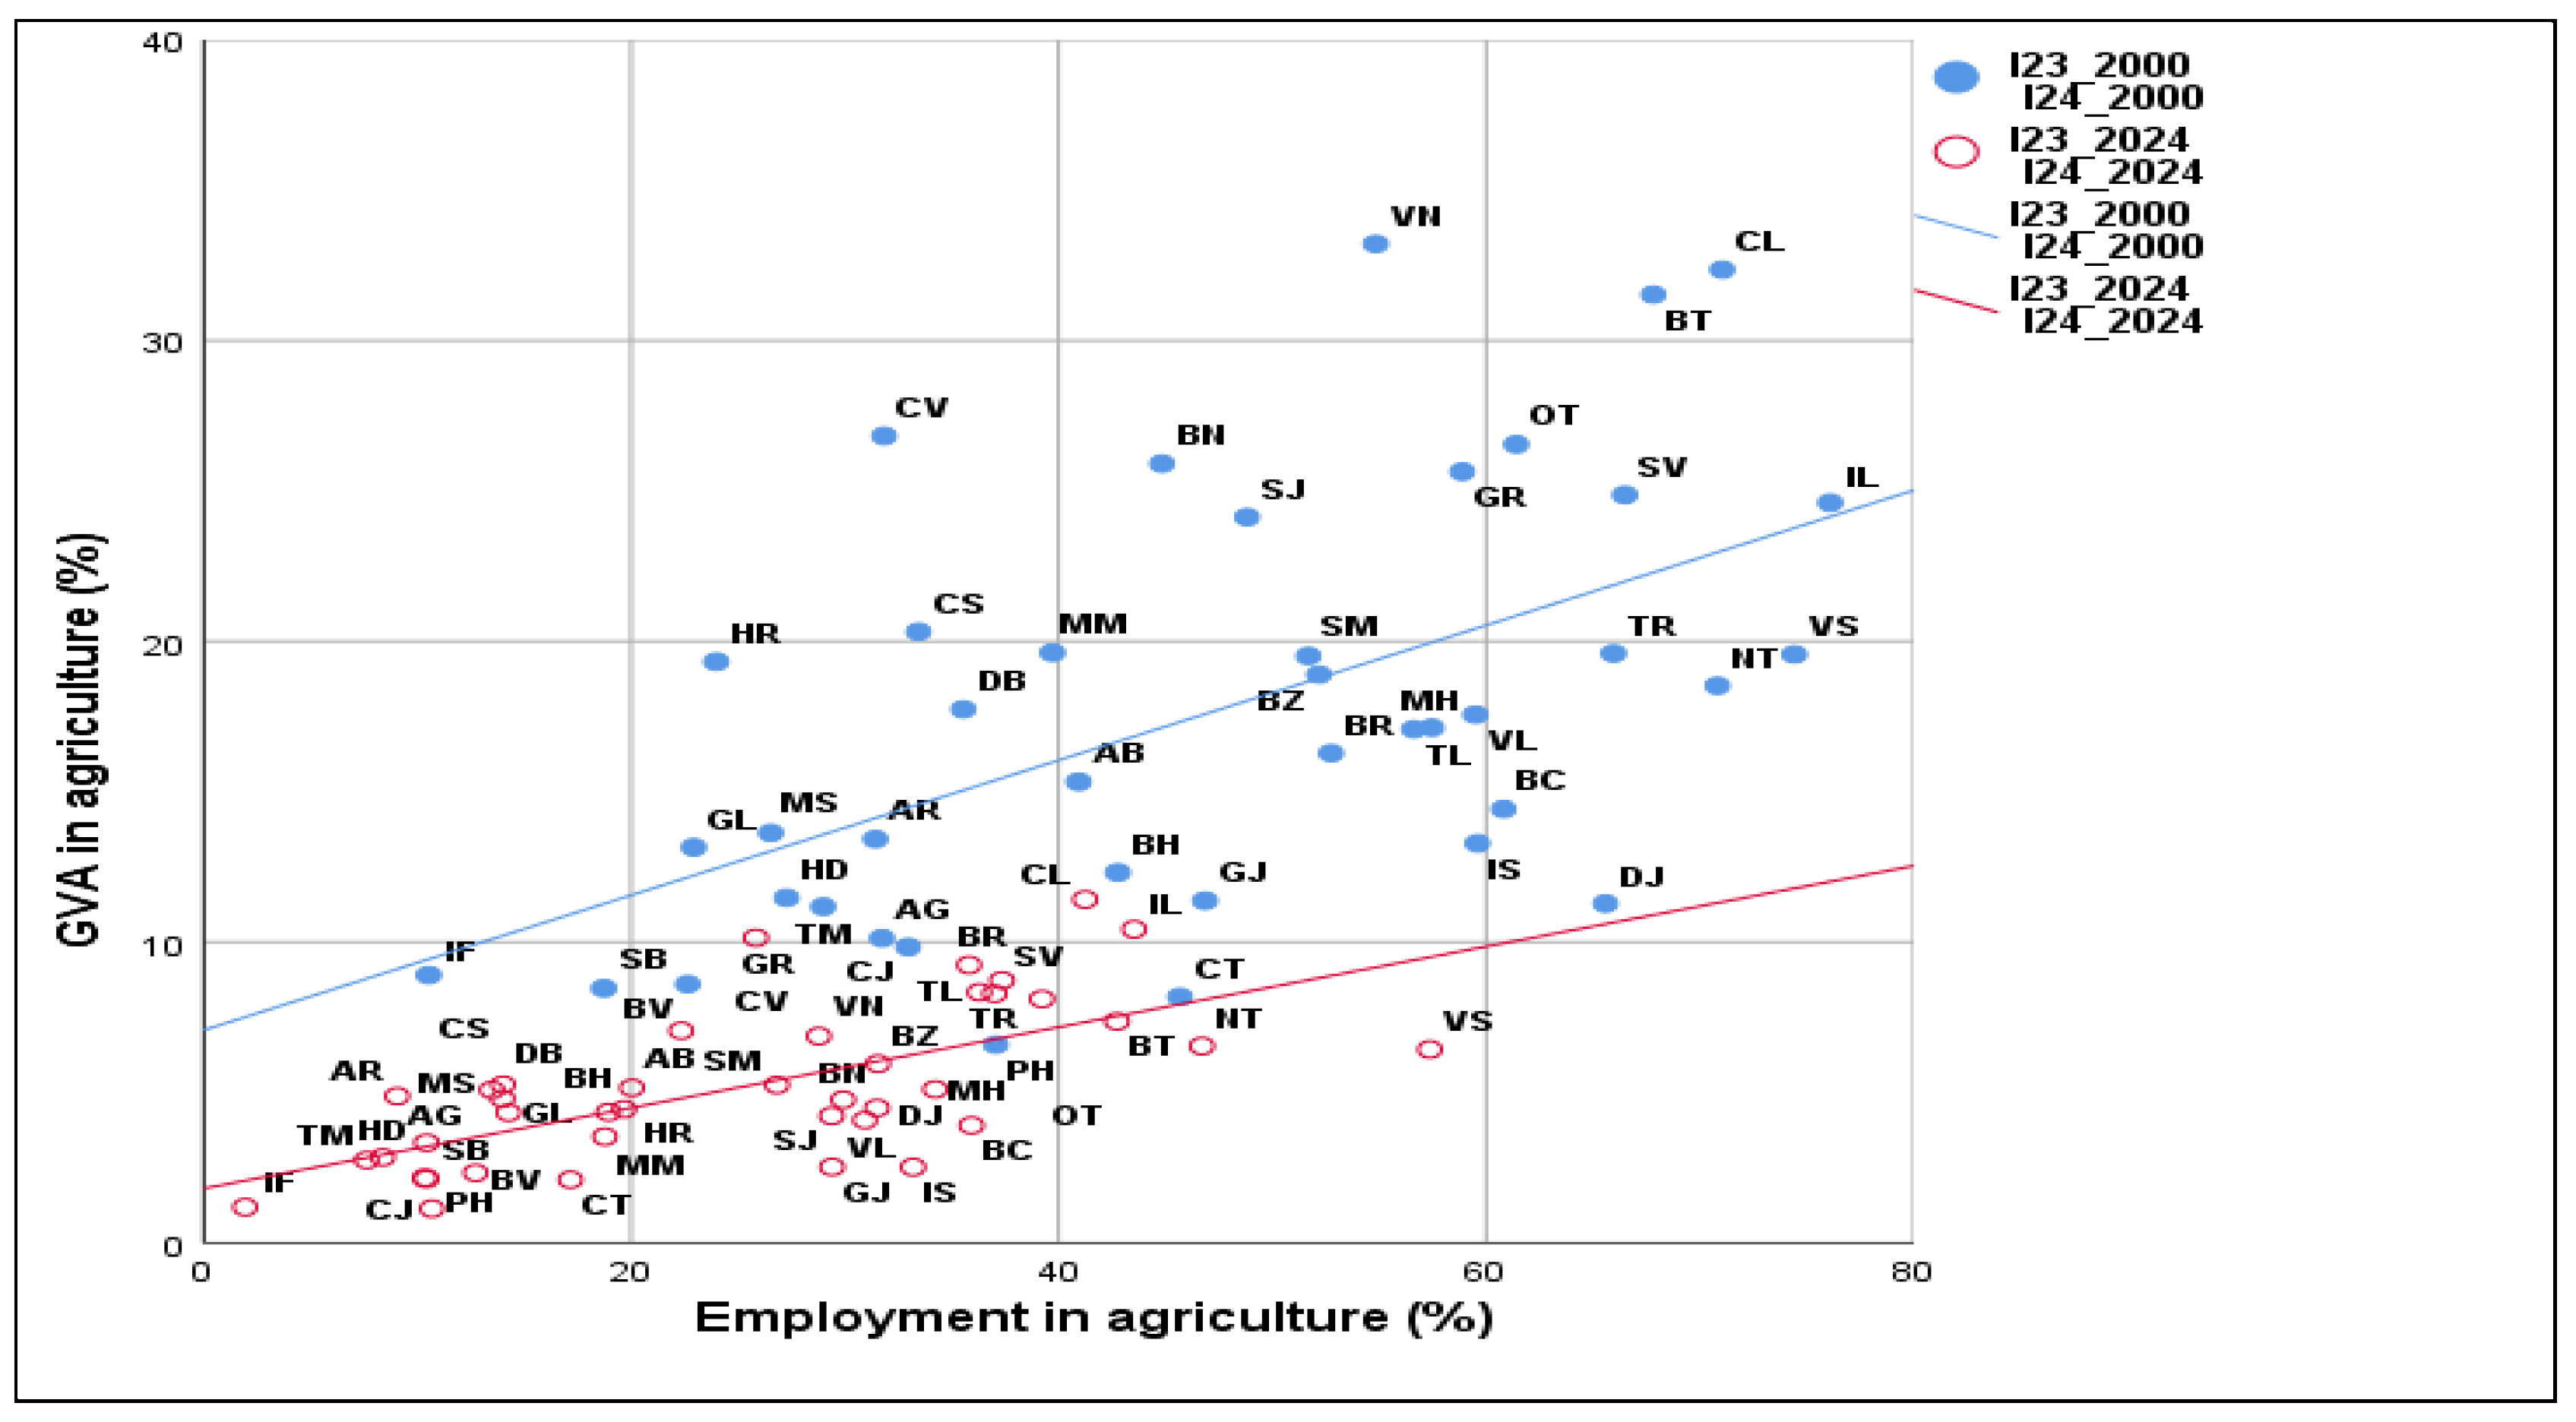
Figure 2 highlights marked disparities across Romanian counties in agricultural employment and the contribution of agriculture to gross value added (GVA) in 2000 and 2024. A persistent mismatch between labour share and economic output indicates differences in sectoral performance and farm structures. Previous studies report similar patterns, highlighting labour surplus in agriculture, particularly in less developed regions, which constrains productivity and efficiency [20,51,52].
The results of the paired-samples t-test provide strong empirical support for Hypothesis H1, confirming significant structural and functional transformations in Romanian agricultural landscapes between 2000 and 2024. These changes are reflected in shifts in land-use composition, crop structure, productivity, mechanization, input use, and socio-economic indicators.
The decline in the share of agricultural land, together with the expansion of arable systems, indicates increasing land-use pressure and a transition toward more intensive and production-oriented agricultural structures. At the same time, the persistence of grassland areas highlights the continued importance of traditional farming systems, particularly in less-favoured regions. Changes in crop structure further illustrate this transformation. The growing dominance of cereal crops, alongside the contraction of diversified and permanent crops, reflects increasing specialization and market orientation. This trend is accompanied by significant gains in crop yields and labour productivity, supported by mechanization and improved resource use.
These findings are consistent with previous research on agricultural transformation in Central and Eastern Europe, which emphasizes intensification, structural adjustment, and increasing integration into European markets [7,10,14,39]. At the same time, the persistence of traditional systems reflects ongoing regional disparities and structural constraints [5].
Overall, the results indicate a transition toward more intensive, specialized, and economically efficient agricultural systems, accompanied by increasing structural and spatial polarization. This confirms that agricultural transformation in Romania is both dynamic and uneven, providing robust empirical validation of Hypothesis H1.

4.2. Principal Component Analysis: Key Dimensions of Agricultural Landscape Transformation

To further investigate the underlying structure of agricultural landscape transformation and to test Hypothesis H2, Principal Component Analysis (PCA) was applied to a set of 21 variables describing the structural, functional, and socio-economic characteristics of Romanian agricultural landscapes at the county level (Table 1). The method was employed to reduce the dimensionality of the dataset by extracting a smaller number of components that explain the maximum variance in the original variables. This approach enables the identification of latent dimensions that capture the main patterns of variation and relationships among variables.
The adequacy of the dataset for PCA was evaluated using the Kaiser–Meyer–Olkin (KMO) measure of sampling adequacy and Bartlett’s Test of Sphericity (Table 6). The KMO values of 0.558 (2000) and 0.512 (2024) were above the minimum acceptable threshold of 0.50, indicating acceptable sampling adequacy for exploratory multivariate analysis. Furthermore, Bartlett’s Test of Sphericity was statistically significant in both years (p < 0.001), demonstrating that the variables were sufficiently intercorrelated to justify dimension reduction. Therefore, the application of PCA was considered appropriate, although the relatively low KMO values indicate a moderate rather than strong common factor structure.
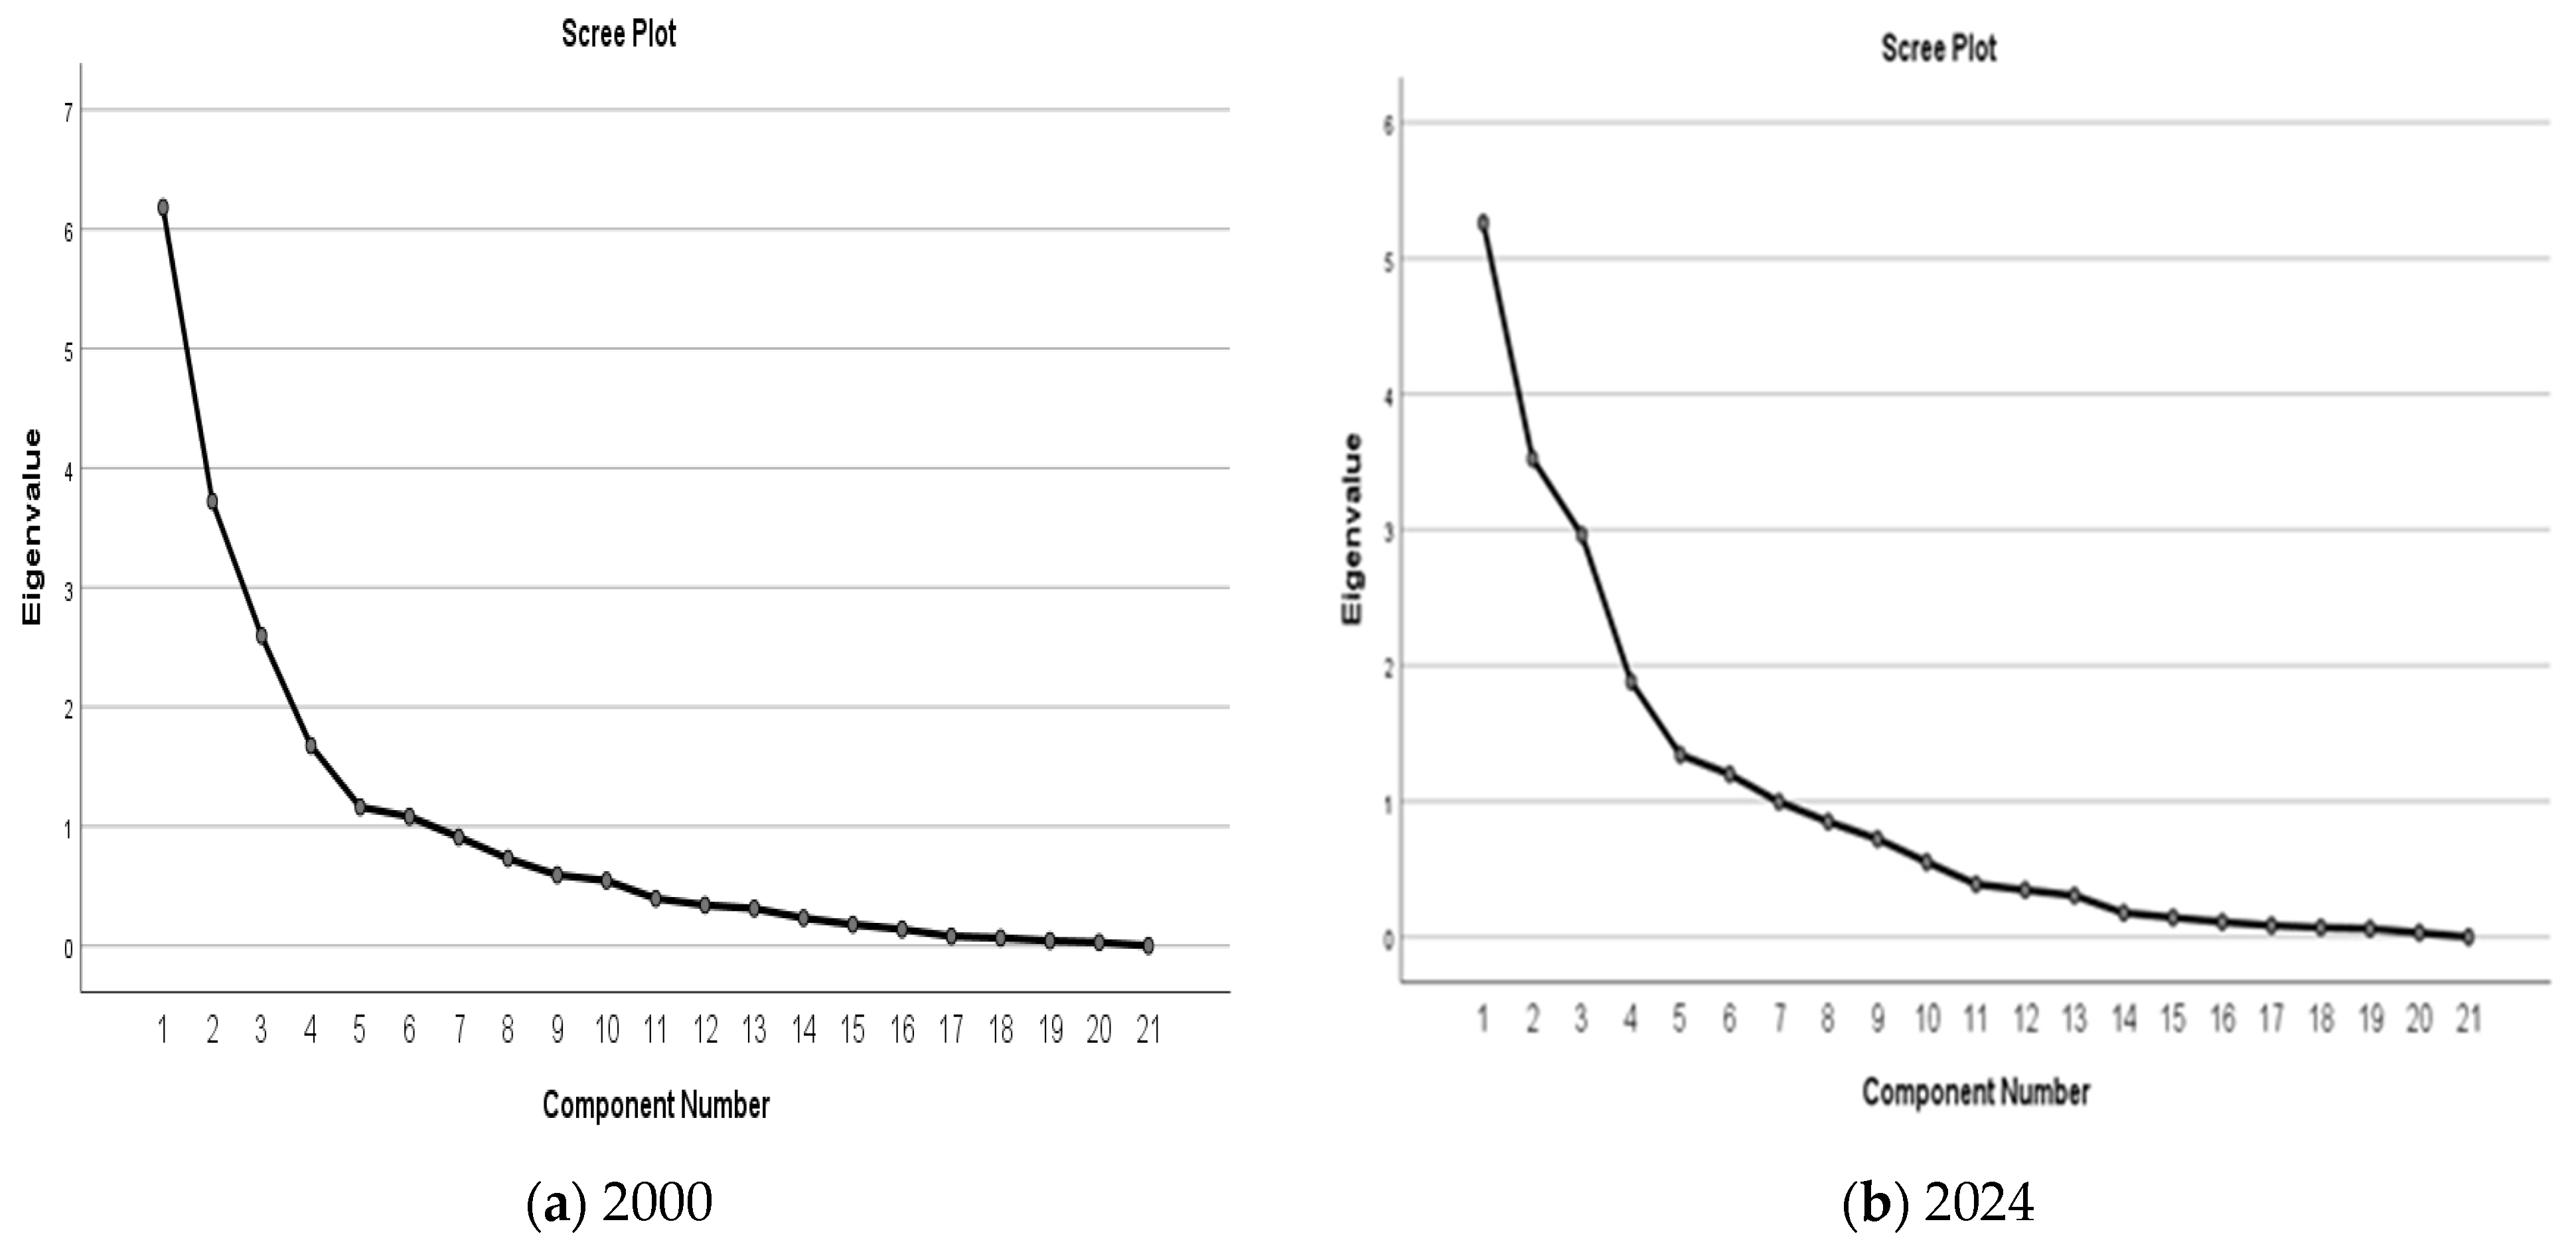
Component retention was based on multiple complementary criteria, including the Kaiser criterion (eigenvalues > 1), visual inspection of the scree plots cumulative explained variance, and the interpretability of the extracted components.
The PCA results for the years 2000 and 2024 are presented in Table 7 and Table 8 and Figure 3. The Kaiser criterion suggested retaining six components in both years, as only the first six components exhibited eigenvalues exceeding unity (Table 7 and Figure 3). Visual inspection of the scree plots (Figure 3), supported this decision, showing a pronounced decline in eigenvalues for the first components followed by a clear flattening of the curve after the sixth component, indicating that subsequent components contributed only marginal additional explanatory power.
To enhance the interpretability of the results, Varimax rotation with Kaiser normalization was applied, ensuring a clearer and more balanced factor structure. This orthogonal rotation method was selected because the objective was to identify distinct and relatively independent dimensions of agricultural transformation. The retained six-component solution explained 78.17% of the total variance in 2000 and 76.99% in 2024, exceeding commonly accepted thresholds for exploratory multivariate analyses and indicating that the extracted components provide a comprehensive summary of the multidimensional structure of Romanian agricultural landscapes and agroecosystems. The relatively stable explained variance suggests continuity in the main structural dimensions, while changes in component composition reveal evolving patterns of agricultural transformation. Notably, the decrease in the variance explained by the first component (from 29.44% to 25.1%) reflects increasing differentiation and spatial heterogeneity of agricultural systems over time.
The interpretation of the extracted components provides insights into the key dimensions of agricultural transformation, including structural composition, intensification processes, technological development, and socio-economic differentiation.
The PCA results for 2000 show that the first principal component (PC1) explains 29.44% of the total variance before rotation and 19.72% after rotation, while the first three components together account for 46.34% of total variance after rotation (Table 7). The six retained components therefore summarize the main territorial patterns of agricultural land use, productivity, mechanization, specialization, and socio-economic dependence on agriculture in Romania at the beginning of the post-socialist transition period.
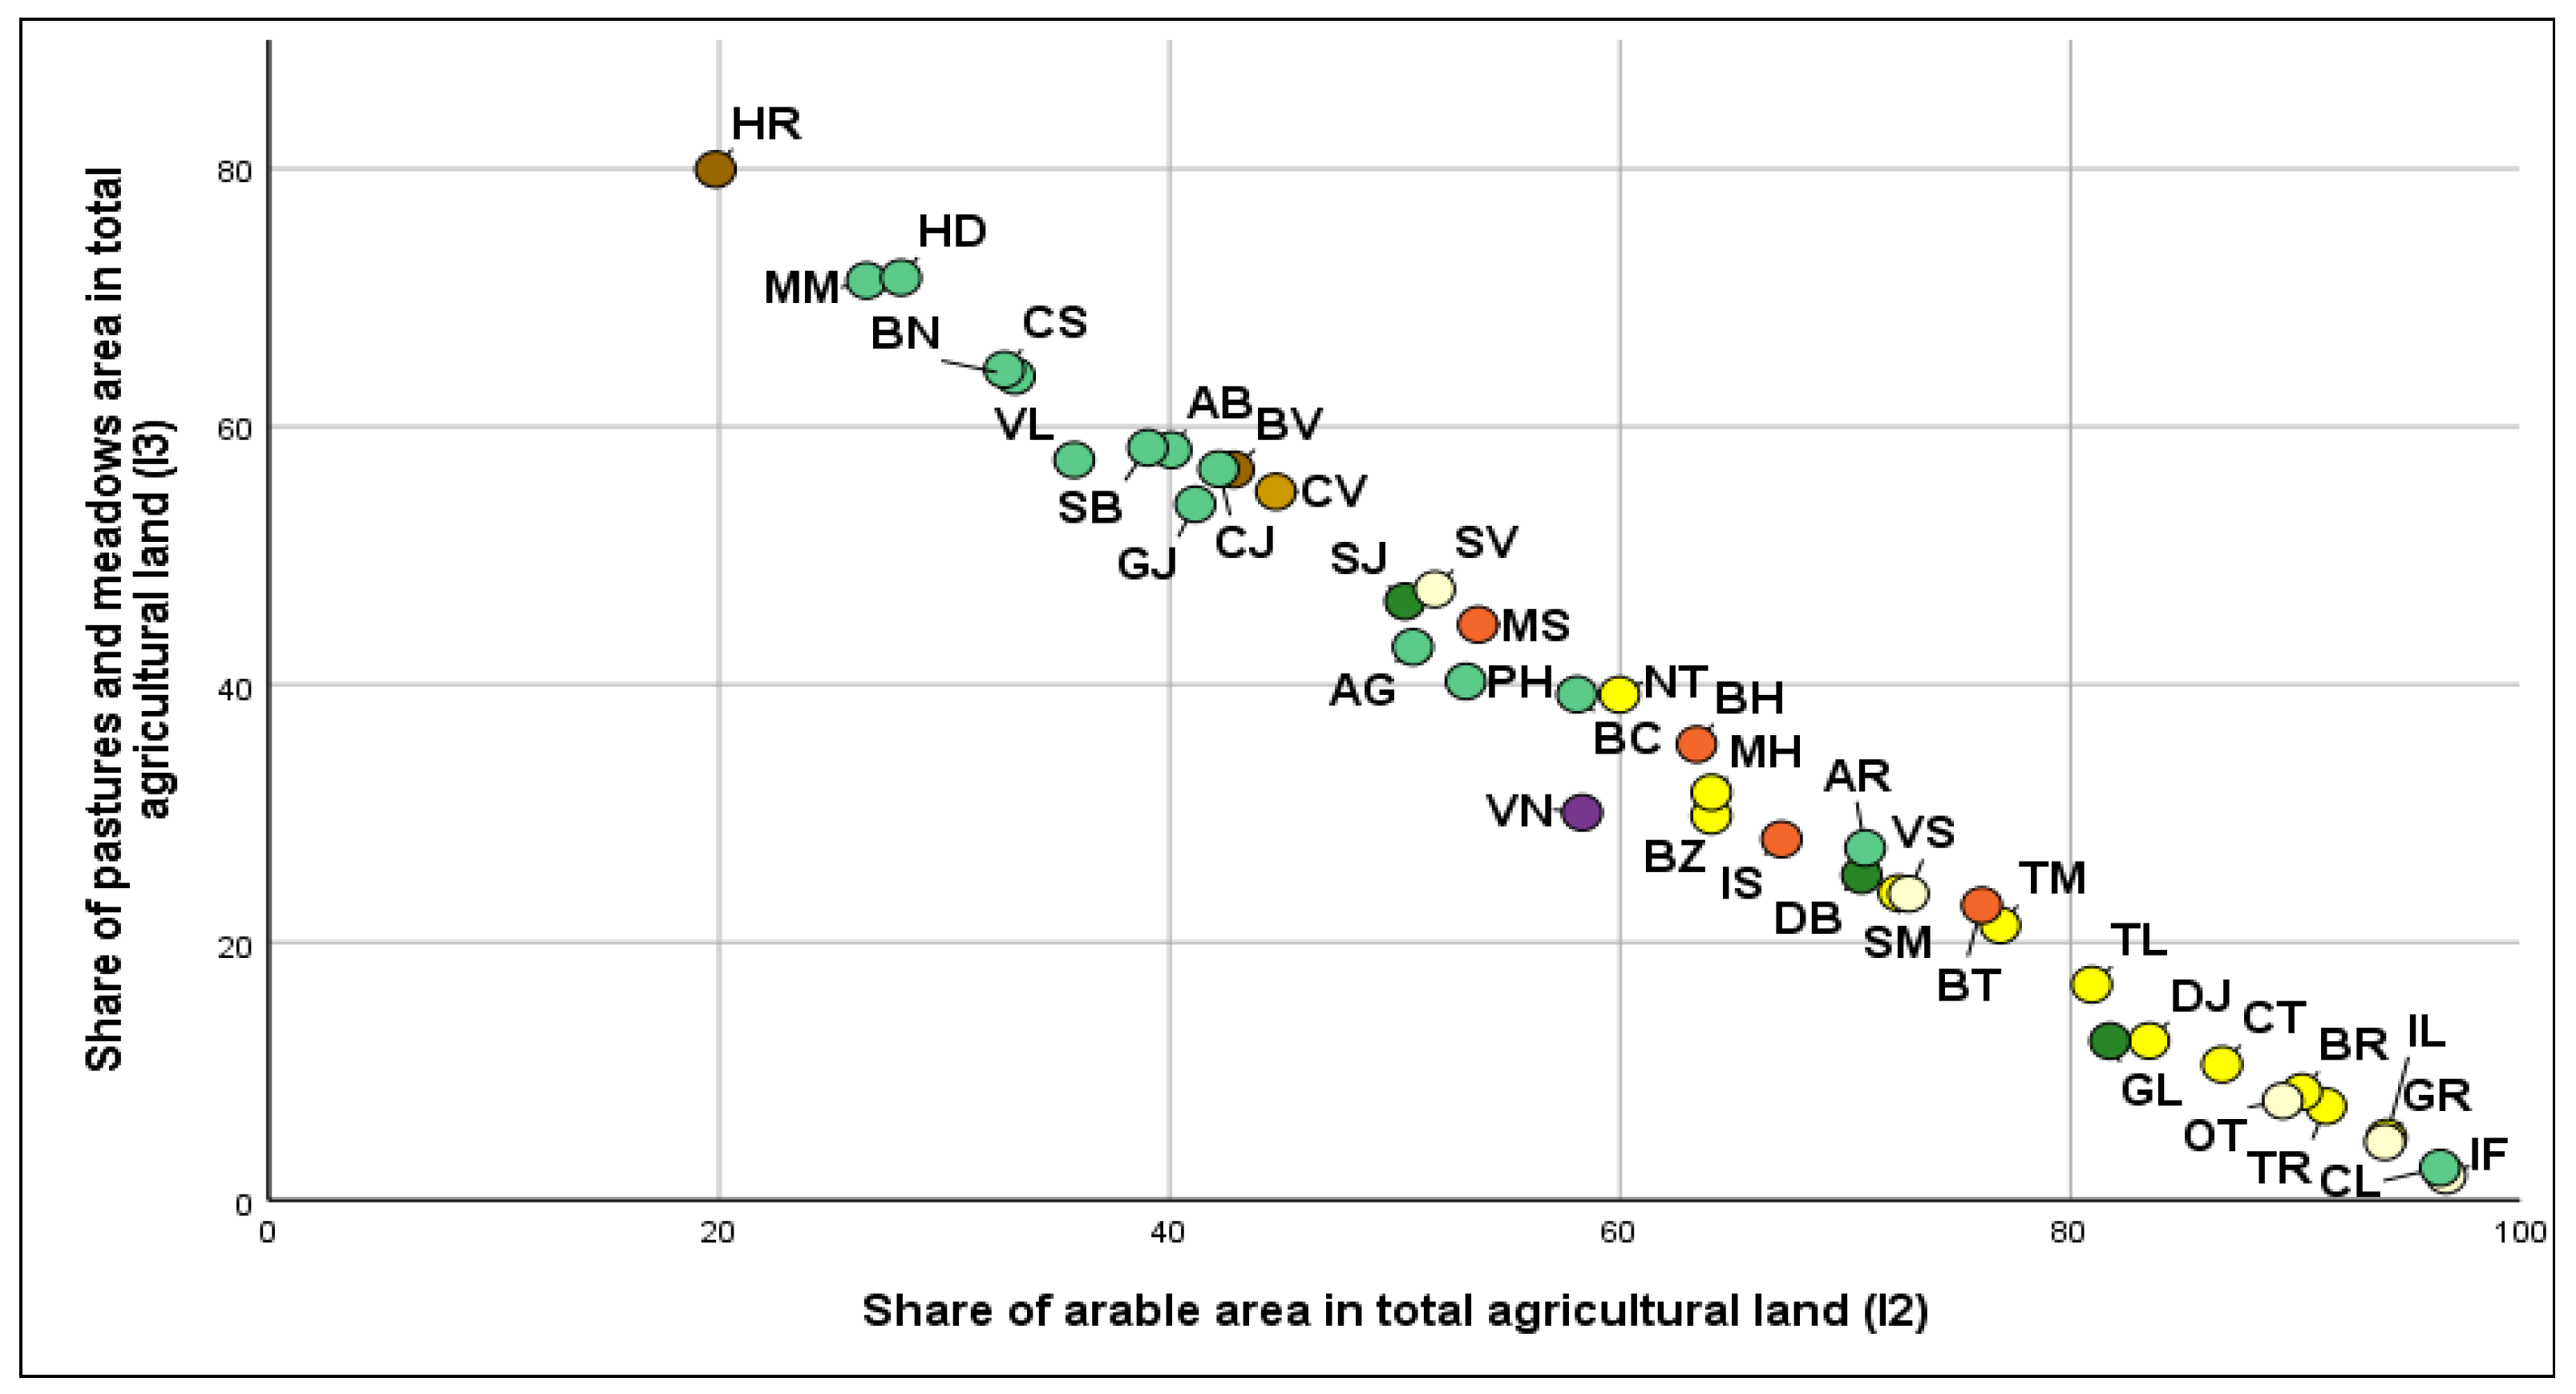
In 2000, based on the highest positive and negative factor loadings reported in the rotated component matrix (Table 8), the first principal component captures the fundamental contrast between extensive, pasture-based systems and intensive arable agriculture, reflecting the dual structure of Romanian agriculture. This pattern is primarily driven by the strong positive loading of pastures and meadows (I3 = 0.901) and the strong negative loadings of arable land (I2 = −0.915), agricultural land (I1 = −0.820), and wheat and rye cultivation (I6 = −0.569), reflecting the dual structure of Romanian agriculture. The second component is primarily defined by agricultural employment (I22 = 0.785), labour productivity (I21 = 0.705), and the share of agricultural employment in total employment (I24 = −0.877), highlighting differences in labour intensity, economic performance, and structural dependence on agriculture across counties. The third component is characterized by strong loadings for orchards (I5 = −0.765), maize (I7 = −0.754), vegetables (I9 = −0.736), and chemical fertilizer use (I18 = 0.717), reflecting variation between diversified cropping systems and more input-intensive agricultural structures. The fourth component is associated with natural fertilizer use (I19 = 0.725) and crop yields (I11–I13), indicating differences in productivity and agricultural management practices. The fifth component is mainly defined by pesticide use (I20 = 0.884) and vineyard area (I4 = 0.833), reflecting specialization in viticulture and intensive crop management. Finally, the sixth component is strongly associated with wheat yield (I10 = 0.777) and mechanization (I14 = 0.706), highlighting the role of technological development and production performance.
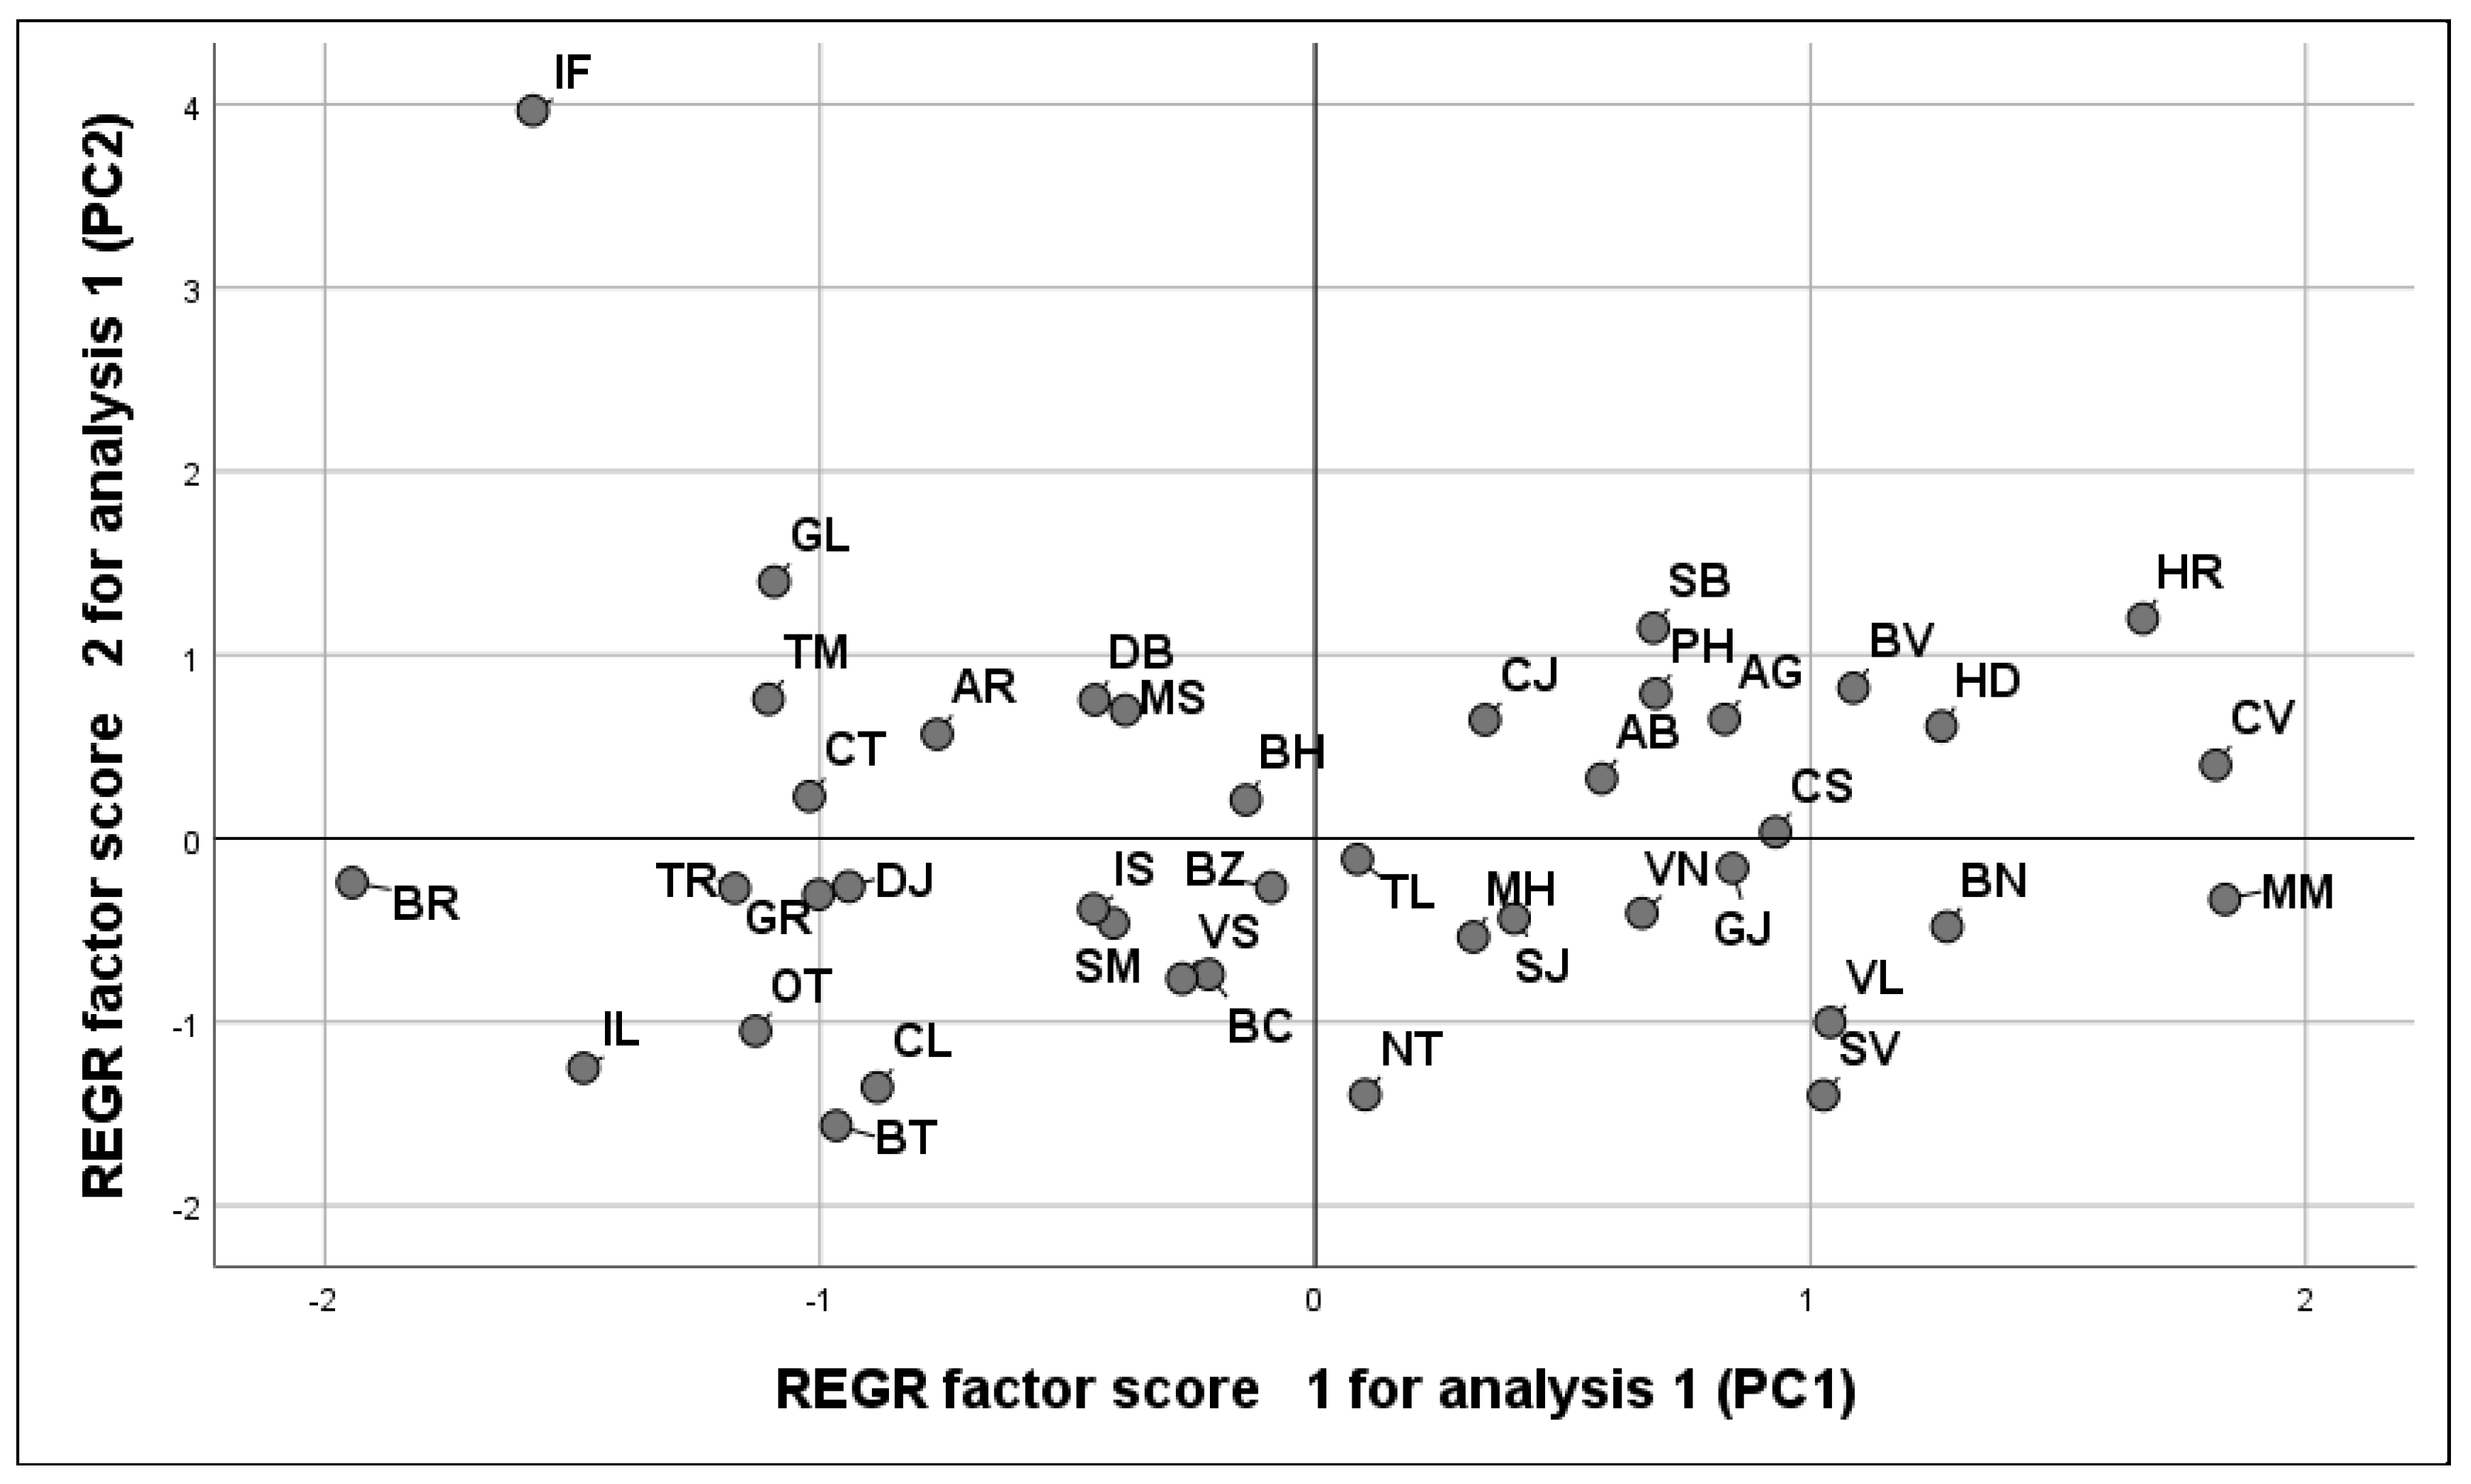
Figure 4 presents the PCA score plot illustrating the distribution of Romanian counties according to the first two principal components, in 2000. The results reveal a clear spatial differentiation between traditional, labour-intensive agricultural systems (negative PC1 values) and more intensive, productivity-oriented systems (positive PC1 values). The second component further distinguishes between highly specialized regions and more diversified or structurally constrained systems. The dispersion of counties across all quadrants highlights the increasing heterogeneity and spatial polarization of agricultural systems in Romania.
The PCA results for 2024 show a more differentiated and specialized structure of Romanian agriculture (Table 7 and Table 8), reflecting ongoing processes of intensification, technological diffusion, and spatial polarization.
By 2024, the PCA structure becomes more differentiated, reflecting increasing specialization and structural transformation. The first component continues to capture the contrast between arable and pasture-based systems, while the positive loading of mechanization (I14 = 0.684) suggests the expansion of mechanization into traditionally extensive areas (Table 8). The second component is primarily associated with labour productivity (I21 = 0.928), agricultural employees (I22 = 0.898), and the share of agricultural employment (I24 = −0.844), reflecting differences in labour efficiency and structural adjustment. The third component is defined mainly by maize (I7 = −0.880), wheat and rye (I6 = 0.603), orchards (I5 = −0.600), and vegetables (I9 = −0.595), indicating increasing crop specialization. The fourth component is strongly related to crop yields (I10 = 0.830; I11 = 0.781) and vineyard area (I4 = −0.800), highlighting variations in agricultural productivity and specialized production systems. The fifth component is dominated by pesticide use (I20 = 0.893) and chemical fertilizer use (I18 = 0.867), identifying input intensity as a distinct dimension of agricultural development. Finally, the sixth component is strongly associated with vegetable and potato yields (I13 = 0.886; I12 = 0.591), reflecting the growing differentiation of intensive horticultural systems.
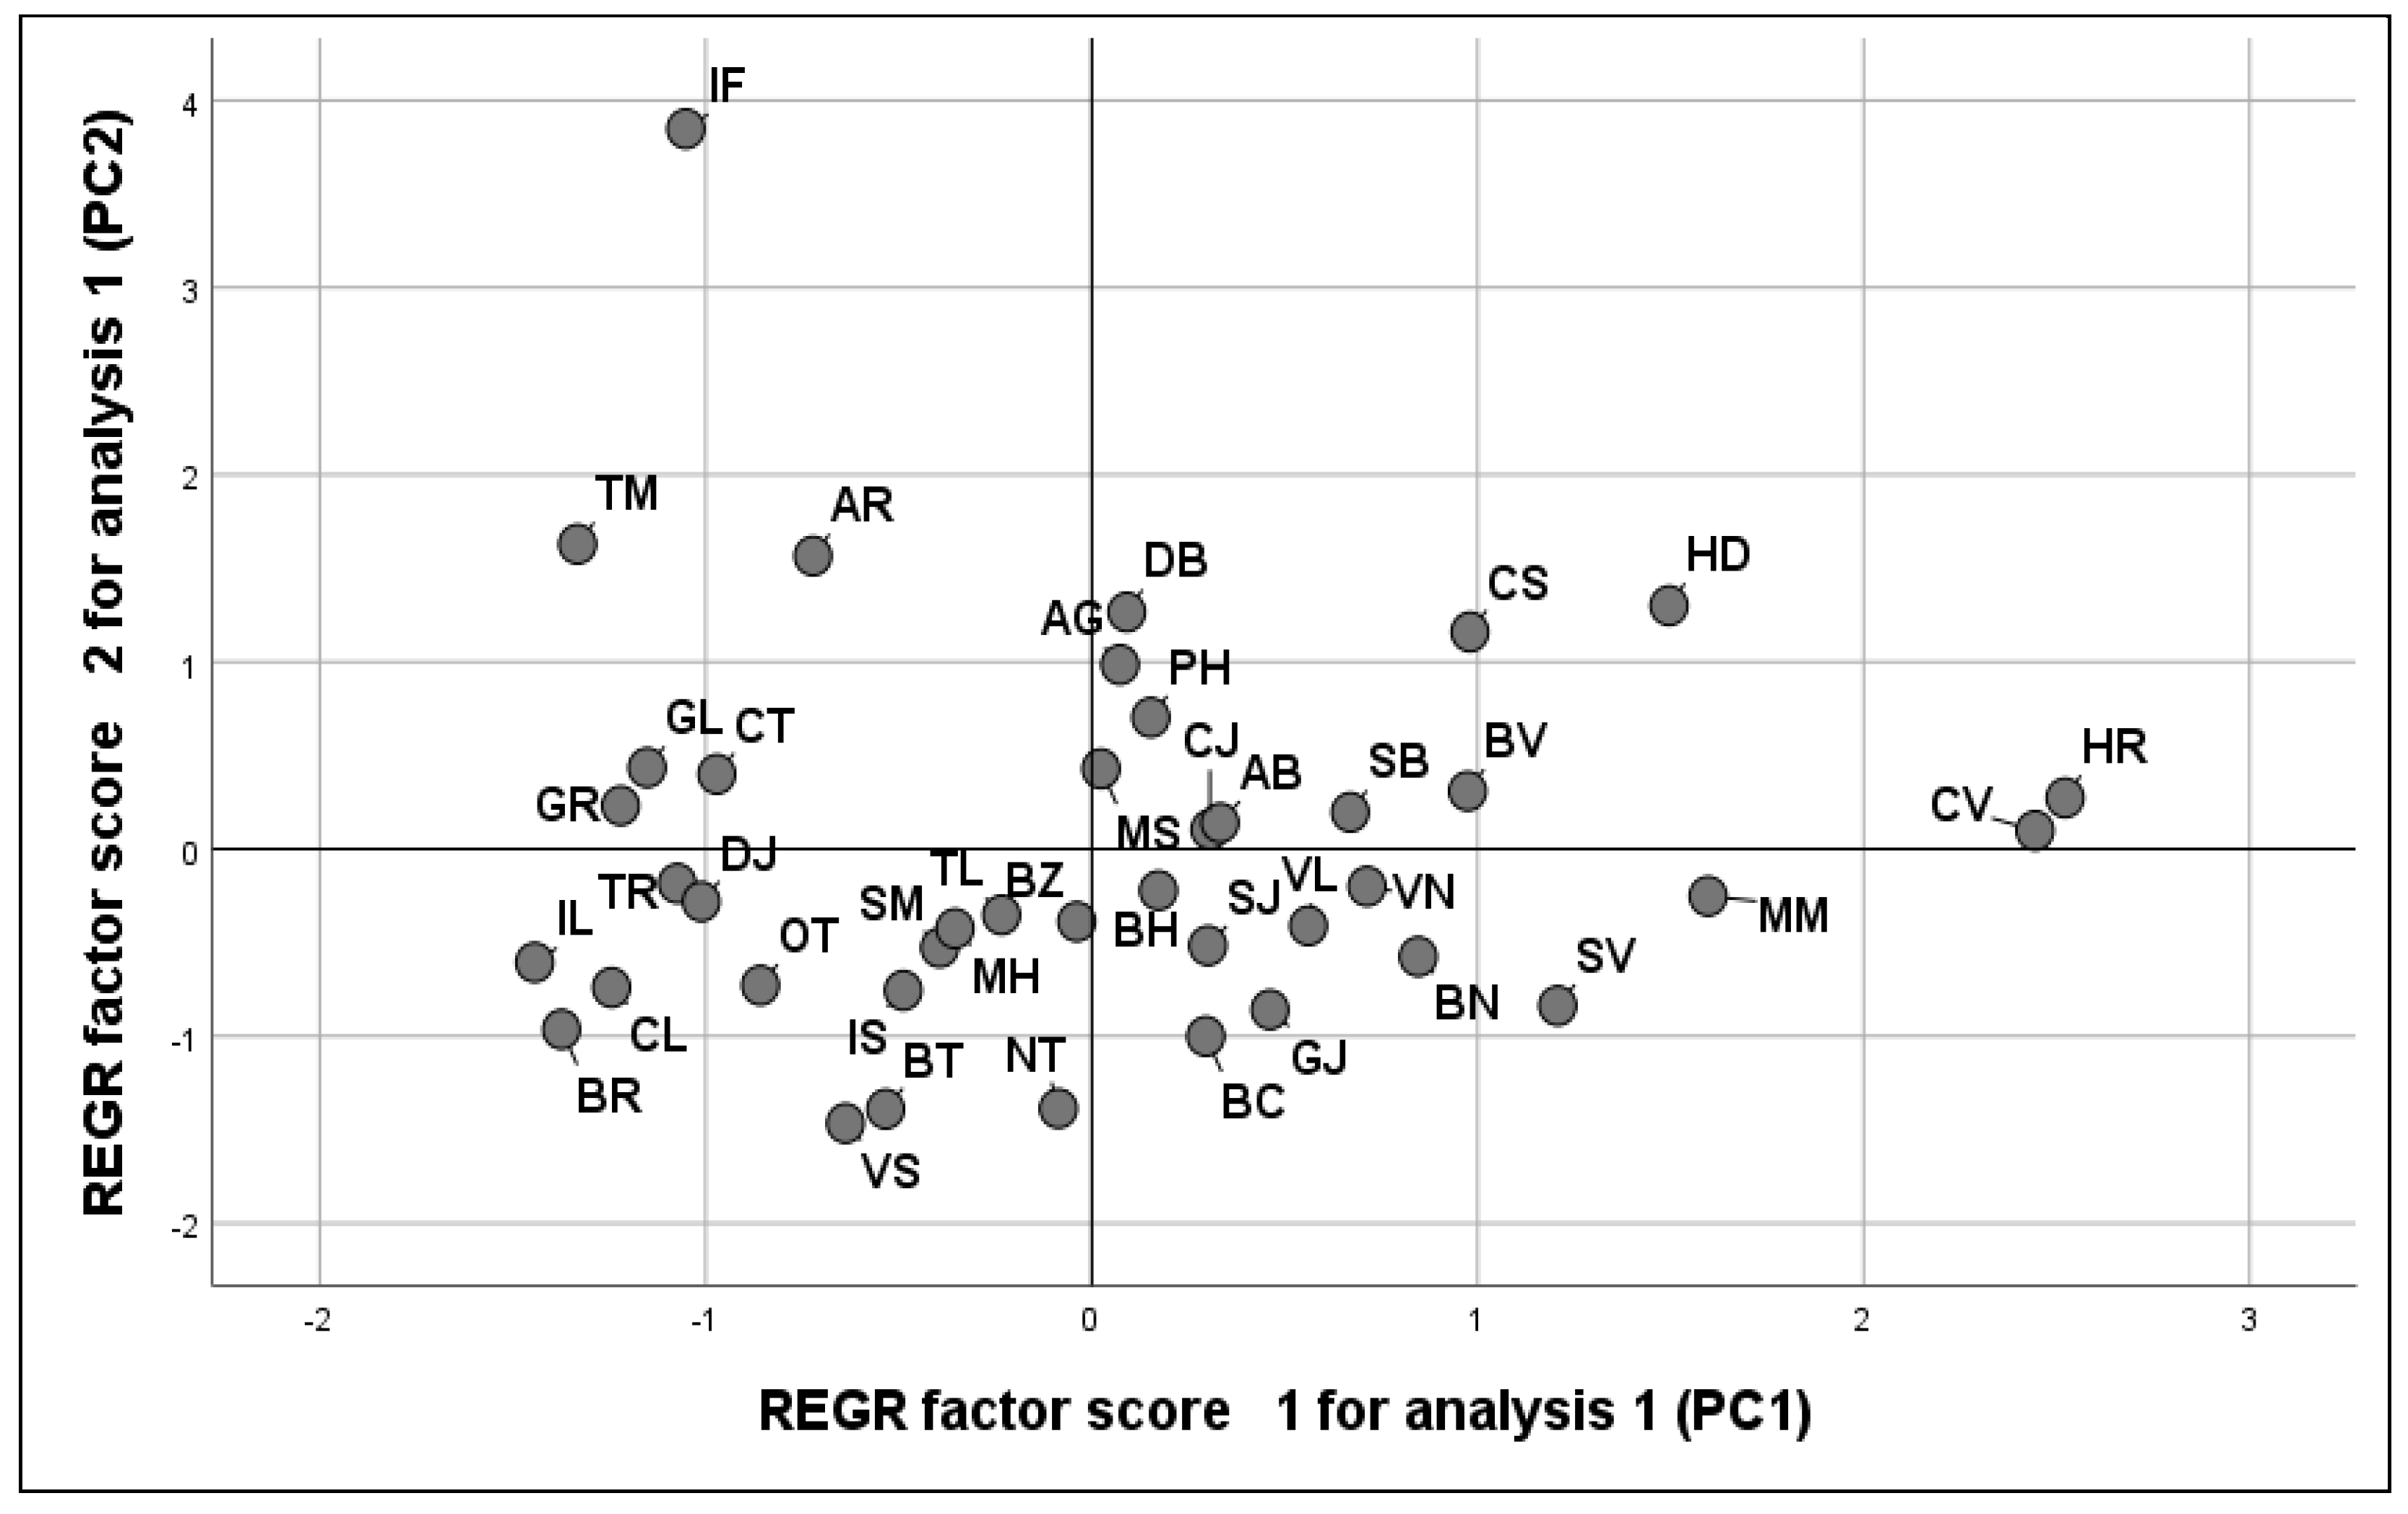
Figure 5 presents the PCA score plot for 2024, illustrating the distribution of Romanian counties according to the first two principal components. The results reveal a clear spatial differentiation between intensive, productivity-oriented agricultural systems (positive PC1 values) and more traditional, labour-intensive structures (negative PC1 values). The second component further distinguishes between highly specialized and economically efficient regions (positive PC2 values) and structurally constrained areas characterized by lower performance (negative PC2 values). The wide dispersion of counties across all quadrants highlights the increasing heterogeneity and functional differentiation of agricultural systems. Compared to 2000, the 2024 configuration suggests stronger specialization, greater technological development, and a more pronounced spatial polarization of agricultural structures.
Overall, the comparison between 2000 and 2024 highlights increasing differentiation and spatial heterogeneity of agricultural systems, providing strong support for Hypothesis H2. The results indicate a clear transition toward more specialized, technologically advanced, and spatially differentiated agricultural structures.
Compared to 2000, the 2024 configuration reflects stronger separation between production systems, reduced functional overlap, and increased territorial specialization. These patterns confirm ongoing processes of intensification, structural adjustment, and landscape differentiation, consistent with previous studies in Central and Eastern Europe [10,13,38,39].
At the same time, the persistence of the second component highlights enduring disparities between labour-intensive, low-productivity systems and more efficient agricultural regions. This indicates that structural transformation has been uneven, with limited progress in labour reallocation and continued socio-economic polarization within rural areas [5].
Taken together, the PCA results confirm that agricultural transformation in Romania is characterized by increasing specialization, technological development, and spatial polarization, while maintaining significant regional disparities.

4.3. Cluster Analysis

In the next step, the six principal components (PC1–PC6) extracted for 2000 and 2024 were used as input variables for cluster analysis, in order to classify Romanian counties into homogeneous groups characterized by similar agricultural landscape structures and functional profiles.
The optimal number of clusters was initially explored using hierarchical cluster analysis based on Ward’s method and squared Euclidean distance. Examination of the dendrogram and agglomeration coefficients indicated that solutions ranging from seven to nine clusters were statistically plausible. To assess the robustness of the classification, alternative clustering solutions were evaluated using silhouette statistics (Table 9). The nine-cluster solution generated the highest average silhouette coefficients in both 2000 (0.346) and 2024 (0.350), compared with the seven-cluster (0.306 and 0.319, respectively) and eight-cluster (0.319 and 0.344, respectively) alternatives. Although these values indicate moderate rather than strong cluster separation [53,54], they suggest meaningful differentiation among agricultural systems and support the selection of the nine-cluster solution as providing the best balance between statistical performance, interpretability, and typological detail. Subsequently, the clustering solution was refined using the k-means algorithm to improve cluster compactness and classification stability.
The results (Table 10 and Figure 6) indicate that, in both 2000 and 2024, Romanian counties are grouped into nine distinct clusters, reflecting a high degree of spatial differentiation. The statistically significant ANOVA results (p < 0.001) confirm that all six principal components contribute meaningfully to cluster separation, demonstrating that the identified clusters represent clearly differentiated agricultural landscape typologies. In 2000, PC5 (F(8, 32) = 18.723) and PC1 (F(8, 32) = 14.336) represented the most powerful discriminating dimensions, while in 2024, PC6 (F(8, 32) = 11.786) and PC5 (F(8, 32) = 9.013) emerged as dominant drivers of spatial structuring.
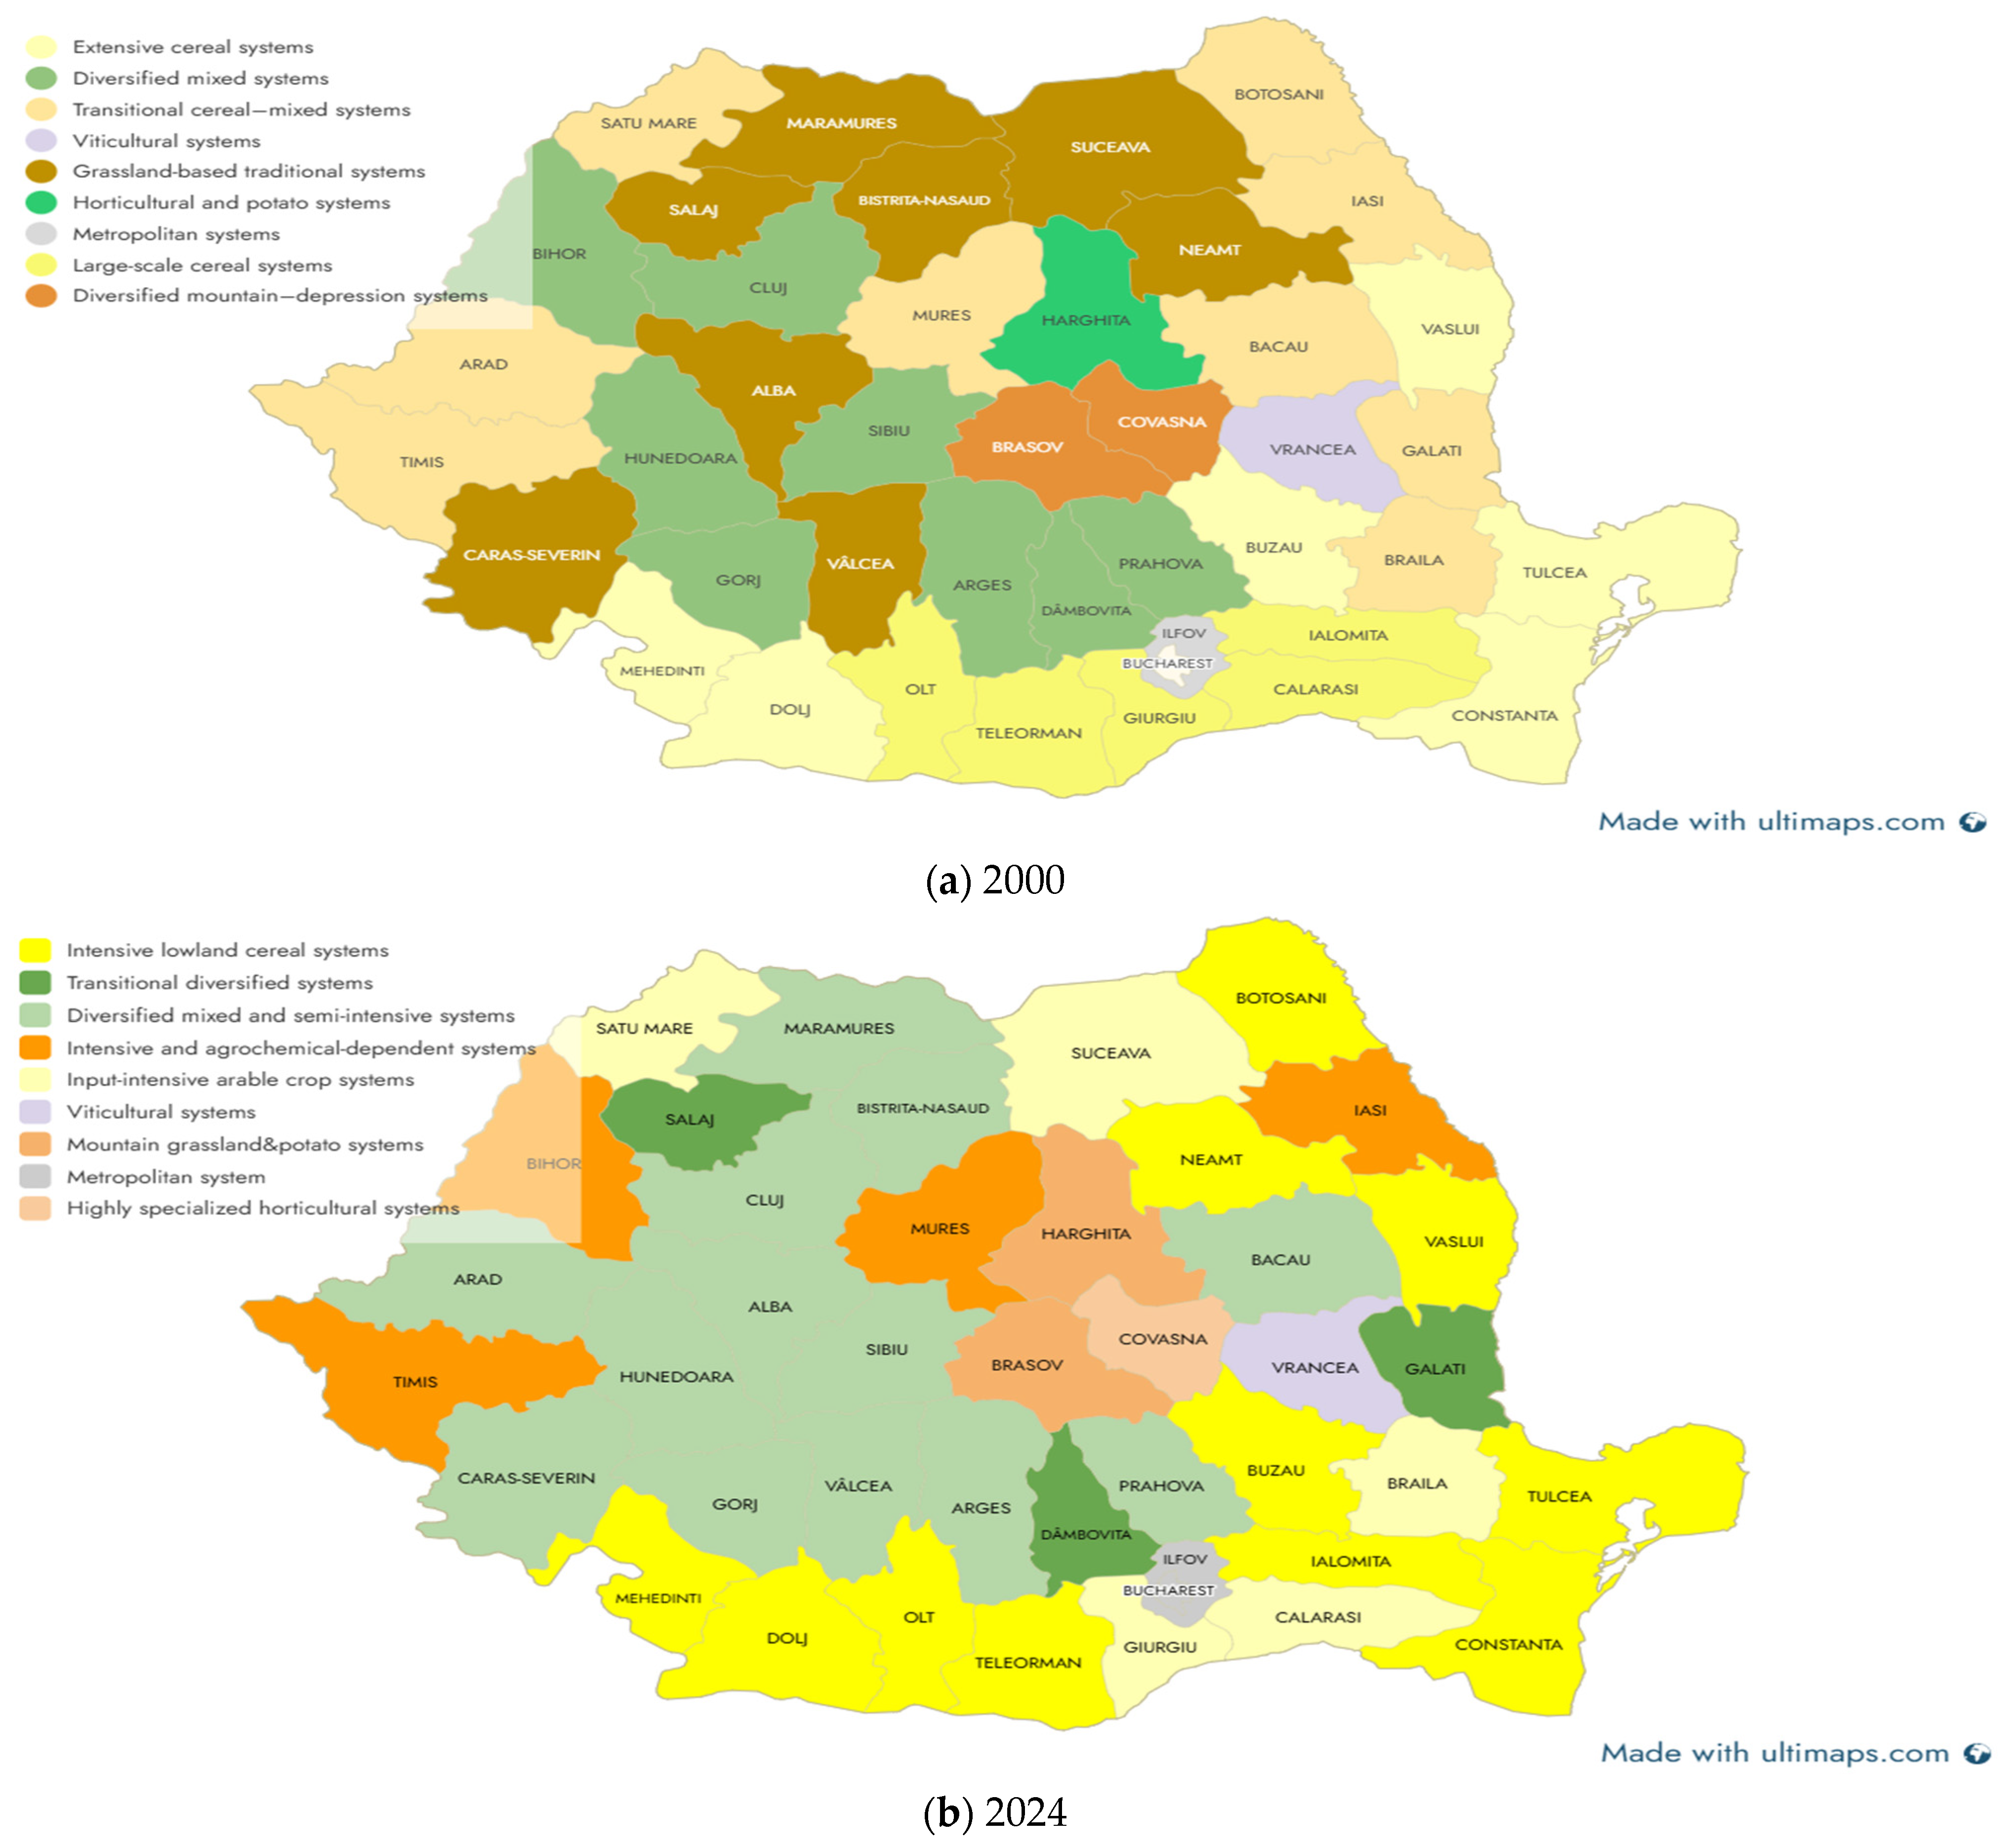
Figure 6a presents the spatial distribution of the nine agricultural cluster typologies identified for 2000 through the combined application of PCA and cluster analysis. The clusters reflect substantial differences in land-use structure, agricultural specialization, productivity, and socio-economic characteristics. The spatial pattern highlights the coexistence of cereal-dominated lowland systems, traditional grassland-based mountain agriculture, and localized specialized systems such as viticulture and horticulture.
The spatial distribution of clusters in 2000 highlights a predominantly transitional and heterogeneous agricultural structure, with clear contrasts between cereal-dominated plains, mixed farming regions, and grassland-based mountain systems. Although some clusters are spatially fragmented, this reflects functional similarities rather than geographic continuity.
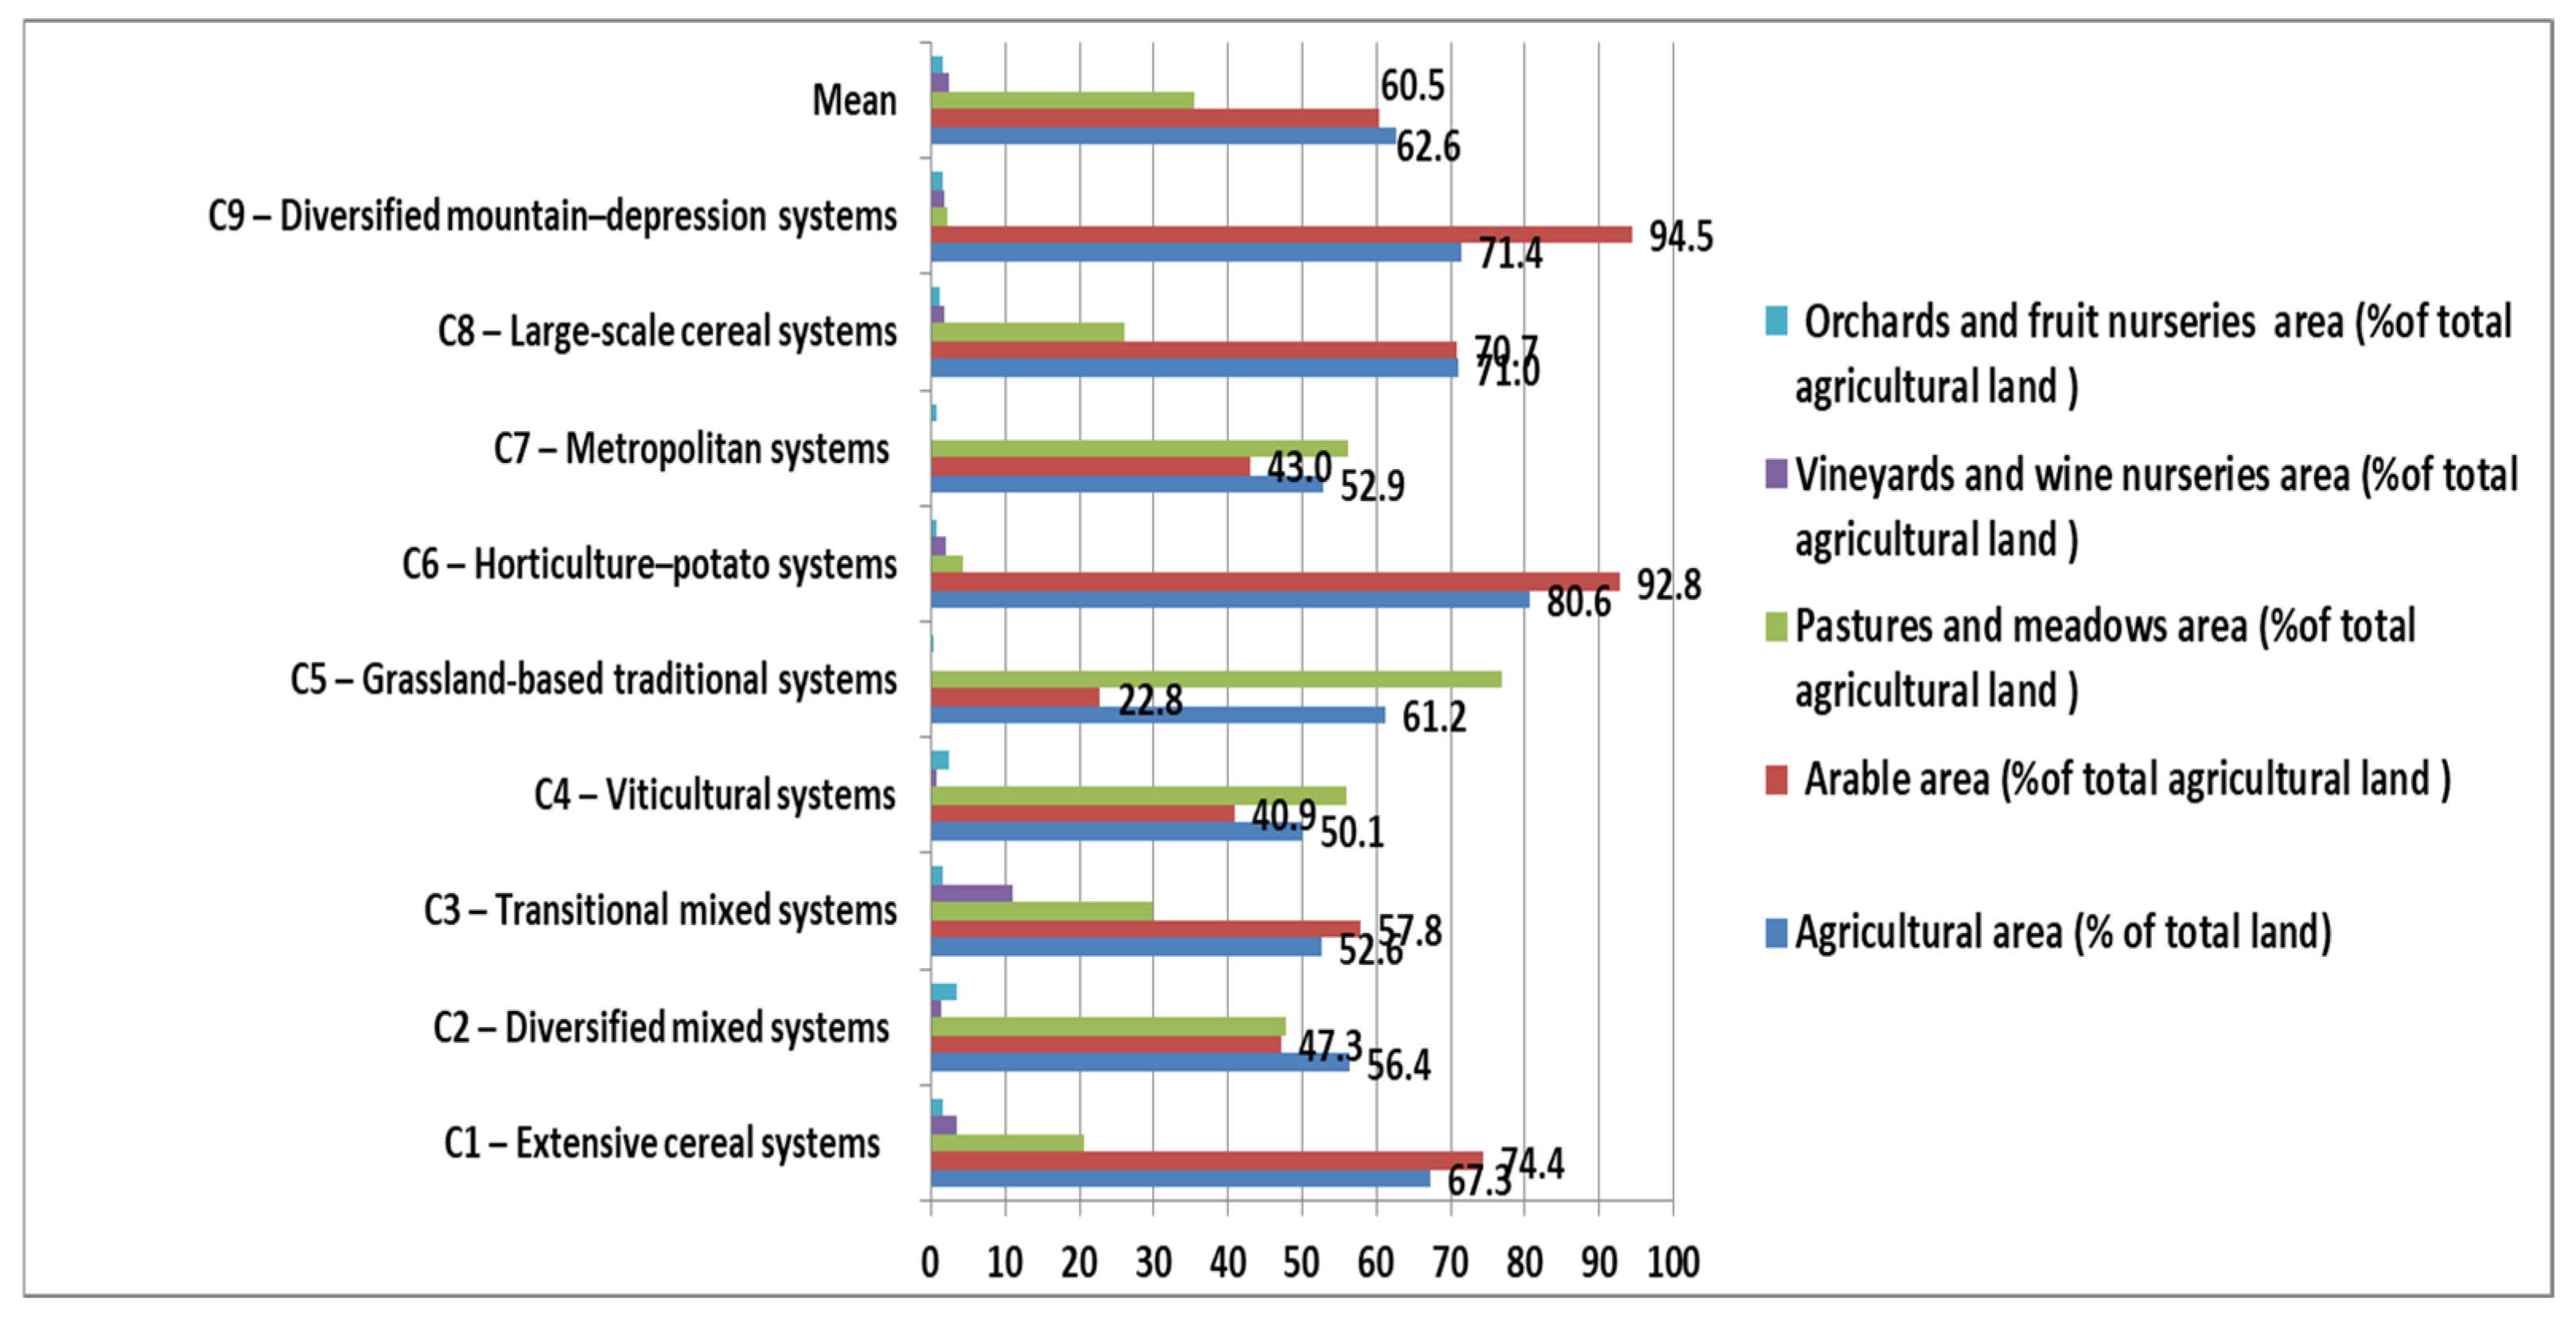
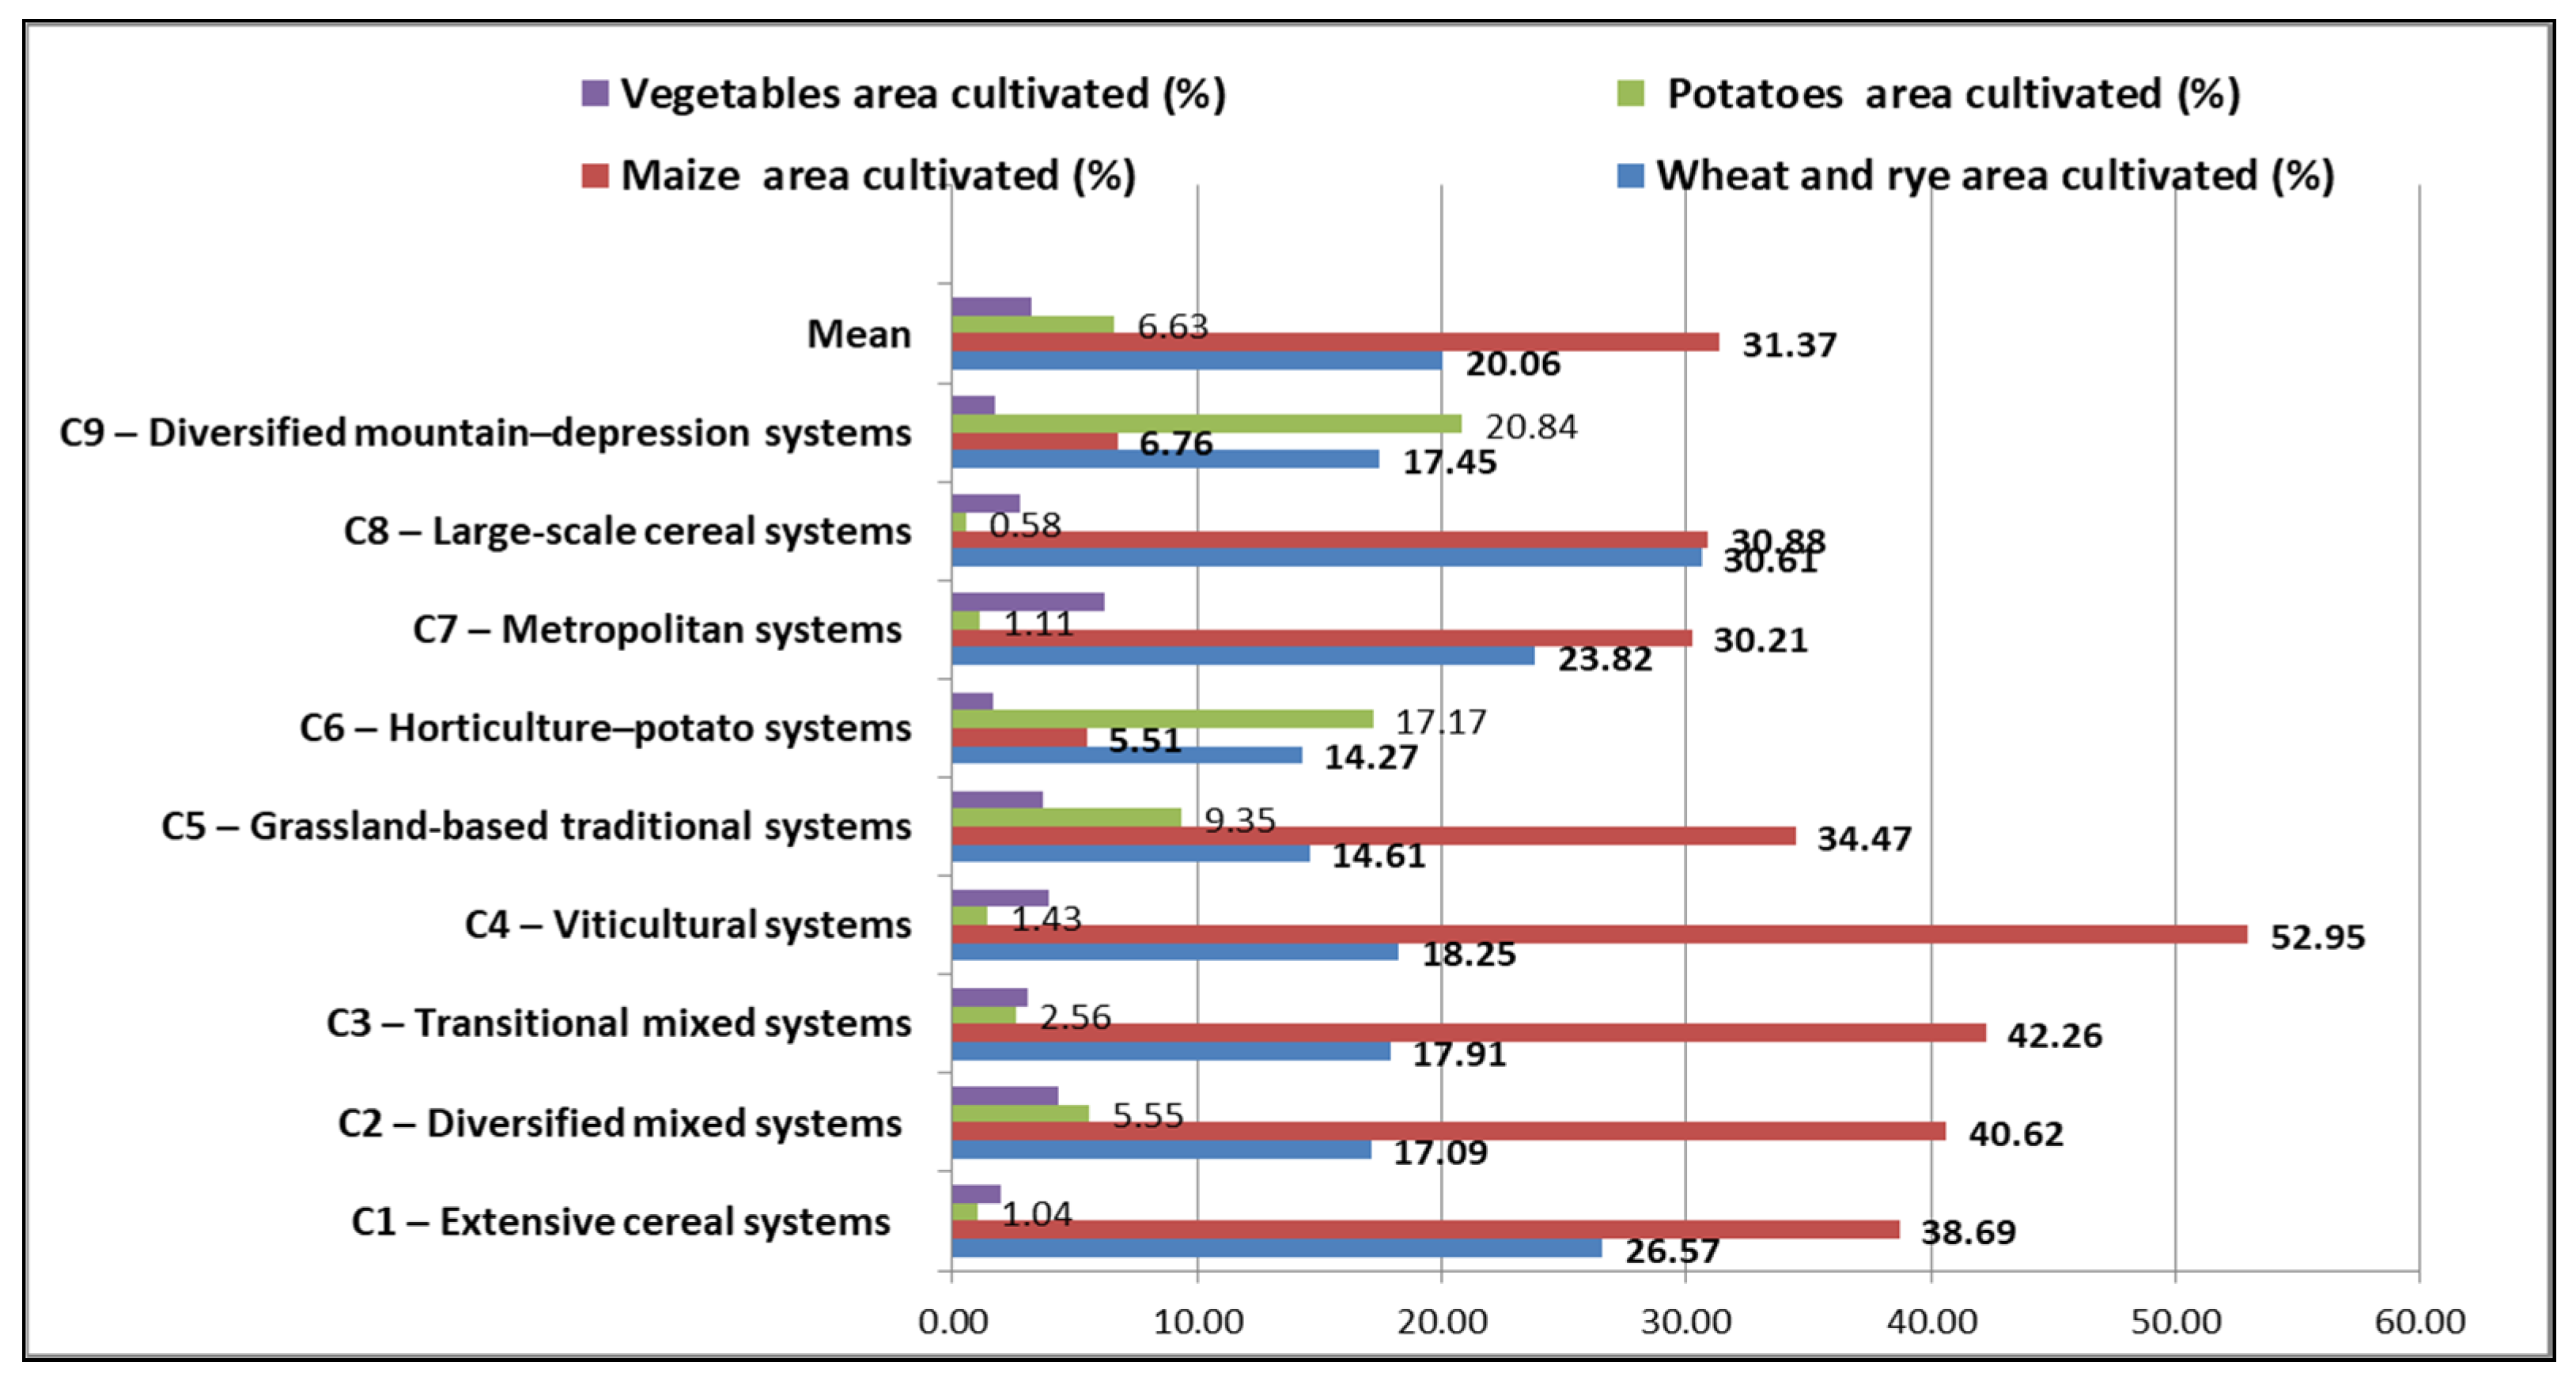
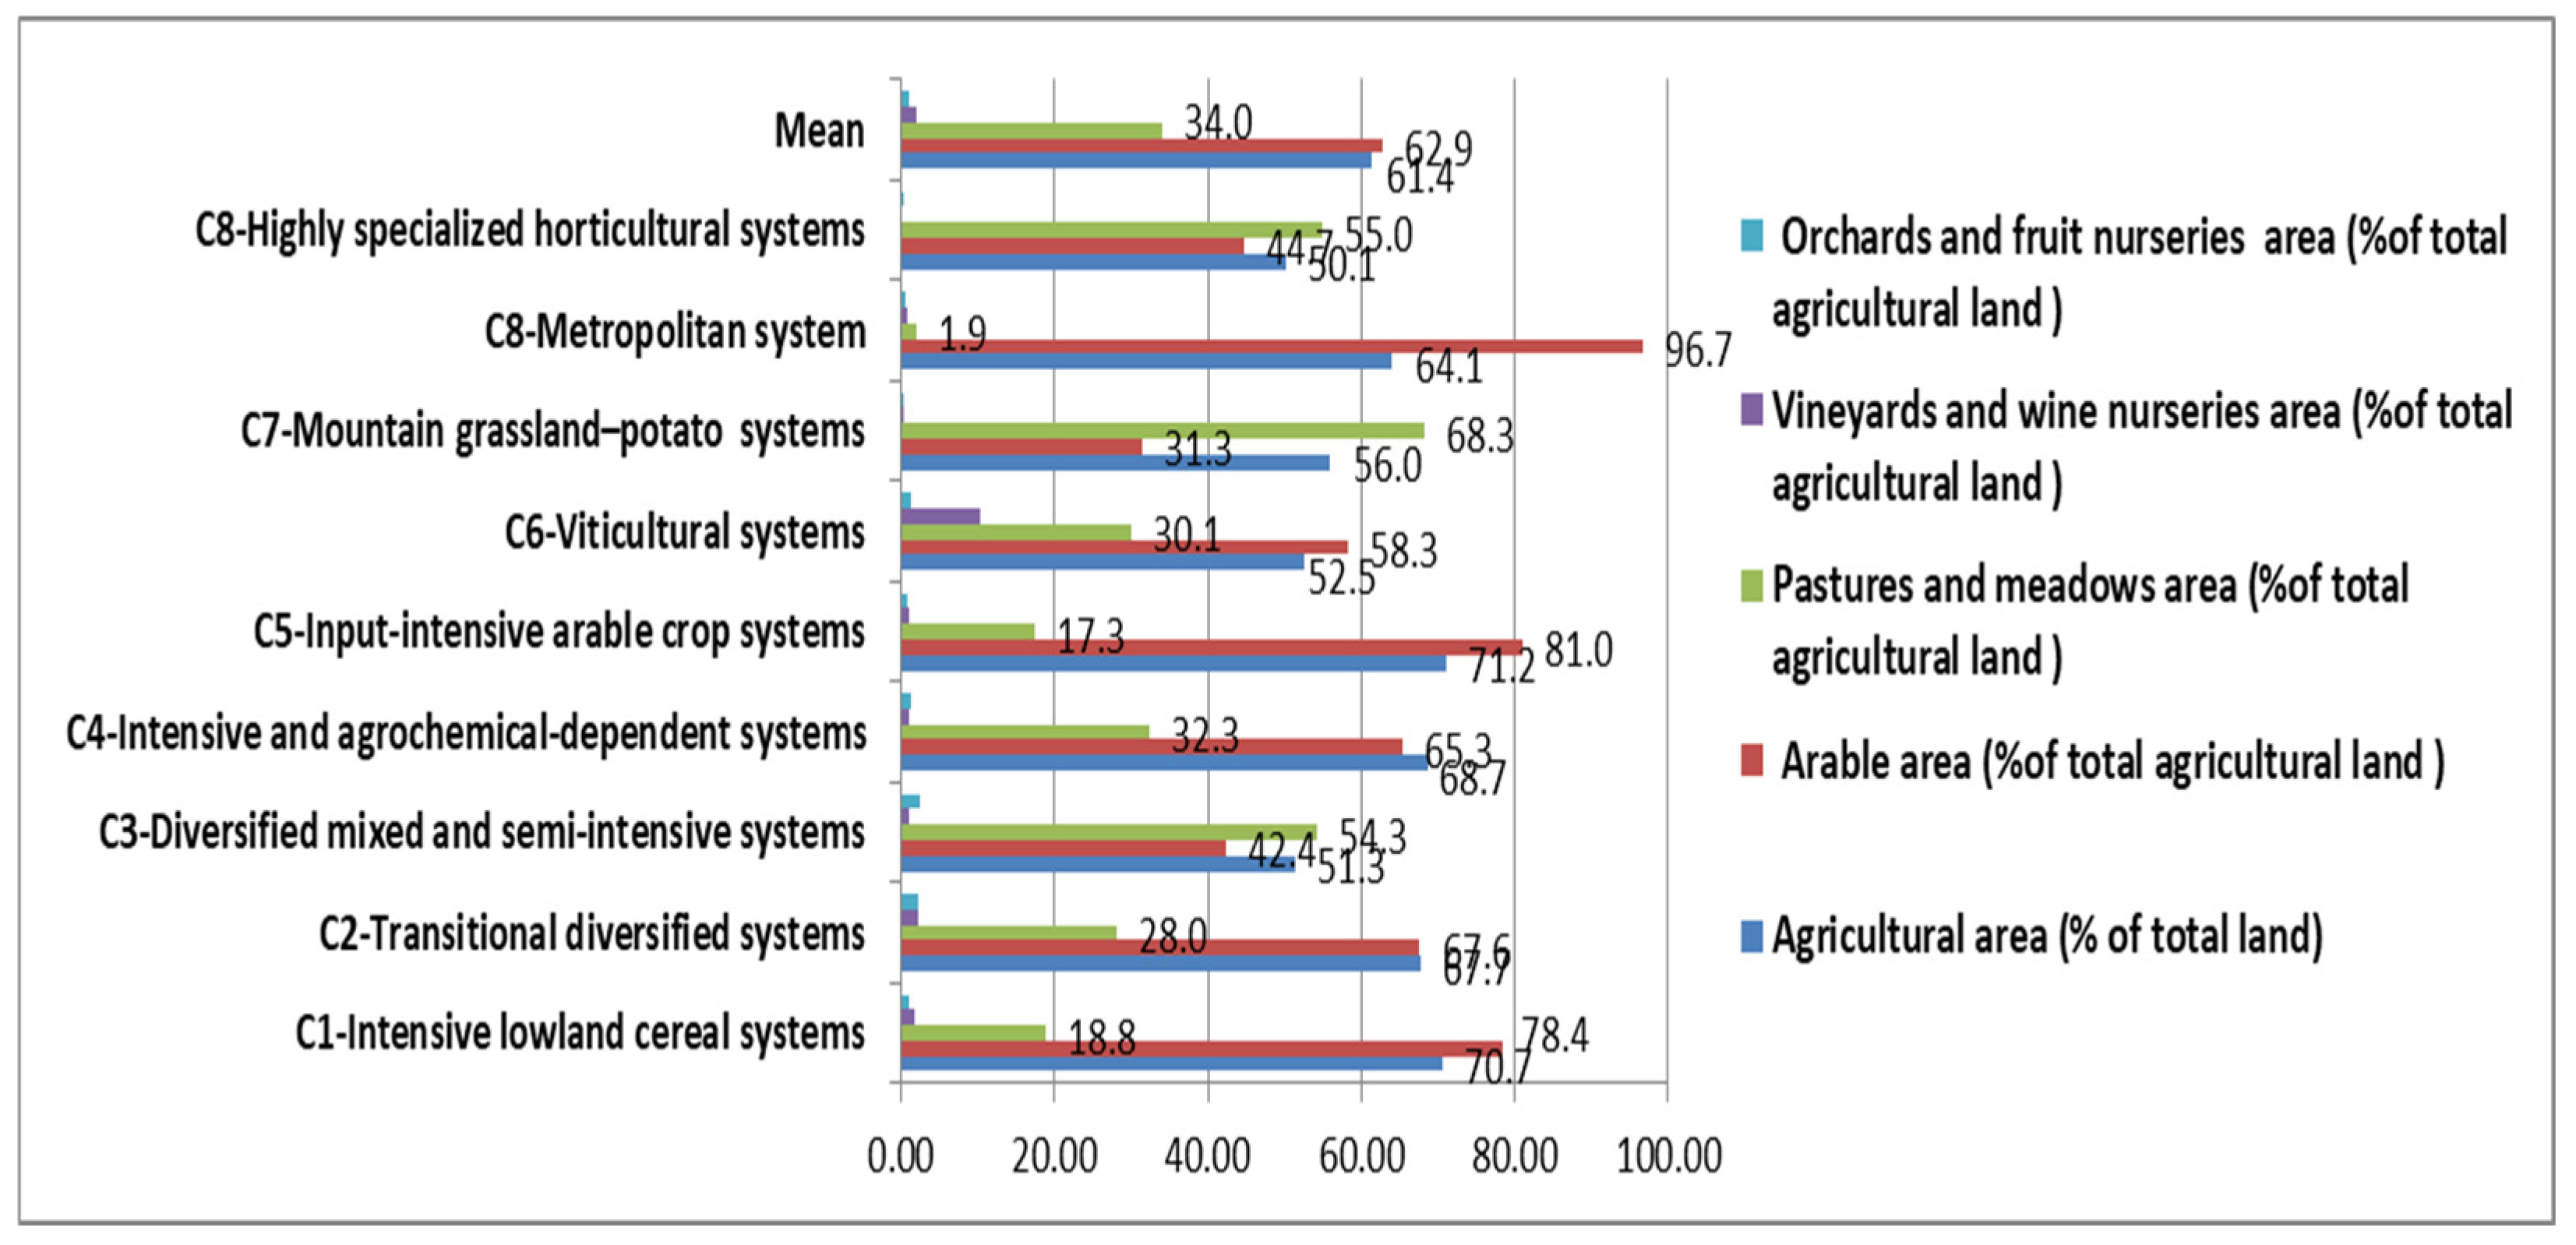
Cluster 1 (Extensive cereal-based agricultural systems) includes six counties, in 2000, and is defined by a high share of arable land and strong cereal specialization (Table 10; Figure 6a, Figure 7, Figure 8 and Figure 9). Crop production is dominated by wheat, rye, and maize, with limited diversification. Irrigation is relatively developed, while pesticide use remains moderate. High agricultural employment combined with low labour productivity reflects labour-intensive production structures. These systems are typical of lowland regions and represent extensive cereal-based agriculture undergoing partial modernization.
Cluster 2 (Diversified mixed farming systems) includes eight counties and is associated with positive PC1 and PC2 values (Figure 6a and Table 10), indicating diversified agricultural systems with relatively higher labour productivity. Pastures account for a substantial share of agricultural land, while maize remains an important crop. Compared with Cluster 1, higher shares of vegetables and orchards reflect greater diversification (Figure 7, Figure 8 and Figure 9). The relatively high use of natural fertilizers suggests the persistence of traditional soil management practices. Agricultural employment is lower (34.11%), while labour productivity is moderately higher, indicating transitional farming systems characterized by intermediate levels of modernization and more diversified rural economies.
Cluster 3 (Transitional cereal–mixed farming systems) includes nine counties characterized by high shares of agricultural and arable land, alongside a moderate presence of pastures, reflecting mixed farming systems (Figure 6a, Figure 7, Figure 8 and Figure 9). Maize is the dominant crop, followed by wheat and rye, while vegetables and potatoes contribute to a diversified production profile. Moderate mechanization and limited irrigation indicate continued dependence on rainfed agriculture. This cluster represents transitional agroecosystems combining arable intensity with persistent mixed farming characteristics and moderate productivity, typical of eastern and western Romanian counties undergoing gradual agricultural modernization.
Represented by Vrancea County, Cluster 4 (Specialized viticultural systems) is distinguished by the highest vineyard share in the country and intensive pesticide use (Table 10; Figure 7 and Figure 8). Vineyards occupy 10.9% of agricultural land, while agricultural employment (54.83%) and the contribution of agriculture to GVA (33.21%) remain among the highest nationally. Relatively high labour productivity further highlights the economic importance of viticulture. The cluster represents a highly specialized perennial-crop system characterized by strong territorial identity and intensive management practices.
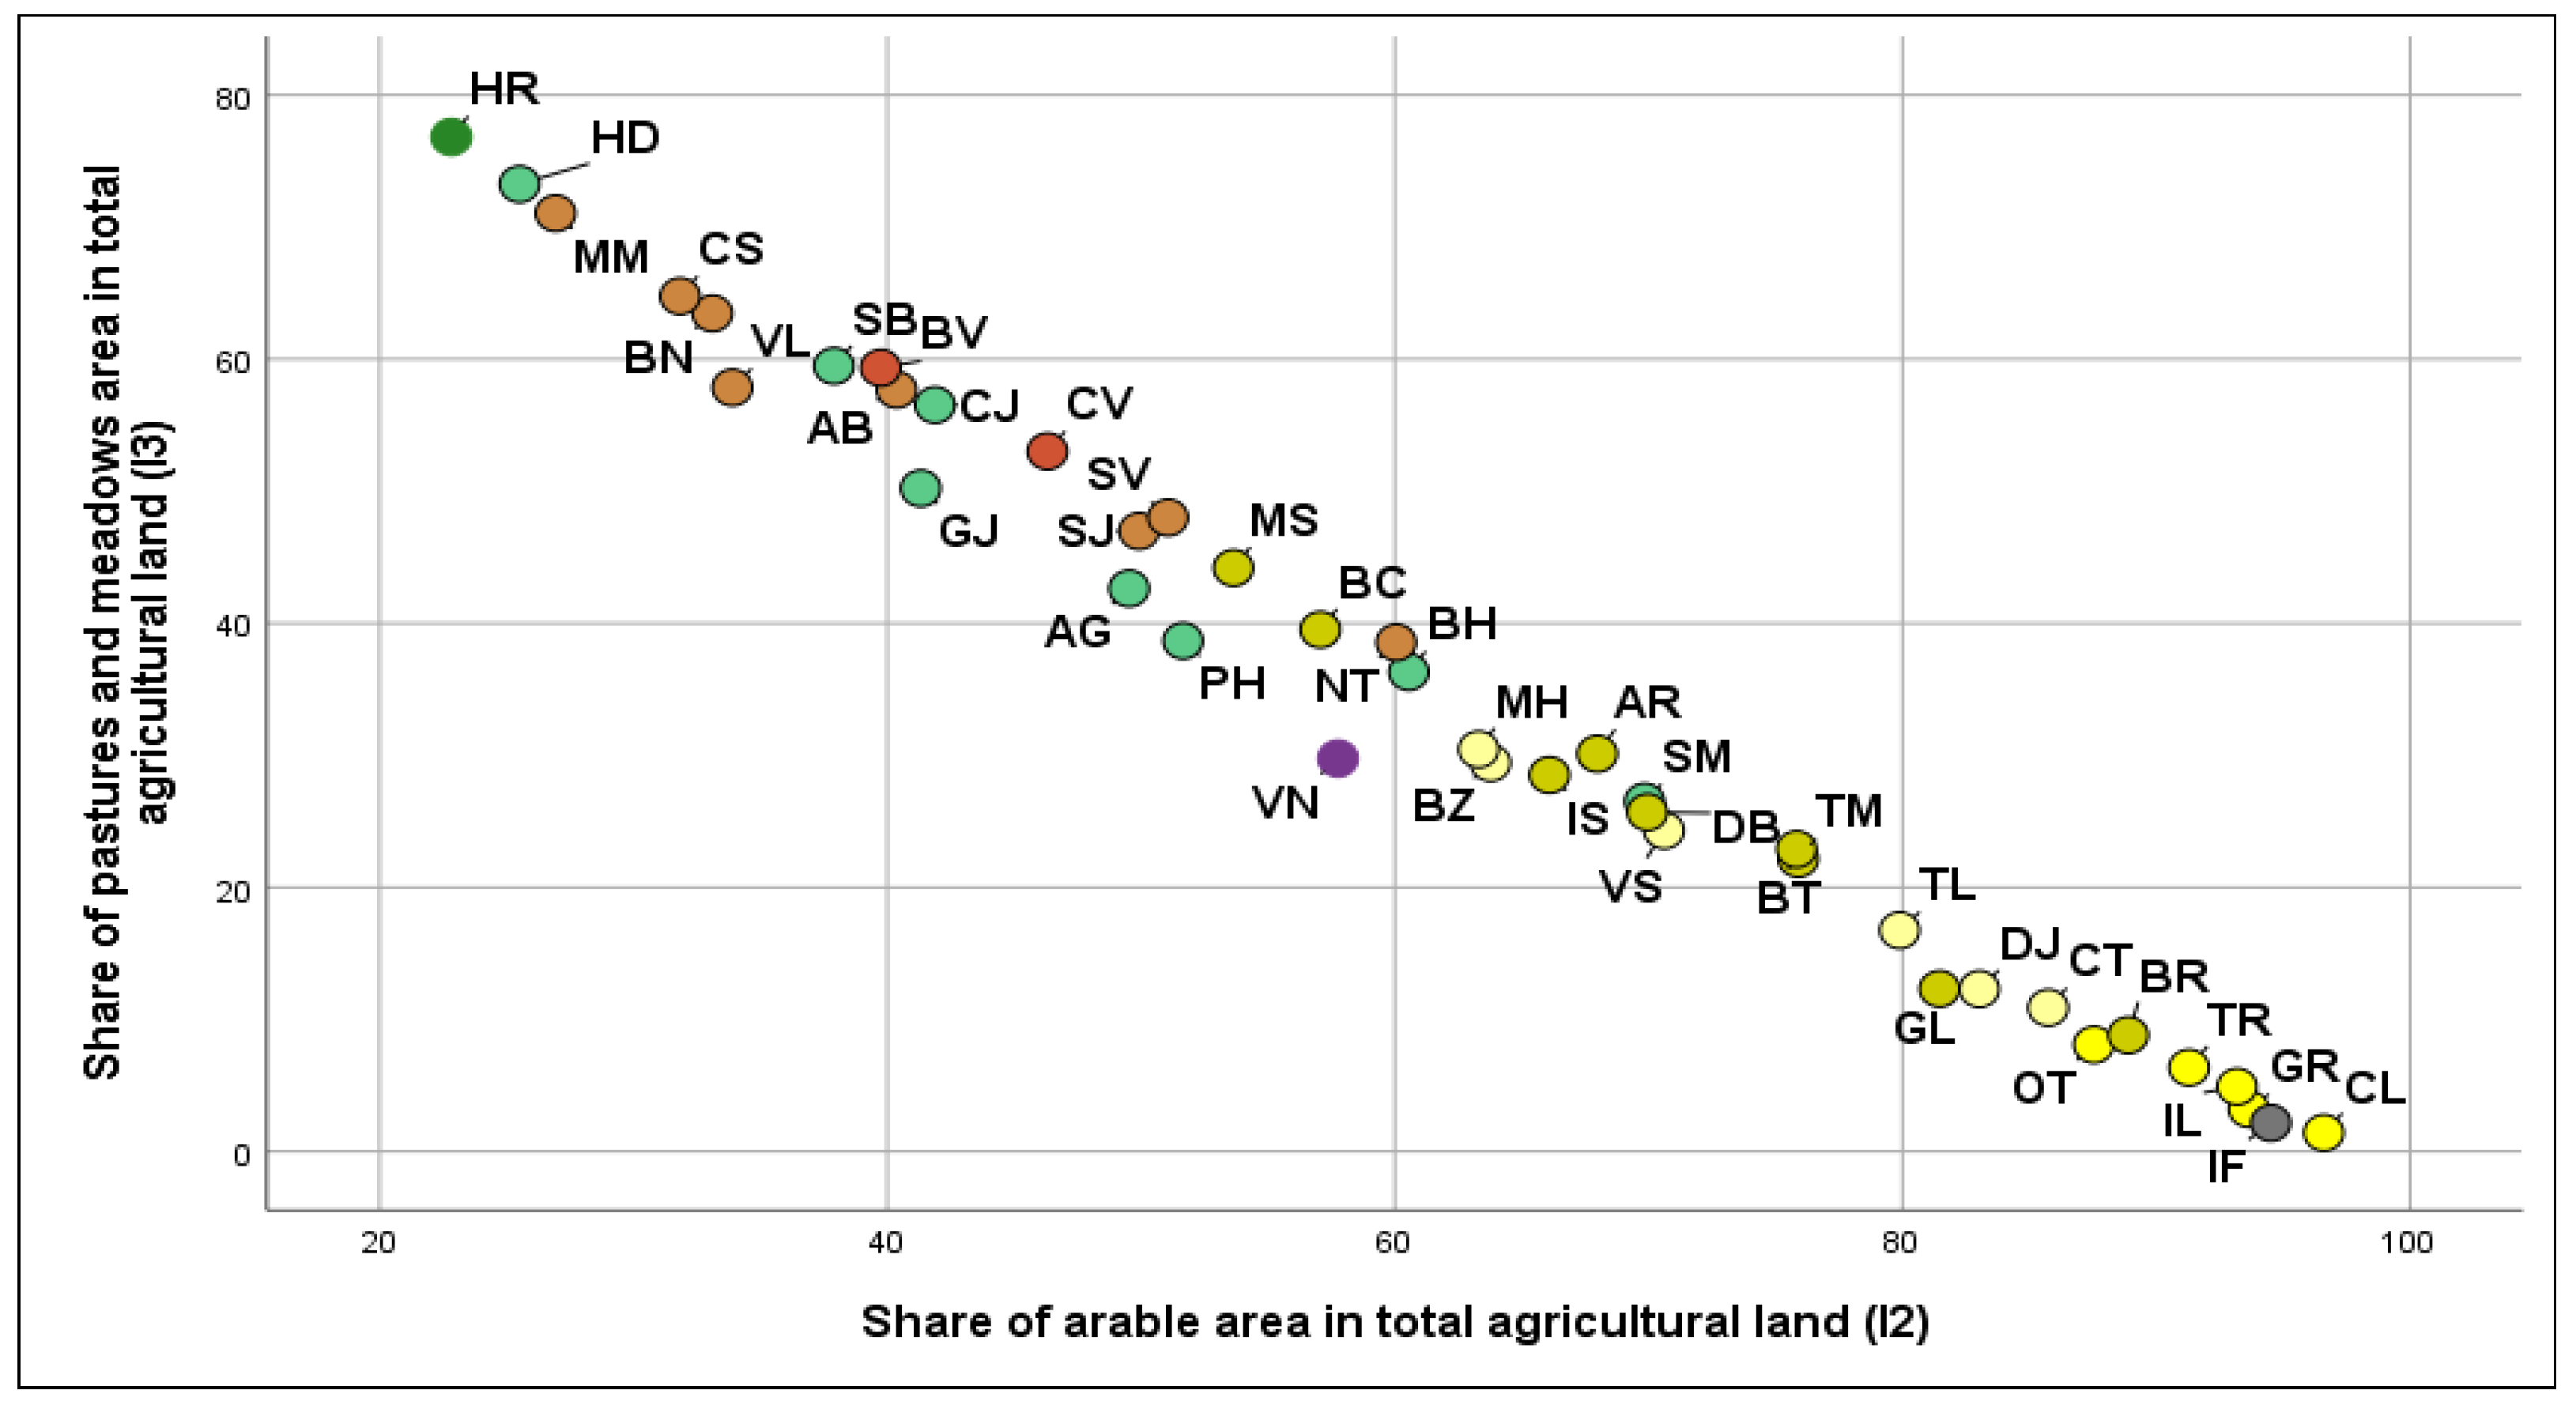
Cluster 5 (Grassland-based traditional agricultural systems) includes eight counties dominated by pastures and meadows, which account for more than half of agricultural land (Figure 6a, Figure 7, Figure 8 and Figure 9). Potato cultivation remains relatively important, reflecting the persistence of subsistence-oriented farming systems. High agricultural employment, low mechanization, limited irrigation, and substantial use of natural fertilizers indicate traditional agricultural practices. Concentrated in mountainous and sub-Carpathian regions, this cluster represents labour-intensive systems with strong structural constraints and low intensification levels.
Represented by Harghita County, Cluster 6 is characterized by strong specialization in potato production and extensive grassland use. Pastures account for the highest share among all clusters (76.82%), while potato cultivation remains particularly important (Figure 7, Figure 8 and Figure 9). Natural fertilizer use is also the highest nationally, reflecting the persistence of traditional management practices. Despite these characteristics, relatively high labour productivity indicates an efficient and locally adapted production system based on specialized horticulture.
Cluster 7 (Metropolitan and highly modernized agricultural systems), represented by Ilfov County, is characterized by very high labour productivity, advanced mechanization, and strong market integration (Table 10). The agricultural structure is strongly influenced by Bucharest’s metropolitan expansion and market integration, resulting in highly capitalized, commercially oriented, and technologically advanced farming systems.
Cluster 8 (Large-scale cereal-dominated arable systems) includes five counties characterized by strong arable dominance and cereal specialization (Figure 6a, Figure 7, Figure 8 and Figure 9). Wheat, rye, and maize account for the majority of cultivated land, while irrigation infrastructure is more developed than the national average. Mechanization levels are relatively high, although labour productivity remains only moderate. These counties, located mainly in the southern Romanian Plain, represent large-scale commercial cereal systems characterized by structural specialization and partial technological modernization.
Cluster 9 (Diversified productive mountain–depression agricultural systems) comprises two counties and is characterized by a balanced combination of grassland-based agriculture, potato cultivation, and relatively advanced mechanization (Table 10, Figure 6a, Figure 7, Figure 8 and Figure 9). Labour productivity is comparatively high, while the continued use of natural fertilizers indicates the persistence of traditional farming practices. Located in central Romanian mountain–depression landscapes, these agroecosystems combine diversification with moderate to advanced modernization and represent one of the most productive mountain agricultural typologies identified in 2000.
The cluster analysis identifies nine distinct agricultural typologies characterized by significant differences in land-use structure, production specialization, technological development, and socio-economic performance. Spatially, cereal-dominated systems prevail in lowland regions, while grassland-based and mixed farming systems are concentrated in mountainous and sub-Carpathian areas. Specialized clusters, such as the viticultural, horticultural, and metropolitan systems, reflect localized pathways of agricultural development. Overall, the 2000 cluster structure reveals a highly heterogeneous and transitional agricultural landscape, confirming the strong spatial differentiation identified by the PCA and providing a baseline for assessing subsequent transformations observed in 2024.
Figure 6b shows the spatial distribution of the nine agricultural clusters identified in 2024. Compared with 2000, the cluster structure reveals greater functional differentiation and stronger spatial polarization, reflecting ongoing processes of intensification, specialization, and technological modernization. Lowland counties are increasingly dominated by intensive cereal production, whereas mountain regions remain associated with grassland-based systems. At the same time, specialized viticultural, horticultural, and metropolitan agricultural systems emerge as clearly differentiated territorial typologies.
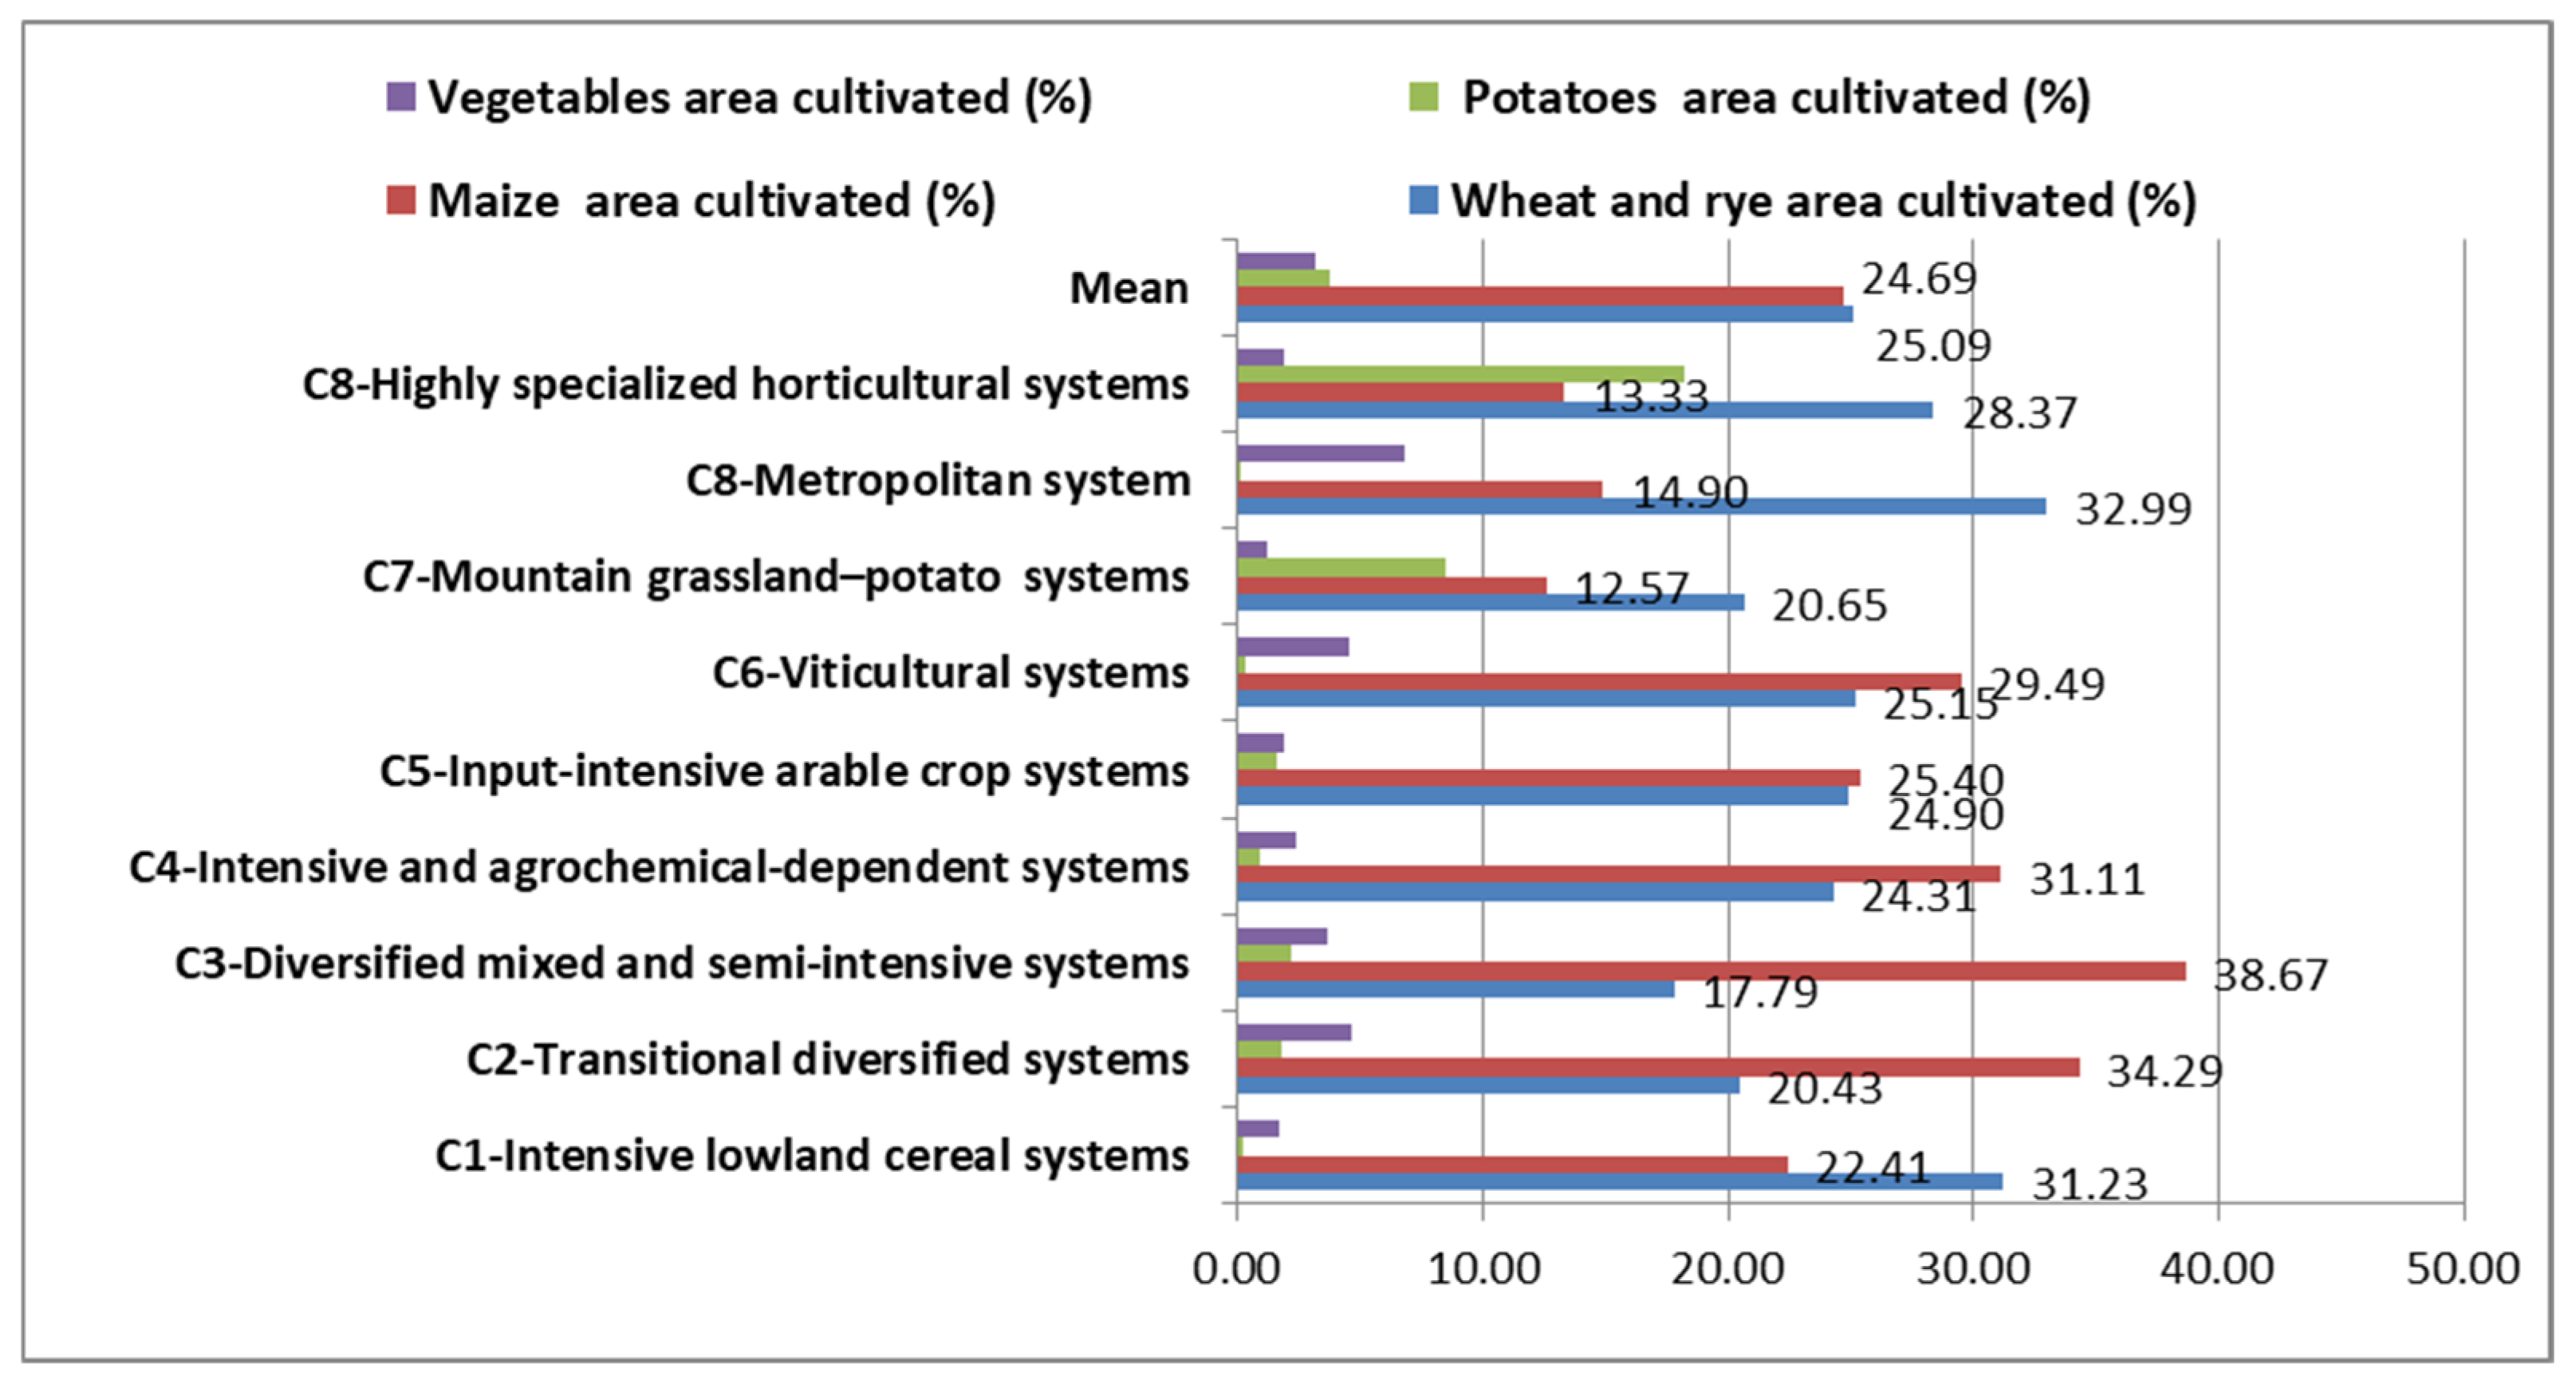
In 2024, cluster 1 (Intensive lowland cereal systems) includes eleven counties and is characterized by strongly arable-dominated landscapes (Table 10; Figure 6b, Figure 10, Figure 11 and Figure 12). Wheat and rye account for the highest share among all clusters (31.23%), while maize remains important. Grasslands and horticultural crops are limited. Relatively developed irrigation and moderate mechanization support cereal production, while declining agricultural employment (37.94%) reflects ongoing consolidation and modernization. The cluster represents highly commercialized cereal-based systems typical of the Romanian Plain and Dobrogea.
Cluster 2 (Transitional diversified agricultural systems) comprises three counties and is characterized by diversified production structures and comparatively high levels of modernization (Table 10; Figure 6b, Figure 10, Figure 11 and Figure 12). Although arable land predominates, grasslands remain significant. Compared with Cluster 1, higher shares of orchards, vegetables, and maize indicate greater diversification. High mechanization (25.35 tractors per 1000 ha) and labour productivity, combined with low agricultural employment (19.21%), reflect efficient and increasingly market-oriented agricultural systems undergoing advanced structural transformation.
Comprising thirteen counties, Cluster 3 (Diversified mixed and semi-intensive systems) represents the most widespread agricultural typology in Romania (Figure 6b). The cluster is characterized by a balanced combination of arable land and grasslands (Table 10; Figure 10 and Figure 11). Maize remains the dominant crop, while orchards and vegetables contribute to diversification (Figure 12). Relatively advanced mechanization, combined with limited irrigation, indicates semi-intensive agricultural systems undergoing gradual modernization and productivity improvements.
Cluster 4 (Intensive modernized and agrochemical-dependent systems) includes four counties distinguished by high productivity, strong mechanization, and intensive use of chemical inputs (Table 10, Figure 6b). Agricultural land is dominated by arable crops, particularly wheat and maize, while grasslands remain of secondary importance (Figure 10, Figure 11 and Figure 12). Productivity levels are among the highest nationally, supported by relatively high mechanization and intensive fertilizer and pesticide use. Agricultural employment is comparatively low, indicating a technologically advanced and commercially oriented production model. This cluster represents technologically advanced and highly commercialized agricultural systems where intensification is largely supported by agrochemical inputs.
Cluster 5 (Productive and input-intensive arable crop systems) comprises five counties and is characterized by arable-dominated landscapes undergoing advanced intensification and modernization (Table 10). Wheat, rye, and maize dominate the crop structure, while grasslands remain limited (Figure 10, Figure 11 and Figure 12). Irrigation infrastructure is among the most developed nationally, supporting relatively high productivity levels. A distinctive feature of this cluster is the combined use of chemical and organic fertilizers, reflecting mixed input-use strategies and improved resource management. Overall, these counties represent highly productive cereal-based systems characterized by advanced intensification, technological development, and strong agricultural performance.
Represented by Vrancea County, Cluster 6 (Specialized viticultural systems) remains strongly differentiated by vineyard specialization and intensive management. Vineyards account for 10.27% of agricultural land, while pesticide use remains the highest among all clusters. High mechanization and labour productivity, combined with declining agricultural employment, indicate increasing efficiency. This cluster reflects a highly specialized viticultural landscape with a strong territorial identity and long-term production specialization.
Cluster 7 (Mountain grassland and potato agricultural systems) includes two counties characterized by extensive grasslands, which account for over two-thirds of agricultural land (Table 10, Figure 6b, Figure 10, Figure 11 and Figure 12). Potato cultivation remains an important specialization, while irrigation is minimal due to environmental constraints. High mechanization and labour productivity suggest partial modernization despite the persistence of extensive land-use patterns. The cluster represents mountain agroecosystems combining traditional grassland management with increasing production efficiency.
Represented by Ilfov County, Cluster 8 (Metropolitan and peri-urban agricultural system) exhibits the highest level of agricultural modernization. Arable land accounts for nearly all agricultural land, while vegetable production reaches the highest share nationally, reflecting strong market orientation (Figure 10, Figure 11 and Figure 12). Labour productivity is exceptionally high, and agricultural employment extremely low (1.95%). Proximity to Bucharest has fostered highly mechanized, capital-intensive, and market-integrated agricultural systems.
Represented by Covasna County, Cluster 9 (Highly specialized horticultural systems) is characterized by strong specialization in potato production and exceptionally high mechanization (Table 10). Potato yields, natural fertilizer use, and labour productivity are among the highest nationally. The coexistence of intensive production and extensive grasslands reflects adaptation to mountain–depression environments. This cluster represents one of the most productive and specialized horticultural systems in Romania.
To further highlight structural changes in Romanian agriculture, a comparative analysis between the 2000 and 2024 clustering patterns was conducted.
The comparison between 2000 and 2024 reveals a clear transformation of Romanian agricultural systems toward greater specialization, intensification, and spatial polarization. While the 2000 structure is characterized by heterogeneous, transitional, and multifunctional systems, the 2024 configuration shows more clearly differentiated agroecosystem types and stronger functional specialization.
First, cereal-based systems have expanded and become more consolidated. Cluster 1 in 2024 (11 counties) represents the consolidation of the extensive cereal systems identified in 2000, with higher shares of arable land (78.45% vs. 74.39%) and stronger specialization in wheat and rye (31.23% vs. 26.57%). This transformation is accompanied by declining agricultural employment (37.94% vs. 58.65%) and improved productivity. Similarly, large-scale arable systems (Cluster 8) persist, showing partial efficiency gains, although productivity disparities remain.
Second, diversified and mixed systems undergo clear intensification and modernization. Clusters 2 and 3 in 2024 reflect the transformation of mixed and transitional systems into more efficient and semi-intensive forms, characterized by higher labour productivity and significantly lower employment. Mechanization increases substantially, while crop diversification is maintained or strengthened.
Third, high-performance, input-intensive systems emerge more clearly. Clusters 4 and 5 illustrate advanced modernization, with higher yields, increased agrochemical use, and strong productivity gains compared to the more moderate systems observed in 2000, highlighting a shift toward technologically driven agriculture.
Fourth, specialized systems (viticulture and horticulture) remain stable but intensify. Cluster 6 (Vrancea) preserves its viticultural identity, with continued vineyard dominance but lower employment and higher productivity. Similarly, horticultural and potato systems (Cluster 9) exhibit increased mechanization and productivity, indicating deepening specialization.
Fifth, mountain systems have evolved from traditional extensive structures toward partially modernized agricultural systems. Compared to 2000 grassland-based systems, Cluster 7 in 2024 shows substantially higher productivity and lower employment, although structural constraints such as limited irrigation and high pasture shares persist.
Finally, new highly specialized systems emerge, most notably the metropolitan cluster (Ilfov), which has no direct equivalent in 2000. With very high labour productivity and minimal agricultural employment, this cluster reflects strong urban influence, market integration, and advanced commercialization.
Compared with 2000, the 2024 cluster structure reveals greater specialization, clearer functional differentiation, and stronger spatial polarization of agricultural systems. The expansion of cereal-dominated lowland regions, together with the emergence of highly productive and input-intensive systems, reflects ongoing processes of modernization and market integration. At the same time, traditional grassland-based agriculture persists in mountainous areas, highlighting the uneven nature of agricultural transformation across Romanian regions.
The observed spatial patterns are likely to reflect the combined influence of Common Agricultural Policy (CAP) implementation, post-socialist restructuring, technological modernization, and broader socio-economic transformations. CAP support measures, rural development programmes, and investment incentives have facilitated the modernization of agricultural production, particularly in regions characterized by favourable agro-climatic conditions and larger farm structures [7,8,24,34,55,56]. In parallel, increasing market integration, improved access to agricultural technologies, and structural adjustments associated with European integration have contributed to the consolidation of more competitive production systems. Conversely, mountain and peripheral regions continue to face structural constraints, including fragmented land ownership, demographic decline, and lower investment intensity, which have limited the pace of agricultural modernization [4,5,22,24]. These contrasting conditions have contributed to increasingly differentiated regional development pathways and the territorial concentration of agricultural competitiveness.
These findings are consistent with previous research on agricultural transformation in Central and Eastern Europe, which highlights increasing specialization, agricultural intensification, structural adjustment, and growing spatial differentiation of rural landscapes [7,8,14,16,37,38,39]. The emergence of highly productive cereal-based systems, specialized viticultural and horticultural clusters, and technologically advanced metropolitan agriculture reflects broader processes of modernization and market integration observed across post-socialist agricultural systems. At the same time, the persistence of grassland-based agricultural systems in mountainous regions confirms the continuing influence of environmental constraints, historical land-use legacies, and path-dependent development trajectories [5,6]. Similar patterns have been documented across the European Union, where agricultural systems exhibit strong regional differentiation driven by the interaction of agro-ecological conditions, market opportunities, and structural characteristics [23,52]. The coexistence of highly modernized commercial agriculture alongside traditional and less intensive farming systems further reflects the dual nature of agricultural development, a feature widely reported in Romania and other Central and Eastern European countries [20,23,26,51]. Consequently, the identified cluster structure highlights not only increasing specialization and modernization but also growing spatial polarization, reinforcing the view that agricultural transformation is both dynamic and territorially uneven.
Taken together, the clustering results confirm increasing regional differentiation and the consolidation of distinct agricultural development pathways. These findings provide strong empirical support for Hypothesis H2, demonstrating that Romanian agricultural landscapes are characterized by increasingly specialized and spatially differentiated agroecosystem typologies shaped by uneven processes of modernization, intensification, and market integration.

5. Conclusions and Policy Implications

5.1. Conclusions

This study provides a comprehensive assessment of agricultural landscape transformation in Romania between 2000 and 2024 by integrating statistical analysis, principal component analysis, and cluster analysis. The results reveal profound changes in the structure and functioning of agricultural systems, characterized by increasing specialization, technological intensification, and spatial differentiation.
Significant transformations were identified in land-use patterns, crop structure, productivity, mechanization, and socio-economic indicators. The expansion of arable land and cereal-based production, together with rising labour productivity and mechanization levels, reflects a shift toward more efficient and market-oriented agricultural systems. Conversely, the decline of permanent crops and diversified small-scale farming points to increasing simplification of agricultural landscapes.
The analysis also demonstrates that agricultural transformation has been highly uneven across space. Distinct agricultural typologies emerged, ranging from highly productive and input-intensive systems in lowland regions to traditional grassland-based systems in mountain areas. The coexistence of these contrasting systems highlights the dual character of Romanian agriculture and the persistence of significant regional disparities.
The comparative analysis between 2000 and 2024 further demonstrates that these trends have intensified over time, resulting in greater functional specialization, clearer territorial differentiation, and stronger spatial polarization. Agricultural development pathways increasingly reflect differences in technological adoption, market integration, and local environmental conditions.
Overall, the findings provide strong empirical support for both research hypotheses. Hypothesis H1 is confirmed through the identification of significant temporal changes in agricultural structure and function, while Hypothesis H2 is validated by the clear evidence of spatial heterogeneity and differentiated agroecosystem typologies across Romanian counties.
Beyond the Romanian case, the study contributes to a broader understanding of agricultural restructuring in Central and Eastern Europe. Its main contribution lies in the development of an integrated and transferable analytical framework that combines structural, functional, technological, socio-economic, and agri-environmental indicators with multivariate statistical techniques. By linking long-term temporal comparison with the construction of agricultural typologies, the study provides a methodological approach that can support comparative analyses of agricultural transformation, spatial polarization, and regional differentiation in other European regions undergoing similar restructuring processes.

5.2. Policy Implications

The findings of this study have potential implications for agricultural and rural development policies, particularly in the context of the European Union’s Common Agricultural Policy and broader sustainability objectives. However, the results should be interpreted as identifying patterns of association rather than establishing causal relationships between agricultural characteristics and policy outcomes. Furthermore, given the regional scale of the analysis, the policy implications discussed below are intended to inform strategic territorial planning and agricultural development strategies rather than site-specific interventions or farm-level interventions.
First, the observed increase in agricultural specialization and intensification highlight the importance of balancing productivity objectives with broader sustainability considerations. The growing prevalence of cereal-based systems and changes in agri-environmental management practices are consistent with policy debates concerning sustainable intensification, crop diversification, precision agriculture, and agroecological approaches. Previous empirical studies have shown that agricultural diversification, agroecological management, and sustainability-oriented CAP instruments can improve the resilience and long-term sustainability of agricultural systems while mitigating some of the environmental pressures associated with intensification [17,35,36,39].
Second, the strong spatial differentiation identified across Romanian counties suggests that uniform policy approaches may be less suitable for addressing the diversity of agricultural development pathways. The observed heterogeneity of agricultural structures and regional specializations is consistent with previous studies highlighting significant territorial disparities in agricultural performance, resource endowments, and rural development across Romania and the European Union [9,23,24,27]. These findings support arguments in favour of place-based and territorially differentiated policy approaches that account for regional socio-economic and environmental conditions [23,24].
Third, the persistence of dual agricultural structures observed in the cluster analysis underscores that disparities between highly modernized commercial farms and smaller agricultural holdings remain an important feature of Romanian agriculture. Existing literature emphasizes that access to capital, technological innovation, knowledge transfer, and cooperative arrangements are important determinants of farm competitiveness, productivity, and long-term viability [7,18,25,26]. The patterns identified in this study are consistent with these findings and suggest that such factors may play a role in reducing structural inequalities within the agricultural sector.
Fourth, the observed improvements in productivity combined with reduced input use suggest opportunities for enhancing resource-use efficiency and promoting sustainable agricultural practices. Previous empirical research [18,20,21,36] has shown that digitalization, precision agriculture, and the adoption of innovative farming practices can improve resource-use efficiency while supporting agricultural productivity and competitiveness.
Finally, the emergence of highly modernized and peri-urban agricultural systems highlights the growing importance of urban–rural linkages and market integration. The observed patterns suggest that local value chains, regional food networks, and agricultural market access may become increasingly relevant for agricultural development. However, further research is needed to assess the effectiveness of specific policy interventions designed to support these processes.
Despite its contributions, this study has several limitations. First, the analysis is based on only two reference years (2000 and 2024), allowing the assessment of long-term net change but not the reconstruction of intermediate trajectories, non-linear developments, or path-dependent transformation processes. Second, although the analysis incorporates agri-environmental indicators related to irrigation, fertilizer use, and pesticide application, direct measures of biodiversity, ecosystem services, soil quality, greenhouse-gas emissions, and climate resilience were not available at the county level for both reference years. Consequently, the study evaluates environmental pressures and management practices rather than environmental outcomes, and any ecological implications should be interpreted as hypotheses informed by previous research rather than direct empirical findings. Third, the county-level (NUTS 3) scale may conceal substantial intra-county heterogeneity in agricultural systems and landscape characteristics. Therefore, the identified typologies should be interpreted as broad regional patterns and are most appropriate for strategic territorial planning rather than local-scale policy design. Finally, irrigation variables could not be formally incorporated into the PCA and cluster analyses because of incomplete data availability across counties. Although these indicators were considered separately during cluster interpretation, future research should explore alternative approaches, including data imputation and sensitivity analyses, to assess more explicitly the influence of irrigation on agricultural typologies. Future studies would also benefit from incorporating finer spatial scales, additional environmental indicators, and multiple intermediate observation periods to provide a more comprehensive understanding of agricultural transformation and its sustainability implications.

Funding

This research received no external funding.

Data Availability Statement

The data used in this article were obtained from publicly available sources, including the Romanian National Institute of Statistics (TEMPO-Online database) and Eurostat regional statistics databases [40,41,42,43]. The derived county-level dataset used for the analyses is available from the corresponding author upon request.

Conflicts of Interest

The author declare no conflicts of interest.

References

  1. European Commission (EC). 2023 Approved 28 CAP Strategic Plans (2023–2027). Summary Overview for 27 Member States Facts and Figures. Available online: https://agriculture.ec.europa.eu/system/files/2023-06/approved-28-cap-strategic-plans-2023-27.pdf (accessed on 20 March 2026).
  2. European Commission (EC). The European Green Deal. Striving to Be the First Climate-Neutral Continent. Available online: https://commission.europa.eu/strategy-and-policy/priorities-2019-2024/european-green-deal_en (accessed on 20 March 2026).
  3. European Commission. European Commission at a Glance: Romania’s CAP Strategic Plan, 2026. Available online: https://agriculture.ec.europa.eu/document/download/0c93098c-927c-4691-8c4d-8225fa5dfde5_en?filename=csp-at-a-glance-romania_en.pdf (accessed on 20 May 2026).
  4. Dogaru, D.; Petrisor, A.I.; Angearu, C.V.; Lupu, L.; Bălteanu, D. Land governance and fragmentation patterns of agricultural land use in southern Romania during 1990–2020. Land 2024, 13, 1084. [Google Scholar] [CrossRef]
  5. Urșanu, E.A.; Grigorescu, I.; Dumitrică, C.; Kucsicsa, G.; Mitrică, B.; Roznovietchi, I.; Ciubuc, C. Long-Term Changes of Agricultural Land over the Last Century in Romania: The Showcase of Romanian Plain. Anthropocene 2024, 48, 100449. [Google Scholar] [CrossRef]
  6. Plieninger, T.; Draux, H.; Fagerholm, N.; Bieling, C.; Bürgi, M.; Kizos, T.; Verburg, P.H. The Driving Forces of Landscape Change in Europe: A Systematic Review of the Evidence. Land Use Policy 2016, 57, 204–214. [Google Scholar] [CrossRef]
  7. Ciaian, P.; Drabik, D.; Falkowski, J.; Pokrivčák, J. Structural Change and Productivity in Agriculture in the EU. Econ. Syst. 2018, 42, 598–610. [Google Scholar]
  8. Rizov, M.; Pokrivčák, J.; Ciaian, P. CAP Subsidies and Productivity in Agriculture: Evidence from EU Member States. Agric. Econ. 2020, 51, 701–717. [Google Scholar]
  9. Kołodziejczak, A. Labour Productivity and Structural Changes in Agriculture in Central and Eastern Europe. East. Eur. Countrys. 2020, 26, 25–45. [Google Scholar]
  10. Radlińska, K. Changes in the Structure of Agriculture in Central and Eastern Europe in the Light of the European Green Deal. Sustainability 2024, 17, 104. [Google Scholar] [CrossRef]
  11. Kryszak, Ł.; Herzfeld, T. One or many European models of agriculture? How heterogeneity influences income creation among farms in the European Union. Agric. Econ. 2021, 67, 445–456. [Google Scholar] [CrossRef]
  12. Kupková, L.; Boudný, Z. Landscape transformation in Czechia over the last 30 years: Diversity of changes on two spatial levels. J. Maps 2025, 21, 2468488. [Google Scholar] [CrossRef]
  13. Masny, M.; Zausková, L. Multi-temporal analysis of an agricultural landscape transformation and abandonment (L’ubietová, Central Slovakia). Open Geosci. 2015, 7, 888–896. [Google Scholar] [CrossRef]
  14. Prokopová, M.; Cudlín, O.; Včeláková, R.; Lengyel, S.; Salvati, L.; Cudlín, P. Latent Drivers of Landscape Transformation in Eastern Europe: Past, Present and Future. Sustainability 2018, 10, 2918. [Google Scholar] [CrossRef]
  15. Rusu, M. Main Factors of Agricultural Land Use Change in Romania: A Territorial Analysis. In Agrarian Economy and Rural Development—Trends and Challenges, Proceedings of the 14th International Symposium, Bucharest, Romania, November 2023; Rodino, S., Dragomir, V., Eds.; The Research Institute for Agricultural Economy and Rural Development (ICEADR): Bucharest, Romania, 2023; pp. 144–150. [Google Scholar]
  16. Van Vliet, J.; de Groot, H.L.F.; Rietveld, P.; Verburg, P.H. Manifestations and underlying drivers of agricultural land use change in Europe. Landsc. Urban Plan. 2015, 133, 24–36. [Google Scholar] [CrossRef]
  17. Van Zanten, B.T.; Verburg, P.H.; Espinosa, M.; Gomez-y-Paloma, S.; Galimberti, G.; Kantelhardt, J.; Viaggi, D. European agricultural landscapes, common agricultural policy and ecosystem services: A review. Agron. Sustain. Dev. 2014, 34, 309–325. [Google Scholar]
  18. Coca, O.; Creangă, D.; Viziteu, S.; Brumă, I.S.; Stefan, G. Analysis of the Determinants of Agriculture Performance at the European Union Level. Agriculture 2023, 13, 616. [Google Scholar] [CrossRef]
  19. Nowak, A.; Zakrzewska, A. How Competitive Is the Agriculture in European Union Member States? An Assessment of Changes over the Past Decade. Agriculture 2024, 14, 612. [Google Scholar] [CrossRef]
  20. Herman, E. Sustainable agriculture and its impact on the rural development in EU countries: A multivariate analysis. Land 2024, 13, 947. [Google Scholar] [CrossRef]
  21. Chiarella, C.; Meyfroidt, P.; Abeygunawardane, D.; Conforti, P. Balancing the trade-offs between land productivity, labor productivity and labor intensity. Ambio 2023, 52, 1618–1634. [Google Scholar] [CrossRef] [PubMed]
  22. Vasile, A.J.; Mihai, M.; Panait, M. Transformations of the Romanian agricultural paradigm under domestic economic policy reforms: An analysis during 1960–2011. Land Use Policy 2017, 67, 288–297. [Google Scholar] [CrossRef]
  23. Pawlewicz, A.; Pawlewicz, K. Spatial and economic differentiation of land use for organic farming in the European Union. Sustainability 2026, 18, 1454. [Google Scholar] [CrossRef]
  24. Olar, A.; Jitea, M.I. Counterbalancing the Development Territorial Disparities in the Implementation of the Community-Led Local Development EU Approach in Romania. Land 2021, 10, 970. [Google Scholar] [CrossRef]
  25. Herman, E. Changes and Challenges in EU Agricultural Holdings and Their Impact on Rural Development. Land 2025, 14, 1080. [Google Scholar] [CrossRef]
  26. Chițea, L.F. The Agrarian Structure and Evolution of Small Farms in Romania after the Accession to the European Union. In Agrarian Economy and Rural Development—Trends and Challenges, Proceedings of the 15th International Symposium, Bucharest, Romania, November 2024; Rodino, S., Dragomir, V., Eds.; The Research Institute for Agricultural Economy and Rural Development (ICEADR): Bucharest, Romania, 2024; pp. 151–160. [Google Scholar]
  27. Stoicea, P.; Chiurciu, I.A.; Cofas, E. Territorial disparities, structural imbalances and economic implications in the potato crop system in Romania. Agriculture 2025, 15, 2343. [Google Scholar] [CrossRef]
  28. Kizos, T.; Koulouri, M. Agricultural landscape dynamics in the Mediterranean: Lesvos (Greece) case study using evidence from the last three centuries. Environ. Sci. Policy 2006, 9, 330–342. [Google Scholar] [CrossRef]
  29. Zomeni, M.; Tzanopoulos, J.; Pantis, J.D. Historical analysis of landscape change using remote sensing techniques: An explanatory tool for agricultural transformation in Greek rural areas. Landsc. Urban Plan. 2008, 86, 38–46. [Google Scholar] [CrossRef]
  30. Su, S.; Jiang, Z.; Zhang, Q.; Zhang, Y. Transformation of agricultural landscapes under rapid urbanization: A threat to sustainability in Hang-Jia-Hu region, China. Appl. Geogr. 2011, 31, 439–449. [Google Scholar] [CrossRef]
  31. Zhao, Y.; Yuan, X.; Liu, Y. Understanding the Transformation of Rural Areal System from Changes in Farmland Landscape: A Case Study of Jiaocun Township, Henan Province. Habitat Int. 2025, 159, 103358. [Google Scholar] [CrossRef]
  32. Xv, X.; Ren, J.; Ming, Y. Impacts of mechanized farmland transformation on ecological landscape patterns in hilly regions of Zhong County, China. Sci. Rep. 2025, 15, 21702. [Google Scholar] [CrossRef] [PubMed]
  33. Zsilincsar, W. “Who makes the landscape?” Forces of landscape transformation in Austria. Hrv. Geogr. Glas. 2009, 71, 5–17. [Google Scholar] [CrossRef]
  34. Kurz, P. Between smallholder traditions and “ecological modernisation”: Agricultural transformation, landscape change and the CAP in Austria 1995–2015. Eur. Countrys. 2018, 10, 158–179. [Google Scholar] [CrossRef]
  35. Pe’er, G.; Bonn, A.; Bruelheide, H.; Dieker, P.; Eisenhauer, N.; Feindt, P.H.; Hagedorn, G.; Hansjürgens, B.; Herzon, I.; Lomba, Â.; et al. Action needed for the EU Common Agricultural Policy to address sustainability challenges. Science 2020, 367, 889–891. [Google Scholar]
  36. Reckling, M.; Watson, C.A.; Whitbread, A.; Helming, K. Diversification for sustainable and resilient agricultural landscape systems. Agron. Sustain. Dev. 2023, 43, 44. [Google Scholar] [CrossRef]
  37. Kuemmerle, T.; Levers, C.; Erb, K.; Estel, S.; Jepsen, M.R.; Müller, D.; Reenberg, A. Hotspots of Land Use Change in Europe. Environ. Res. Lett. 2016, 11, 064020. [Google Scholar] [CrossRef]
  38. Wolff, S.; Lakes, T. Characterising agricultural landscapes using landscape metrics and cluster analysis in Brandenburg, Germany. GI_Forum 2020, 1, 89–98. [Google Scholar] [CrossRef]
  39. Batáry, P.; Fischer, C. Transforming Large-Scale Agricultural Landscapes in Central and Eastern Europe: A Pathway toward Sustainable Agroecology. Agric. Ecosyst. Environ. 2026, 405, 110408. [Google Scholar] [CrossRef]
  40. National Institute of Statistics. TEMPO-Online. Available online: http://statistici.insse.ro:8077/tempo-online/#/pages/tables/insse-table (accessed on 20 March 2026).
  41. Eurostat. Gross Value Added at Basic Prices by NUTS 3 Region. Available online: https://ec.europa.eu/eurostat/databrowser/view/nama_10r_3gva/default/table?lang=en (accessed on 20 March 2026).
  42. Eurostat. Employment by NUTS 3 Region. Available online: https://ec.europa.eu/eurostat/databrowser/view/nama_10r_3empers__custom_21113837/default/table (accessed on 20 March 2026).
  43. Eurostat. Nominal Labour Productivity by NUTS 3 Region. Available online: https://ec.europa.eu/eurostat/databrowser/view/nama_10r_3nlp__custom_21113867/default/table (accessed on 20 March 2026).
  44. Rosa, L.; Rulli, M.C.; Ali, S.; Chiarelli, D.D.; Dell’Angelo, J.; Mueller, N.D.; Scheidel, A.; Siciliano, G.; D’Odorico, P. Energy implications of the 21st century agrarian transition. Nat. Commun. 2021, 12, 2319. [Google Scholar] [CrossRef] [PubMed]
  45. Nowak, A.; Kasztelan, A. Economic competitiveness vs. green competitiveness of agriculture in the European Union countries. Acon. Copernic. 2022, 13, 379–405. [Google Scholar] [CrossRef]
  46. Trigo, A.; Marta-Costa, A.; Fragoso, R. Principles of sustainable agriculture: Defining standardized reference points. Sustainability 2021, 13, 4086. [Google Scholar] [CrossRef]
  47. Landau, S.; Everitt, B.S. A Handbook of Statistical Analyses Using SPSS; Chapman & Hall/CRC Press LLC: Boca Raton, FL, USA, 2004. [Google Scholar]
  48. Jolliffe, I. Principal Component Analysis, 2nd ed.; Springer: New York, NY, USA, 2002. [Google Scholar]
  49. Agresti, A. An Introduction to Categorical Data Analysis, 2nd ed.; John Wiley & Sons, Inc.: Hoboken, NJ, USA, 2007. [Google Scholar]
  50. Everit, B.S.; Landau, S.; Leese, M.; Stahl, D. Cluster Analysis, 5th ed.; Willey: London, UK, 2011. [Google Scholar]
  51. Matysik-Pejas, R.; Bogusz, M.; Daniek, K.; Szafrańska, M.; Satoła, Ł.; Krasnodębski, A.; Dziekański, P. An Assessment of the Spatial Diversification of Agriculture in the Conditions of the Circular Economy in European Union Countries. Agriculture 2023, 13, 2235. [Google Scholar] [CrossRef]
  52. Kołodziejczak, W. Labour Productivity and Employment in Agriculture in the European Union. Eur. Res. Stud. J. 2025, 28, 991–1009. [Google Scholar] [CrossRef]
  53. Januzaj, Y.; Beqiri, E.; Luma, A. Determining the Optimal Number of Clusters using Silhouette Score as a Data Mining Technique. Int. J. Online Biomed. Eng. 2023, 19, 174–182. [Google Scholar] [CrossRef]
  54. Shahapure, K.R.; Nicholas, C. Cluster Quality Analysis Using Silhouette Score. In Proceedings of the 2020 IEEE 7th International Conference on Data Science and Advanced Analytics (DSAA), Sydney, Australia, 6–9 October 2020; Available online: https://ieeexplore.ieee.org/abstract/document/9260048 (accessed on 5 May 2026).
  55. Žičkienė, A.; Melnikienė, R.; Morkūnas, M.; Volkov, A. CAP direct payments and economic resilience of agriculture: Impact assessment. Sustainability 2022, 14, 10546. [Google Scholar] [CrossRef]
  56. Manta, A.G.; Doran, N.M.; Bădîrcea, R.M.; Badareu, G.; Gherțescu, C.; Lăpădat, C.V.M. Does common agricultural policy influence regional disparities and environmental sustainability in European Union countries? Agriculture 2024, 14, 2242. [Google Scholar] [CrossRef]
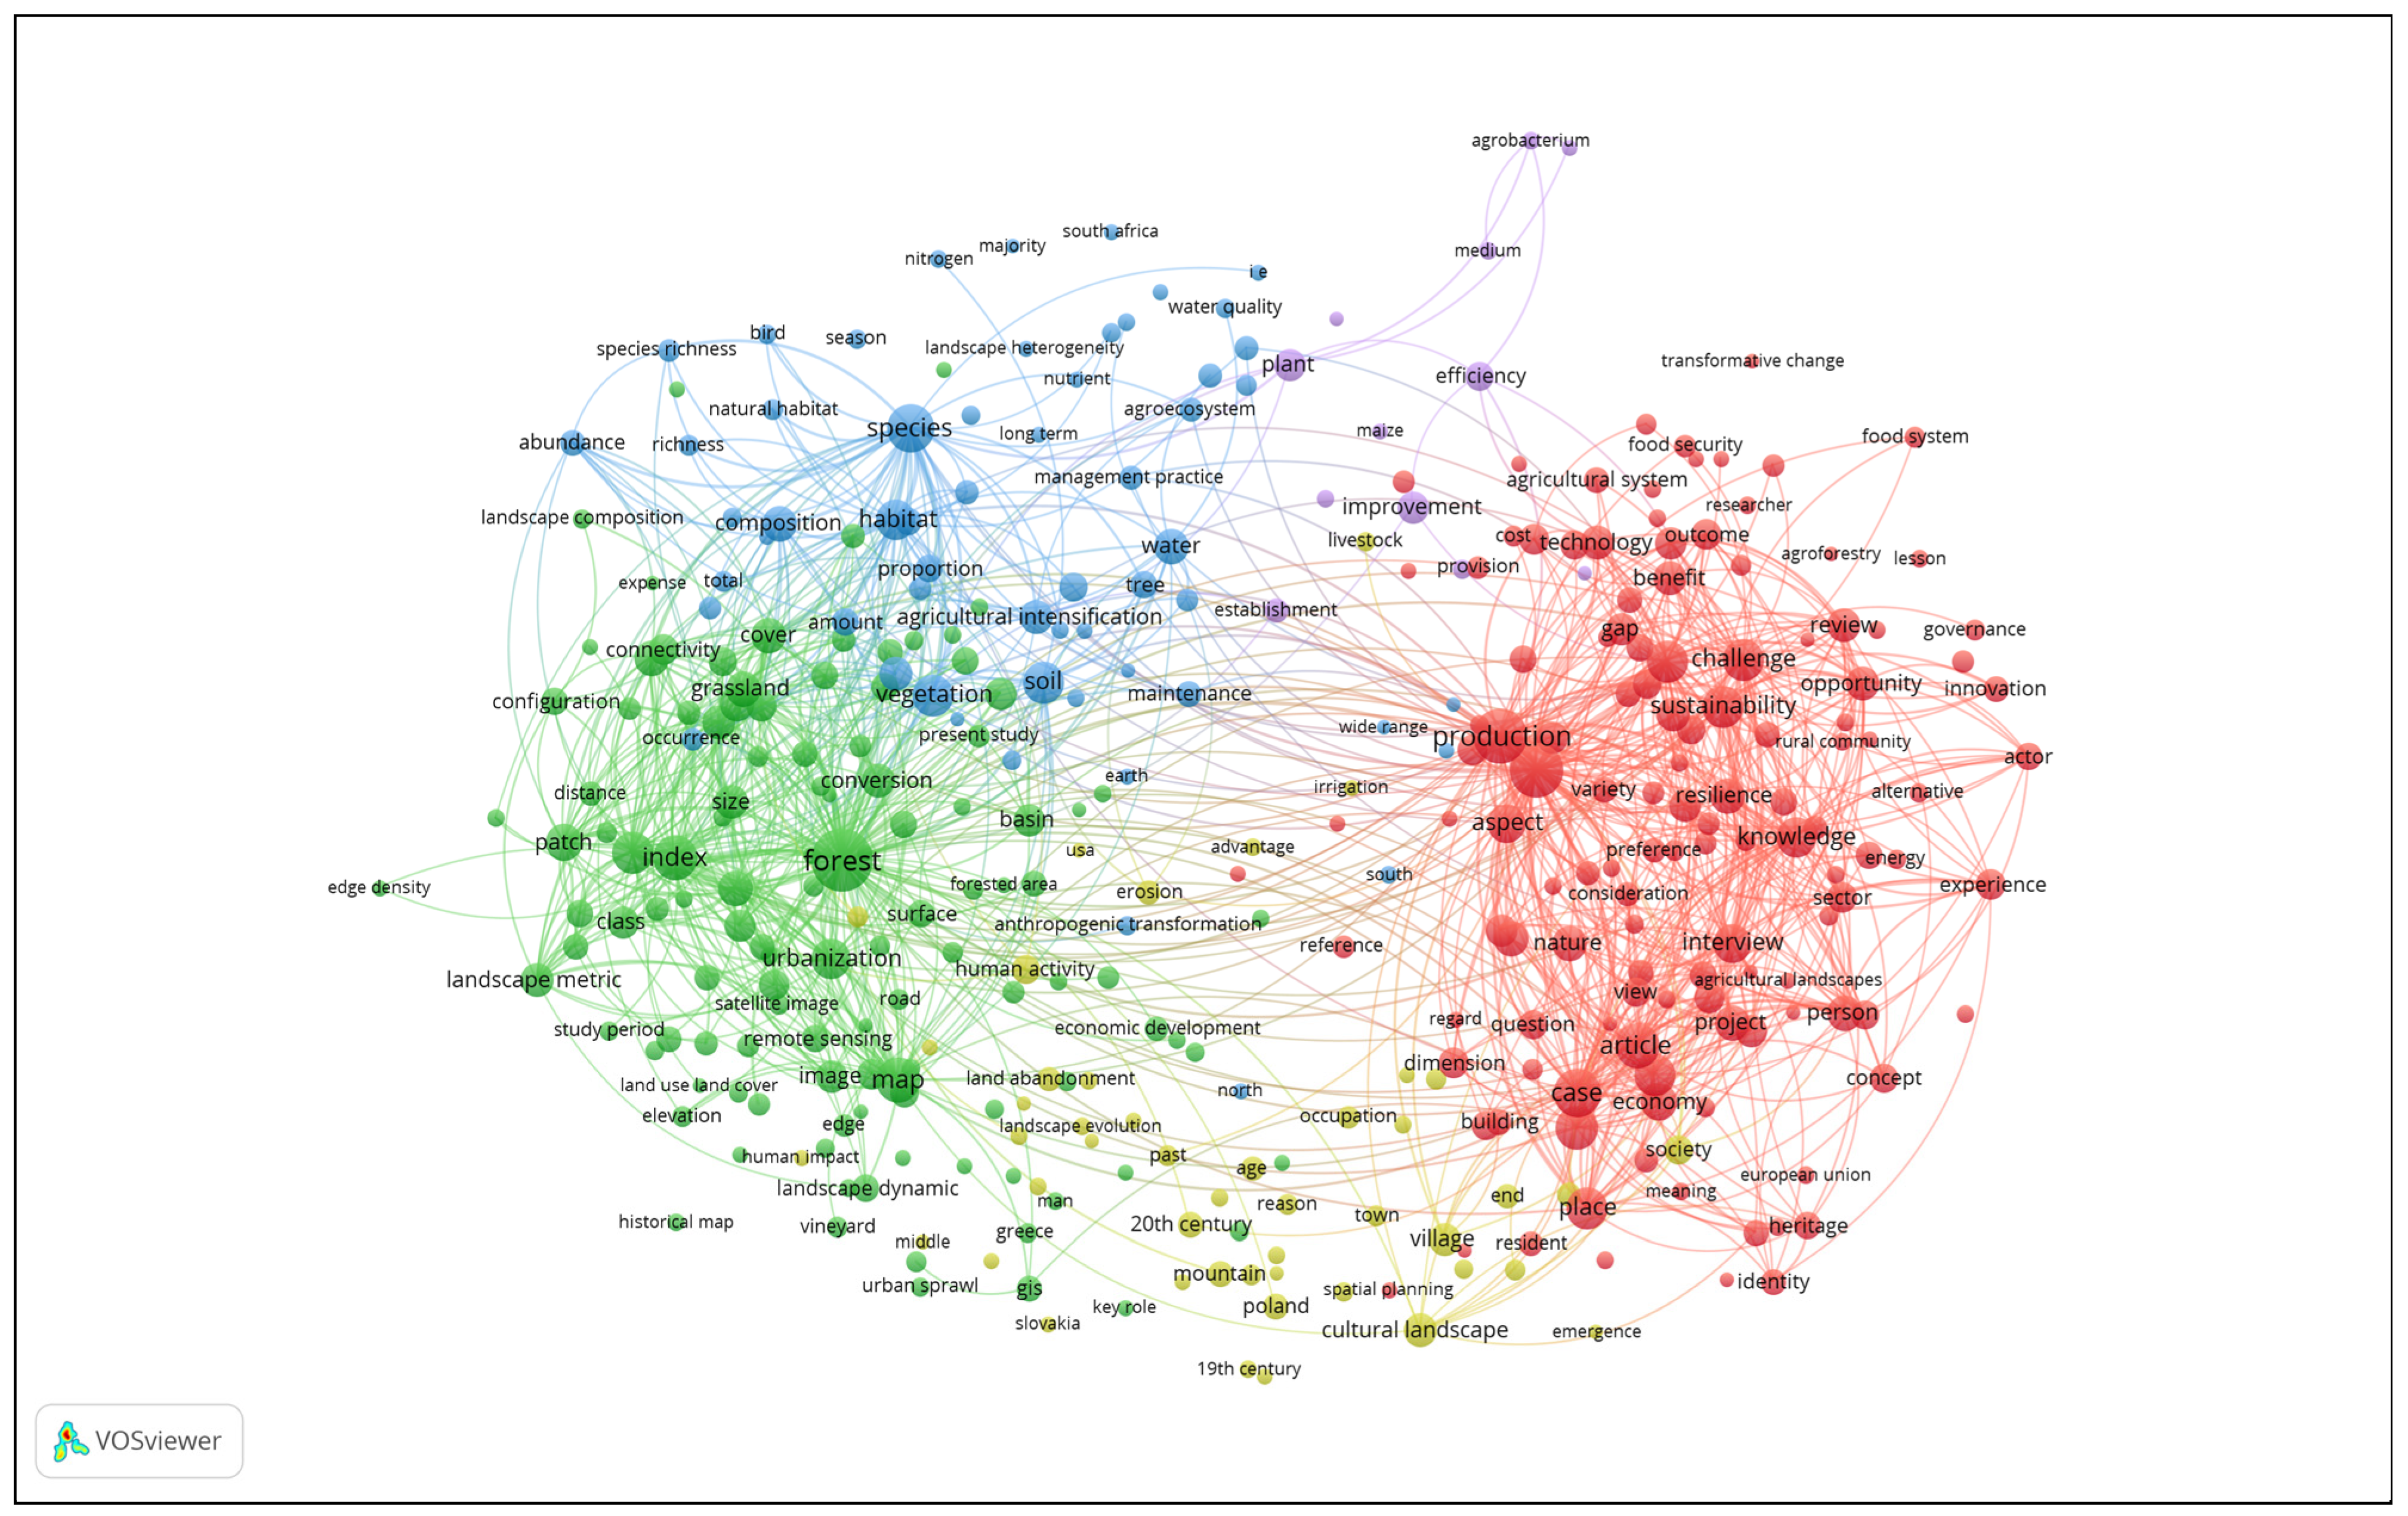
Figure 1. Keyword co-occurrence network of the selected publications.
Land 15 01412 g001
Figure 2. GVA and employment in agriculture (% of total) in 2000 and 2024.
Land 15 01412 g002
Figure 3. (a) Scree plot for 2000; (b) scree plot for 2024.
Land 15 01412 g003
Figure 4. PCA score plot of Romanian counties based on the first two principal components (PC1 and PC2), 2000.
Land 15 01412 g004
Figure 5. PCA score plot of Romanian counties based on the first two principal components (PC1 and PC2), 2024.
Land 15 01412 g005
Figure 6. Spatial distribution of agricultural clusters in Romania, using https://studio.ultimaps.com/editor?create=romania-counties (accessed on 30 April 2026).
Land 15 01412 g006
Figure 7. Agricultural land-use structure across cluster typologies (%), 2000.
Land 15 01412 g007
Figure 8. Arable area vs. pastures and meadows area (% of total agricultural land), 2000.
Land 15 01412 g008
Figure 9. Crop structure across agricultural cluster typologies in Romania (% of cultivated area), 2000.
Land 15 01412 g009
Figure 10. Agricultural land-use structure across cluster typologies (%), 2024.
Land 15 01412 g010
Figure 11. Arable area vs. pastures and meadows area (% of total agricultural land), 2024.
Land 15 01412 g011
Figure 12. Crop structure across agricultural cluster typologies in Romania (% of cultivated area), 2024.
Land 15 01412 g012
Table 1. Indicators used for the multidimensional analysis of agricultural landscape structure and function.
VariablesDescription
Land-use structure and crop production indicators
I1Share of agricultural area in total land (%)
I2Share of arable area in total agricultural land (%)
I3Share of pastures and meadows area in total agricultural land (%)
I4Share of vineyards and wine nurseries area in total agricultural land (%)
I5Share of orchards and fruit nurseries area in total agricultural land (%)
I6Share of wheat and rye area cultivated in total Area cultivated with the main crops (%)
I7Share of maize area cultivated in total Area cultivated with the main crops (%)
I8Share of potatoes area cultivated in total Area cultivated with the main crops (%)
I9Share of vegetables area cultivated in total Area cultivated with the main crops (%)
I10Wheat and rye production yield (tone/ha)
I11Maize production yield (tone/ha)
I12Potatoes production yield (tone/ha)
I13Vegetable production yield (tone/ha)
Agricultural mechanization and irrigation indicators
I14Number of tractors per 1000 ha of agricultural land
I15Effectively irrigated agricultural area with at least one watering (% of agricultural area equipped with irrigation)
I16Agricultural area equipped with irrigation (% of total agricultural area)
I17Effectively irrigated agricultural area with at least one watering (% of total agricultural area)
Agricultural input use indicators
I18Amount of chemical fertilizers used in agriculture/Land area on which chemical fertilizers were applied (tone/ha)
I19Amount of natural fertilizers used in agriculture/Land area on which natural fertilizers were applied (tone/ha)
I20The amount of pesticides applied in agriculture/Total agricultural area (kg/ha)
Socio-economic and structural indicators of the agricultural sector
I21Labour productivity in agriculture (GVA—gross value added/employed persons). (Current prices, million units of national currency/employed person)
I22Share of employees in total employment in agriculture (%)
I23Share of agricultural GVA in total GVA (%)
I24Share of agricultural employment in total employment (%)
Source: References [40,41,42,43].
Table 2. Changes in agricultural land use, crop structure and crop production yields across Romanian landscapes (2000–2024): paired-samples t-test results.
VariablesMeanPaired Differencest
(df = 40)
Sig. (2-Tailed)
MeanStd.
Deviation
Std.
Error Mean
95% Confidence Interval
of the Difference
20242000LowerUpper
I162.3863.38−0.9981.8950.296−1.596−0.400−3.3720.002
I262.0961.270.8251.1860.1850.4511.2004.4570.000
I335.0235.010.0111.2950.202−0.3980.4200.0540.957
I41.441.87−0.4270.4490.070−0.569−0.285−6.0860.000
I51.451.86−0.4090.5420.085−0.581−0.238−4.8320.000
I624.0420.133.9125.6610.8842.1265.6994.4250.000
I728.9435.86−6.92610.3371.614−10.189−3.663−4.2900.000
I82.015.18−3.1662.9660.463−4.102−2.230−6.8350.000
I92.803.15−0.3500.9540.149−0.652−0.049−2.3520.024
I103.832.191.6400.9100.1421.3521.92711.5320.000
I112.871.791.0831.2490.1950.6891.4785.5520.000
I1210.5410.460.0824.6890.732−1.3981.5620.1120.911
I1311.1810.800.3853.0080.470−0.5651.3340.8190.418
Source: Authors’ own calculations based on references [40].
Table 3. Changes in agricultural mechanization and irrigation indicators (2000–2024): paired-samples t-test results.
VariablesMeanPaired DifferencestdfSig. (2-Tailed)
MeanStd.
Deviation
Std.
Error Mean
95% Confidence Interval
of the Difference
20242000LowerUpper
I1418.2510.797.4558.9261.3944.63710.2725.348400.000
I1518.635.9612.67515.6133.1876.08219.2683.977230.001
I1622.5922.60−0.0051.8470.312−0.6390.630−0.015340.988
I176.782.364.41711.8092.518−0.8199.6531.754210.094
Source: Authors’ own calculations based on references [40].
Table 4. Changes in agricultural input use indicators (2000–2024): paired-samples t-test results.
VariablesMeanPaired Differencest
(df = 40)
Sig. (2-Tailed)
MeanStd.
Deviation
Std.
Error Mean
95% Confidence Interval
of the Difference
20242000LowerUpper
I180.1060.0930.0130.0570.009−0.0050.0311.5010.141
I1913.14021.548−8.4089.4631.478−11.395−5.421−5.6890.000
I200.3920.651−0.2600.6910.108−0.478−0.042−2.4060.021
Source: Authors’ own calculations based on references [41,42,43].
Table 5. Paired-samples t-test results for socio-economic and structural indicators of the agricultural sector (2000–2024).
VariablesMeanPaired Differencest
(df = 40)
Sig. (2-Tailed)
MeanStd.
Deviation
Std.
Error Mean
95% Confidence Interval
of the Difference
20242000LowerUpper
I2141.342.7038.64728.6134.46929.61647.6798.6490.000
I2217.7211.935.7953.2760.5124.7616.82911.3270.000
I235.2117.52−12.3135.3050.828−13.988−10.639−14.8630.000
I2425.3546.57−21.2217.1751.121−23.486−18.956−18.9380.000
Source: Authors’ own calculations based on references [41,42,43].
Table 6. KMO and Bartlett’s Test.
20002024
Kaiser–Meyer–Olkin Measure of Sampling Adequacy0.5580.512
Bartlett’s Test of SphericityApprox. Chi-Square (df)
Sig.
1127.102 (210)
0.000
1117.874 (210)
0.000
Source: Authors’ own calculations based on references [40,41,42,43].
Table 7. PCA results: total variance and eigenvalues explained.
ComponentInitial EigenvaluesRotation Sums of Squared Loadings
Total% of VarianceCumulative %Total% of VarianceCumulative %
2000
16.18129.43529.4354.14119.71819.718
23.72117.7247.1562.79713.31833.036
32.59612.3659.5152.79313.29946.335
41.6767.98167.4972.72312.96559.3
51.1615.52773.0242.0379.69868.998
61.0815.1578.1741.9279.17578.174
210.0000.000100.000
2024
15.2625.0525.054.25720.2720.27
23.52216.77341.8233.03714.46134.731
32.96214.10555.9282.72912.99647.727
41.8818.95964.8872.45711.69859.425
51.3426.39371.282.0039.53668.961
61.1995.70876.9871.6868.02676.987
210.0000.000100.000
Note: Extraction method: Principal Component Analysis. Source: Authors’ own calculations based on references [40,41,42,43].
Table 8. PCA Rotated Component Matrix for 2000 and 2024.
20002024
Initial
Variables *
PC1PC2PC3PC4PC5PC6Initial
Variables **
PC1PC2PC3PC4PC5PC6
I2−0.915−0.0890.134−0.240.1040.122I30.8980.005−0.2660.17−0.112−0.187
I30.9010.09−0.060.284−0.177−0.111I2−0.89300.00.302−0.0860.1140.197
I1−0.82−0.0030.294−0.153−0.0250.055I80.7970.0580.3180.1730.2080.278
I80.7620.0790.380.279−0.1640.19I1−0.765−0.0810.3080.060.0910.188
I6−0.5690.0190.183−0.564−0.0610.358I140.6840.115−0.190.0030.1860.257
I24−0.289−0.8770.009−0.1850.102−0.04I21−0.0660.9280.0620.1070.1430.003
I22−0.2270.7850.123−0.0030.1120.261I22−0.0790.8980.1910.0980.034−0.061
I210.2480.7050.2730.2640.1890.296I24−0.246−0.8440.178−0.1220.084−0.057
I230.011−0.6150.3040.0770.4030.327I70.146−0.227−0.880.037−0.011−0.139
I50.350.051−0.765−0.167−0.0410.094I6−0.5050.2580.603−0.2320.03−0.058
I7−0.194−0.219−0.754−0.0270.306−0.344I50.1790.103−0.600−0.269−0.188−0.091
I90.2130.324−0.7360.2380.1350.02I90.2990.395−0.595−0.3150.0650.104
I180.0480.3010.7170.0840.1050.157I23−0.287−0.4610.4670.0210.0980.243
I190.1840.1190.0550.725−0.202−0.033I10−0.1960.2350.1870.830.057−0.008
I110.443−0.0730.0950.664−0.16−0.199I4−0.211−0.1410.043−0.8000.128−0.037
I120.4310.0590.2040.658−0.2130.089I110.375−0.0510.0550.7810.2710.168
I130.1230.294−0.1680.6570.1770.342I200.0240.0660.068−0.150.893−0.008
I20−0.0780.075−0.021−0.0370.8840.111I18−0.0720.0550.0140.1860.8670.025
I4−0.22−0.069−0.139−0.3530.833−0.19I190.239−0.2020.2090.1360.4060.401
I10−0.058−0.0010.0940.0340.0000.777I13−0.2880.063−0.037−0.0570.0420.886
I14−0.1480.3830.066−0.0710.0010.706I120.213−0.0880.3190.324−0.0660.591
Note: Extraction method: Principal Component Analysis; rotation method: Varimax with Kaiser normalization. * Rotation converged in 9 iterations. ** Rotation converged in 8 iterations. Source: Authors’ own calculations based on references [40,41,42,43].
Table 9. Cluster validation based on silhouette statistics.
SolutionNumber of ClustersMean Silhouette
20002024
A70.3060.319
B80.3190.344
C90.3460.350
Note: Dissimilarity measure = Euclid. Source: Authors’ own calculations based on references [40,41,42,43].
Table 10. The results of the cluster analysis: final cluster centers and ANOVA.
Final Cluster CentersANOVA
ClusterClusterErrorFSig.
123456789Mean SquaredfMean Squaredf
2000
PC1−0.3190.508−0.8140.6600.8991.671−1.580−1.1331.4533.93380.2673214.3360.000
PC2−0.2860.5800.003−0.408−0.5861.1973.965−0.8470.6093.44880.388328.1410.000
PC30.232−0.881−0.077−0.105−0.2352.668−0.4510.5511.6792.68980.5783211.1650.001
PC4−1.324−0.3180.9570.0130.5960.4240.299−0.7940.1703.23680.441326.280.000
PC5−0.028−0.400−0.0125.583−0.2310.0270.700−0.081−0.2904.19780.2013218.7230.000
PC6−0.749−0.214−0.5680.2170.217−0.9071.0491.1761.6752.68880.578324.9050.001
2024
PC1−0.658−0.2530.542−0.406−0.6050.7131.748−1.0522.4443.12180.47326.6450.000
PC2−0.6190.3950.2350.270−0.567−0.2000.2913.8480.0982.79180.552325.0520.000
PC30.585−1.092−0.699−0.4260.4130.4801.5550.0481.9213.00480.499326.0190.000
PC4−0.334−0.8780.1600.7860.708−3.6550.629−0.6230.5602.96280.509325.8160.000
PC5−0.096−0.253−0.5111.610−0.2501.451−0.9870.8752.9183.46380.384329.0130.000
PC6−0.4002.190−0.529−0.5281.073−0.1350.059−0.2991.7623.73380.3173211.7860.000
Source: Authors’ own calculations based on references [40,41,42,43].
Disclaimer/Publisher’s Note: The statements, opinions and data contained in all publications are solely those of the individual author(s) and contributor(s) and not of MDPI and/or the editor(s). MDPI and/or the editor(s) disclaim responsibility for any injury to people or property resulting from any ideas, methods, instructions or products referred to in the content.