Article

Spatiotemporal Variations and Spatially Associated Factors of Drought in Hebei Province Based on Multi-Source Consistency Evaluation of Remote Sensing Drought Indices


1
Hebei International Joint Research Center for Remote Sensing of Agricultural Drought Monitoring, Hebei GEO University, Shijiazhuang 050031, China
2
Hebei Key Laboratory of Optoelectronic Information and Geo-Detection Technology, Hebei GEO University, Shijiazhuang 050031, China
3
Key Laboratory of Space Active Opto-Electronics Technology, Shanghai Institute of Technical Physics, Chinese Academy of Sciences, Shanghai 200083, China
*
Authors to whom correspondence should be addressed.
Land 2026, 15(8), 1406; https://doi.org/10.3390/land15081406
Submission received: 15 July 2026 / Revised: 1 August 2026 / Accepted: 4 August 2026 / Published: 5 August 2026

Abstract

Global climate change has intensified drought risk, threatening water resources, agriculture, and ecosystems. This study evaluated four Moderate Resolution Imaging Spectroradiometer (MODIS)-based drought indices in Hebei Province: the evapotranspiration-to-potential-evapotranspiration-based Crop Water Stress Index (ET/PET-based CWSI), Temperature Condition Index (TCI), Vegetation Condition Index (VCI), and Temperature Vegetation Dryness Index (TVDI). During 2001–2020, the Standardized Precipitation Index (SPI), the Standardized Precipitation Evapotranspiration Index (SPEI), the 1 km gridded soil-moisture product SMCI1.0, Taylor statistics, classification metrics, and typical drought events were used for multi-source consistency evaluation. Although the classification metrics for CWSI indicated moderate drought discrimination and relatively high false-alarm rates, the multi-source consistency evaluation showed that CWSI had the most stable overall performance among the four tested indices. Sen’s slope, the Mann–Kendall test, the Optimal Parameters-based Geographical Detector (OPGD), and random forest were used to examine trends and spatially associated factors. CWSI-derived drought intensity generally decreased, with severe and extreme drought areas decreasing and mild and moderate drought areas increasing. Severe-and-above drought was most prominent in spring. Temperature showed the strongest association with CWSI spatial differentiation, followed by elevation and socioeconomic variables. The interaction between temperature and soil type had the highest explanatory power. These results provide a reference for regional drought monitoring and water resource management.

1. Introduction

Drought is one of the most severe natural hazards and is caused by water deficits in atmospheric and hydrological cycles [1,2,3]. Under global climate change, drought events have become more frequent, severe, and persistent [4]. They seriously threaten regional water security, agricultural sustainability, and ecosystem stability. China is a typical monsoon-affected country and is frequently disturbed by drought across its territory [5,6]. Hebei Province is located in northern China. It is an important grain-producing region and a typical area with water resource shortages. Due to the uneven spatiotemporal distribution of precipitation [7] and the combined effects of long-term agricultural irrigation and groundwater overexploitation [8,9], the regional contradiction between water supply and demand has become increasingly prominent. The agricultural system is also highly sensitive to climate change [10]. This sensitivity is especially important for irrigated cropland and the main grain-production systems, where seasonal water demand may not match the uneven distribution of precipitation. Therefore, comparing the applicability of different remote-sensing drought indices at the regional scale is important for improving the reliability of drought monitoring results [11].
Drought indices are widely used to characterize the severity, spatial extent, and duration of drought events [12,13]. They are also used to analyze drought evolution and propagation processes [14]. Existing drought indices can generally be divided into meteorological indices and remote-sensing indices. Meteorological drought indices mainly reflect precipitation anomalies [15,16], but their application is often limited by the sparse spatial distribution of meteorological stations. In contrast, remote-sensing methods can provide spatially continuous observations of vegetation conditions, land surface temperature, and evapotranspiration. This enables multidimensional drought monitoring [17]. Different remote-sensing drought indices describe different aspects of drought processes, such as vegetation response, thermal stress, surface moisture conditions, and evapotranspiration dynamics. Normalized Difference Vegetation Index (NDVI)-based indicators are commonly used to characterize vegetation conditions [18]. However, they are easily affected by soil background in sparsely vegetated areas and may become saturated in densely vegetated areas [19,20]. To improve the representation of relative vegetation changes, Kogan proposed the Vegetation Condition Index (VCI) [21]. This index has been widely used in drought monitoring studies [22]. Surface thermal anomalies are commonly represented by the Temperature Condition Index (TCI), which is derived from temporal changes in land surface temperature [23]. In addition, the Temperature Vegetation Dryness Index (TVDI) integrates the Normalized Difference Vegetation Index (NDVI) and land surface temperature (LST) within a feature-space framework to represent surface moisture conditions [24]. The Crop Water Stress Index (CWSI) is based on canopy energy balance theory and quantifies crop water stress through evapotranspiration processes [25,26,27]. The calculation of traditional CWSI usually depends on ground observations and conventional meteorological data. This process is relatively complex and limits its application at regional scales. With the development of Moderate Resolution Imaging Spectroradiometer (MODIS) evapotranspiration products, the CWSI constructed from the ratio of actual evapotranspiration to potential evapotranspiration provides a new data basis for regional drought monitoring [28]. The MOD16 product estimates terrestrial actual evapotranspiration and potential evapotranspiration based on the Penman–Monteith framework and MODIS remote-sensing data [29]. It has been used in many studies for regional evapotranspiration assessment and CWSI-based drought monitoring [30,31]. Together, these four indices provide complementary remote-sensing perspectives on drought conditions, including evapotranspiration-based water stress, land-surface thermal stress, vegetation-condition anomalies, and LST–NDVI feature-space dryness.
Although many drought indices have been proposed, their applicability varies across regions because climate conditions and ecological environments differ greatly among regions [32]. To address this issue, many scholars have carried out applicability evaluation studies. Sun et al. [33] pointed out that the reasonable selection of drought indices is a key issue in remote-sensing drought monitoring, and they systematically compared 13 drought indices. Wang et al. [34] showed that the applicability of different drought indices varies with region and time scale. Related studies also indicated that regional characteristics must be fully considered when applying drought indices. Otherwise, monitoring results may be biased [35,36,37]. Recent studies have further emphasized the value of combining drought indices, climate-variability analysis, and evapotranspiration-related information for drought assessment in water-limited and data-scarce regions [38]. Although numerous studies have compared remote-sensing drought indices, most have focused on limited index sets, individual reference datasets, or a single evaluation perspective. In Hebei Province, previous studies have mainly examined long-term drought evolution or the applicability of individual remote-sensing drought monitoring models [39,40]. A systematic comparison of CWSI, TCI, VCI, and TVDI using the Standardized Precipitation Index (SPI), Standardized Precipitation Evapotranspiration Index (SPEI), SMCI1.0 gridded soil moisture, Taylor statistics, classification metrics, and typical drought events remains limited. In addition, many index-comparison studies end with applicability assessment or index ranking. They do not further examine the long-term drought patterns represented by the selected index or the natural and socioeconomic factors spatially associated with those patterns. Therefore, the novelty of this study lies in linking multi-source consistency evaluation with subsequent long-term spatiotemporal drought analysis. It further combines the Optimal Parameters-based Geographical Detector (OPGD) and random forest to examine spatial associations, factor interactions, nonlinear relationships, and relative predictive contributions within a unified framework.
This study takes Hebei Province as the study area. Based on MODIS remote-sensing data, four remote-sensing drought indices were constructed, including CWSI, VCI, TCI, and TVDI. Their relative applicability in regional drought monitoring was then evaluated. First, during 2001–2020, SPI, SPEI, and SMCI1.0 gridded soil moisture data were used as reference data. Correlation analysis, classification evaluation, and comparison with typical drought events were combined in a multi-source consistency evaluation of the four indices. This was done to identify the remote-sensing drought index that had relatively high consistency with meteorological water deficit and soil moisture conditions under the consistency evaluation framework used in this study. Then, based on the CWSI, which showed relatively stable performance in the multi-source consistency evaluation, the spatiotemporal characteristics of drought in Hebei Province during 2001–2023 were further analyzed. Finally, OPGD and the random forest model were combined to identify natural and socioeconomic factors spatially associated with the CWSI pattern and to evaluate their interaction characteristics and relative predictive contributions.

2. Data and Methods

2.1. Study Area

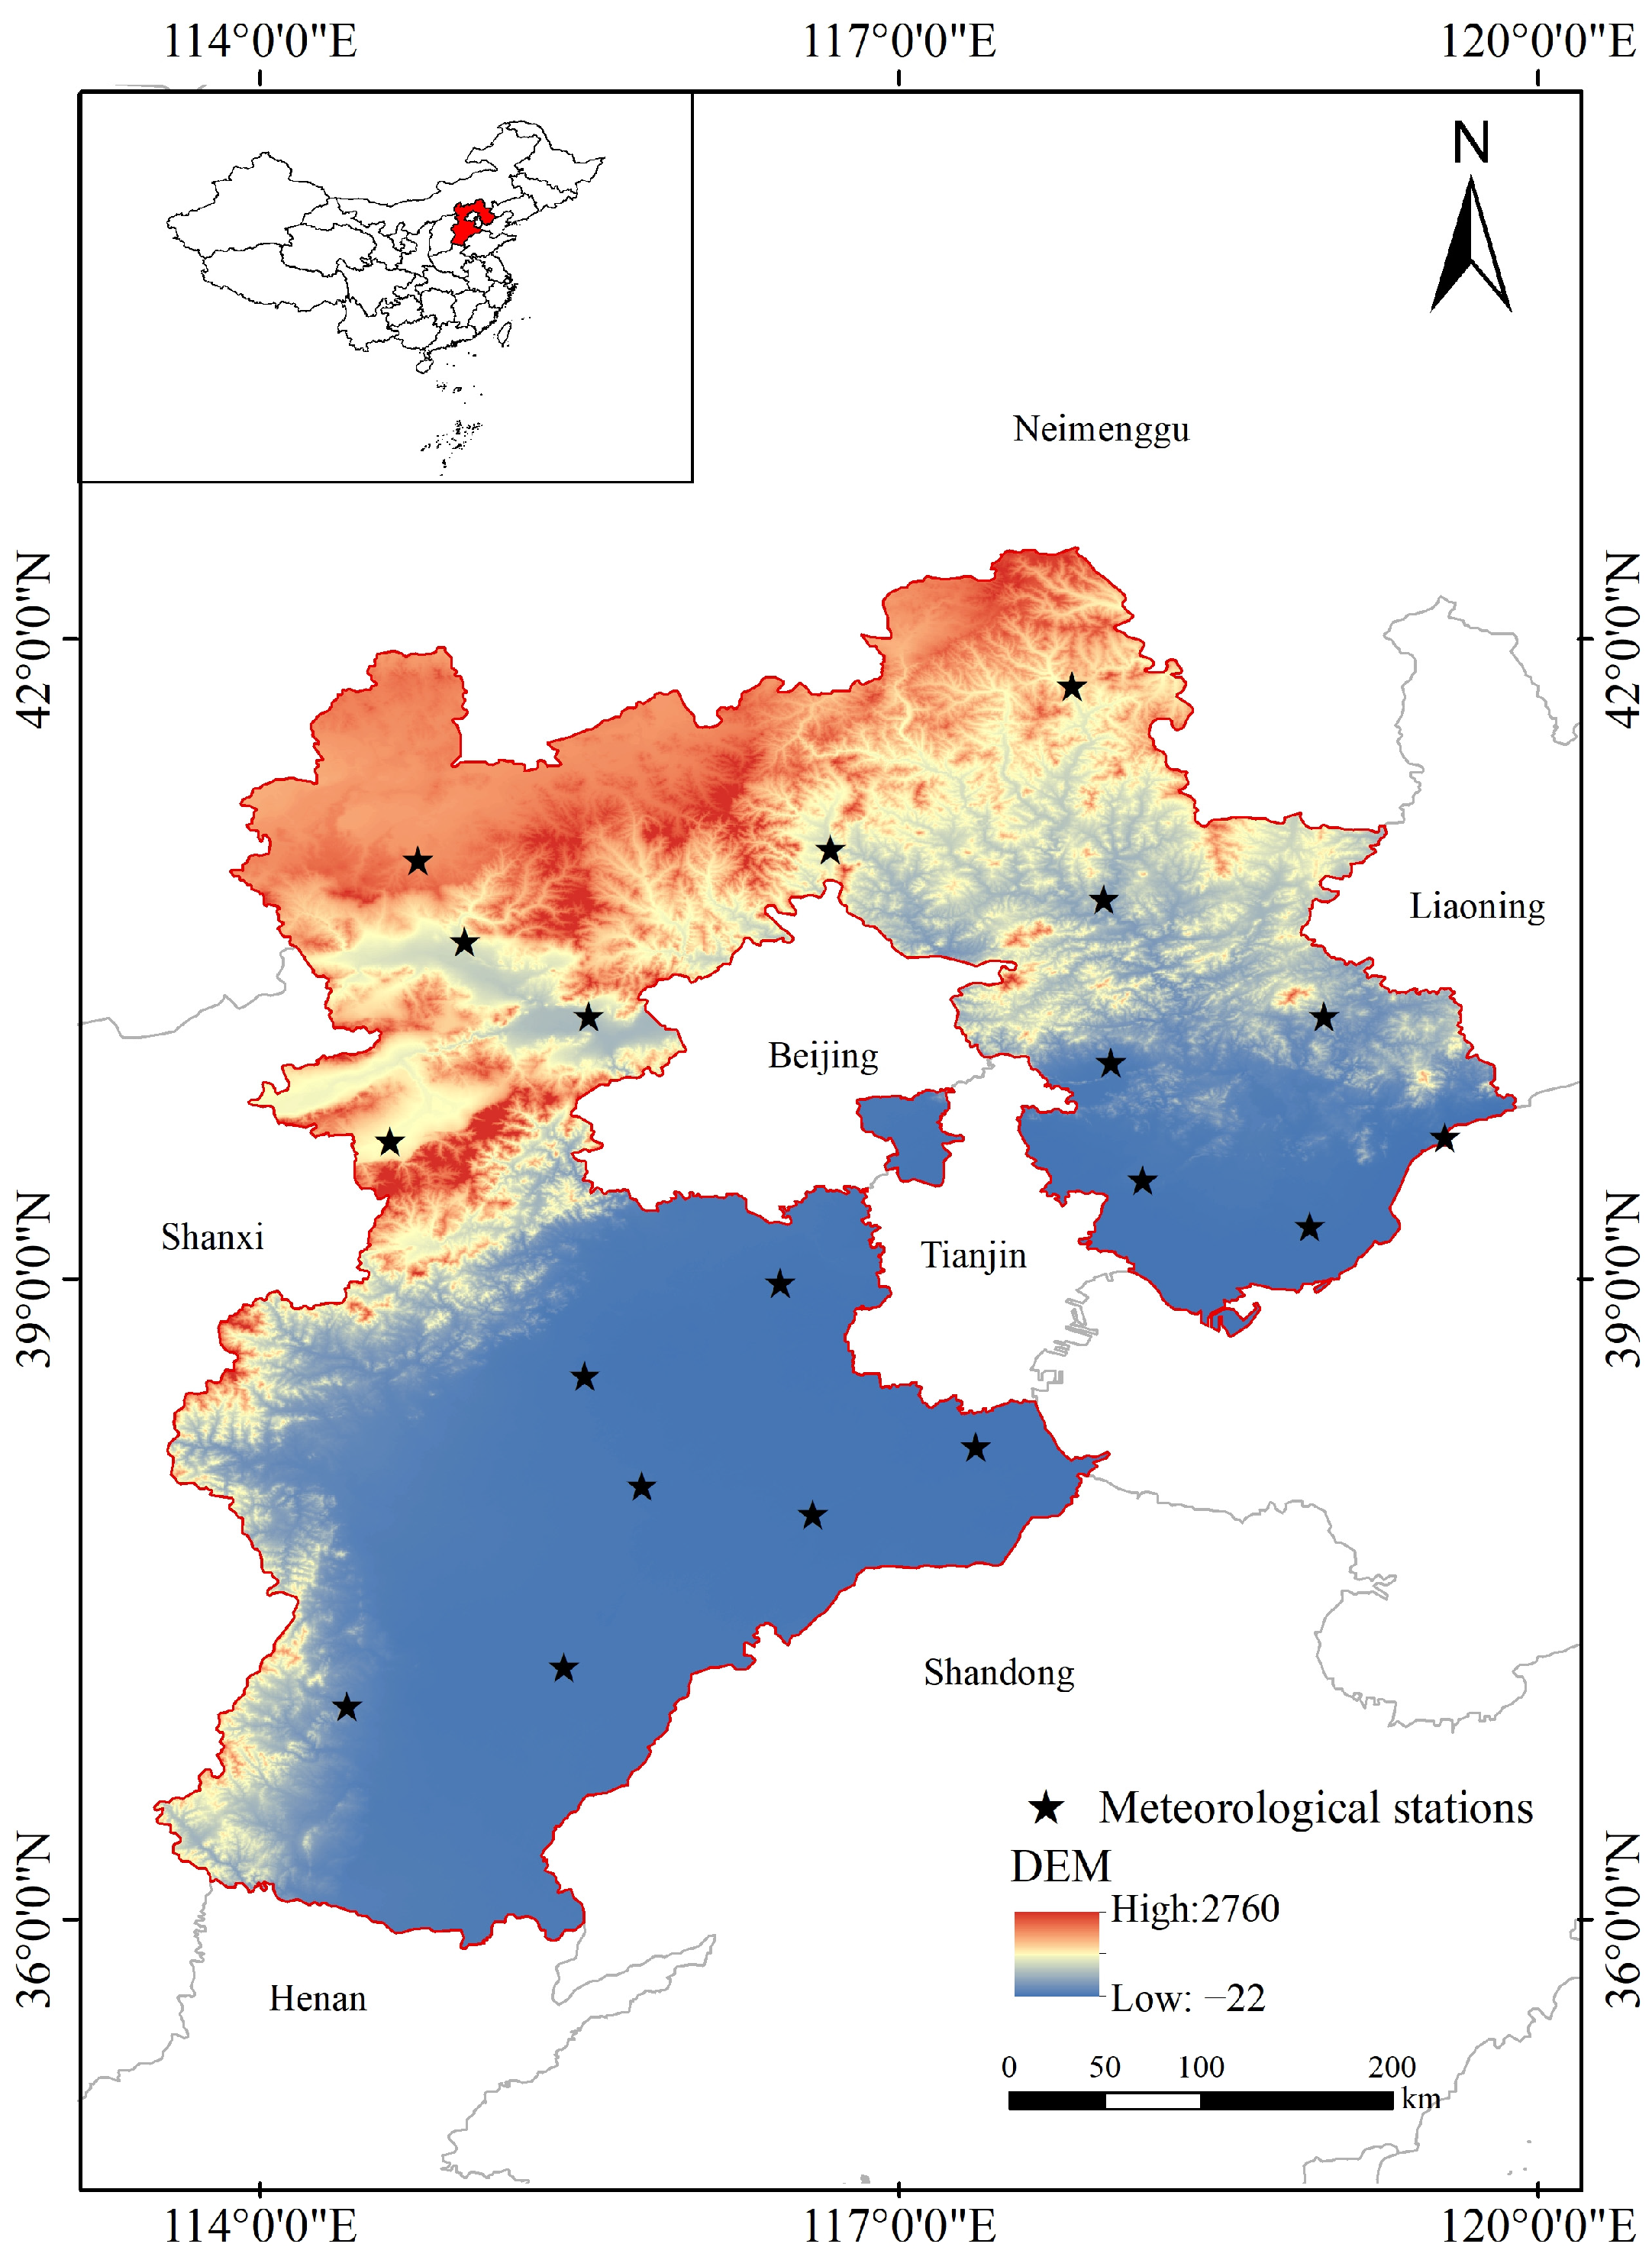
Hebei Province surrounds Beijing, the capital of China, and Tianjin Municipality. It is located in northern China between 113°27′–119°50′ E and 36°05′–42°40′ N, with an area of approximately 188,800 km2 (Figure 1). The precipitation in the region ranges from 400 to 800 mm, and more than 70% of it is concentrated in summer [41]. In contrast, the multi-year mean potential evapotranspiration reaches 900–1100 mm, indicating a long-term regional water deficit [42]. The strong seasonal mismatch between precipitation and evaporative demand makes Hebei Province highly prone to drought. This mismatch is particularly important for agricultural production because large areas of the province are used for irrigated cropland and grain production, while northern areas include more spring-sown crops. These systems are sensitive to spring and early-summer water deficits. Therefore, drought events show significant spatiotemporal heterogeneity and pose serious threats to agricultural production and ecosystem stability [43,44].

2.2. Data

The study included a multi-source consistency evaluation for 2001–2020 and a CWSI analysis for 2001–2023. During the consistency evaluation, the four MODIS-based indices were compared with SPI, SPEI, and SMCI1.0. The 2001–2023 mean CWSI was used as the response variable in the OPGD and random forest analyses. It should be noted that, due to the update limitations of the reference datasets, SPI, SPEI, and SMCI1.0 were only available up to 2020. Since the MODIS products had consistent retrieval algorithms and stable data quality during 2001–2023, this study extended the CWSI time series to 2023 after the consistency evaluation to capture recent regional drought trends.
The MODIS remote-sensing data used in this study included the MOD13A3 Normalized Difference Vegetation Index (NDVI) [45], MOD11A2 land surface temperature (LST) [46], and MOD16A2GF actual evapotranspiration (ET) and potential evapotranspiration (PET) [47], covering the period from 2001 to 2023. ET and PET were both directly obtained from the MOD16A2GF product. The MOD16A2GF product estimates terrestrial evapotranspiration variables based on the Penman–Monteith framework and MODIS remote-sensing inputs. It provides a consistent data source for calculating regional ET/PET-based CWSI. Detailed product parameters are shown in Table 1.
All MODIS images were first clipped to the study area. MOD11A2 land surface temperature (LST) was converted from Kelvin to degrees Celsius. LST values outside the range of −50 °C to 60 °C and non-finite values were set to NaN. Valid 8-day LST observations within each month were averaged to obtain monthly LST. MOD13A3 Normalized Difference Vegetation Index (NDVI) was used at its original monthly temporal resolution. NDVI values outside the range of −0.2 to 1.0 and non-finite values were set to NaN. The 8-day MOD16A2GF actual evapotranspiration (ET) and potential evapotranspiration (PET) observations were aggregated to monthly values using time-weighted averaging. Monthly CWSI was then calculated from the monthly ET and PET values. MOD16A2GF ET and PET were resampled from their original 500 m spatial resolution to the common 1 km reference grid using bilinear interpolation. All datasets were aligned to the same spatial extent and pixel grid.
Daily precipitation and temperature records from 19 stations (Table S1) during 1961–2020 were aggregated to monthly values and used to calculate SPI-3 and SPEI-3. The 3-month scale represents cumulative water anomalies over the current and previous two months and matches the seasonal remote-sensing analysis. SPI-3 mainly characterizes cumulative precipitation anomalies, while SPEI-3 further considers potential evapotranspiration demand. These two indices provide complementary references for evaluating remote-sensing drought indices from the perspectives of precipitation supply and climatic water balance.
The soil moisture data (SMCI1.0, 1 km) were obtained from Shangguan et al. [48] and used as an independent reference dataset. It is a 1 km modelled product derived from station observations and environmental predictors and covers 2000–2020. Published evaluations reported correlation coefficients of 0.866–0.919 and unbiased root mean square errors of 0.041–0.052. Previous studies have shown that this dataset can provide an effective reference for regional drought monitoring and soil moisture status evaluation [49,50,51]. In this study, the daily soil moisture data of the 10 cm soil layer during 2001–2020 were selected as an independent reference for evaluating the consistency between remote-sensing drought indices and near-surface soil moisture changes.
Because SMCI1.0 is not a direct field measurement, it was used for consistency evaluation rather than as absolute ground truth.
Other auxiliary datasets are shown in Table 2.
Temperature and precipitation were averaged over 2001–2023, while population density and GDP were averaged over 2005, 2010, 2015, and 2020. The remaining variables represented relatively stable spatial backgrounds.
Soil type followed the Chinese Soil Genetic Classification System. It was treated as a categorical variable and resampled to 1 km using the nearest-neighbor method.
All explanatory layers were aligned to the 1 km CWSI reference grid before spatial sampling.

2.3. Methods

2.3.1. Remote Sensing Drought Indices

(1) Crop Water Stress Index (CWSI)
The Crop Water Stress Index (CWSI) is based on energy balance theory and was proposed by Jackson et al. [26,52] as an indicator of vegetation water stress. The CWSI used in this study is an ET/PET-based index constructed from the ratio of actual evapotranspiration to potential evapotranspiration. It is used to characterize vegetation or crop water stress at the regional scale, rather than the classical CWSI directly based on canopy temperature differences. Its calculation is shown in Equation (1):
CWSI   =   1 − ( E T / P E T )
where ET is actual evapotranspiration (mm), and PET is potential evapotranspiration (mm). The value of CWSI ranges from 0 to 1. A larger value indicates more severe drought.
The thresholds in Table 3 were adopted from Chinese relative-soil-moisture classifications and previous CWSI studies [32,53]. Their robustness was examined through the sensitivity analysis in Section 3.1.6.
(2) Temperature Condition Index (TCI)
The Temperature Condition Index (TCI) was proposed by Kogan [23]. Its calculation is shown in Equation (2):
TCI = ( LST max − LST ) / ( LST max − LST min ) × 100
where LST is land surface temperature (°C), and L S T m i n and L S T m a x are the minimum and maximum LST values for the same pixel and same calendar month during the multi-year reference period, respectively. Pixel-based monthly normalization can reduce the influence of the seasonal temperature cycle and represent relative thermal anomalies. The value of TCI ranges from 0 to 100. The more severe the drought is, the closer TCI is to 0, and vice versa. Referring to the unified classification standard for TCI and VCI by Zhao et al. [54], values ≤ 20 indicate severe drought and above, and values of 20–30 indicate moderate drought.
(3) Vegetation Condition Index (VCI)
The Vegetation Condition Index (VCI) is based on NDVI and was proposed by Kogan et al. [55]. Its calculation is shown in Equation (3):
VCI = ( NDVI − NDVI min ) / ( NDVI max − NDVI min ) × 100
where NDVI is the normalized difference vegetation index, and N D V I m i n and N D V I m a x are the minimum and maximum NDVI values for the same pixel and same calendar month during the multi-year reference period, respectively. This method can reduce the influence of seasonal vegetation phenology and enables VCI to reflect relative anomalies in vegetation conditions. The value of VCI ranges from 0 to 100. A larger value indicates healthier vegetation conditions, while a smaller value indicates poorer growth conditions and more severe drought. Referring to the unified classification standard for TCI and VCI by Zhao et al. [54], values ≤ 20 indicate severe drought and above, and values of 20–30 indicate moderate drought.
(4) Temperature Vegetation Dryness Index (TVDI)
The Temperature Vegetation Dryness Index (TVDI) was proposed by Sandholt et al. [24]. Its calculation is shown in Equations (4)–(6).
T smax = a + b × NDVI
T smin = c + d × NDVI
TVDI = T s − T smin / T smax − T smin
where T s is land surface temperature (°C); T s m a x and T s m i n are the land surface temperatures corresponding to the dry edge and wet edge determined by NDVI, respectively; and a, b, c, and d are the coefficients of the linear fitting equations for the dry and wet edges. The value of TVDI ranges from 0 to 1. A larger value indicates more severe drought. TVDI values between 0.6 and 0.8 indicate moderate drought, and values greater than 0.8 indicate severe drought and above [32].
In this study, the LST–NDVI feature space was constructed monthly to calculate TVDI. First, NDVI and LST images from the same month were spatially registered. When their spatial grids were inconsistent, bilinear interpolation was used to resample LST to the NDVI reference grid, followed by unit conversion. Then, invalid and abnormal pixels were removed. Only valid pixels with 0.1 ≤ NDVI ≤ 0.9 and −50 °C ≤ LST ≤ 80 °C were retained. The valid NDVI range was divided into bins at an interval of 0.05. Bins with fewer than 15 valid pixels were removed. To reduce the influence of outliers on boundary fitting, the 95th and 5th percentiles of LST in each NDVI bin were used as dry-edge and wet-edge sample points, respectively. Linear regression was then used to fit the dry-edge and wet-edge equations based on at least five valid bins. The monthly dry-edge and wet-edge fitting coefficients and fitting R2 are shown in Table S2.

2.3.2. Drought Index Evaluation

To evaluate the regional applicability of CWSI, TCI, VCI, and TVDI in Hebei Province, this study constructed a multi-source consistency evaluation framework consisting of station-based meteorological drought indices, a gridded soil moisture product, and typical drought events. Based on data from 2001 to 2020, seasonal correlation analysis, Taylor statistics, monthly classification evaluation, and gridded soil moisture correlation analysis were used to compare the performance of the four indices. Typical drought events were also used to examine their temporal response characteristics.
(1) Standardized Precipitation Index (SPI) and Standardized Precipitation Evapotranspiration Index (SPEI)
The Standardized Precipitation Index (SPI) is used to quantify cumulative precipitation anomalies at different time scales. Its calculation usually requires at least 30 years of continuous precipitation records to ensure reliable probability distribution fitting [56]. Due to its relatively robust calculation method and broad applicability, SPI has become one of the most commonly used indices in drought monitoring and is often used as a reference standard for validating other drought indices [57,58,59,60]. The Standardized Precipitation Evapotranspiration Index (SPEI), proposed by Vicente-Serrano et al. [61], considers both the statistical distribution of precipitation and the energy–water balance. By introducing concurrent potential evapotranspiration, this index can more fully reflect regional drought conditions.
Based on the monthly precipitation and monthly mean temperature series from 19 meteorological stations in Hebei Province, SPI and SPEI were calculated using the “SPEI” package in R [62]. SPI used monthly precipitation as input and fitted its probability distribution using the Gamma distribution. SPEI first estimated potential evapotranspiration (PET) using the Thornthwaite method based on monthly mean temperature and station latitude. It then constructed a monthly climatic water balance series using the difference between precipitation and PET and fitted it using the log-logistic distribution. The distribution parameters of both indices were estimated using unbiased probability-weighted moments. A rectangular time kernel without offset was used to calculate the 3-month cumulative indices (SPI-3 and SPEI-3), which represent the water anomaly of the current month and the previous two months. Finally, the consistency between the remote-sensing drought indices and the two meteorological drought indices was evaluated using concurrent data from 2001 to 2020.
(2) Testing Methods
To comprehensively evaluate the consistency between each remote-sensing drought index and the reference index, this study used three statistics: the correlation coefficient (R), standard deviation (SD), and centered root mean square difference (CRMSD). These statistics represent the linear correlation, variation amplitude, and centered error between the remote-sensing index and the reference series. The detailed equations for these statistics are provided in Supplementary Methods S1.
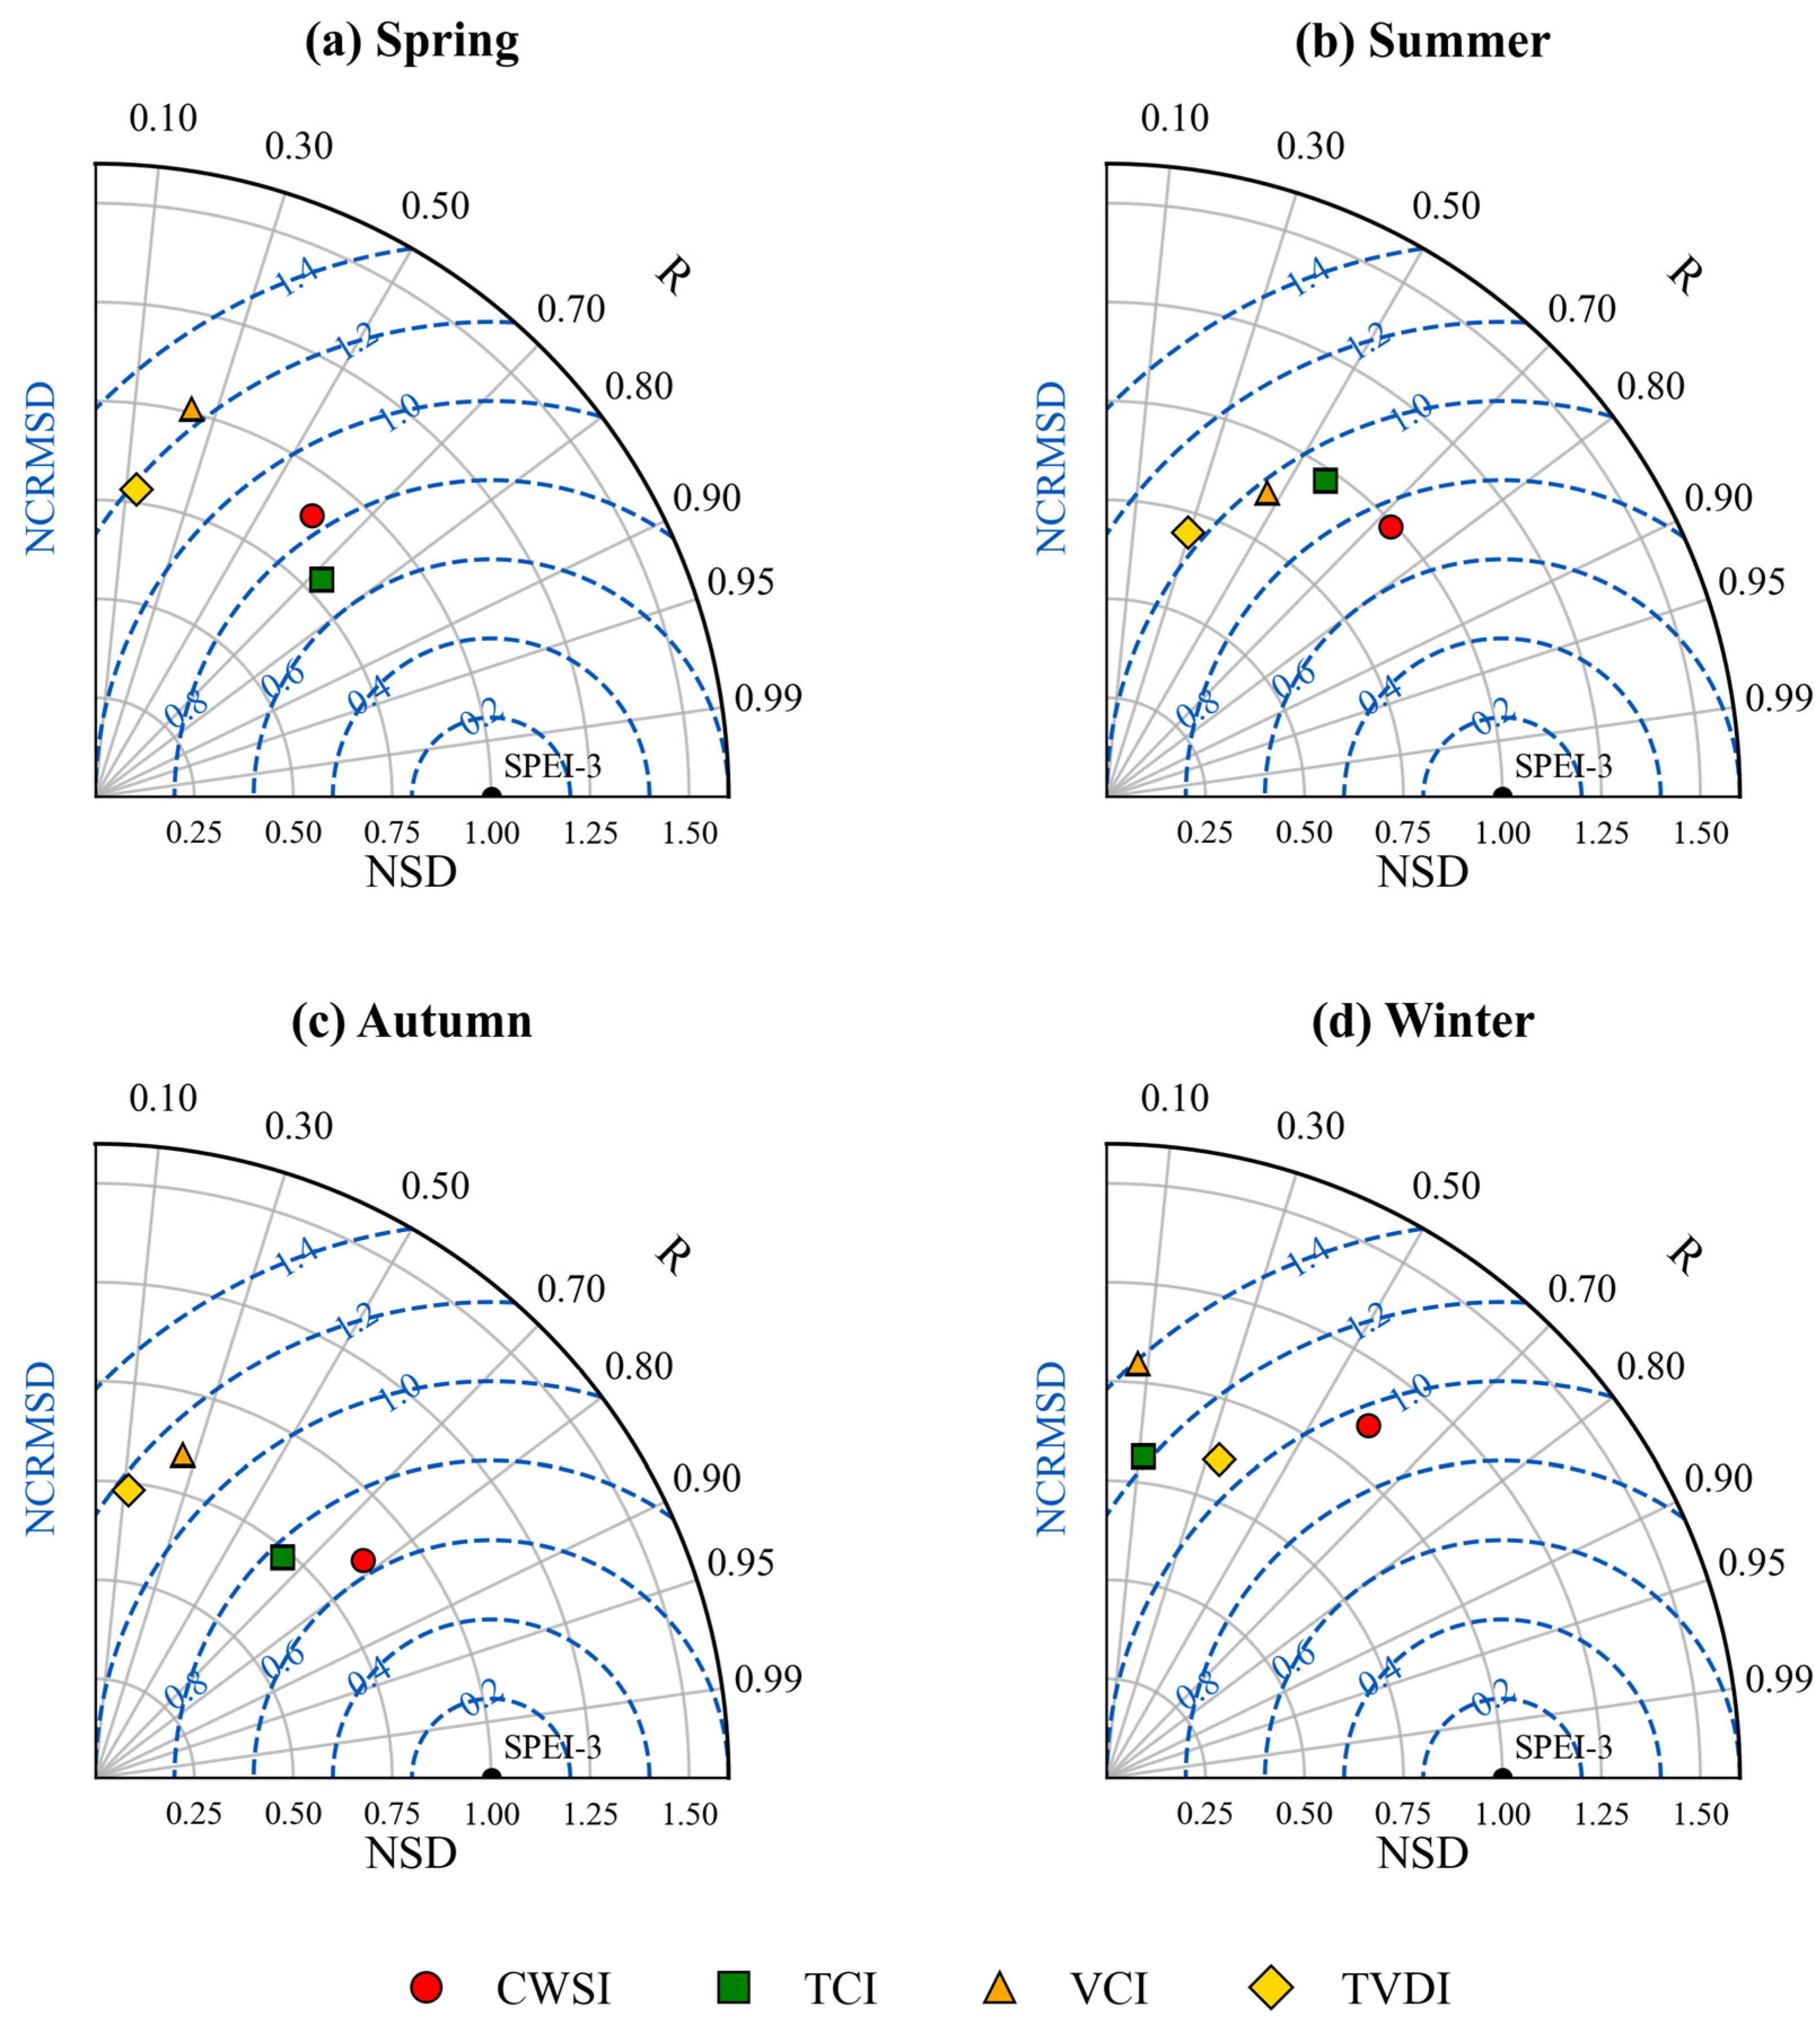
The Taylor diagram [63] provides a concise and intuitive statistical summary method. It can display the r value, CRMSD, and standard deviation of observed and estimated patterns on a two-dimensional diagram. In this study, the standard deviation and CRMSD were normalized and referred to as NSD and NCRMSD, respectively.
The formulas are shown in Equations (7)–(9):
NSD = σ x σ y
NCRMSD = CRMSD σ y
where σ x and σ y are the standard deviations of the remote-sensing drought index and SPEI-3, respectively. According to the Taylor diagram theory, R, NSD, and NCRMSD satisfy the following relationship:
NCRMSD = 1 + NSD 2 − 2 × NSD × R
In the Taylor diagram, NSD represents the radial distance from the origin, R is represented by the polar angle, and NCRMSD corresponds to the distance between the index point and the SPEI-3 reference point. Therefore, the closer an index point is to the SPEI-3 reference point, the higher the overall consistency between the remote-sensing drought index and SPEI-3.
(3) Evaluation of Drought Identification Ability Based on Classification Metrics
A monthly scale dataset was constructed using 19 meteorological stations in Hebei Province during 2001–2020. It contained 4560 “station–year–month” records. Each record included CWSI, TCI, VCI, TVDI, SMCI1.0 at the 10 cm soil layer, SPI-3, and SPEI-3. Raster values corresponding to the meteorological station locations were extracted. If the value at a station location was masked or invalid, the nearest valid pixel within a maximum distance of 10 pixels was used. If no valid pixel was found, the value was recorded as NaN. The extracted values were matched by station, year, and month. Each analysis retained only valid pairs of the remote-sensing index and the corresponding reference variable. Therefore, valid sample sizes could differ slightly among analyses.
Based on multi-index drought characterization and multi-source consistency evaluation [64,65,66], three criteria were used to define the reference drought labels. These criteria were SPI-3 ≤ −1, SPEI-3 ≤ −1, and SMCI1.0 at or below the historical 20th percentile for each station and calendar month. When at least two of the three indicators simultaneously identified a record as drought, the record was defined as a multi-source-consistent drought sample. This was done to reduce label uncertainty caused by a single reference source. For index standardization, the empirical cumulative distribution function (ECDF) was used to convert each remote-sensing drought index into a relative percentile for each station and calendar month. This avoided potential bias caused by fixed theoretical distribution assumptions and non-localized empirical thresholds [67]. The classification threshold was selected using the maximum Youden index criterion. For the validation strategy, an independent temporal validation was used. The period 2001–2014 was set as the training period, and 2015–2020 was set as the validation period. The empirical distributions of the remote-sensing indices, the 20th percentile threshold of SMCI1.0, and the classification thresholds were all determined only from the training period and then fixed for application to the validation period. This was used to evaluate the generalization ability of each index in an unseen period. Finally, six metrics were used to evaluate drought identification. The receiver operating characteristic area under the curve (ROC–AUC) [68] and precision–recall area under the curve (PR–AUC) [69,70] were used to evaluate continuous discrimination. Probability of detection (POD), false alarm ratio (FAR), critical success index (CSI), and F1-score [71] were used to evaluate event detection. The formulas are shown in Equations (10)–(13):
POD = H H + M
FAR = F H + F
CSI = H H + M + F
F 1 = 2 H 2 H + F + M
where H, M, and F represent hits, misses, and false alarms, respectively. Higher POD, CSI, and F1-score values and lower FAR values indicate better drought identification performance.
(4) Evaluation Based on Typical Drought Events
The typical drought events in Hebei Province in 2008 and 2014 were selected as cases. The provincial monthly mean values of each remote-sensing drought index during the event periods were extracted and compared with the corresponding drought grade thresholds. This was used to evaluate the temporal response of different indices to drought occurrence, development, and alleviation.

2.3.3. Sen–Mann–Kendall Trend Analysis

Sen’s slope estimator was used to quantify temporal trends, and the Mann–Kendall test was used to evaluate statistical significance. This combined method is referred to as the Sen–Mann–Kendall method [72,73,74]. Sen’s slope can robustly estimate the direction and magnitude of a trend. Compared with parametric methods, it is less affected by outliers or missing data points [75]. For hydrometeorological data with missing values or outliers, methods that do not require variables to follow a normal distribution are more suitable. The Mann–Kendall test meets this requirement and has therefore been widely used [76,77].
The calculation formula for Sen’s slope is shown in Equation (14):
β = m e d i a n x j − x i j − i ,   j > i
where x i and x j are the observations in years i and j, respectively, and β is Sen’s slope. When β > 0, it indicates an increasing trend. When β < 0, it indicates a decreasing trend.
The Mann–Kendall test used a two-sided test, and the significance level was set at 0.05. When |Z| > 1.96, the time series was considered to have a significant trend. Otherwise, the trend was considered not statistically significant. The original Mann–Kendall test was used in this study. Serial autocorrelation was not corrected in the trend test; therefore, the reported significance levels represent unadjusted MK significance. This limitation was considered when interpreting the trend results, especially for time series with significance levels close to 0.05.
Monthly CWSI values were first averaged within each season to obtain the seasonal mean CWSI for each year. Sen’s slope estimation and the Mann–Kendall test were then applied at two spatial scales. At the provincial scale, the seasonal mean CWSI and the area proportion of each drought grade were used to analyze the overall trend. At the pixel scale, the trend direction and significance were calculated for each pixel. The pixel-level results were then mapped.

2.3.4. Optimal Parameters-Based Geographical Detector Model

The OPGD model is an extension of the traditional geographical detector. It can quantify spatial heterogeneity and identify interactions among explanatory variables [78]. The model improves the explanatory power (q value) of each factor by optimizing the discretization method and classification interval of continuous variables. OPGD has been widely used in studies of geological hazards, ecosystems, and human–land relationships [44,79,80,81]. In this study, the GD package in R was used to discretize continuous variables. Four discretization methods were adopted: equal interval, natural breaks, quantile, and geometric interval. The number of classes was set from 3 to 7. The statistical results of q values under different discretization methods and class numbers are summarized in Figure S1. Based on these comparisons, the optimal discretization scheme was selected for each variable (Table 4), and the resulting discretized layers are shown in Figure S2. Vegetation type (X1), soil type (X2), and aspect (X6) were categorical variables and were directly used with their original categories in the analysis.
OPGD includes four modules: factor detector, interaction detector, risk detector, and ecological detector [82]. The factor detector uses the q value to measure the explanatory power of each explanatory variable for the spatial differentiation of CWSI. The interaction detector determines whether the explanatory power of two variables is enhanced, weakened, or independent after their joint action. The risk detector compares the differences in mean CWSI among different strata of a variable. The ecological detector uses the F statistic to test whether two explanatory variables have significantly different explanatory powers for the spatial differentiation of CWSI. These analyses were used to reveal the statistical associations between each explanatory variable, their interactions, and the spatial pattern of CWSI in Hebei Province.

2.3.5. Random Forest Model

Random forest (RF) is a machine learning algorithm based on the bagging ensemble strategy. It constructs multiple decision trees and averages their outputs for regression. It has advantages in capturing nonlinear relationships, resisting noise, and reducing overfitting [83]. The algorithm can also quantify feature importance and has been widely used in drought monitoring and related fields [84,85].
This study used the multi-year mean CWSI as the dependent variable and X1–X12 as explanatory variables. Vegetation type (X1), soil type (X2), and aspect class (X6) were treated as categorical variables and one-hot-encoded. The remaining variables were treated as continuous predictors. Grid ID and spatial coordinates were not used as model predictors. Spatial coordinates were only used to construct spatial validation blocks. Formal uncertainty intervals and residual spatial autocorrelation were not explicitly evaluated. Therefore, the random forest results should be interpreted as spatial predictive performance and relative variable contributions, rather than as a complete explanation of the residual spatial structure of CWSI.
Random forest modelling was implemented in Python 3.10.19 using scikit-learn 1.7.2. All random procedures used a fixed random seed of 42. The random forest model was set to 800 decision trees. At each node split, 70% of the candidate features were randomly selected for splitting, and the minimum number of samples in a leaf node was set to 2. Bootstrap sampling was used to train each base learner, and approximately 60% of the training samples were used for each tree. Considering that spatial autocorrelation may affect model validation results, this study divided the study area into 50 km spatial blocks and used complete spatial blocks, rather than individual grids, as the units for splitting the training and test sets. Approximately 80% of the spatial blocks were used for model training, and the remaining blocks were used as the independent spatial test set (Table S3a,b). Within the training set, 5-fold spatial grouped cross-validation was used for model evaluation and hyperparameter optimization.
Model performance was evaluated using the coefficient of determination (R2), root mean square error (RMSE), mean absolute error (MAE), and mean prediction bias. Permutation importance on the independent spatial test set was used as the main variable importance metric. This metric measures the predictive contribution of a variable by calculating the increase in model prediction error after the information of that variable is shuffled. The complete Python script for the random forest analysis has been provided as Supplementary Code S1.

2.3.6. Drought Grade Area, Frequency, and Intensity Indicators

To comprehensively describe the spatiotemporal characteristics of drought in Hebei Province, the following indicators were defined.
(1) Annual Seasonal Area Proportion of Drought Grades
For year t, season s, and drought grade k, the area proportion was calculated using Equation (15):
A s , k , t = n s , k , t n s , t × 100 %
where n s , k , t is the number of valid pixels classified as drought grade k within Hebei Province in season s and year t, and n s , t is the total number of valid pixels in the corresponding year and season.
(2) Drought Grade Occurrence Frequency
For pixel i, season s, and drought grade k, the occurrence frequency was calculated using Equation (16):
F i , s , k = N i , s , k N i , s × 100 %
where N i , s , k is the number of years from 2001 to 2023 in which pixel i was classified as grade k in season s, and N i , s is the total number of valid years for the pixel in the corresponding season.
(3) Multi-year Mean Spatial Classification and Area Proportion
First, the multi-year mean CWSI for the same season during 2001–2023 was calculated for each pixel. Then, drought grades were classified according to the thresholds listed in Table 3. The area proportion of each grade was calculated as the percentage of pixels in that grade relative to all valid pixels in the corresponding season.
(4) Drought Intensity
In this study, the CWSI value was used to represent regional water stress intensity. A larger CWSI indicates stronger water stress.

3. Results

3.1. Selection of Remote Sensing Drought Indices in Hebei Province

3.1.1. Drought Index Evaluation Based on SPEI

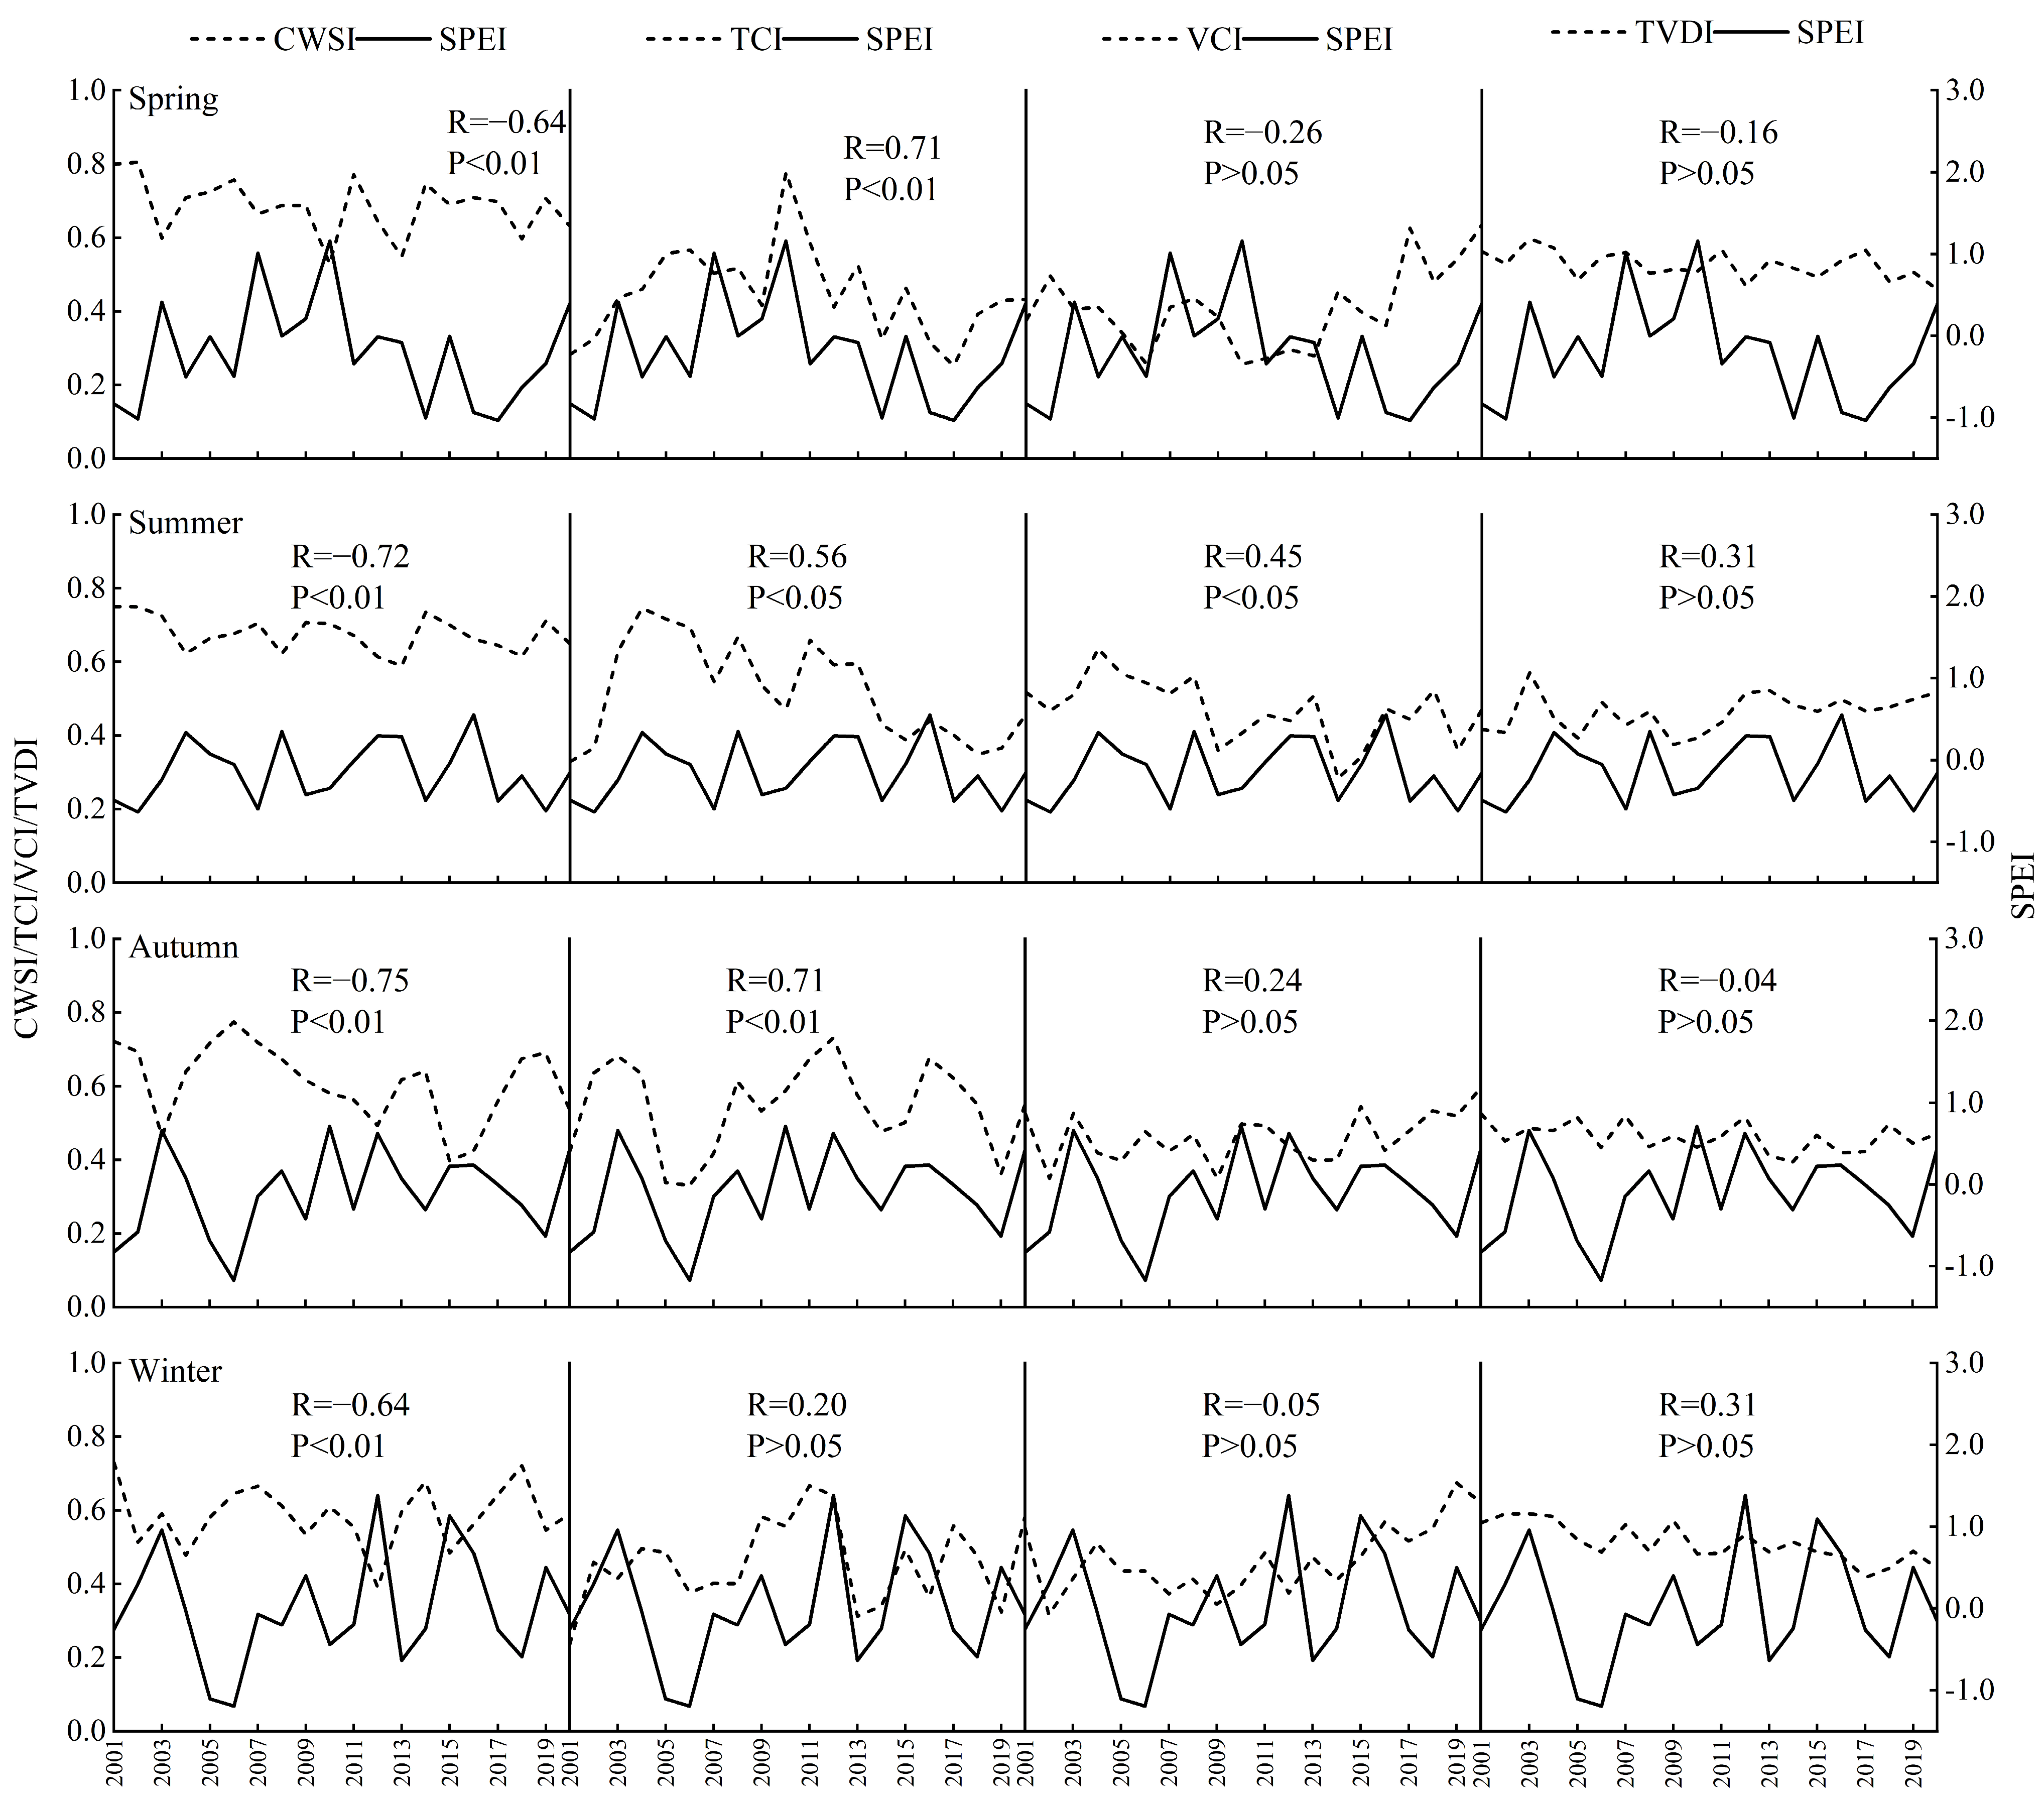
To analyze the correlation characteristics between the four seasonal drought indices and SPEI in Hebei Province, the drought indices were first normalized. Then, their correlation coefficients with SPEI and significance levels were calculated. The correlations between different drought indices and SPEI showed clear seasonal differences (Figure 2).
CWSI showed significant negative correlations with SPEI in all four seasons, with correlation coefficients of −0.64, −0.72, −0.75, and −0.64, respectively (p < 0.01). Among the four indices, it showed the most stable cross-season correlation. TCI showed significant positive correlations in spring, summer, and autumn, but its winter correlation was not significant, indicating clear seasonal fluctuations. Although its spring correlation coefficient (0.71) was higher than that of CWSI, its winter correlation did not reach the significance level, which made its year-round monitoring ability unstable. VCI reached significance only in summer, while it was not significantly correlated in the other seasons. TVDI did not pass the significance test in any season. Based on the SPEI correlation results, CWSI showed the most stable cross-season performance among the four tested indices.
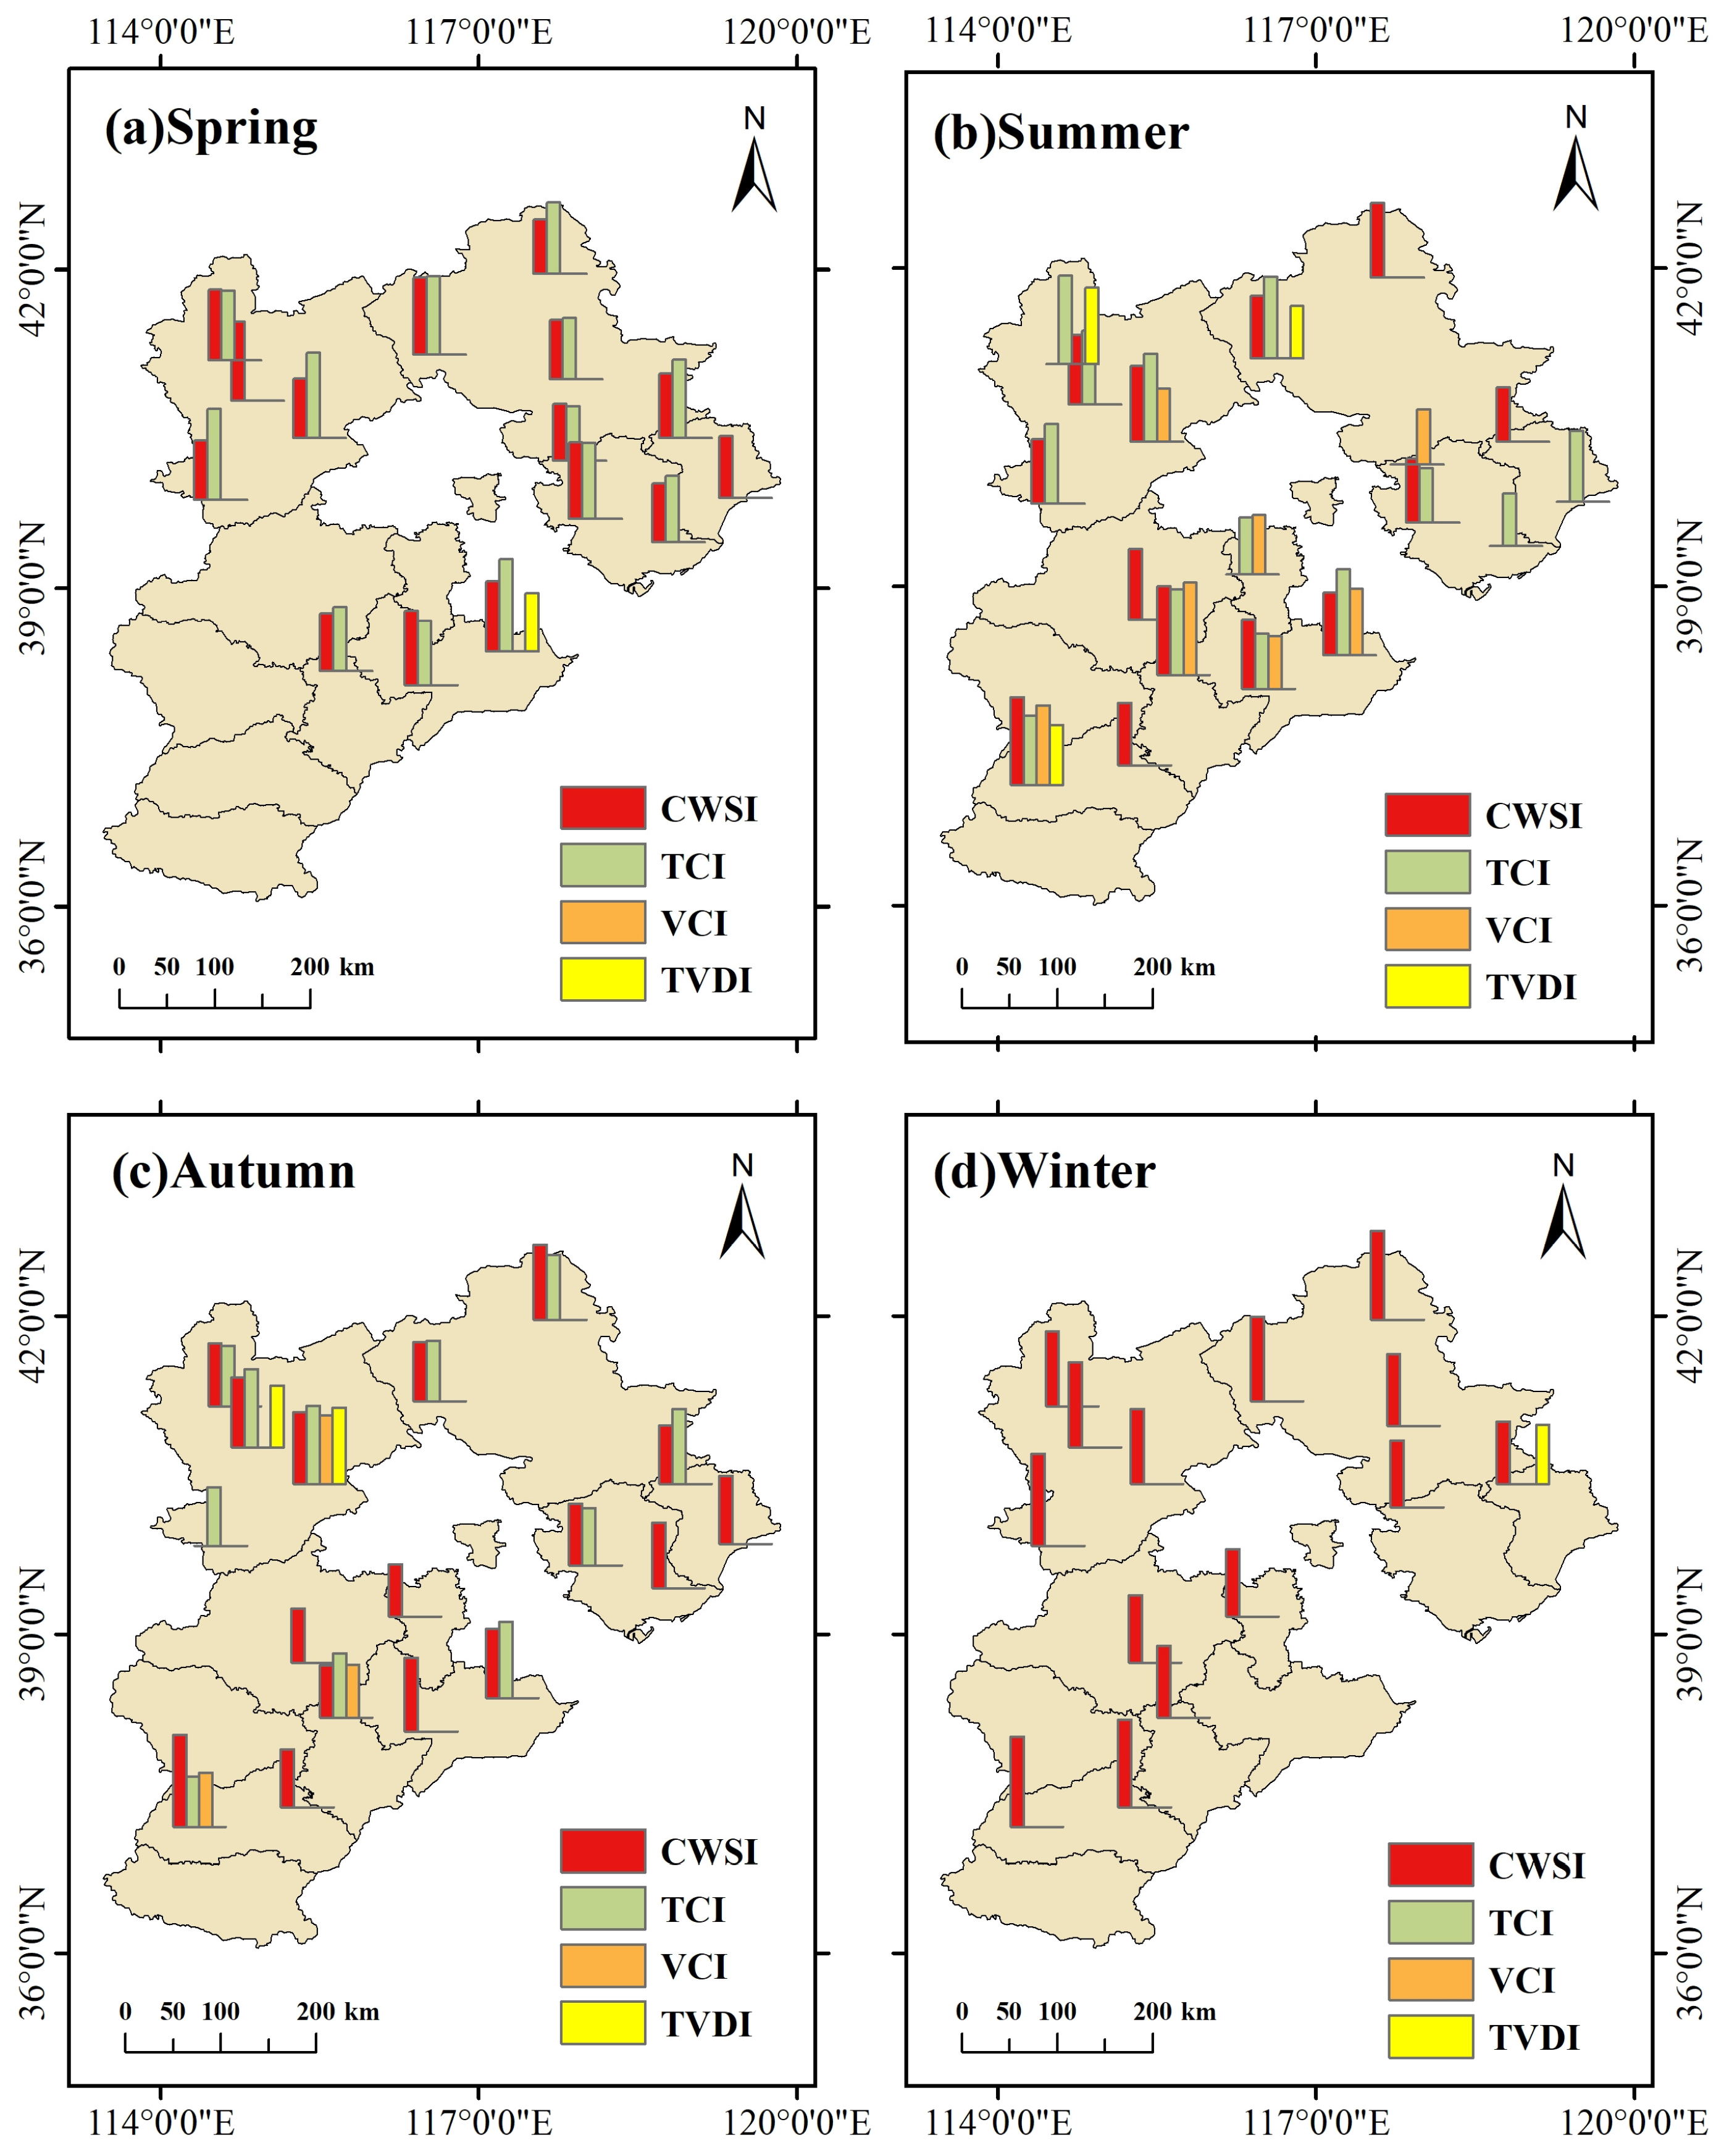
For each meteorological station, the seasonal values of CWSI, TCI, VCI, and TVDI were extracted from the corresponding grid pixel during 2001–2020. In each season, the annual seasonal values of each remote-sensing index were correlated with the corresponding SPEI value at the same station and year. The absolute value of the correlation coefficient, |r|, was used to compare the consistency strength among indices with different drought directions. Therefore, each index obtained one temporal correlation coefficient for each station and each season. Bar charts were used to display the correlation coefficients at each station to evaluate the spatial consistency and inter-station differences in index performance (Figure 3).
In spring, CWSI and TCI performed relatively well, with 15 and 13 stations passing the significance test, respectively. VCI had no significant stations, and TVDI reached significance only at Huanghua Station. In summer, CWSI, TCI, and VCI had 13, 13, and 7 stations with significant correlations, respectively. In autumn, CWSI had the largest number of significant stations (16), and the highest correlation coefficient at Xingtai Station exceeded 0.8. TCI had 11 significant stations. In winter, only CWSI maintained relatively stable performance, with 14 stations passing the significance test, while the other indices had almost no significant correlations. Overall, CWSI had a higher absolute correlation coefficient than the other three indices at 58% of the stations.
To comprehensively evaluate the consistency between the four remote-sensing drought indices and SPEI-3, this study used Taylor statistics for comparison. Before calculation, the indication directions of all indices were unified so that larger values represented better moisture conditions for all indices. Then, based on the monthly series from 19 meteorological stations during 2001–2020, the correlation coefficient R, normalized standard deviation (NSD), and normalized centered root mean square difference (NCRMSD) were calculated by season after standardization by calendar month. Higher R, NSD closer to 1, and lower NCRMSD indicate stronger overall consistency between the remote-sensing drought index and SPEI-3. The results are shown in Figure 4.
The Taylor statistics further showed clear seasonal differences in the consistency between the four remote-sensing drought indices and SPEI-3. In spring, TCI showed the best overall consistency with SPEI-3, with the highest R and the lowest NCRMSD. In summer, autumn, and winter, CWSI performed better than the other three indices, mainly reflected by higher R values and lower NCRMSD values. Although VCI had an NSD closer to 1 in winter, its correlation with SPEI-3 was weaker than that of CWSI. Overall, TCI performed better in spring, whereas CWSI showed stronger and more stable consistency in summer, autumn, and winter. This indicates that CWSI had more stable overall monitoring ability at the seasonal scale.

3.1.2. Drought Index Evaluation Based on SPI

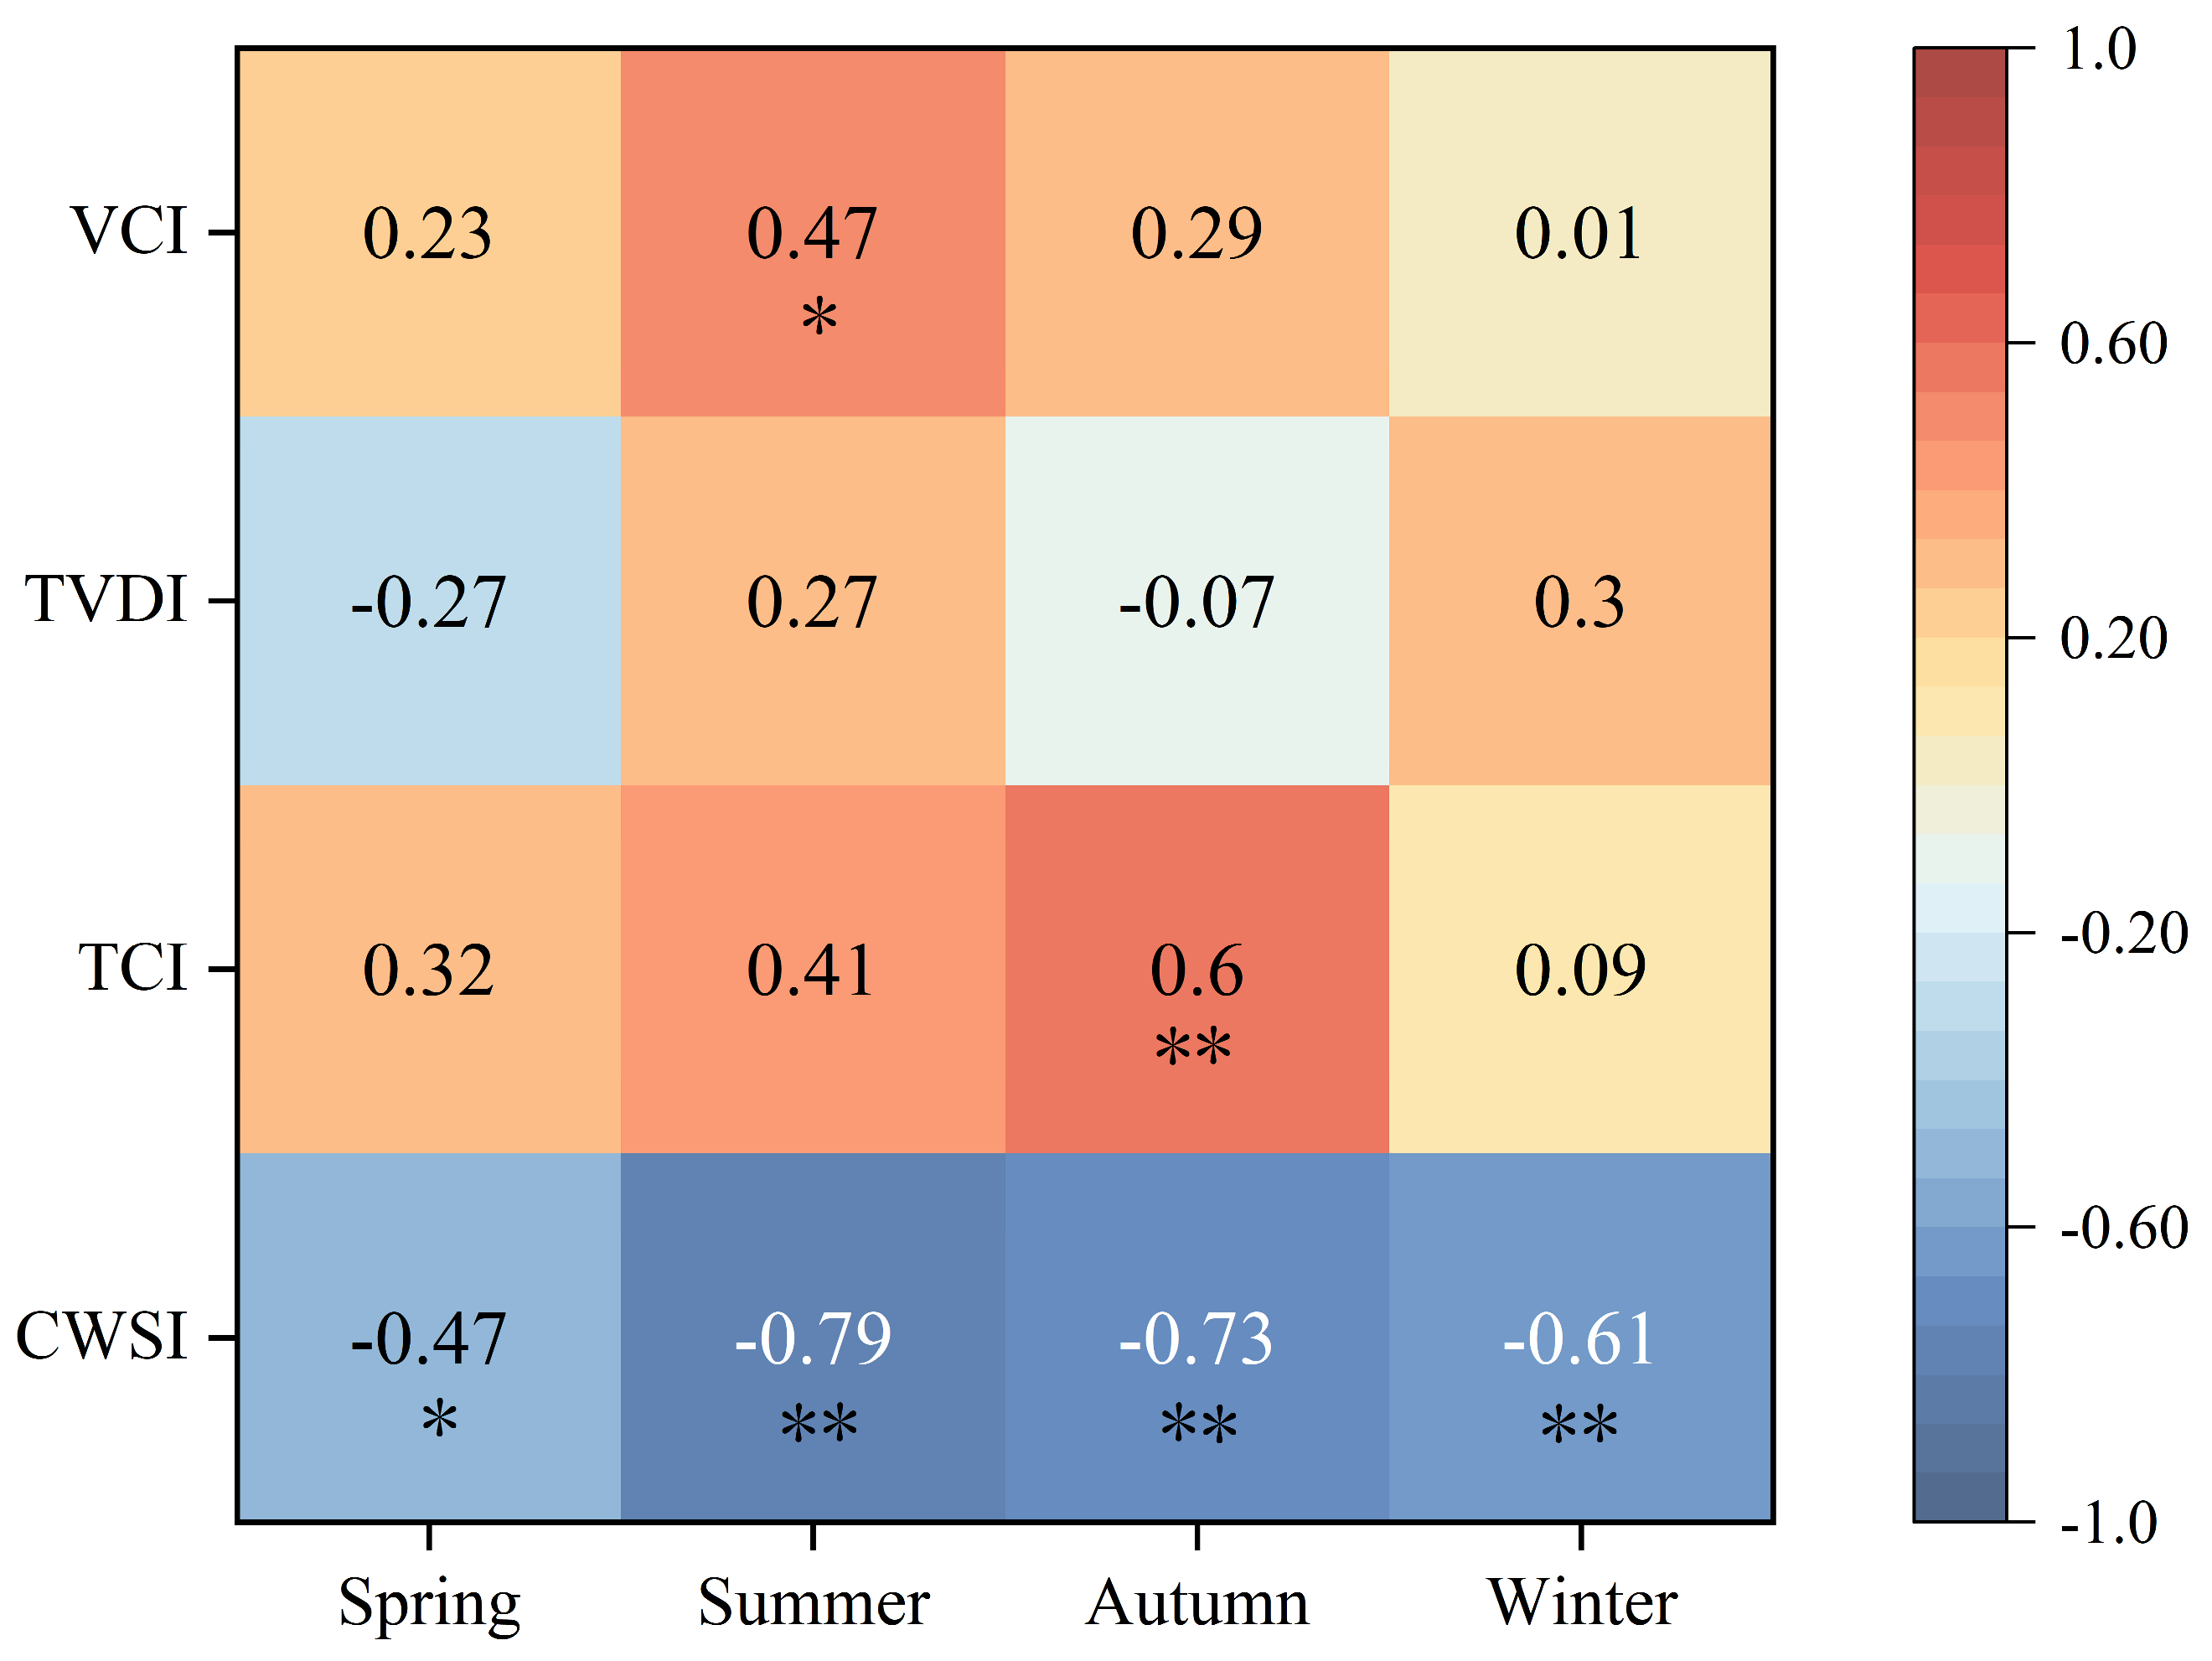
Correlation analysis showed that CWSI was significantly negatively correlated with SPI in all four seasons, with the strongest correlations in summer (R = −0.79) and autumn (R = −0.73) (Figure 5). In contrast, TCI was significant only in autumn (R = 0.60, p < 0.01), VCI only in summer, and TVDI in none of the four seasons. Overall, CWSI showed the most stable cross-season relationship with SPI.
The data were first standardized by station and calendar month. This reduced the effects of station differences and seasonal cycles. Station-level Pearson correlations were then calculated between the four remote-sensing drought indices and SPI/SPEI at different accumulation scales. The results are shown in Table 5. Overall, CWSI had the highest median absolute correlation coefficient under all eight SPI/SPEI reference series. The station-level median correlations between CWSI and SPI/SPEI ranged from −0.247 to −0.445, and 18–19 stations reached the significance level (p < 0.05) under each reference series. In comparison, TCI showed moderate positive correlations, while TVDI and VCI had generally weaker correlations and fewer stations with significant correlations. These results indicate that the correspondence between CWSI and meteorological water deficit was relatively stable at most stations, and its advantage was not driven by a few stations or seasonal cycle effects.

3.1.3. Drought Index Evaluation Based on SMCI1.0

Monthly values were aggregated into seasonal means by averaging the three constituent months of each season. For each pixel, correlation coefficients were calculated using temporally matched valid pairs of the remote-sensing drought index and SMCI1.0, and masked or invalid observations were excluded. The statistical significance of the pixel-wise Pearson correlations was evaluated at the p < 0.05 level. The results showed that CWSI was negatively correlated with 10 cm soil moisture in all four seasons, indicating a relatively stable relationship between CWSI and soil moisture deficit (Figure 6). The mean correlation coefficients of CWSI in spring, summer, autumn, and winter were −0.216, −0.335, −0.528, and −0.368, respectively. The proportions of significantly correlated pixels were 16.29%, 17.58%, 34.62%, and 16.71%, respectively. Among the significantly correlated pixels, the mean correlation coefficients reached −0.331, −0.569, −0.605, and −0.530, respectively. CWSI showed the strongest consistency with SMCI1.0 in autumn, with both the mean correlation coefficient and the proportion of significantly correlated pixels higher than those of the other indices. In winter, CWSI still maintained a clear negative correlation, while the correlations of TCI, VCI, and TVDI weakened markedly or showed unstable directions.
In comparison, TCI performed better in summer and autumn, but its correlations decreased significantly in spring and winter, indicating strong seasonal dependence in its soil moisture response. VCI showed generally weak correlations, and its correlation direction in spring and winter was inconsistent with expectations. TVDI showed negative correlations in spring, summer, and autumn, but the proportion of significantly correlated pixels was low, and a weak positive correlation appeared in winter. Overall, CWSI showed the most stable soil moisture response among the four tested indices. This result supports its selection for the subsequent analysis in Hebei Province.

3.1.4. Evaluation of Drought Identification Ability Based on Classification Metrics

The classification evaluation results based on monthly station-level samples showed that CWSI had the highest ROC–AUC and PR–AUC among the four tested indices under all four reference labels (Table 6). During the independent validation period of 2015–2020, the CSI and F1-score of CWSI were also generally higher than those of the other indices. Although CWSI had the lowest FAR among the four indices, its false-alarm rate remained relatively high. Overall, CWSI showed moderate discrimination. Nevertheless, under the evaluation framework used in this study, it ranked first among the four tested indices and showed the strongest overall classification performance. Detailed results are provided in Table S4a,b.

3.1.5. Comparative Evaluation Based on Major Drought Events

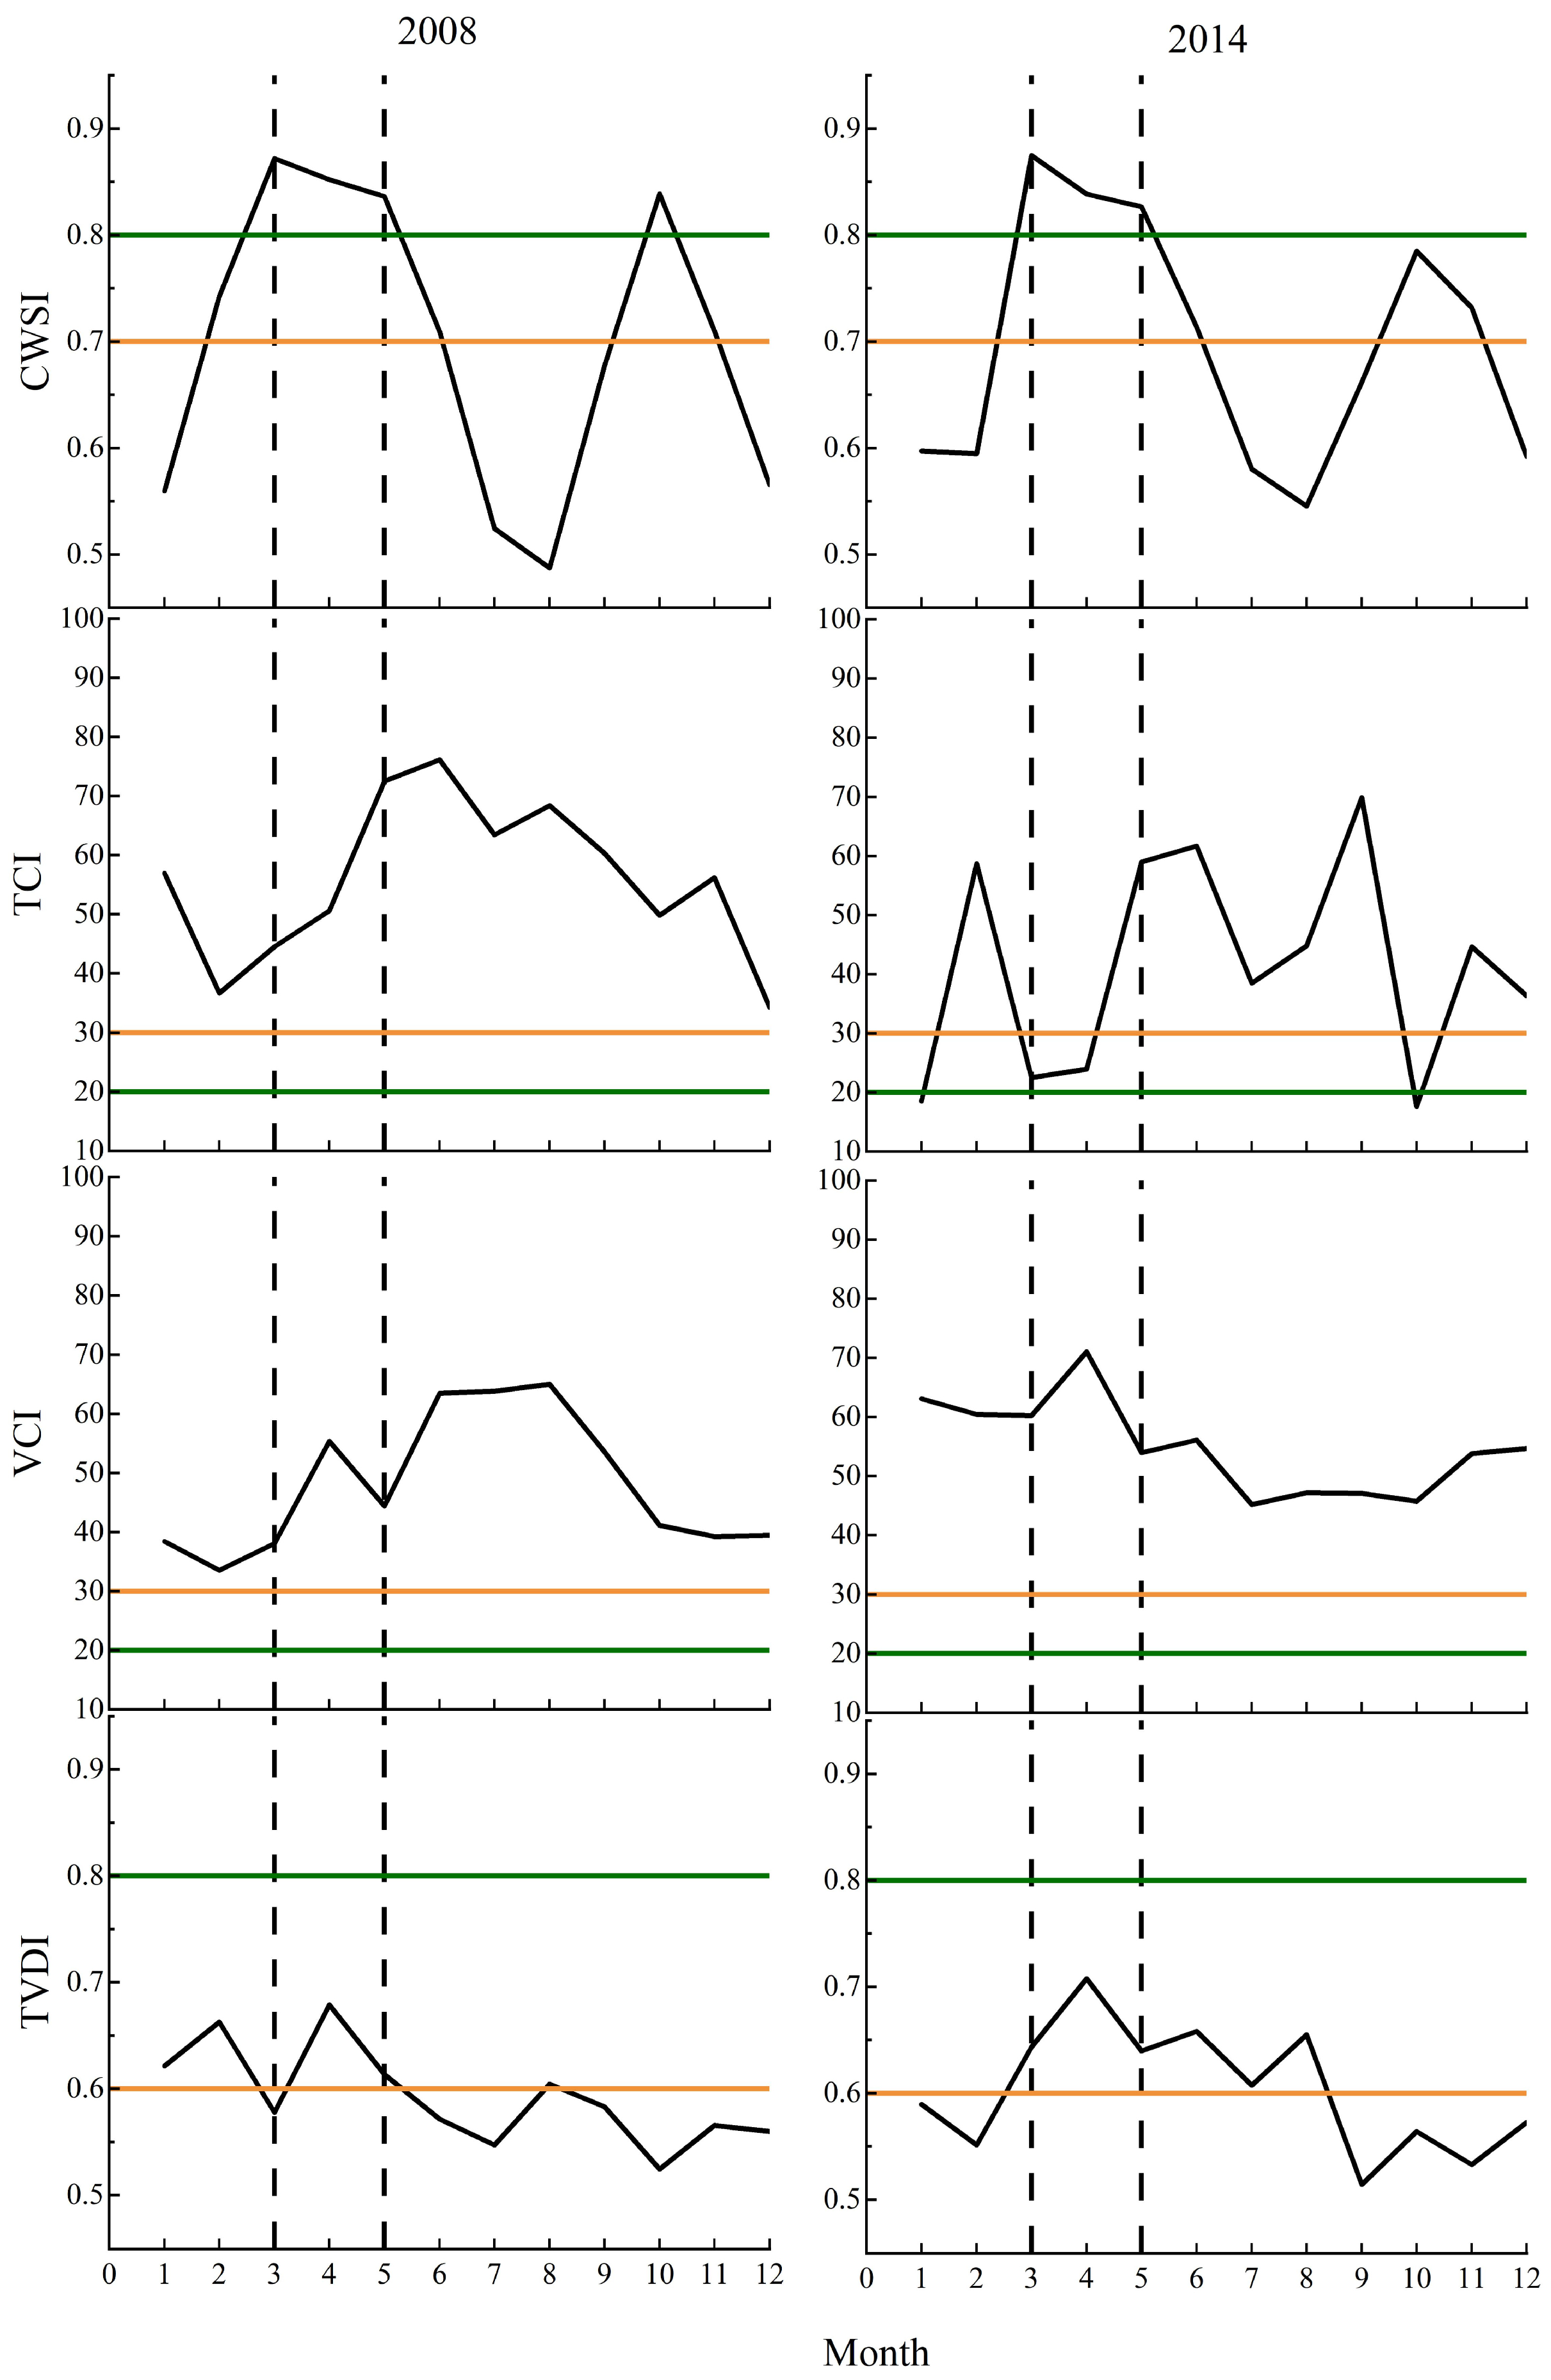
In early spring 2008, Hebei Province experienced a severe drought event [86]. From early February to mid-March, cumulative precipitation was less than 2 mm, more than 80% below the climatological average, and the maximum drought-affected area reached 3.335 million ha, equivalent to approximately 50 million mu. Winter wheat suffered severe water stress, making this one of the most severe spring drought events in the North China Plain in recent years. During March–May 2008 (Figure 7), CWSI remained above the severe drought threshold (≥0.8), indicating that it could continuously reflect this spring drought process. In contrast, TCI values were 44.5, 50.6, and 72.5, all above the moderate drought threshold, indicating that TCI failed to identify this drought event. VCI values were 38.1, 55.3, and 44.4, also above the moderate drought threshold, suggesting that VCI did not effectively capture the prevailing drought conditions. TVDI values were 0.58, 0.68, and 0.61. It reached the moderate drought grade in April and May but remained below the severe drought threshold. This indicates that TVDI responded to the event to some extent, but it underestimated the drought intensity.
In spring 2014, Hebei Province experienced a severe drought event [87]. In March, the provincial mean precipitation was only 2.3 mm, nearly 80% below the climatological average, while the mean temperature was 3.4 °C above normal. The persistent warm and dry conditions accelerated soil moisture depletion and intensified agricultural water stress. A total of 6.10 million mu of winter wheat and 18.00 million mu of spring-sown land were affected by drought stress. CWSI values in March, April, and May were 0.87, 0.84, and 0.83, respectively, all reaching the severe drought grade. TCI only weakly indicated moderate drought in March and April, with values of 22.5 and 23.9, and indicated no drought in May. VCI values were 60.2, 71.0, and 53.9, indicating that VCI failed to detect the event. TVDI values were 0.64, 0.71, and 0.64. They reached the moderate drought grade but remained below the severe drought threshold. Therefore, TVDI identified the persistence of this spring drought but underestimated drought intensity.
The comparison of the two major spring drought events showed that CWSI more stably and continuously captured severe crop water stress, whereas TCI, VCI, and TVDI showed different degrees of fluctuation or underestimation. Therefore, CWSI was selected for the subsequent analysis.

3.1.6. CWSI Threshold Sensitivity Analysis

After CWSI was selected for subsequent spatiotemporal analysis, a threshold sensitivity analysis was conducted to examine whether the main CWSI-based drought classification and trend conclusions were robust to the adopted drought-grade thresholds. Based on the baseline scheme (0.60, 0.70, 0.80, and 0.90), a loose scheme (0.55, 0.65, 0.75, and 0.85) and a strict scheme (0.65, 0.75, 0.85, and 0.95) were set. The seasonal area proportions of drought grades, the area proportion of severe-and-above drought, and the temporal trends in area were compared under different threshold schemes. The results showed that different threshold schemes affected the absolute area proportions of each drought grade. However, the main conclusions remained consistent under different threshold schemes, including the overall decrease in CWSI in Hebei Province during 2001–2023, the overall decrease in severe-and-above drought area, and the relatively high CWSI-derived drought intensity in spring. Therefore, the CWSI threshold scheme used in this study can serve as a practical standard for regional-scale drought grade classification, but it should not be interpreted as an absolute drought threshold strictly calibrated by local field observations. Detailed sensitivity analysis results are shown in Table S5a–c.

3.2. Temporal Variation Characteristics of Drought

Under the multi-source consistency evaluation framework used in this study, CWSI showed the most consistent overall performance among the four tested indices. Therefore, it was selected for the subsequent analysis of temporal and spatial drought patterns during 2001–2023.
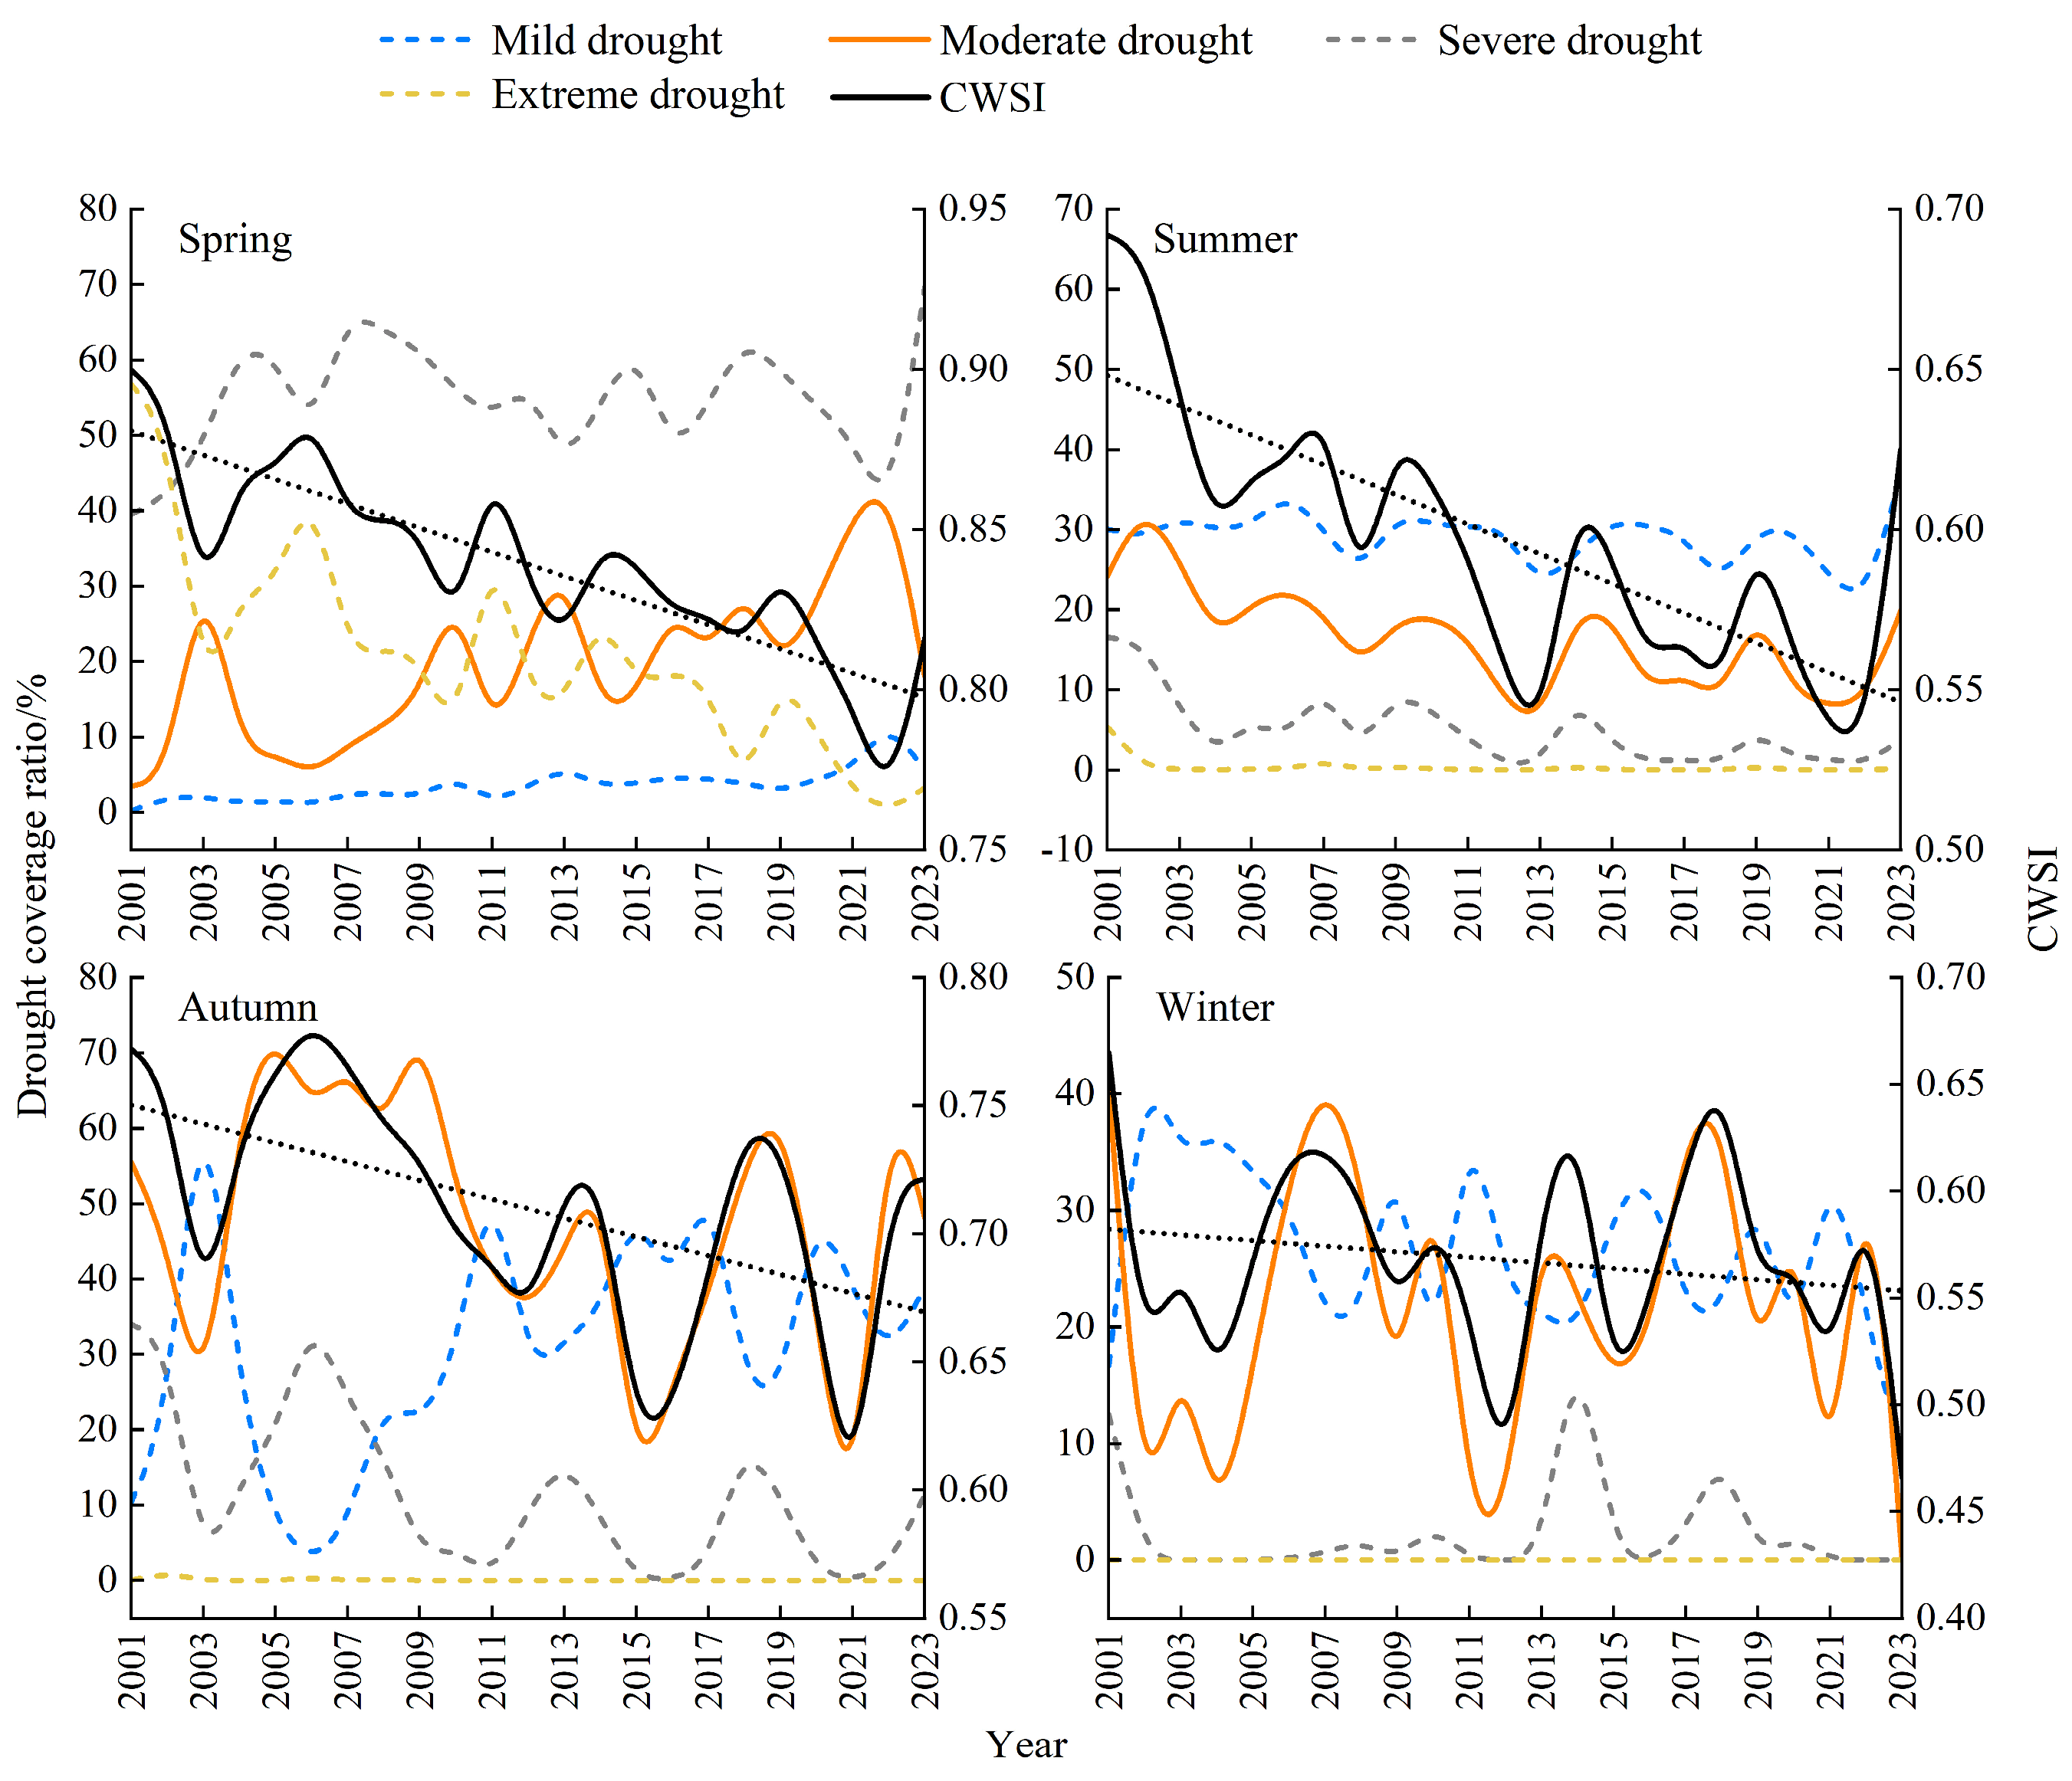
As shown in Figure 8, spring CWSI showed a decreasing trend at a rate of −0.039 per decade (p < 0.01). The areas of mild and moderate drought increased (p < 0.01), whereas the area of extreme drought decreased (p < 0.01), and severe drought showed no significant change. These concurrent changes indicate a decrease in spring CWSI-derived drought intensity and a shift in the threshold-defined drought-grade structure from extreme drought toward mild and moderate drought.
Summer CWSI showed a decreasing trend at a rate of −0.054 per decade (p < 0.01). The areas of moderate, severe, and extreme drought all decreased, indicating an overall decline in summer CWSI-derived drought intensity.
Autumn CWSI showed a decreasing trend at a rate of −0.037 per decade (p < 0.05). The area of mild drought increased significantly (p < 0.05), while severe drought decreased significantly (p < 0.05). Moderate and extreme drought showed non-significant decreasing trends. These changes indicate a shift toward milder threshold-defined drought grades, accompanied by an overall decline in autumn CWSI-derived drought intensity.
Winter CWSI showed a non-significant decreasing trend at a rate of −0.012 per decade. Changes in the areas of all drought grades were not significant. Mild and moderate drought showed slight fluctuations, while severe and extreme drought remained basically unchanged.

3.3. Spatial Variation Characteristics of Drought

3.3.1. Spatial Distribution of Drought Frequency

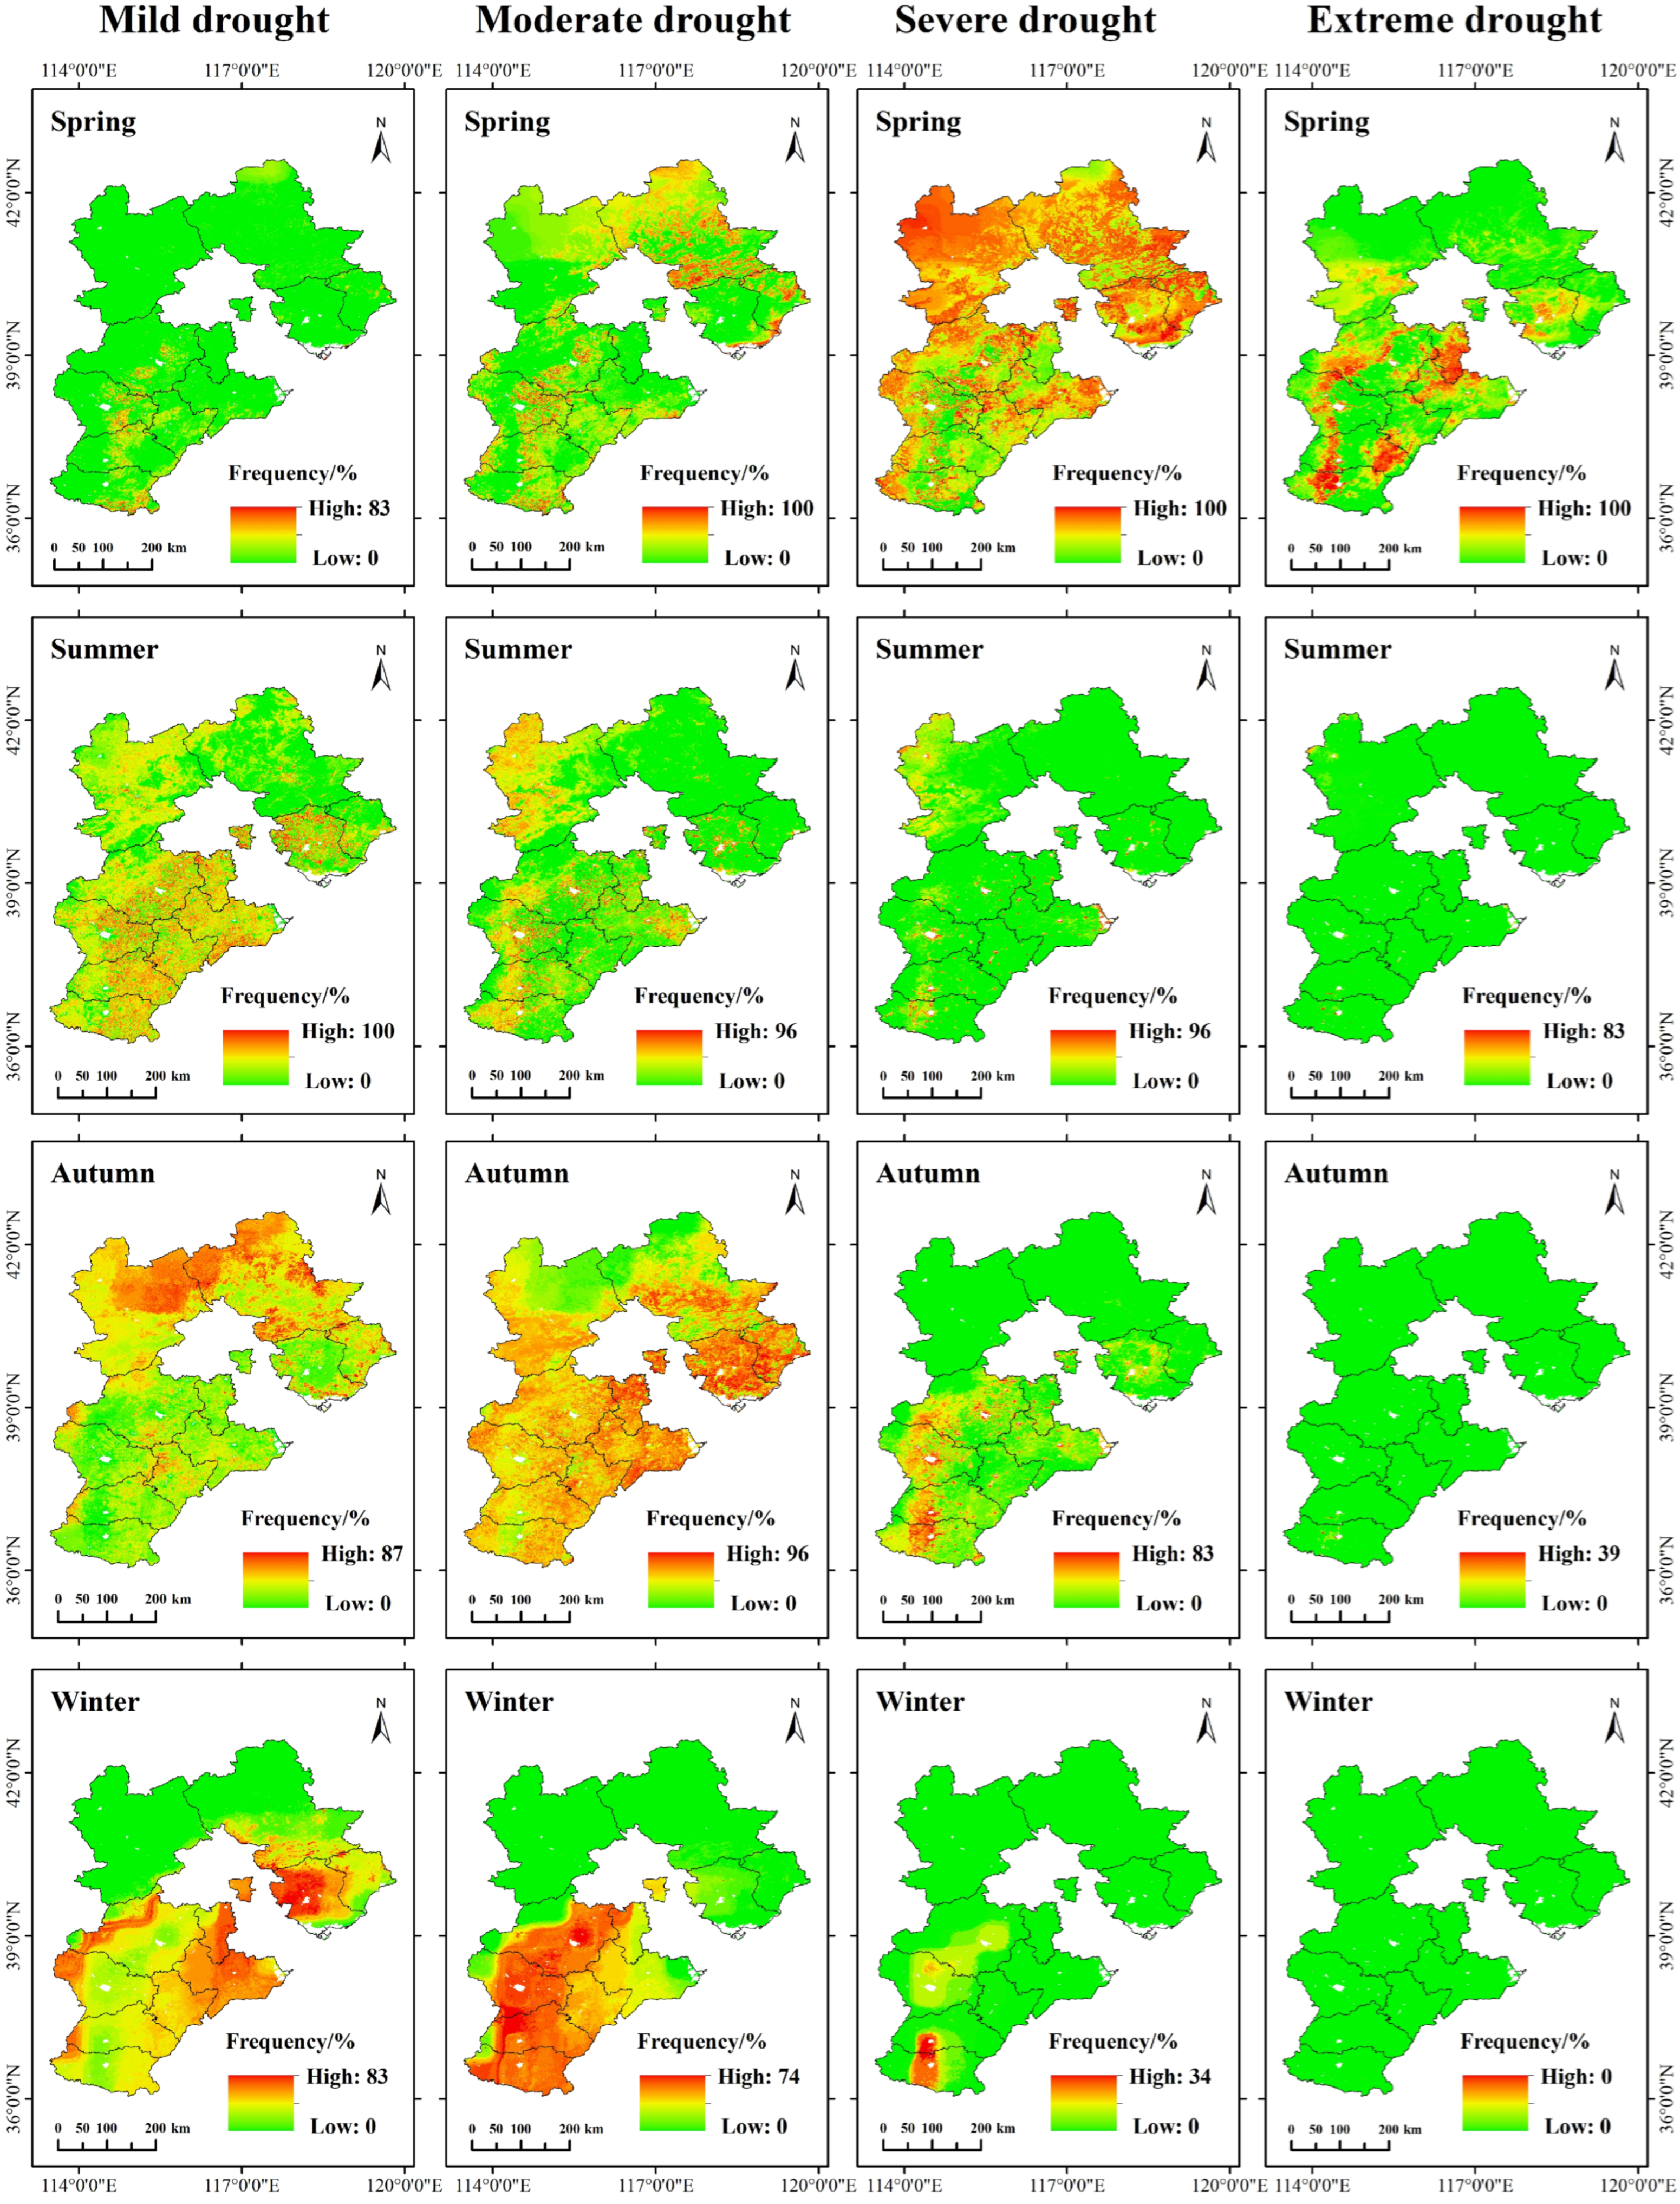
From the perspective of drought grades (Figure 9), the frequency patterns of different drought grades showed clear seasonal heterogeneity. Mild drought occurred at a relatively low frequency in spring, increased in southern Hebei in summer, and was mainly concentrated in northern Hebei, particularly Zhangjiakou and Chengde, in autumn. In winter, relatively high mild-drought frequencies mainly occurred in eastern areas such as Tangshan and Cangzhou. Moderate drought was limited in spring, concentrated in southwestern Hebei in summer, expanded across most of the province in autumn, and remained relatively frequent in areas south of Zhangjiakou and Tangshan in winter. Severe drought was widespread in spring, became more spatially scattered in summer, and was mainly concentrated in Baoding, Shijiazhuang, Xingtai, and Handan in autumn. In winter, high-frequency severe drought was limited to the southern margin. Extreme drought was mainly distributed in local areas of central and southern Hebei in spring, became more spatially restricted in summer and autumn, and almost disappeared in winter.
Overall, severe-and-above drought was most frequent and widespread in spring. In summer and autumn, severe-and-above drought became less extensive, whereas mild and moderate drought were more prominent. Winter showed the weakest overall drought conditions, with only limited severe drought along the southern margin and almost no extreme drought.

3.3.2. Spatial Distribution and Area Proportion of Different Drought Grades

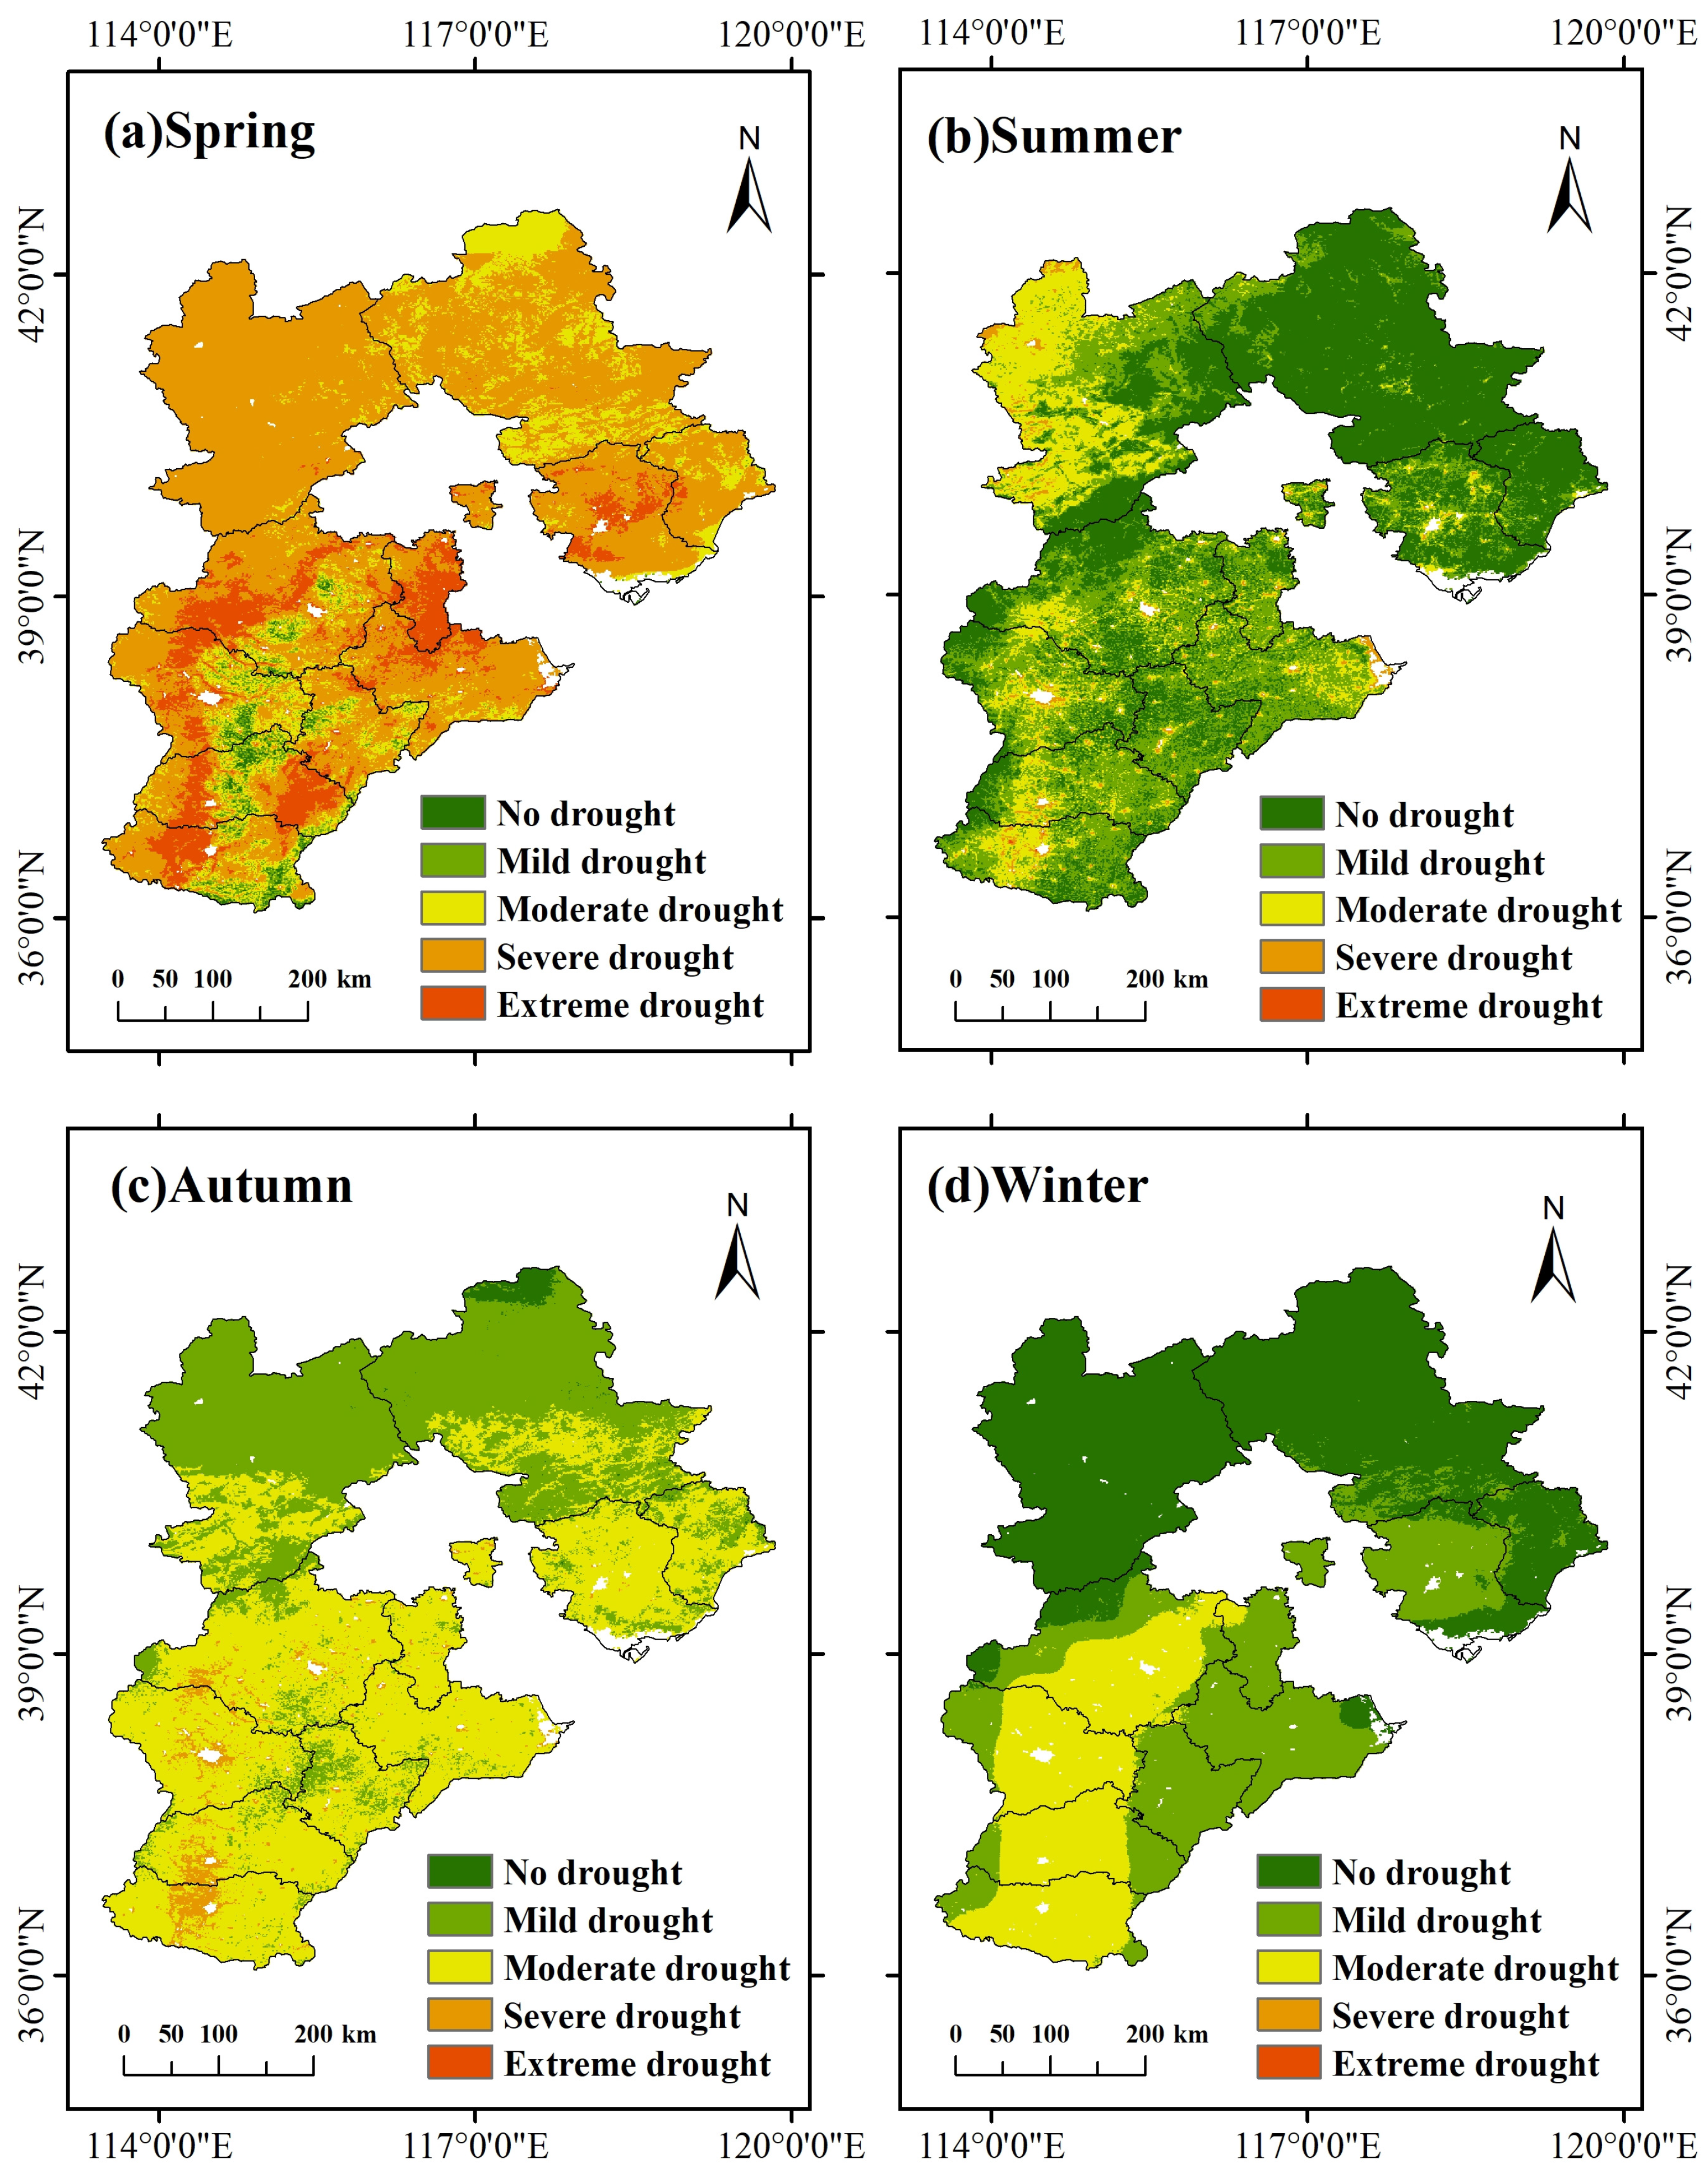
As shown in Figure 10, spring in Hebei Province was generally dominated by moderate and severe drought. Extreme drought was mainly distributed in Langfang and in local areas of Baoding, Shijiazhuang, Xingtai, and Handan. No drought and mild drought were distributed only in small areas of central and southern Hebei Province.
In summer, drought conditions in Hebei Province were clearly alleviated and were generally dominated by no drought and mild drought. No drought became the dominant summer condition. Most areas of the province were under no drought or mild drought. Moderate drought was mainly distributed in western Zhangjiakou and local areas of Shijiazhuang, Xingtai, and Handan. Severe drought was only scattered in local areas, and extreme drought was almost absent.
In autumn, the overall moisture condition in Hebei Province was better than in spring, and mild and moderate drought dominated. Mild drought was mainly distributed in most areas of Chengde, Qinhuangdao, and Zhangjiakou. Moderate drought widely covered areas south of Zhangjiakou and Chengde and was the dominant drought type in autumn.
In winter, drought conditions in Hebei Province were relatively alleviated and were mainly dominated by no drought and mild drought. No drought was the dominant winter condition and was most widely distributed in northern and eastern coastal areas.

3.3.3. Spatial Trends in Drought Intensity

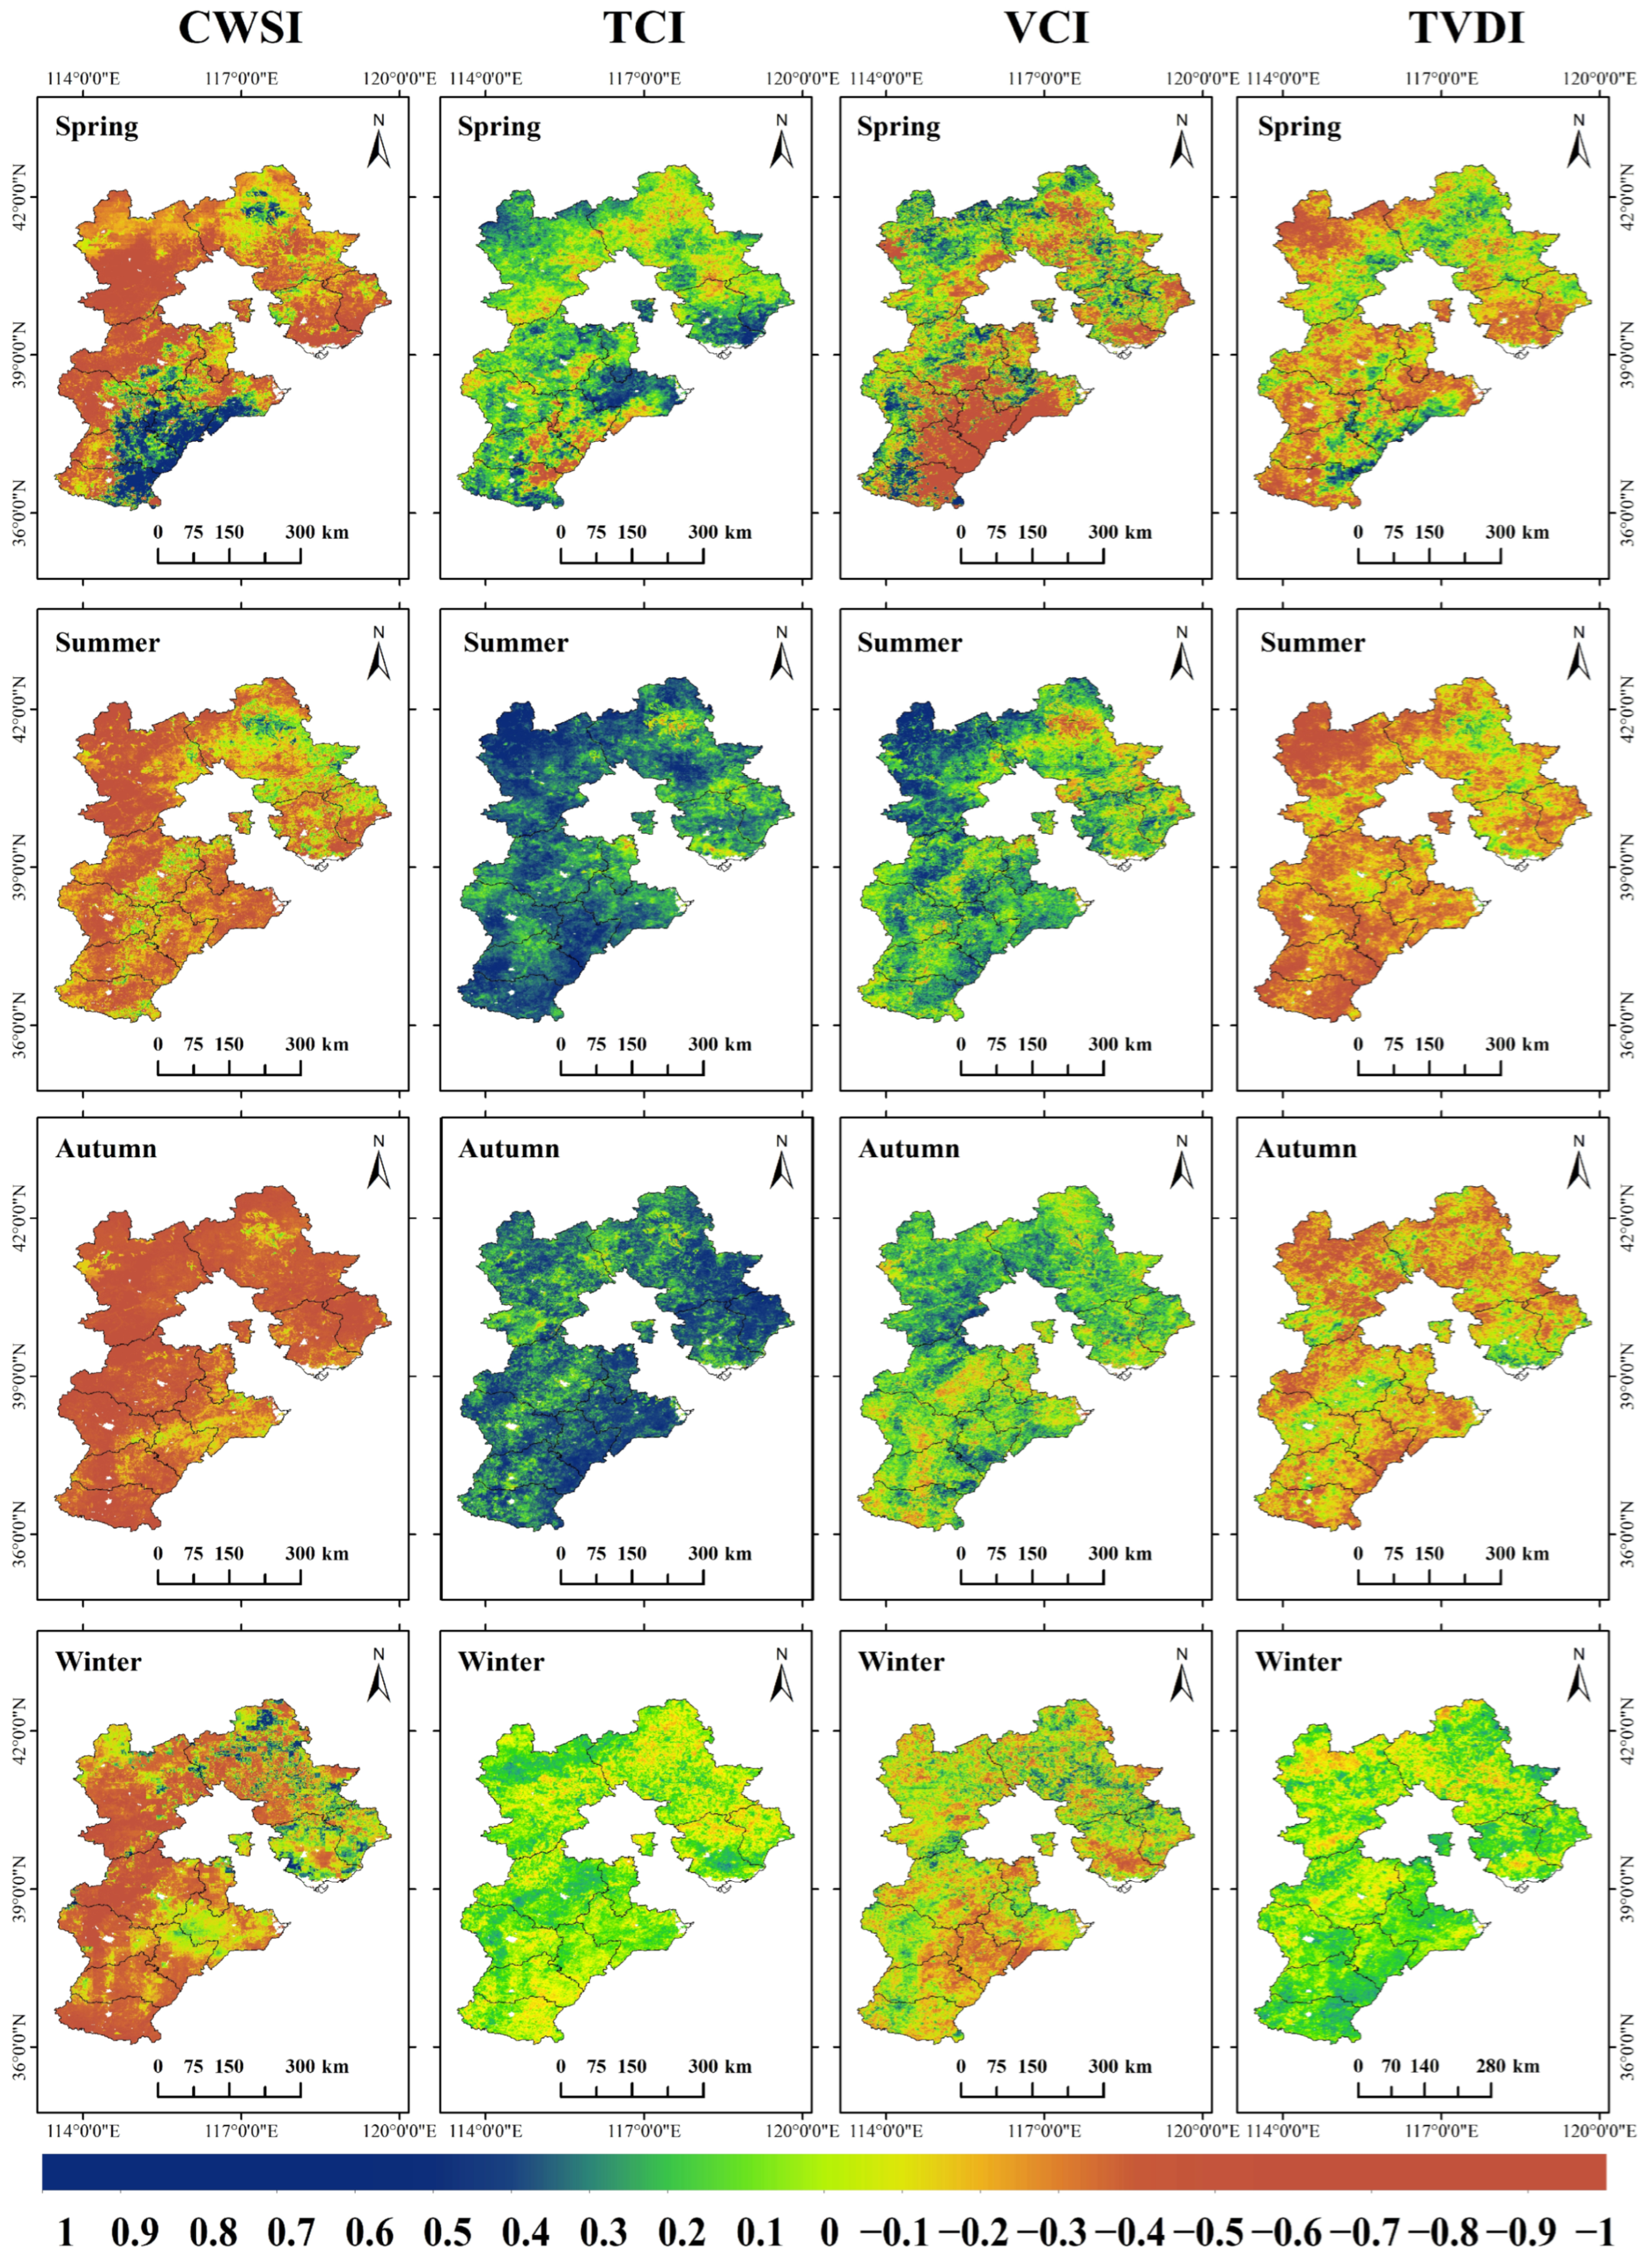
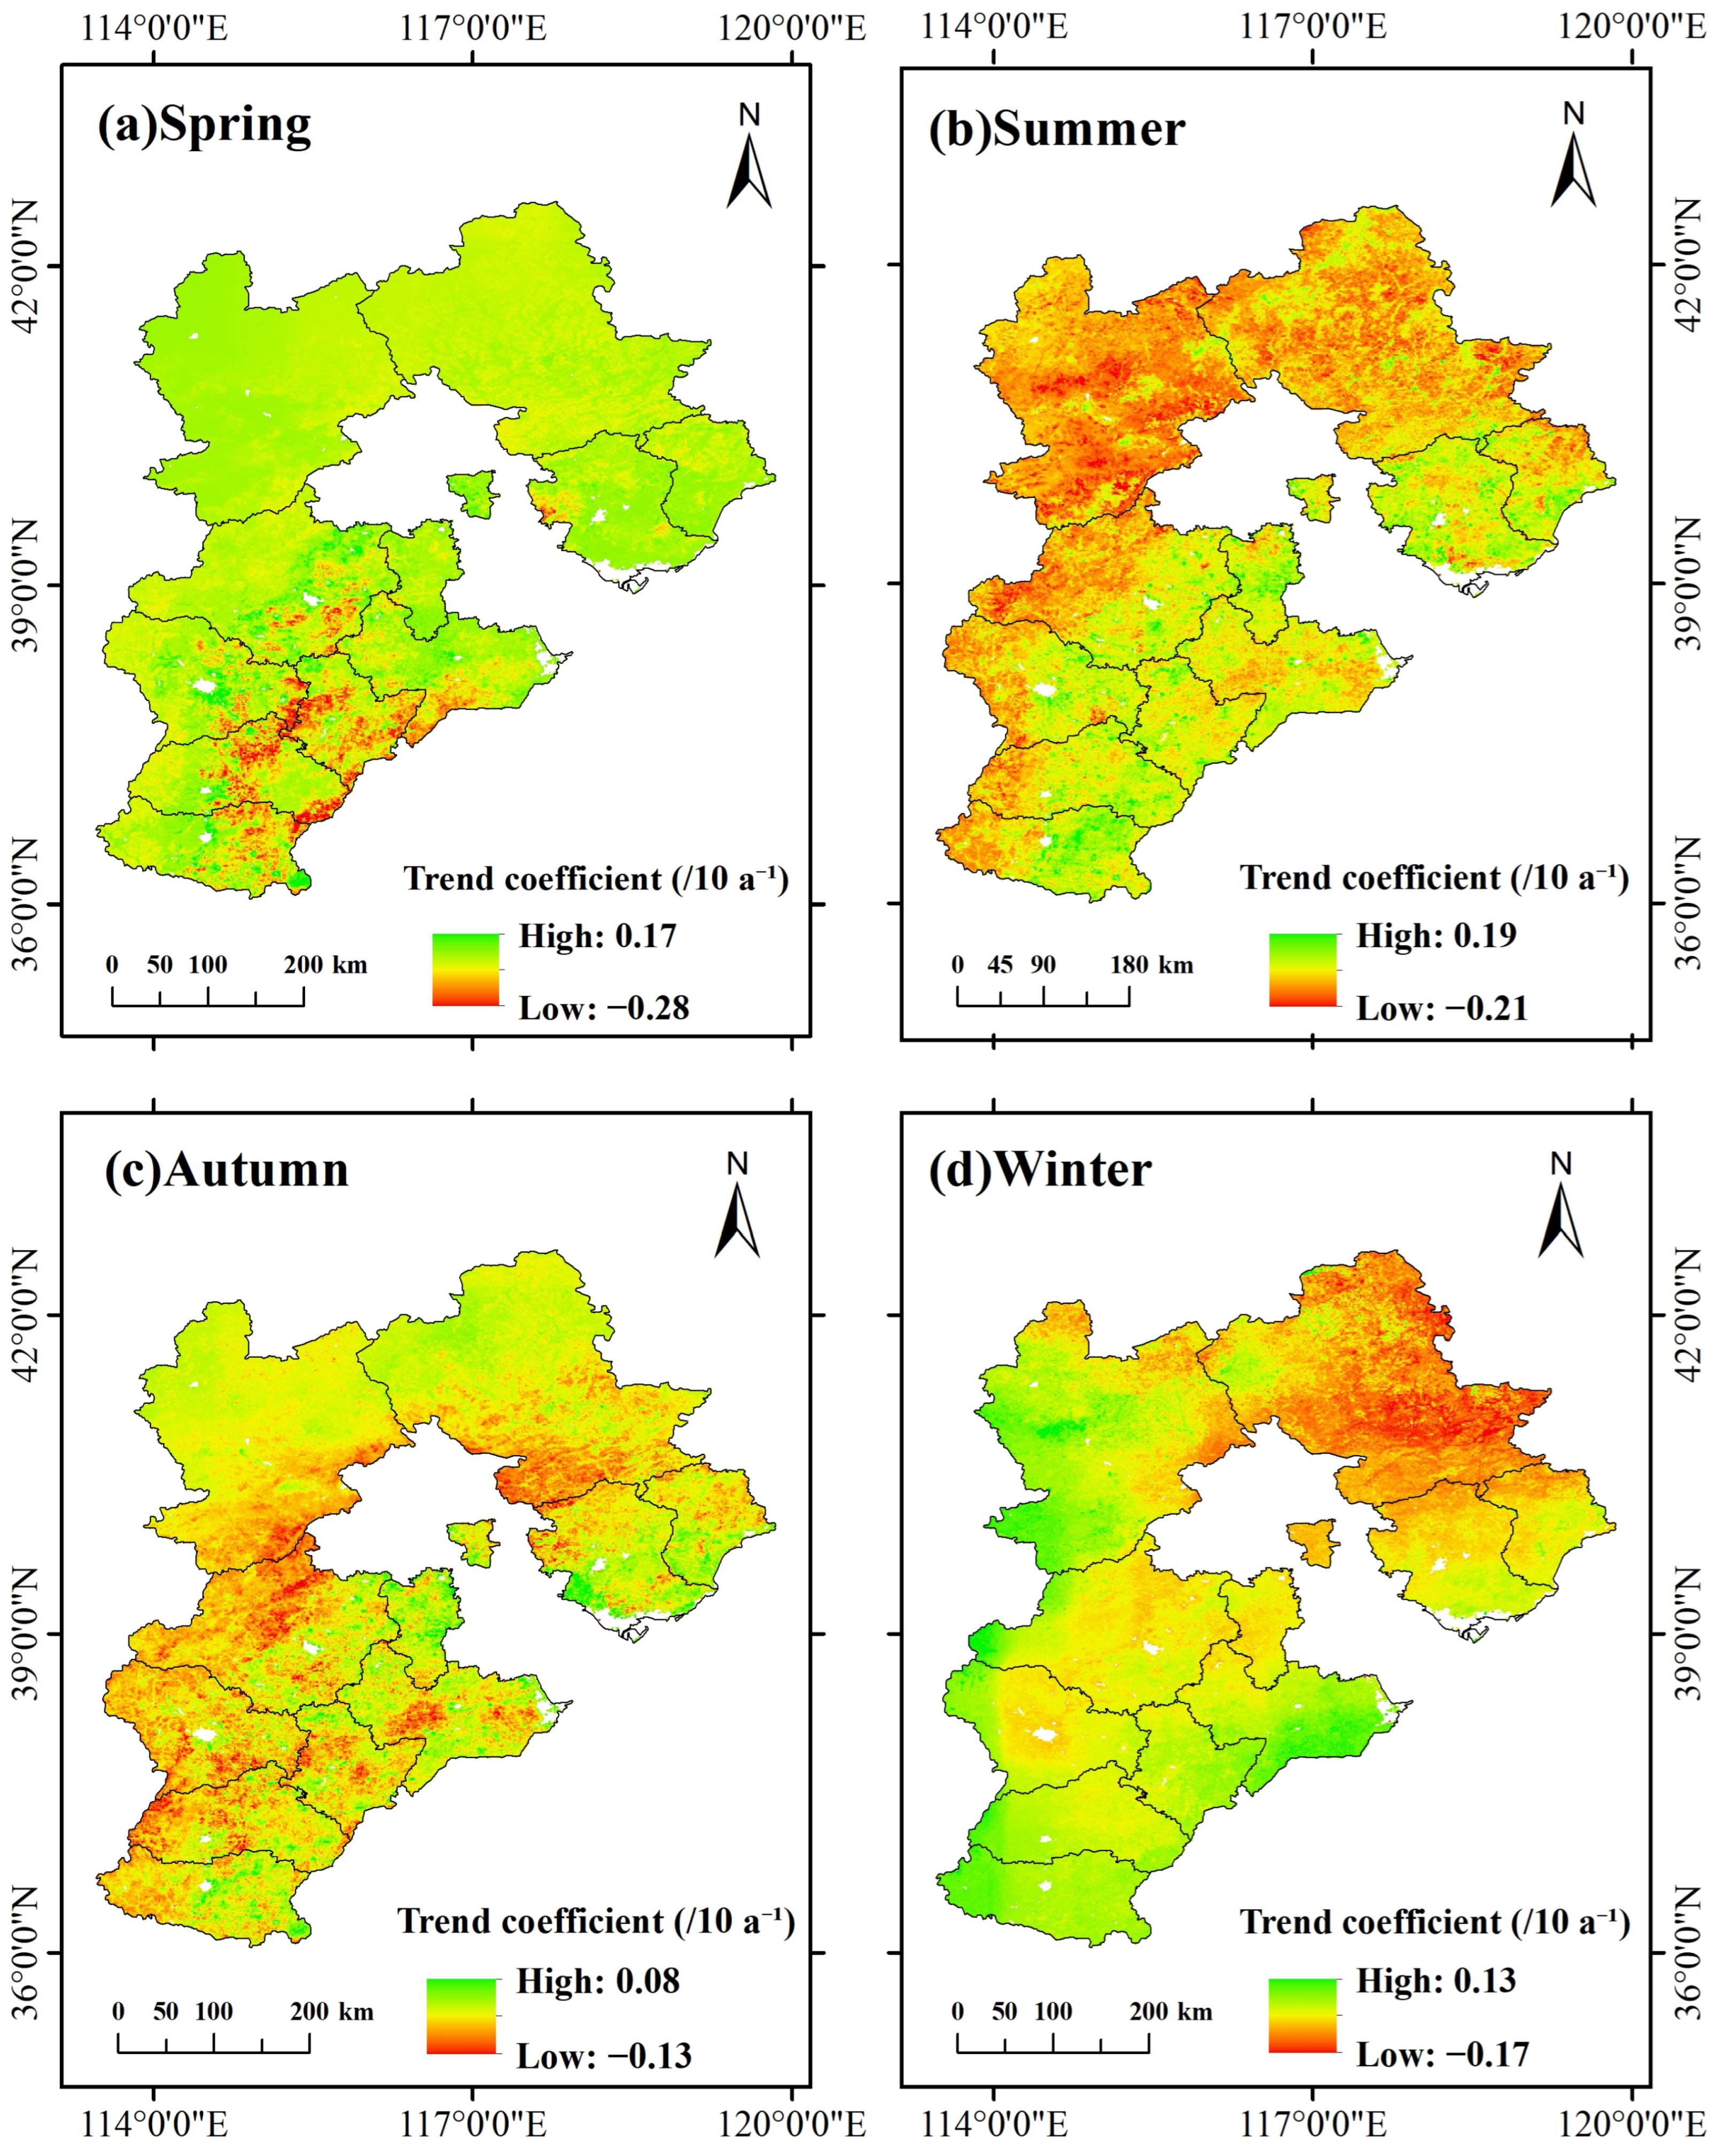
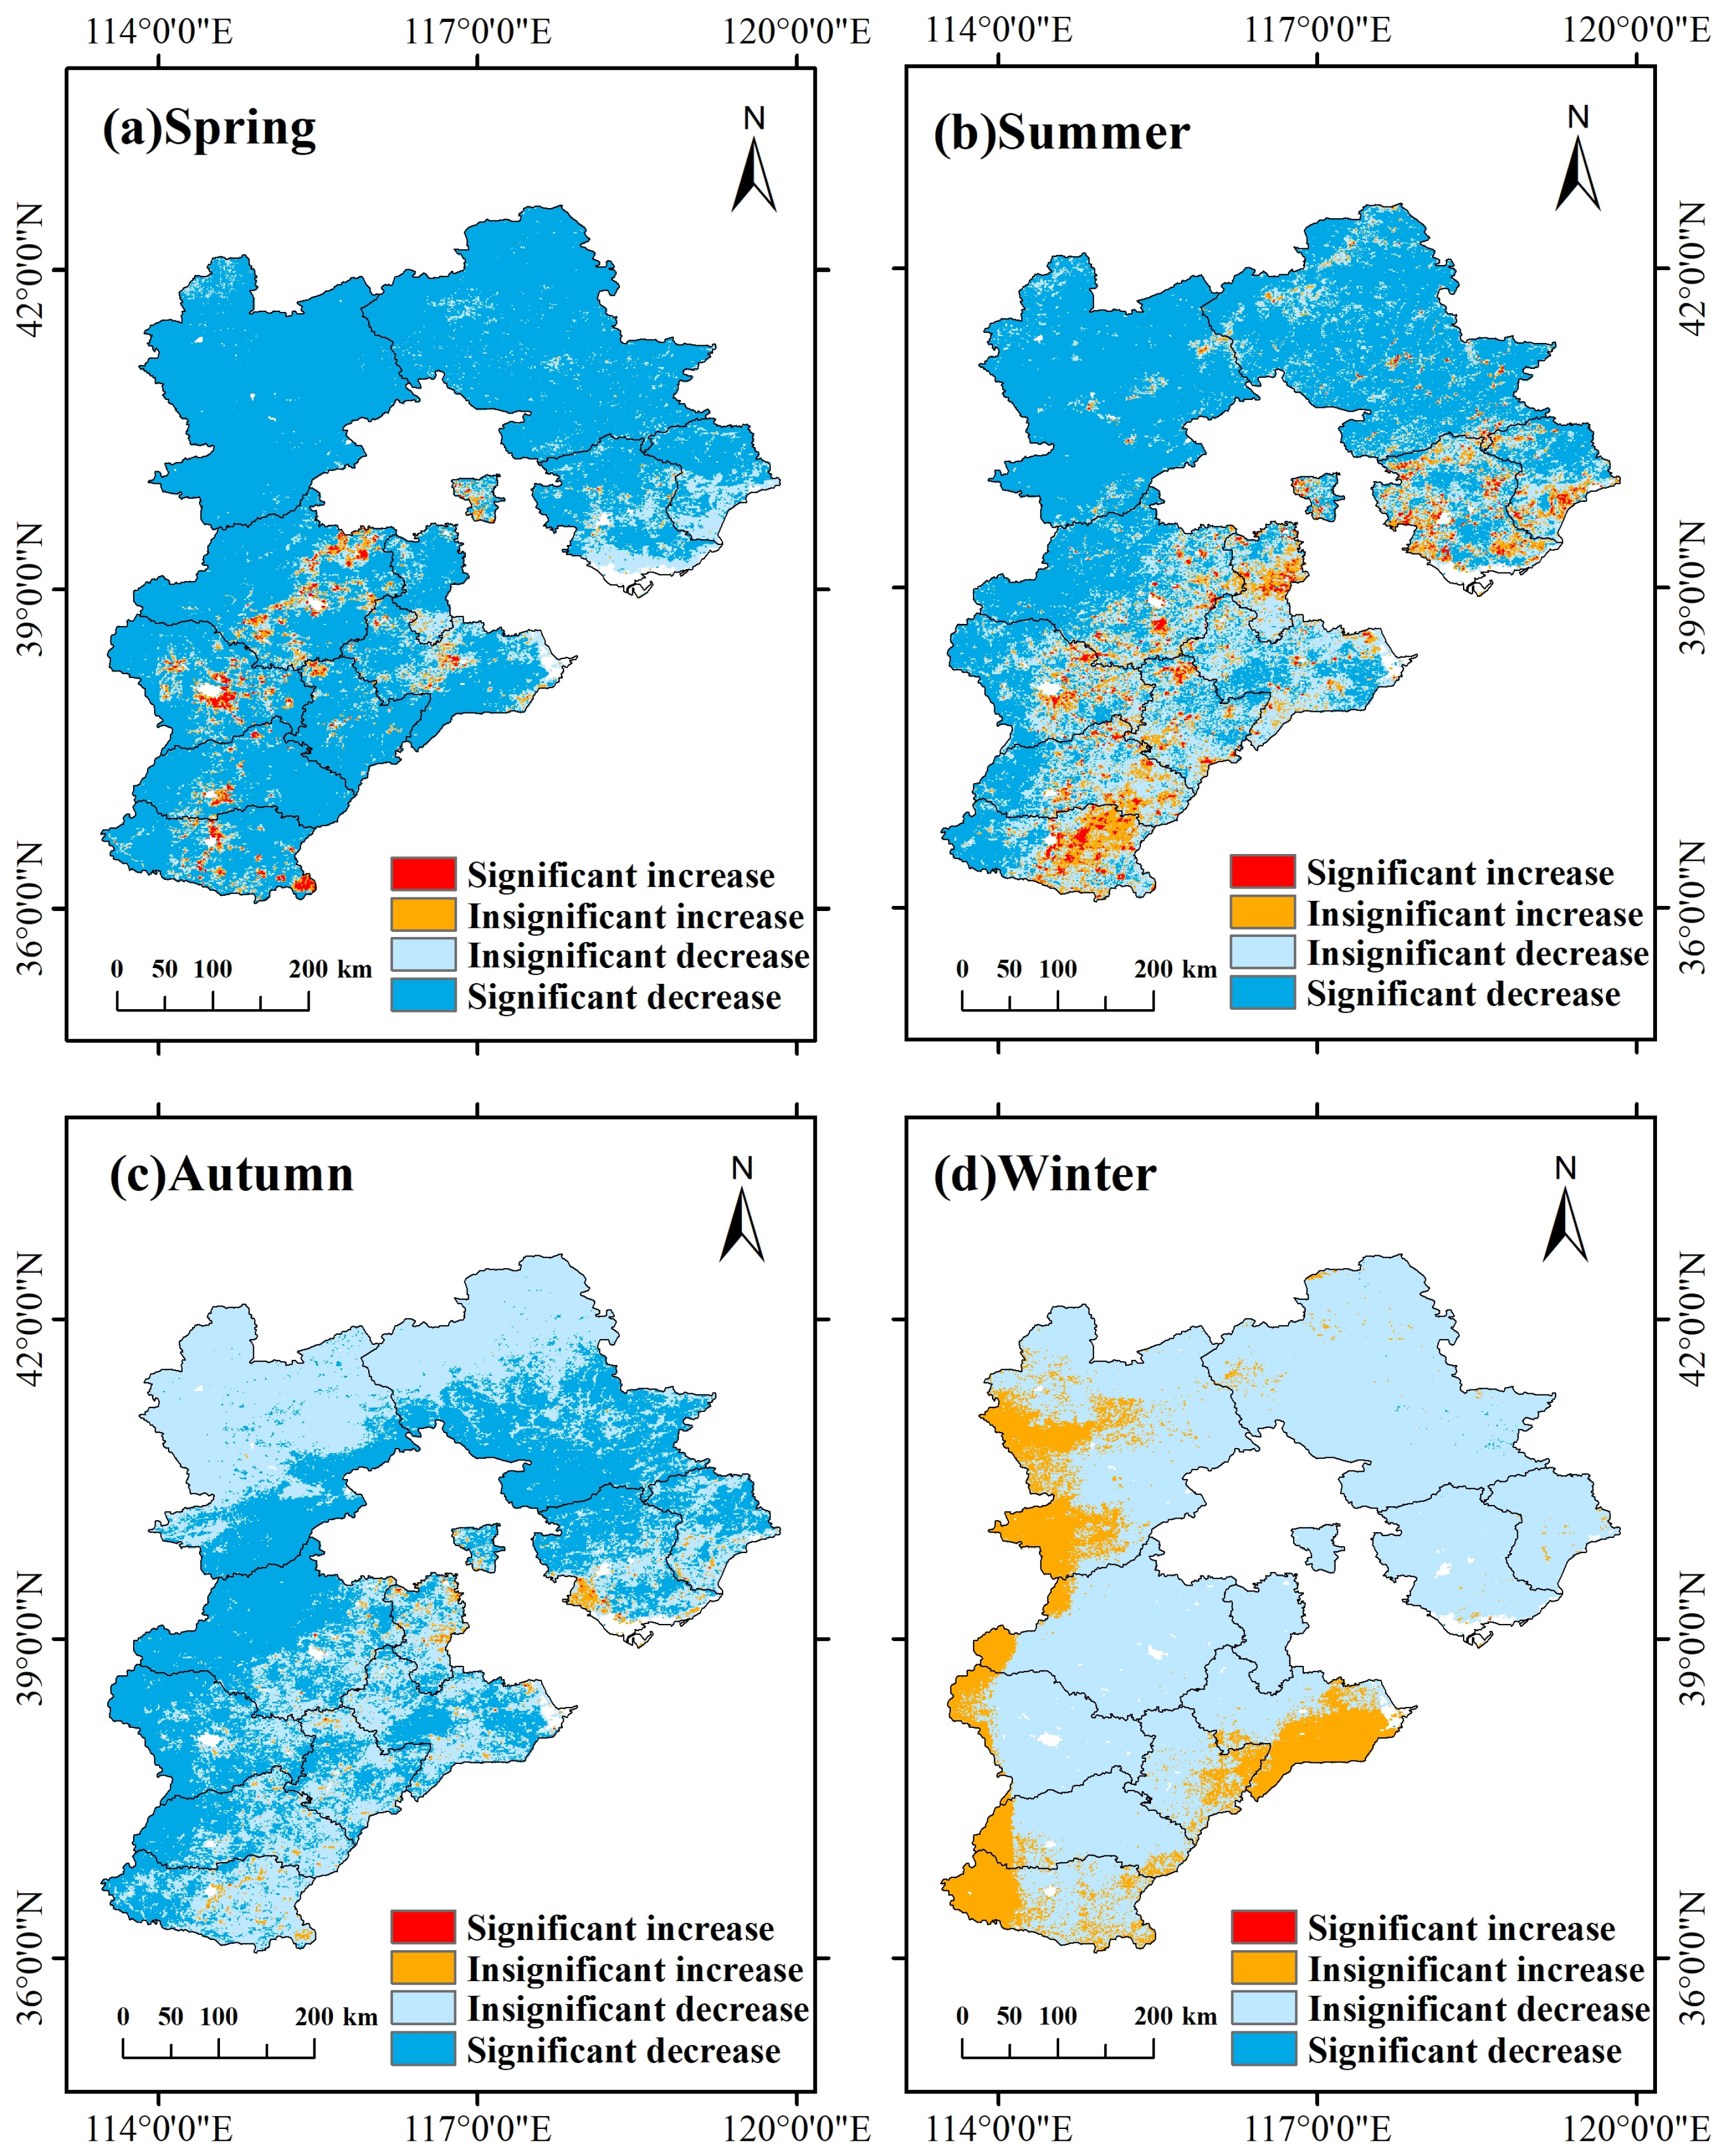
The spatial changes in drought intensity varied significantly among seasons in Hebei Province (Figure 11 and Figure 12). In spring, decreasing trends dominated, with the strongest decreases in southern Hengshui, central-eastern Xingtai, and eastern Handan. Significant decreases covered 85.24% of Hebei Province.
Summer drought intensity also showed a clear decreasing trend. Larger decreases occurred in Zhangjiakou and Chengde, as well as in the western parts of Baoding, Shijiazhuang, and Handan. The significantly decreasing area accounted for 60.88%, mainly distributed in Zhangjiakou, Chengde, and the Taihang Mountains. Only scattered increasing trends appeared in eastern Hebei Province.
Autumn drought intensity was also dominated by a decreasing trend. Clear decreases occurred in southern Chengde, southern Zhangjiakou, northern Baoding, and southern Hebei Province. The significantly decreasing area accounted for 49.19%, mainly distributed in southern Chengde, Tangshan, Qinhuangdao, and the Taihang Mountains.
Winter drought intensity showed a weak decreasing trend, but the decrease was mainly non-significant. The area with a significant increase was negligible. Overall, drought intensity decreased in all four seasons. The largest decrease occurred in spring, whereas winter showed the weakest change.

3.4. Analysis of Factors Spatially Associated with CWSI Based on OPGD and Random Forest

After characterizing the temporal and spatial patterns of CWSI during 2001–2023, this study further used the OPGD and random forest models to identify factors statistically associated with the spatial differentiation of CWSI.
To examine factors spatially associated with CWSI spatial differentiation from different methodological perspectives, this study used both OPGD and the random forest model. OPGD was used to quantify the explanatory power of each factor for CWSI spatial differentiation and their interactions. The random forest model was used to characterize nonlinear relationships between explanatory variables and CWSI and to evaluate variable contributions through permutation importance. The two methods provided complementary evidence from the perspectives of spatial association and machine-learning prediction.

3.4.1. OPGD Factor Detector Results

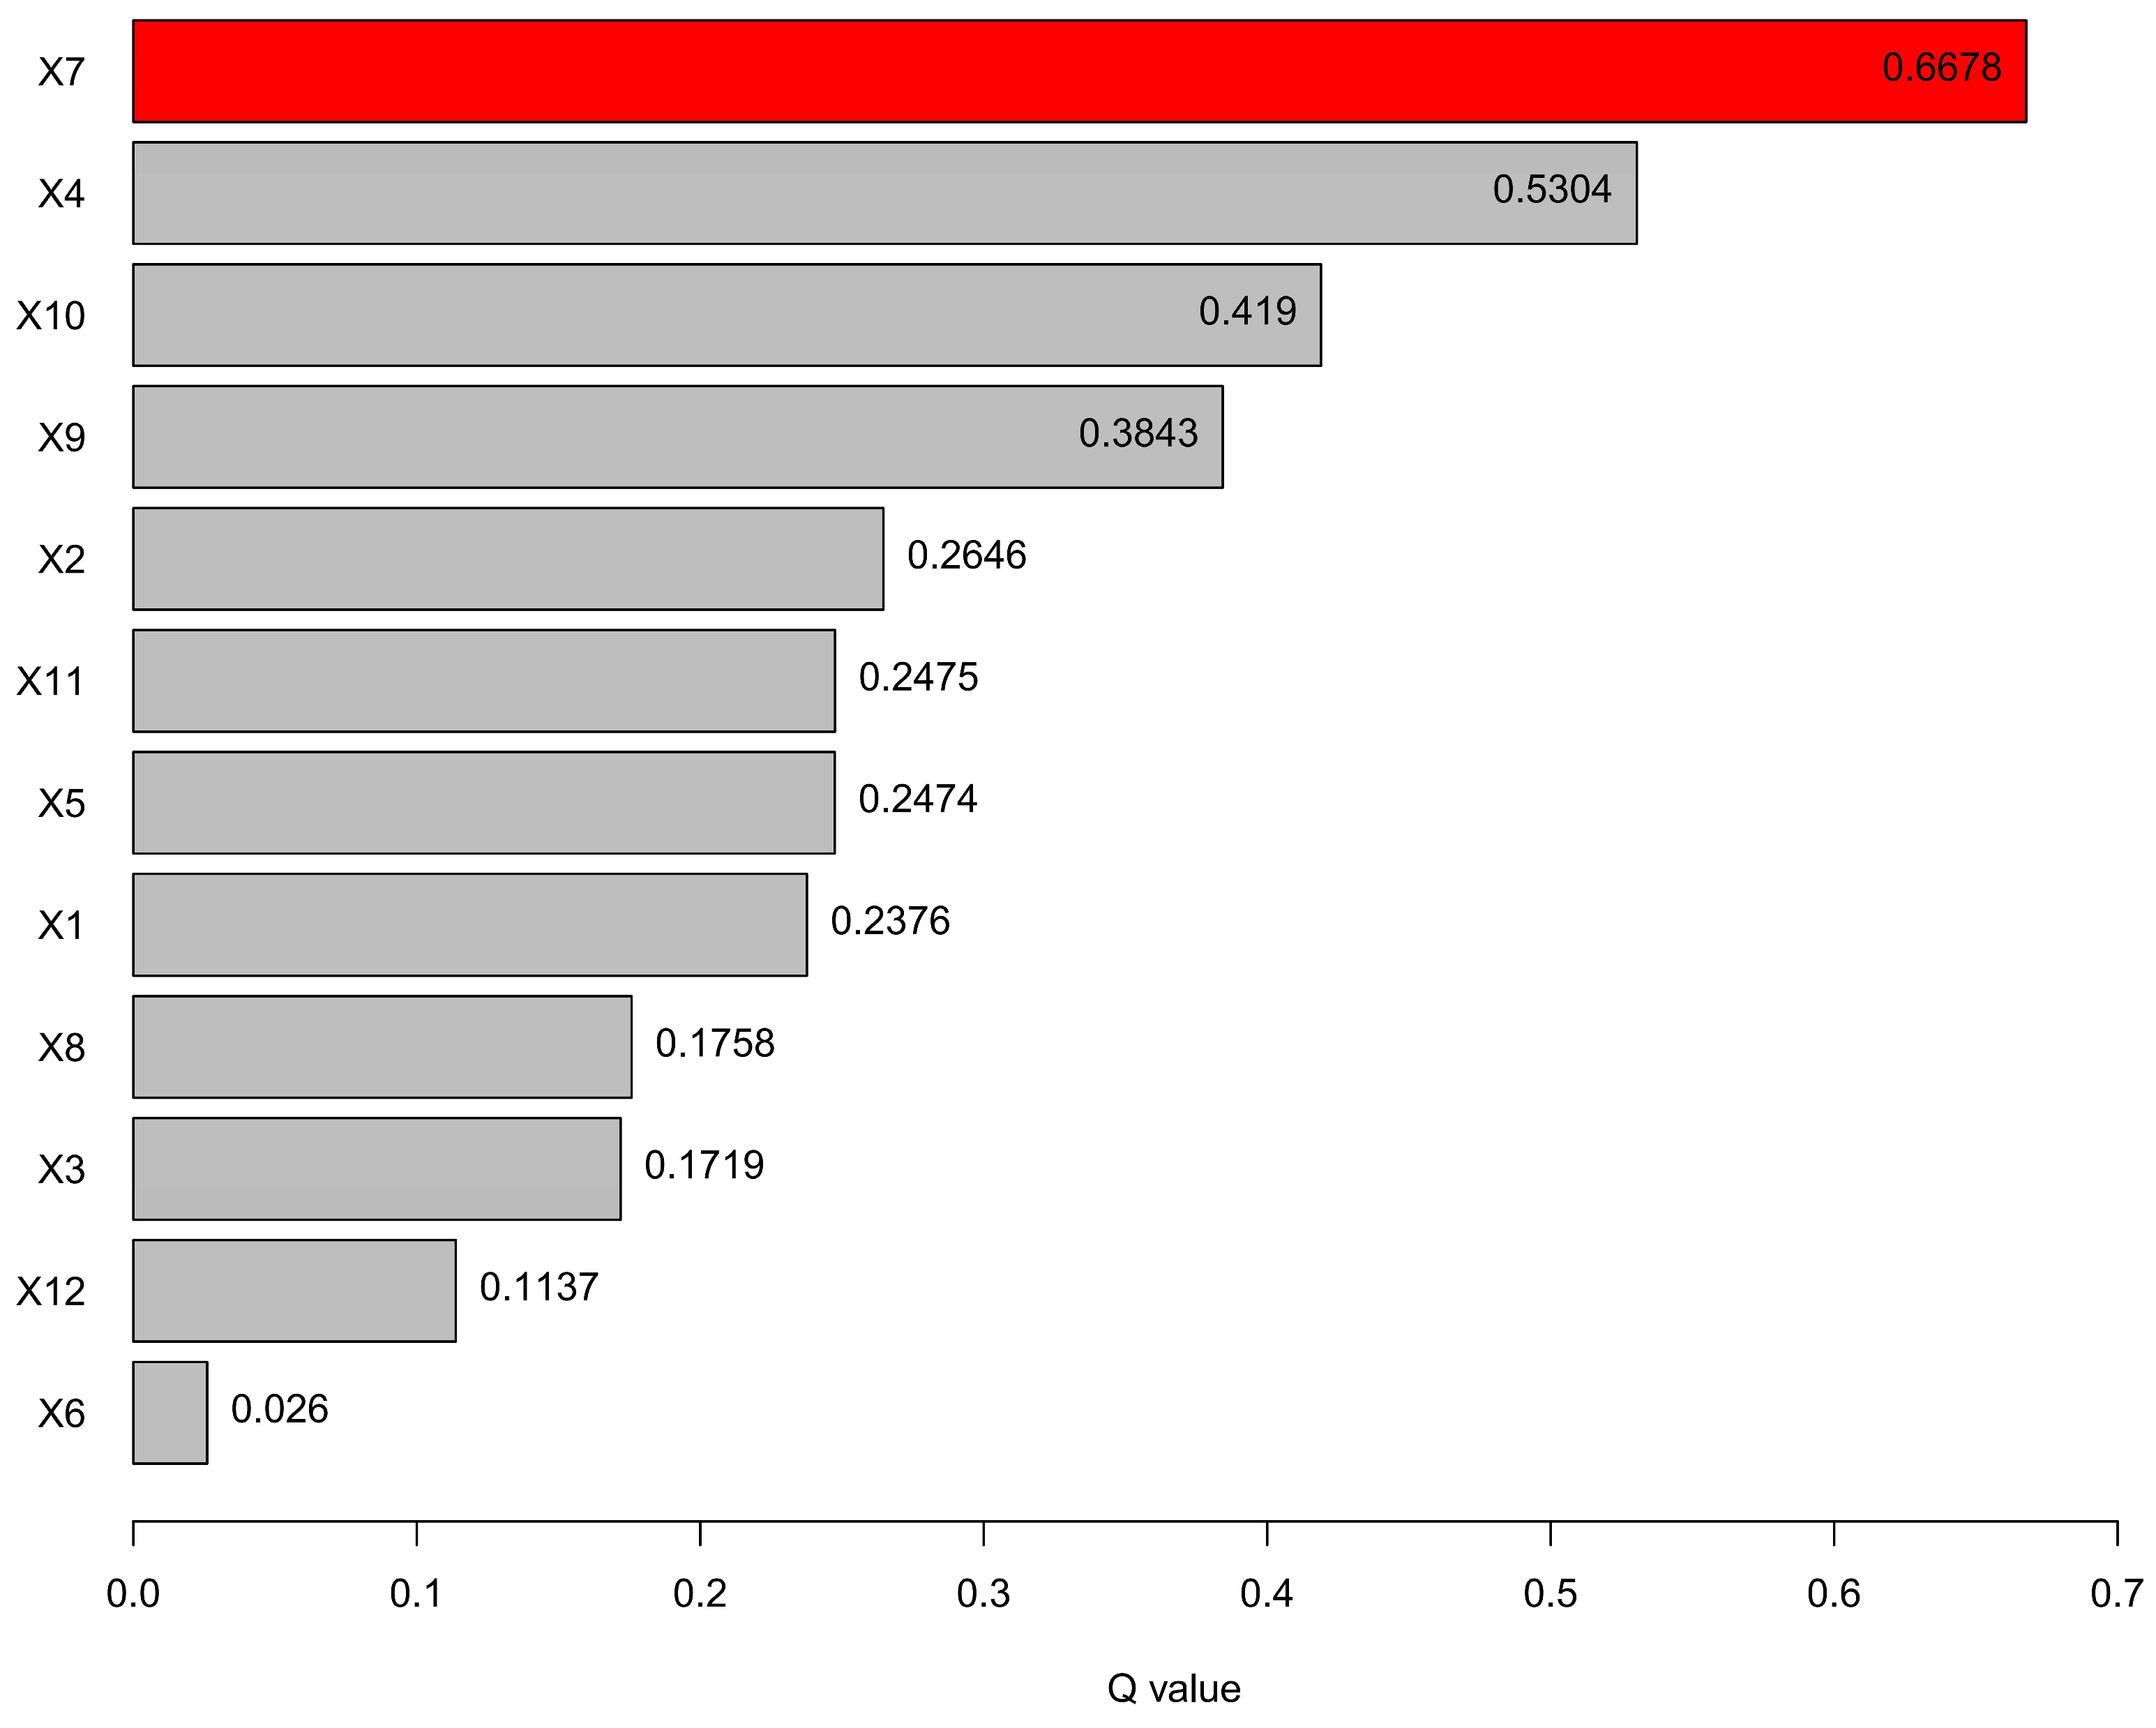
The factor detector results showed that all 12 explanatory variables passed the significance test, but their explanatory power for CWSI spatial differentiation differed clearly (Figure 13). Temperature showed the highest explanatory power, followed by elevation, GDP, and population density.
The q values of temperature and elevation were clearly higher than those of the other variables, indicating that thermal conditions and terrain background were most closely related to the spatial differentiation of CWSI in Hebei Province. The q values of GDP and population density were 0.419 and 0.384, respectively, indicating that variables related to human activity intensity also had strong explanatory power for the spatial pattern of CWSI. In contrast, aspect and distance to road had relatively low q values, indicating that their individual explanatory power for CWSI spatial differentiation was relatively limited. Overall, the spatial pattern of CWSI in Hebei Province was mainly associated with temperature, elevation, and human activity intensity.

3.4.2. OPGD Interaction Detector Results

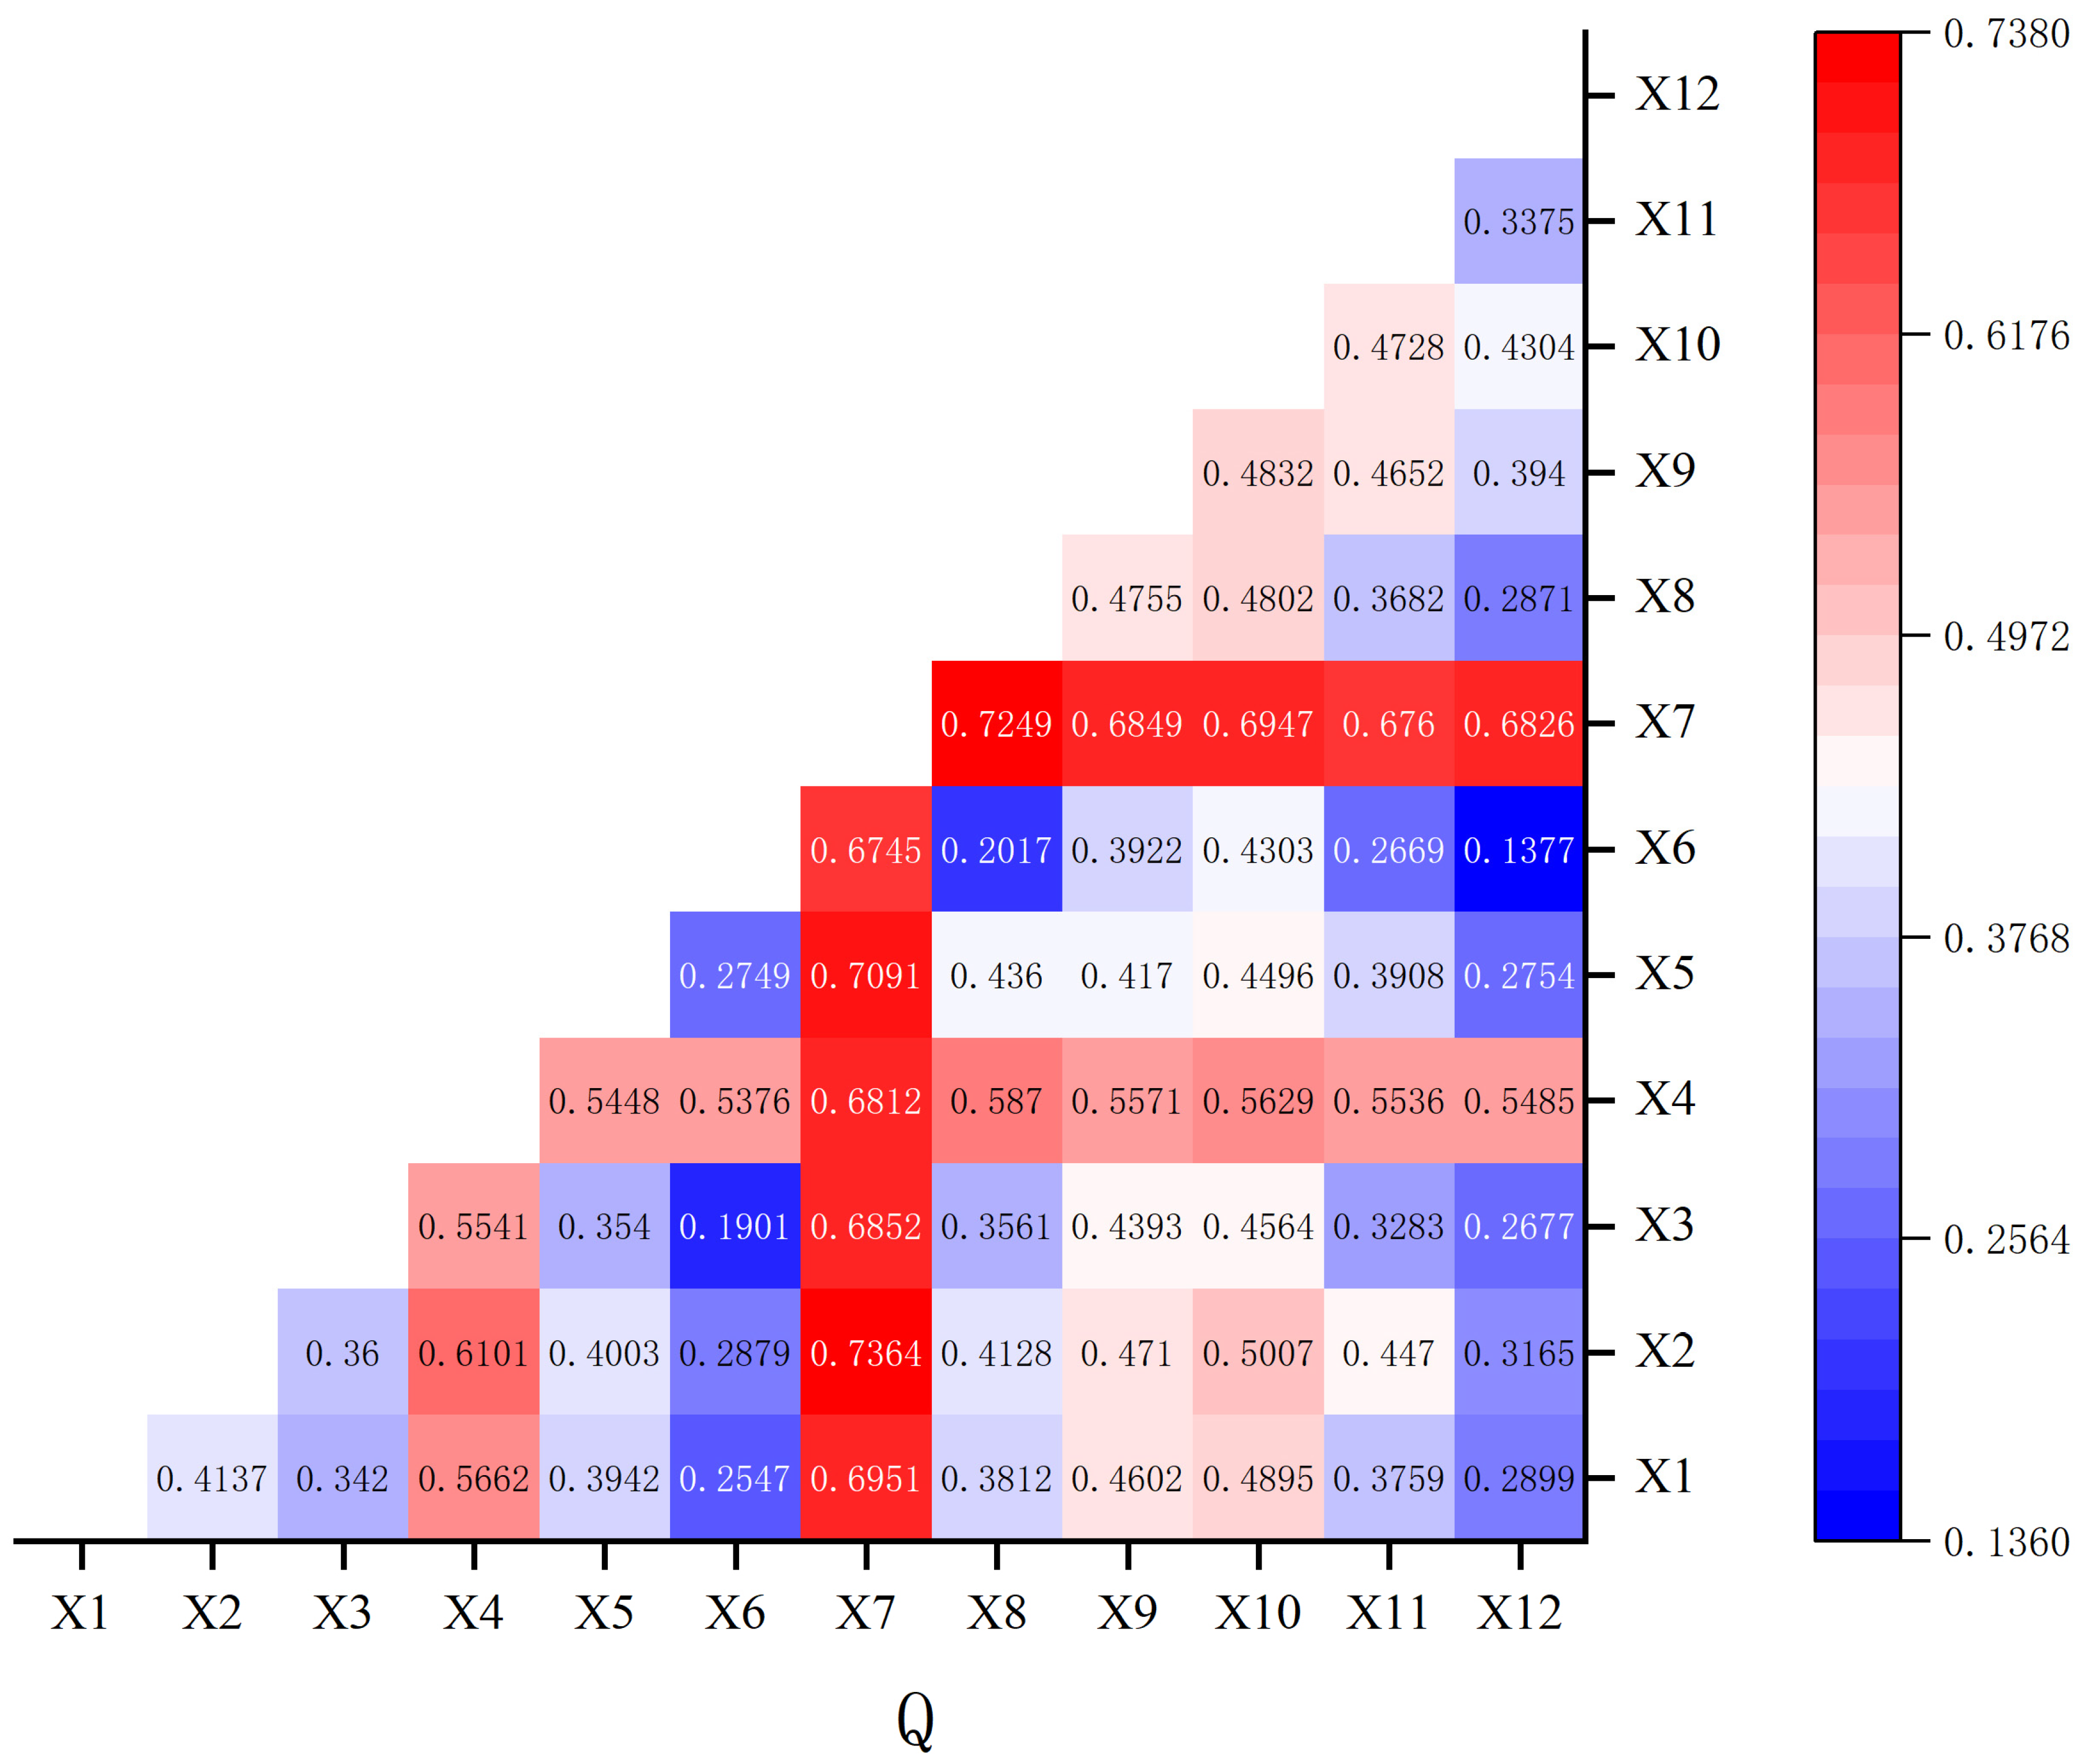
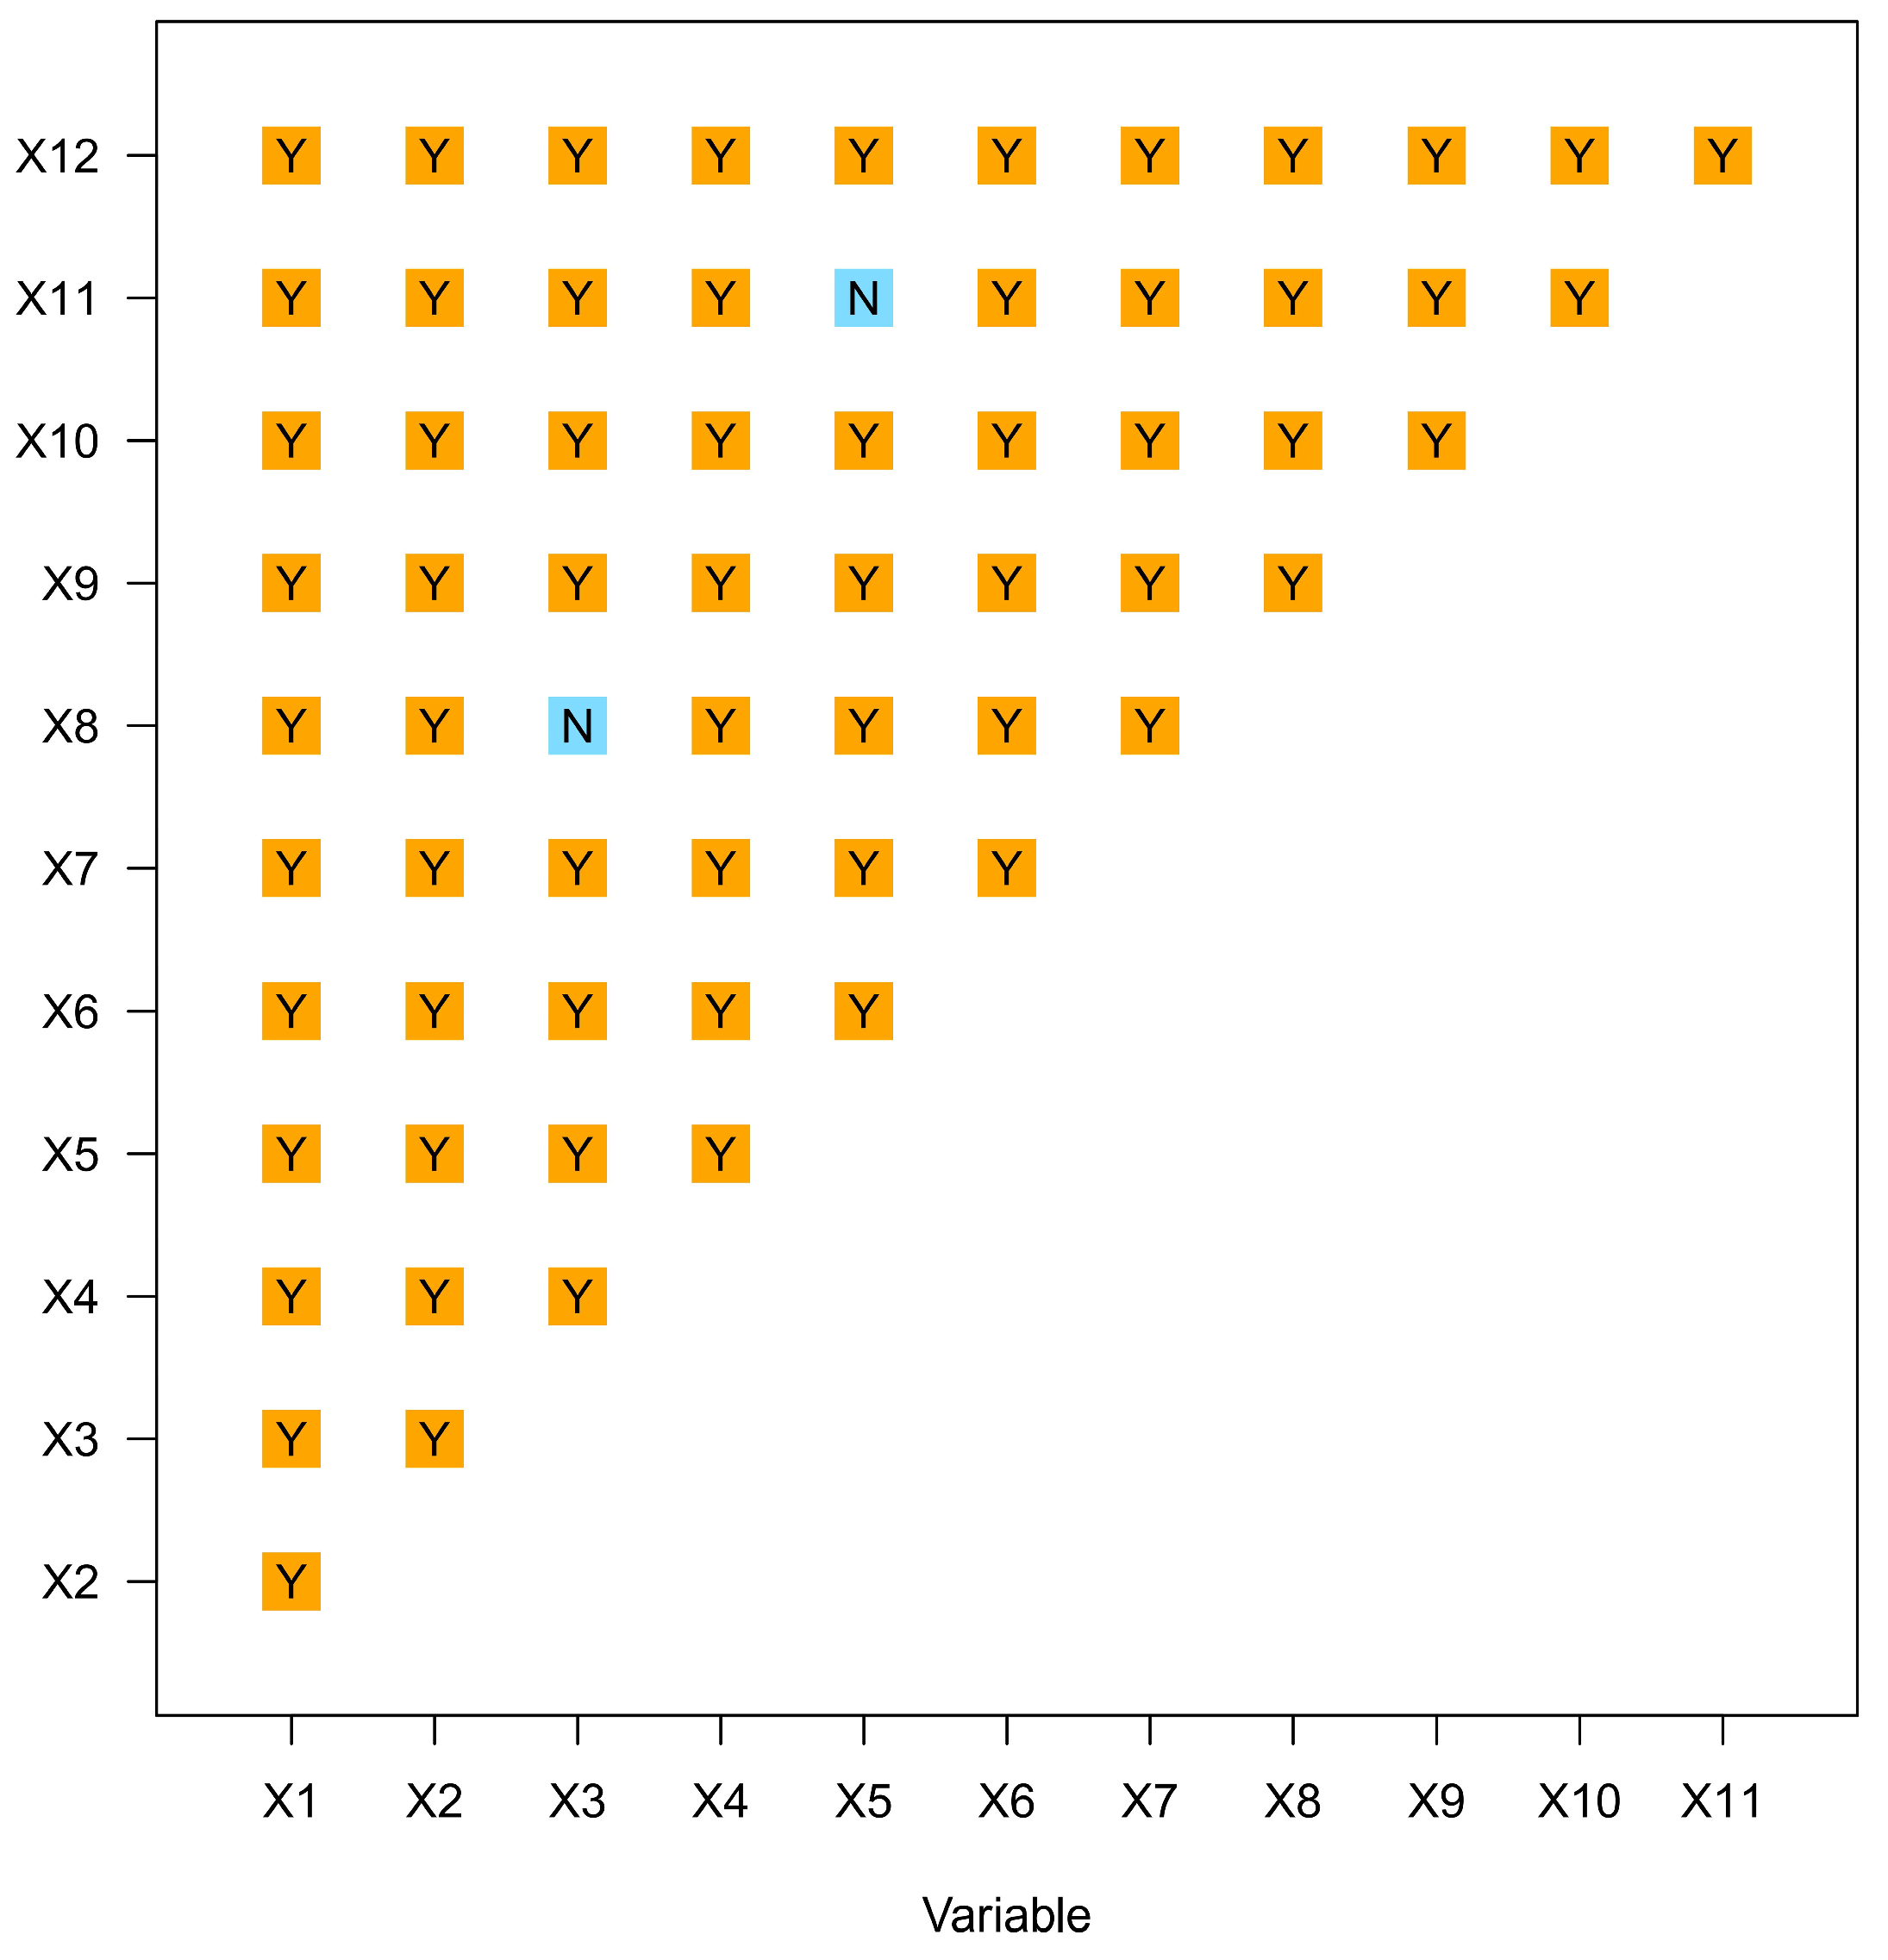
The interaction detector results showed that the q value of each two-factor combination was higher than those of the corresponding single factors, indicating enhanced explanatory power for CWSI spatial differentiation (Figure 14). Among the 66 interaction combinations, 63 showed bivariate enhancement and 3 showed nonlinear enhancement, suggesting that multi-factor interactions were widespread in the spatial pattern of CWSI.
The soil type–temperature interaction had the highest q value, and several other high-ranking combinations also involved temperature. This indicates that thermal conditions played an important role in the interaction structure among terrain, soil, vegetation, and human activity-related variables.
Together, these results indicate that CWSI spatial differentiation in Hebei Province was not captured by any single variable alone, but was closely associated with the spatial superposition of climate, terrain, soil, vegetation, and human activities.

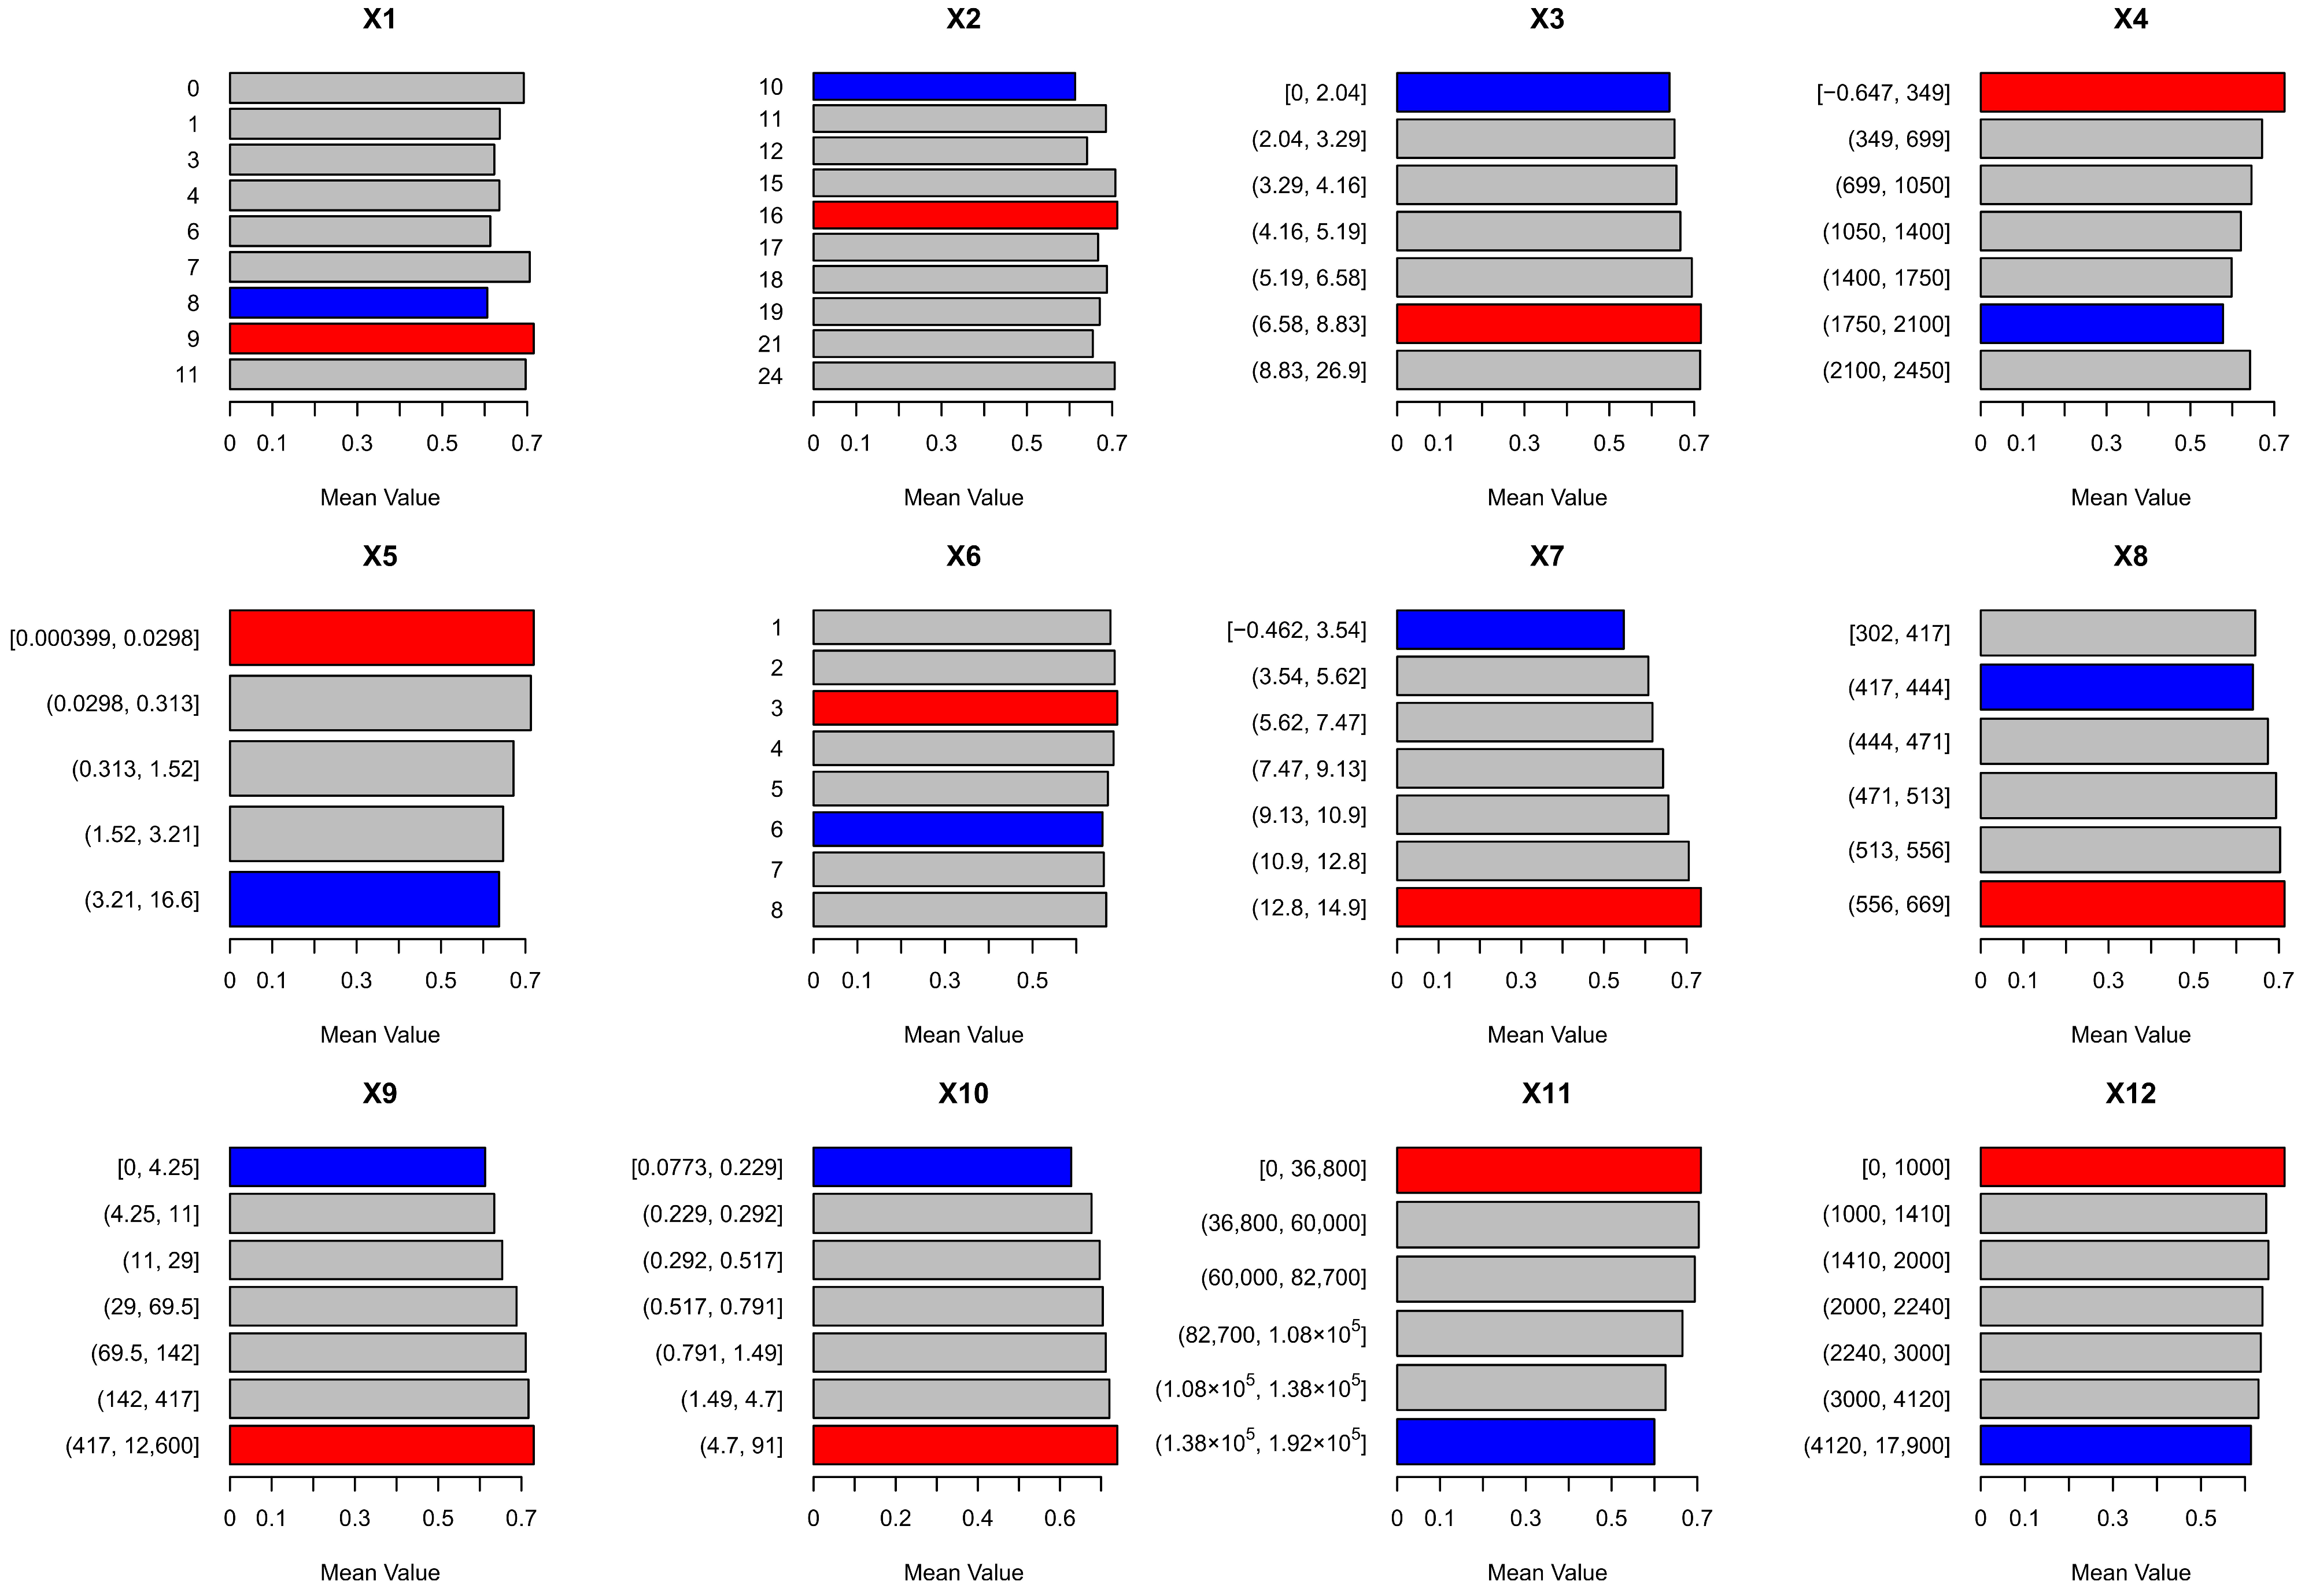
3.4.3. OPGD Risk Detector Results

The risk detector results showed clear differences in mean CWSI among the strata of different factors (Figure 15 and Figure 16). CWSI generally increased with higher temperature, GDP, and population density classes, while it tended to be lower in higher-elevation and higher-slope areas. Areas closer to cities and roads also showed relatively higher CWSI values. The highest precipitation stratum showed relatively high CWSI, but this pattern should not be interpreted as evidence that precipitation directly increases CWSI-derived drought intensity. Instead, it may reflect spatial covariation among precipitation, temperature, terrain, land use, and human activities. Overall, high-CWSI areas mainly corresponded to high temperature, low elevation, low slope, and stronger human activity aggregation.

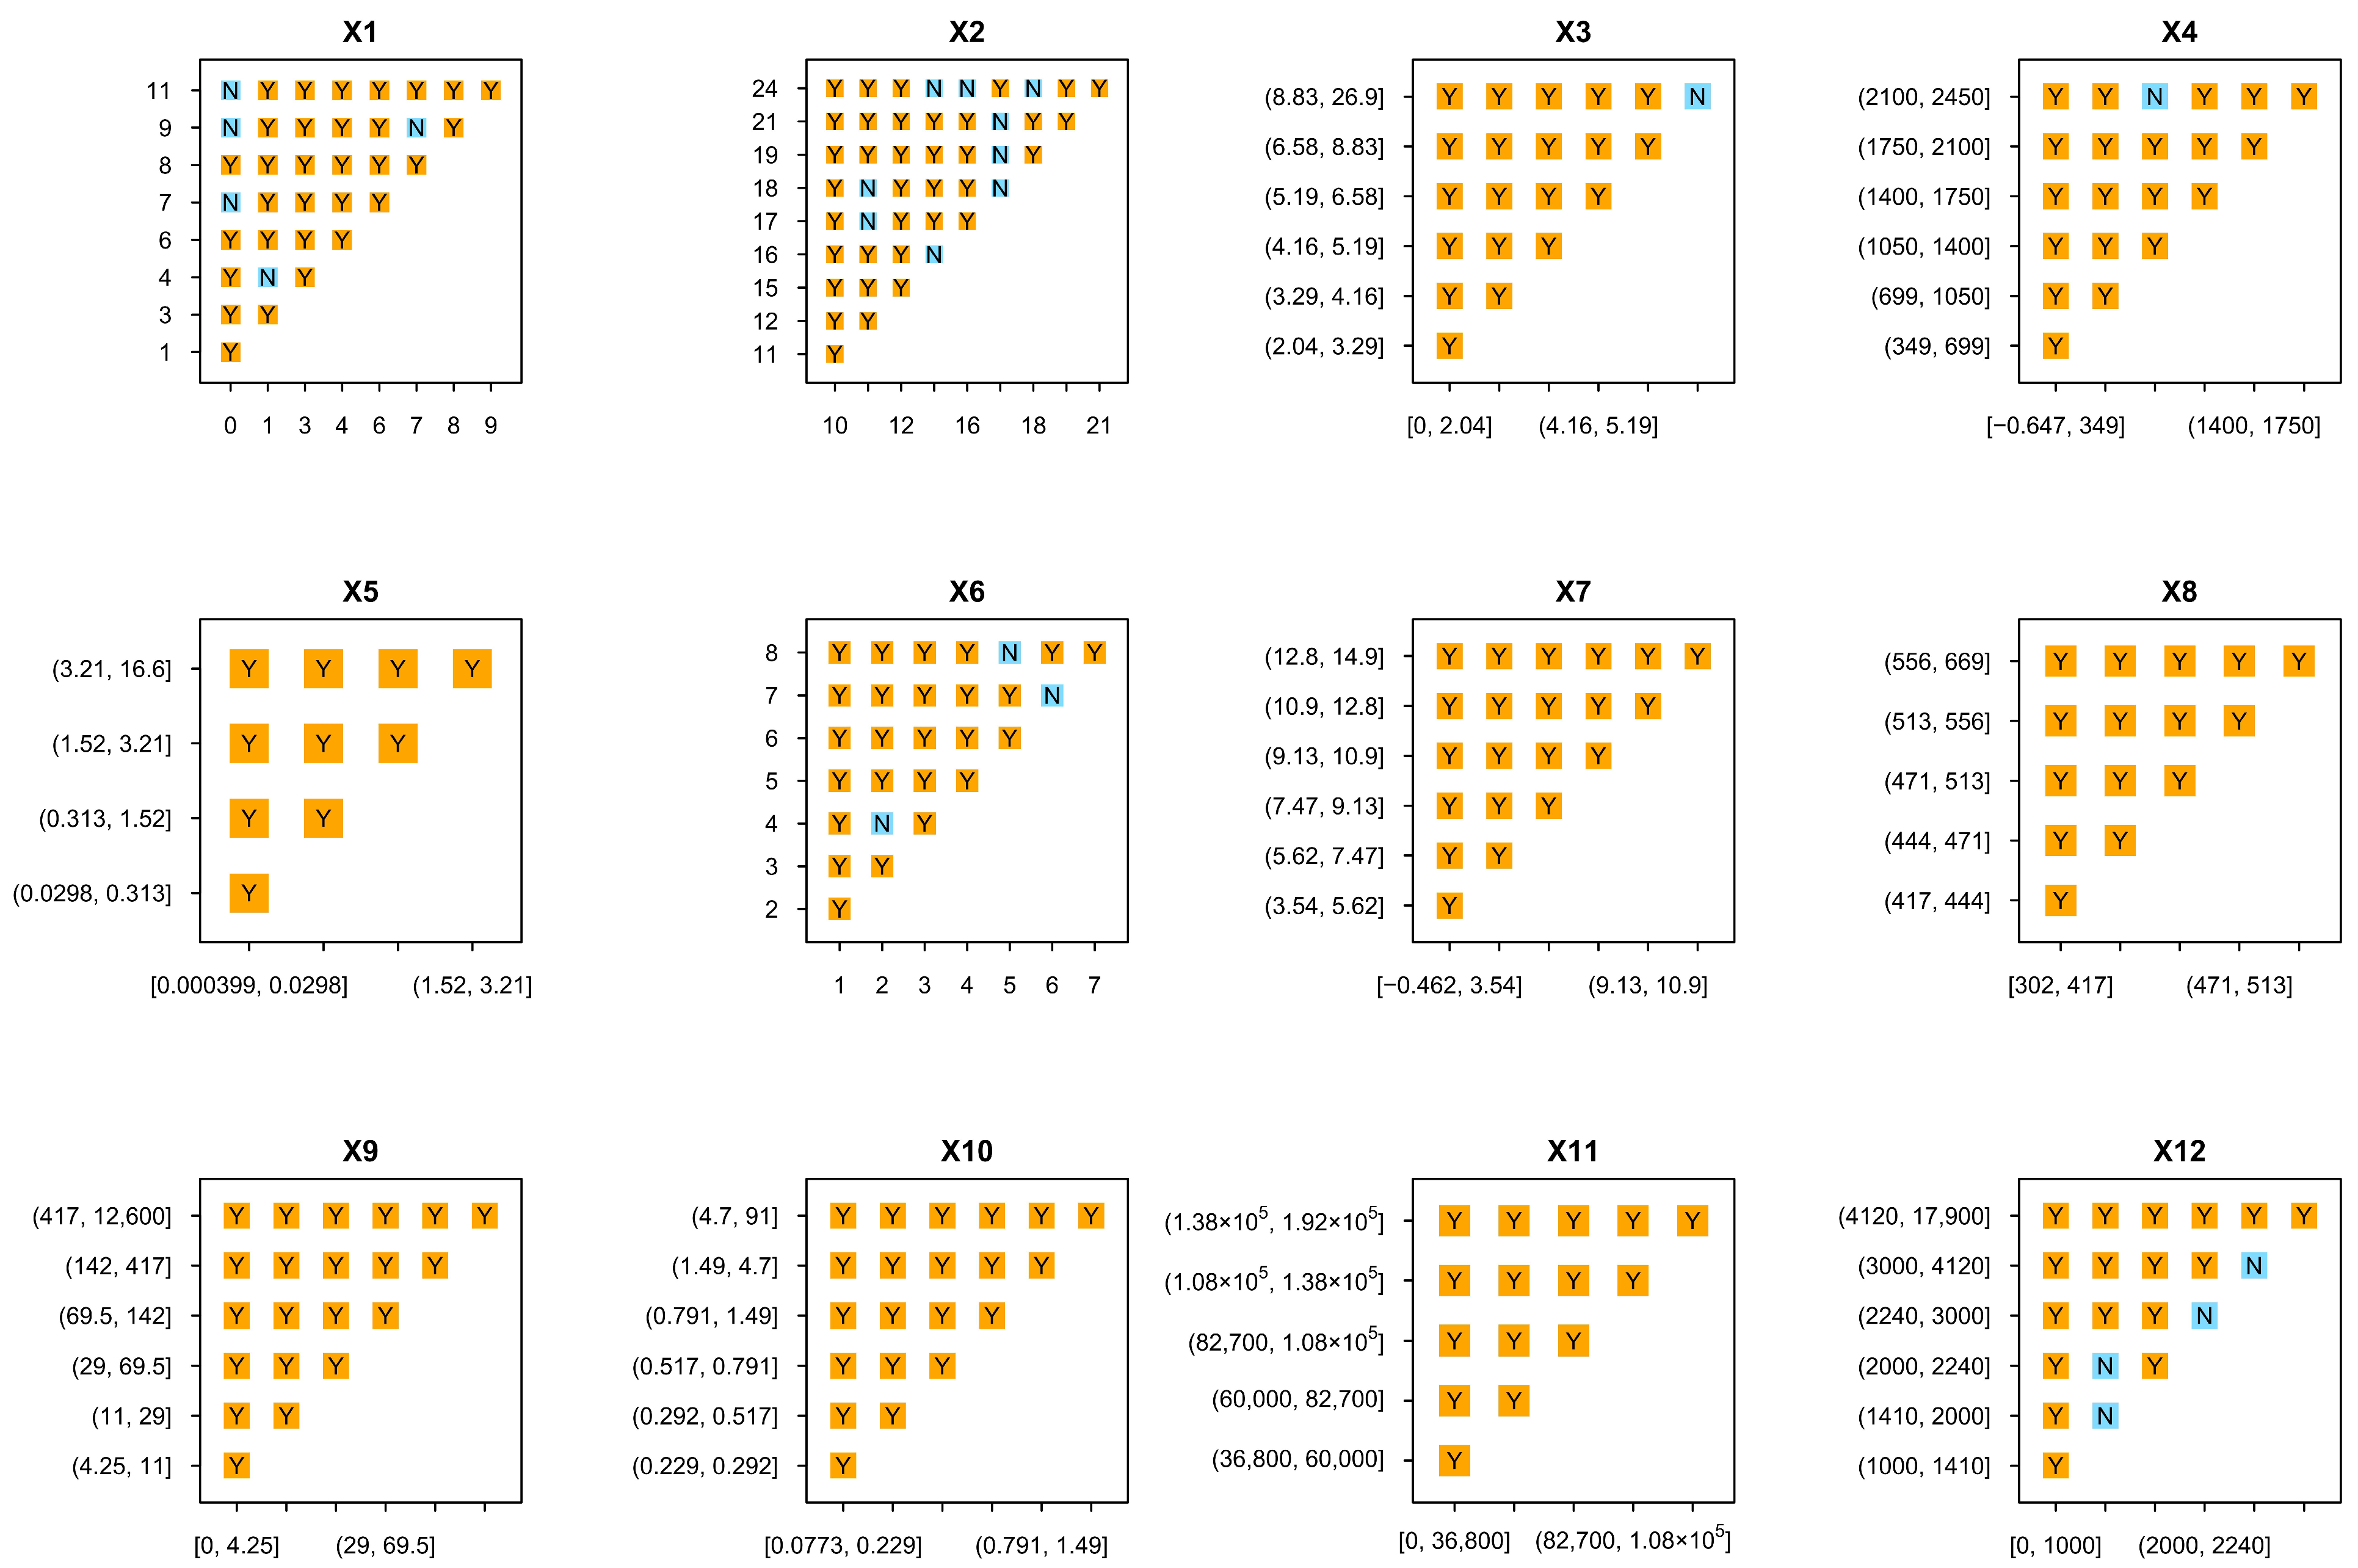
3.4.4. OPGD Ecological Detector Results

The ecological detector results showed that most factor pairs had significantly different explanatory powers for CWSI spatial differentiation (Figure 17). Only the pairs of precipitation–river density and slope–distance to city did not pass the significance test. Variables with high q values, including temperature, elevation, GDP, and population density, differed significantly from most other factors. These results were generally consistent with the factor detector and interaction detector results, indicating that CWSI spatial differentiation in Hebei Province was jointly associated with multiple natural and socioeconomic factors.

3.4.5. Random Forest Model Performance and Variable Importance

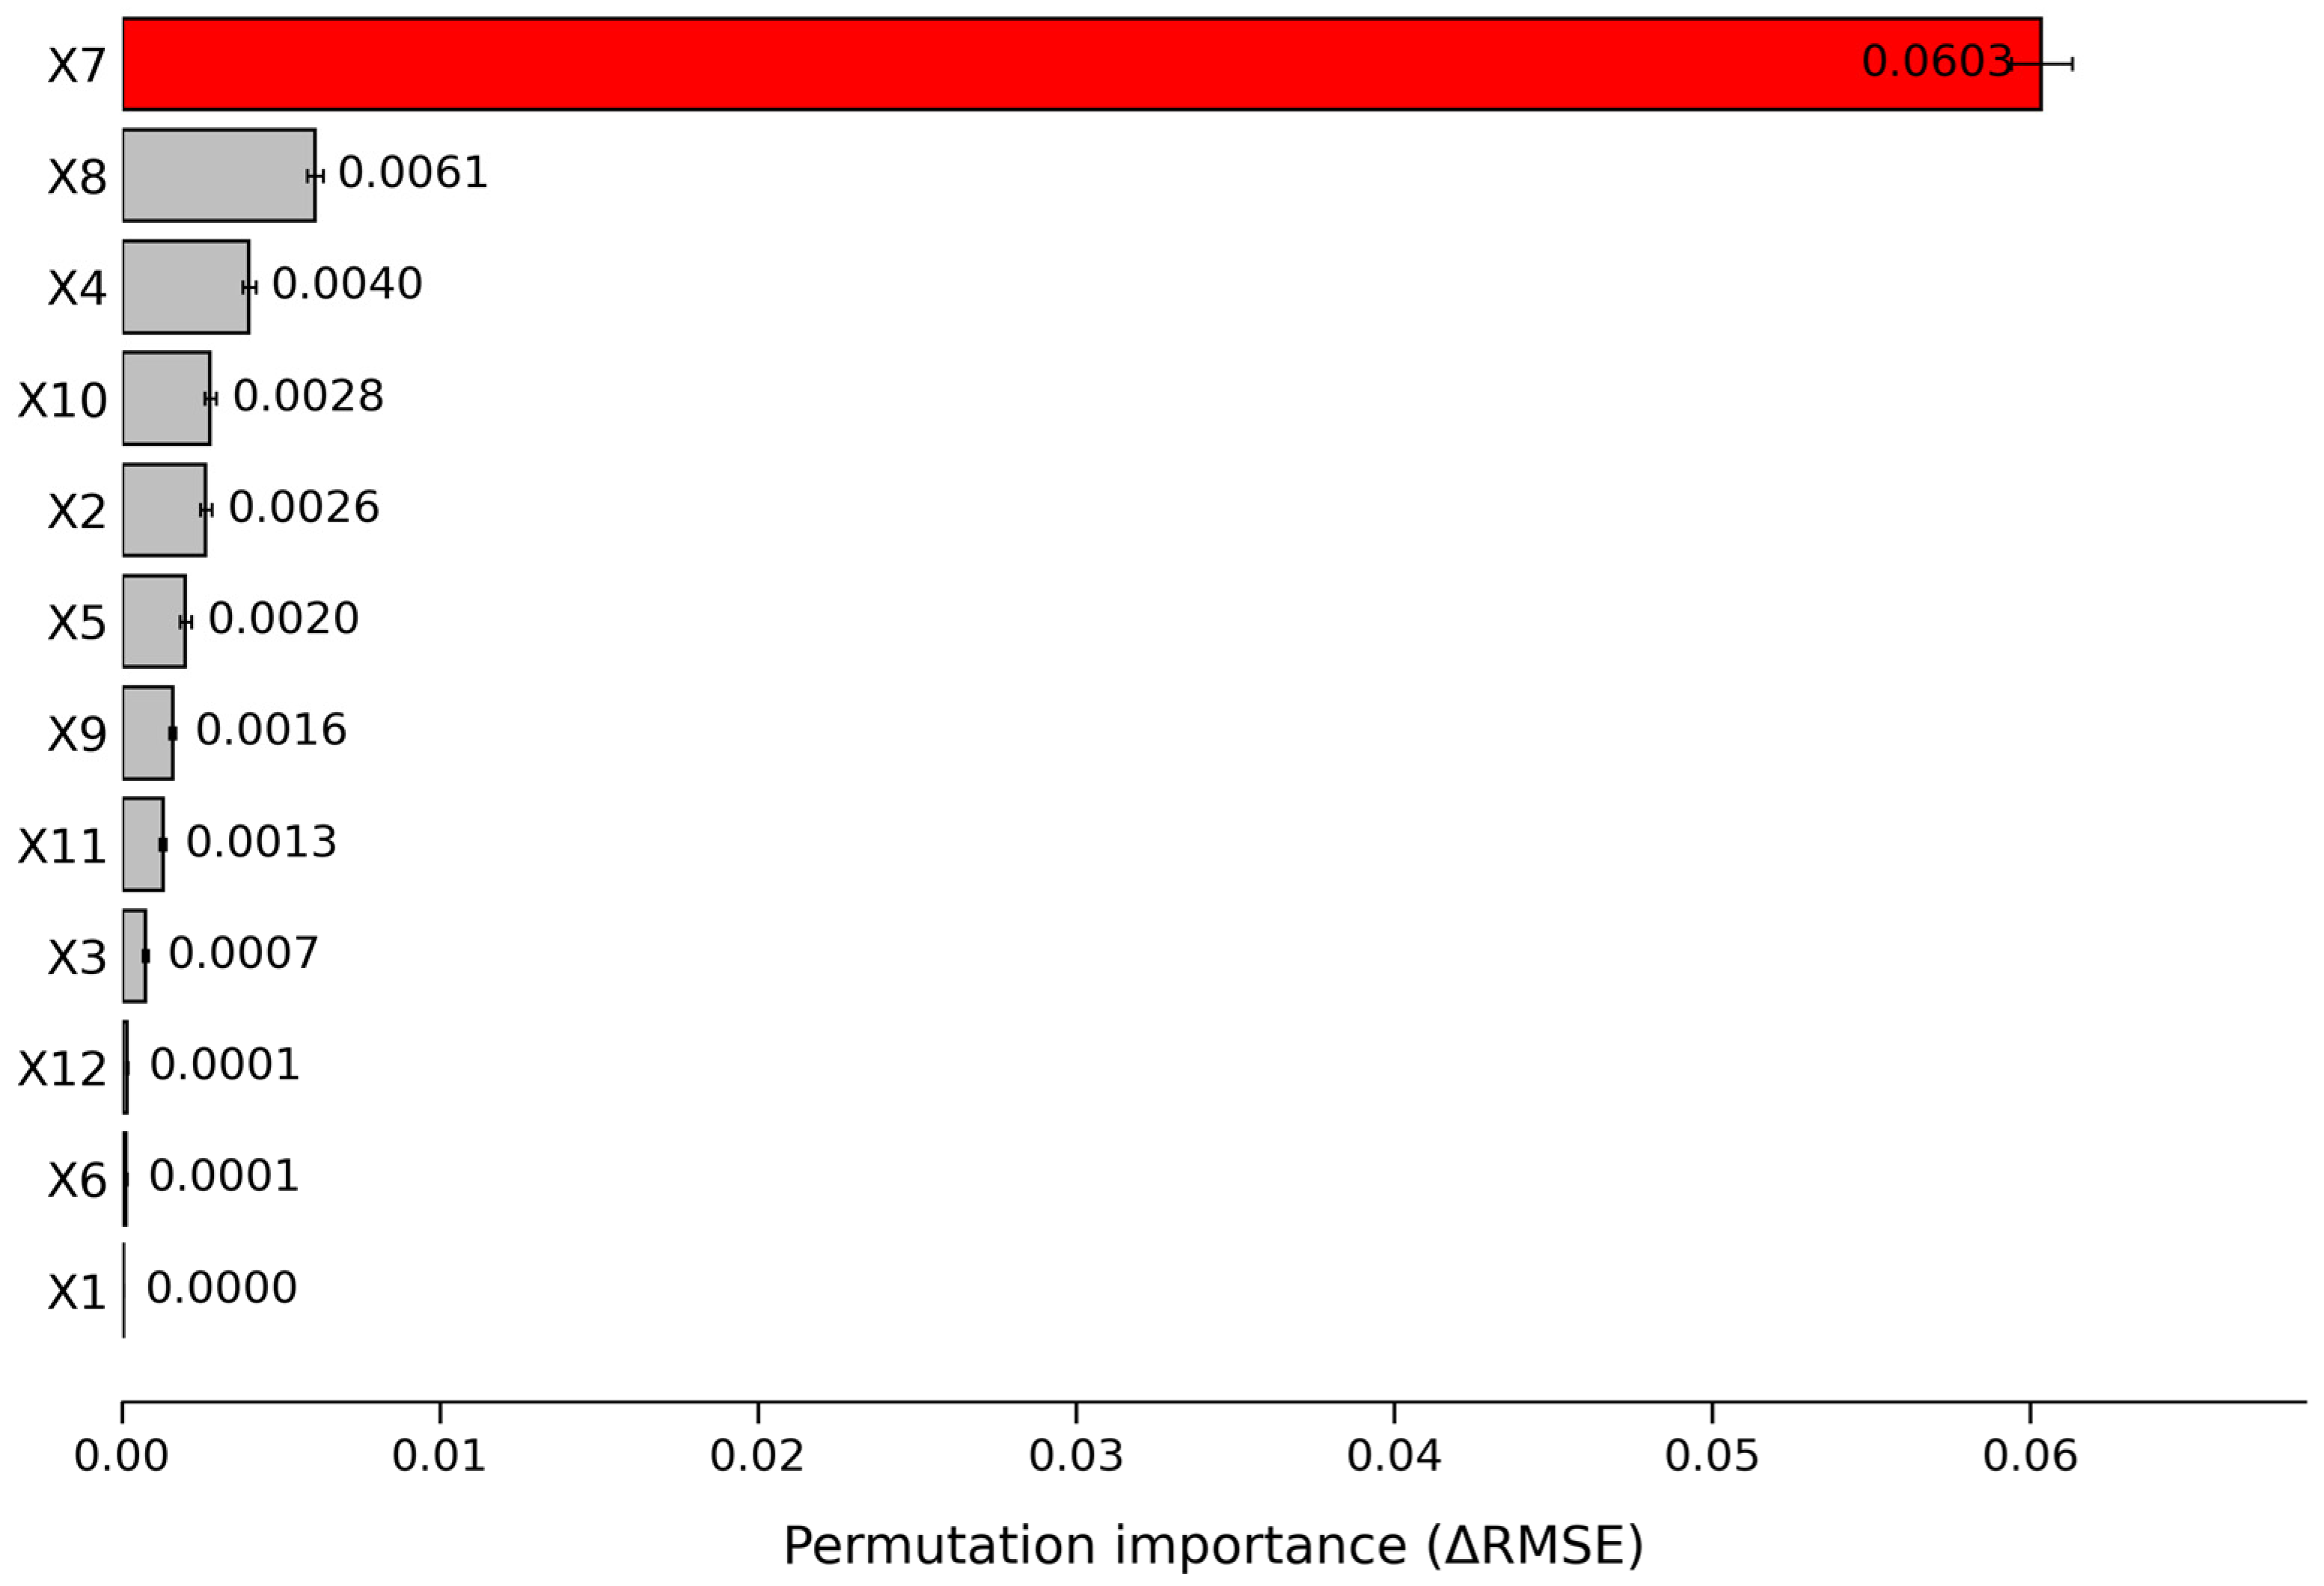
The random forest model showed relatively stable predictive performance on the independent spatial test set (Table 7). The RMSE of the inner spatial cross-validation was close to that of the independent spatial test set, indicating no obvious spatial generalization failure. The permutation importance results showed that temperature had the highest importance, followed by precipitation, elevation, GDP, and soil type (Figure 18). Temperature ranked first in both OPGD and random forest, while precipitation ranked higher in random forest than in OPGD. This suggests that precipitation may contribute to CWSI prediction mainly through nonlinear relationships or conditional dependence with other variables.

3.4.6. Integrated Comparison of OPGD and Random Forest Results

OPGD and random forest provided complementary evidence for the spatial pattern of multi-year mean CWSI. Both methods identified temperature as the most important variable and indicated relatively high contributions of elevation, GDP, and soil type. The ranking difference for precipitation reflected the different statistical information captured by the two methods: OPGD focused on spatially stratified differences, whereas random forest captured nonlinear relationships and conditional dependence. Together, the two methods suggest that CWSI spatial differentiation in Hebei Province was associated with the nonlinear superposition of climate, terrain, soil, and socioeconomic factors.

4. Discussion

4.1. Evaluation of CWSI Drought Monitoring Performance

Under the multi-source consistency evaluation framework used in this study, CWSI showed more consistent overall performance than TCI, VCI, and TVDI in Hebei Province. This finding agrees with the general conclusion of a previous North China Plain study that CWSI was more suitable than several other remote-sensing drought indices for representing regional drought conditions [32]. A Google Earth Engine (GEE)-based study in Inner Mongolia also compared the Normalized Vegetation Supply Water Index (NVSWI), CWSI, TVDI, VCI, and TCI and found that CWSI performed better in characterizing agricultural drought than the other four indices [88]. This advantage is closely related to its physical mechanism. CWSI is derived from the ratio of actual evapotranspiration to potential evapotranspiration and can more directly reflect evapotranspiration-related surface water stress [52]. A recent study in the eastern Loess Plateau also reported that a CWSI-based approach was more consistent with measured soil moisture than the Vegetation Supply Water Index (VSWI) and TVDI during the crop-growing season [89]. In contrast, TCI is strongly affected by low winter temperature, which weakens the relationship between land surface temperature and soil moisture [23]. VCI mainly reflects vegetation growth conditions, so its response to soil moisture deficit has a lag [90,91]. TVDI depends on the LST–NDVI feature space, and dry- and wet-edge fitting can be unstable in areas with low vegetation coverage and during the winter dormancy period [92]. These differences explain the more stable seasonal performance and more consistent drought response of CWSI.

4.2. Spatiotemporal Drought Variations and Seasonal Characteristics

During 2001–2023, CWSI-derived drought intensity in spring, summer, and autumn generally decreased in Hebei Province. This indicates that regional crop water stress was generally alleviated during the study period. However, this change does not mean that drought risk disappeared. Instead, it appeared as an adjustment of drought grade structure: the areas of severe and extreme drought decreased, while the areas of mild and moderate drought increased. Similar alleviation of agricultural water stress has also been reported in related studies of the North China Plain [93]. However, a recent multi-timescale SPEI study reported increasing drought persistence in another water-limited region [38]. This suggests that regional drought changes over the past two decades may have been associated with multiple background conditions, such as changes in climate, agricultural water management, and land use patterns. Unlike typical arid regions such as Xinjiang, where summer drought is more prominent [94], the high-risk drought period in Hebei Province was mainly concentrated in spring. This is closely related to the uneven seasonal distribution of precipitation in North China. Precipitation in Hebei Province is highly concentrated in summer, while spring precipitation accounts for a relatively low proportion of precipitation [95]. At the same time, spring is the period of winter wheat regreening and jointing and preparation for spring sowing. Crop water demand increases during this period. The mismatch between water supply and agricultural water demand can easily intensify crop water stress. Therefore, although CWSI-derived drought intensity in Hebei Province generally decreased during 2001–2023, spring should still be regarded as a key period for regional agricultural drought monitoring and drought-resistance water resource allocation.

4.3. Factors Associated with CWSI Spatial Differentiation and Their Interactions

The OPGD results further showed that the explanatory power of interactions among factors was higher than that of single factors. Among all interactions, the interaction between temperature and soil type had the highest q value. This indicates that the spatial superposition of high-temperature background and specific soil types was closely associated with the spatial differentiation of CWSI. In particular, sandy soils with relatively low water-holding capacity are more vulnerable to drought stress [96]. Under warmer conditions, soils with lower water-holding capacity lose soil moisture more rapidly through soil evaporation and plant transpiration, resulting in faster depletion of available soil water [97]. Consequently, crops growing on these soils generally require more frequent irrigation to maintain normal growth [98]. In contrast, soils with higher water-holding capacity can buffer short-term increases in atmospheric evaporative demand by retaining more plant-available soil water [97]. The observed temperature–soil interaction may reflect the spatial co-occurrence of thermal conditions and differences in soil water-holding capacity.
Multi-year mean air temperature also showed strong interactions with GDP and population density, indicating that areas with higher human activity intensity tended to spatially coincide with high-CWSI areas under warmer thermal backgrounds [99]. The unexpected positive association between precipitation and CWSI does not mean that precipitation directly increases CWSI-derived drought intensity. Some areas with relatively high multi-year mean precipitation in Hebei Province overlap spatially with low flat plains, higher temperatures, intensive farmland use, and strong anthropogenic water demand [100,101]. Under this background, higher atmospheric evaporative demand and agricultural water consumption pressure can weaken the alleviating effect of precipitation on water stress [102]. Therefore, the precipitation–CWSI relationship in the OPGD results reflects spatial covariation and confounding among hydrothermal conditions, terrain background, land use, and human activities, rather than an independent explanatory role of precipitation in spatial CWSI variation.
In addition, some explanatory variables, including temperature, precipitation, population density, GDP, distance to roads, and distance to cities, may share similar spatial gradients across Hebei Province. Therefore, part of the explanatory power identified by the OPGD model may reflect shared spatial heterogeneity among explanatory variables rather than completely independent effects. The random forest analysis provided complementary evidence from a multivariate nonlinear perspective. Precipitation contributed to CWSI prediction to some extent, but its importance was lower than that of temperature. This indicates that the spatial differentiation of CWSI was more related to atmospheric evaporative demand and related surface conditions than to precipitation alone.

4.4. Limitations and Future Prospects

This study still has several limitations. First, the MODIS remote sensing indices and SMCI1.0 gridded soil moisture data used in this study both have a spatial resolution of 1 km. They are suitable for provincial-scale drought monitoring but cannot fully characterize field-scale differences in land use, crop type, soil texture, irrigation conditions, and microtopography. In Hebei Province, agricultural fields, irrigated areas, dryland fields, residential land, and roads may coexist within the same 1 km pixel. Therefore, CWSI represents the average water stress status under a mixed landscape, rather than the drought condition of a single field. In addition, although SMCI1.0 can be used as an independent reference for evaluating the soil moisture response of remote sensing indices, it is essentially still a gridded soil moisture product, not directly measured field data. It may be affected by uncertainties related to station representativeness, model prediction, input variables, and spatial interpolation processes. Therefore, the multi-source consistency evaluation results should be interpreted as consistency evidence rather than direct field validation.
Second, uncertainties in the remote-sensing products should also be considered. Uncertainties in MOD16A2GF ET and PET may introduce some uncertainty into the calculated CWSI values, while TVDI uncertainty mainly arises from the fitting of the dry and wet edges in the NDVI–LST feature space. In theory, TVDI can reflect land surface temperature anomalies constrained by vegetation coverage. However, this requires relatively complete dry and wet boundaries in the study area. In monthly calculations, due to surface heterogeneity, vegetation coverage distribution, residual cloud contamination, and limitations in the number of valid samples, the boundaries of the NDVI–LST feature space may not be clear enough in some months. This can reduce the stability of dry- and wet-edge fitting.
Third, this study used fixed CWSI thresholds to classify drought grades and conducted a threshold sensitivity analysis. The results showed that the main conclusions generally remained consistent under different threshold schemes. However, drought grade area and drought frequency were still affected by threshold settings. Therefore, the drought grades, drought areas, and drought frequencies in this study should be interpreted as regional-scale estimates based on the adopted CWSI thresholds, rather than absolute drought grades strictly calibrated by local field observations. In addition, this study used the original Mann–Kendall test to evaluate trend significance during 2001–2023. Serial autocorrelation was not explicitly tested or corrected. Positive serial autocorrelation may inflate the probability of detecting a statistically significant trend, whereas the Sen’s slope estimates mainly describe trend magnitude and direction. Therefore, the significance results should be interpreted cautiously, particularly for time series close to the 0.05 significance level. Future studies could use modified Mann–Kendall tests or trend-free prewhitening methods to further evaluate the robustness of trend significance.
Finally, the OPGD and random forest models were mainly used to identify factors associated with the spatial differentiation of multi-year mean CWSI. They provide statistical and predictive evidence from the perspectives of spatially stratified heterogeneity and nonlinear modelling, but they cannot directly prove causality. Moreover, direct crop-yield observations were not used to validate the agricultural impacts of CWSI-derived drought conditions. Direct human intervention factors, such as irrigation intensity, groundwater extraction, crop planting structure, and management practices, were not fully included. Time-lag effects were also not systematically analyzed. Therefore, the CWSI-derived drought conditions should be interpreted mainly as regional water-stress patterns rather than direct estimates of crop-yield loss. Future studies can combine higher-resolution remote sensing data such as Sentinel-2 and Landsat, field soil-moisture observations, crop-yield records, irrigation and groundwater-use data, and modified Mann–Kendall tests or trend-free prewhitening methods. This can further improve the accuracy of regional drought monitoring and help clarify the relative roles of climatic and anthropogenic factors in drought evolution.

5. Conclusions

This study constructed an analytical framework of “remote-sensing drought-index comparison–long-term spatiotemporal variation analysis–identification of spatial explanatory factors.” Index comparison and multi-source consistency evaluation were conducted using data from 2001 to 2020. Based on this, CWSI, which showed relatively stable performance, was selected. MODIS data from 2001 to 2023 were then used to analyze the spatiotemporal variations in CWSI-derived drought conditions and regional water stress in Hebei Province. Finally, OPGD and random forest were used to evaluate the explanatory power and predictive contribution of related variables for the spatial differentiation of CWSI. The main conclusions are as follows.
(1) Under the multi-source consistency evaluation framework used in this study, CWSI showed the most consistent overall performance among the four tested indices. Specifically, CWSI maintained significant negative correlations with SPEI and SPI in all four seasons and showed relatively stable consistency with SMCI1.0 soil moisture at the 10 cm soil layer. These results show that CWSI was more consistently related to meteorological water deficits and near-surface soil moisture changes in this study. Taylor statistics further showed that CWSI had higher correlation coefficients, lower normalized centered root mean square differences, and more stable seasonal overall performance in summer, autumn, and winter. The classification evaluation results showed that CWSI achieved comparatively higher ROC–AUC and PR–AUC values than the other indices under multiple reference labels, indicating relatively stable drought identification performance. Typical event analysis also showed that CWSI could continuously reflect the severe drought processes in Hebei Province in 2008 and 2014. Based on these results, CWSI was selected as the most consistent of the four tested indices for the subsequent regional analysis in Hebei Province.
(2) CWSI-derived drought intensity in Hebei Province generally decreased, accompanied by a shift in drought structure. During 2001–2023, CWSI showed significant decreasing trends in spring, summer, and autumn, while the winter trend was not significant. The drought grade structure changed. In spring, the areas of mild and moderate drought increased significantly, while extreme drought decreased significantly. In autumn, mild drought increased and severe drought decreased. In summer, moderate-and-above drought grades all decreased, indicating overall alleviation. Spatially, high-frequency severe drought areas in spring covered most areas of the province, while in autumn they were concentrated in Baoding, Shijiazhuang, Xingtai, and Handan. The most obvious decreases in spring drought intensity occurred in Hengshui, Xingtai, and Handan, while those in summer occurred in Zhangjiakou, Chengde, and the Taihang Mountains.
(3) Both the OPGD and random forest results showed that temperature was the variable most closely related to the spatial differentiation of CWSI. Elevation, GDP, population density, and soil type also showed relatively high explanatory power or predictive contribution. The interaction between temperature and soil type had the highest explanatory power, indicating that the spatial superposition of thermal conditions and soil background was closely associated with the distribution of high and low CWSI values. Precipitation had a higher predictive contribution in the random forest than its single-factor explanatory power in OPGD, suggesting that it contributed to spatial CWSI prediction mainly through nonlinear relationships or conditional dependence with other variables.

Supplementary Materials

The following supporting information can be downloaded at: https://www.mdpi.com/article/10.3390/land15081406/s1, Figure S1: The statistical results of q-values for different discretization methods and category numbers; Figure S2: Explanatory variable discretization results obtained from the OPGD model; Table S1: Basic Information of Partial Meteorological Stations in Hebei Province; Table S2: Monthly dry and wet edge fitting equations of TVDI during 2001–2020; Table S3a: Spatial block assignment used for random forest independent spatial validation; Table S3b: Random forest hyperparameter tuning and spatial validation summary; Table S4a: Overall sample sizes, AUC values and training thresholds; Table S4b: Confusion-matrix statistics in the independent validation period; Table S5a: Area proportions from classified seasonal mean CWSI rasters; Table S5b: Sensitivity of seasonal drought-area proportions to CWSI classification thresholds; Table S5c: Sensitivity of severe-plus-extreme drought area trends to CWSI classification thresholds; Code S1: Python code for spatially validated random forest modelling; Methods S1: Equations for Taylor statistics.

Author Contributions

All authors contributed to the conception and design of the study. X.Z. was responsible for funding acquisition, project administration, resources, and supervision. C.L. contributed to methodology and supervision. S.Z. developed the methodology, constructed the drought indices, performed data analysis, and wrote the original draft. K.W. handled software implementation and data validation; G.S. contributed to investigation and manuscript review; T.C. assisted with data curation; J.R. prepared the visualizations. All authors have read and agreed to the published version of the manuscript.

Funding

This work was supported in part by Hebei Natural Science Foundation General Program under Grant D2025403038 and in part by the National Key R&D Program of China under Grant 2022YFB3903005 and Grant 2022YFB3903005-4.

Data Availability Statement

The MODIS products used in this study are publicly available from NASA Earthdata. Meteorological station data are available from the China Meteorological Data Service Centre. The SMCI1.0 gridded soil moisture product, socioeconomic datasets, terrain data, and OpenStreetMap road data were obtained from the sources listed in Section 2.2. The generated data and scripts are available from the corresponding author upon reasonable request, subject to the use restrictions of the original datasets.

Acknowledgments

The authors thank all data providers, including NASA Earthdata, the China Meteorological Data Service Centre, the developers of the SMCI1.0 dataset, the Resource and Environment Science and Data Center of the Chinese Academy of Sciences, the National Tibetan Plateau Data Center, Geospatial Data Cloud, and OpenStreetMap, for making the datasets used in this study publicly available.

Conflicts of Interest

The authors declare no conflicts of interest.

References

  1. Chen, S.; Zhang, L.; Tang, R.; Yang, K.; Huang, Y. Analysis on Temporal and Spatial Variation of Drought in Henan Province Based on SPEI and TVDI. Trans. Chin. Soc. Agric. Eng. 2017, 33, 126–132. [Google Scholar] [CrossRef]
  2. Zhao, M.; Huang, S.; Huang, Q.; Wang, H.; Leng, G.; Xie, Y. Assessing Socio-Economic Drought Evolution Characteristics and Their Possible Meteorological Driving Force. Geomat. Nat. Hazards Risk 2019, 10, 1084–1101. [Google Scholar] [CrossRef] [Scilit]
  3. Yao, N.; Li, Y.; Sun, C. Effects of Changing Climate on Reference Crop Evapotranspiration over 1961–2013 in Xinjiang, China. Theor. Appl. Climatol. 2018, 131, 349–362. [Google Scholar] [CrossRef] [Scilit]
  4. Cook, B.I.; Mankin, J.S.; Anchukaitis, K.J. Climate Change and Drought: From Past to Future. Curr. Clim. Change Rep. 2018, 4, 164–179. [Google Scholar] [CrossRef] [Scilit]
  5. Zhao, H.; Li, Y.; Chen, X.; Wang, H.; Yao, N.; Liu, F. Monitoring Monthly Soil Moisture Conditions in China with Temperature Vegetation Dryness Indexes Based on an Enhanced Vegetation Index and Normalized Difference Vegetation Index. Theor. Appl. Climatol. 2021, 143, 159–176. [Google Scholar] [CrossRef] [Scilit]
  6. Yao, N.; Li, L.; Feng, P.; Feng, H.; Li Liu, D.; Liu, Y.; Jiang, K.; Hu, X.; Li, Y. Projections of Drought Characteristics in China Based on a Standardized Precipitation and Evapotranspiration Index and Multiple GCMs. Sci. Total Environ. 2020, 704, 135245. [Google Scholar] [CrossRef] [Scilit] [PubMed]
  7. Chen, C.; Baethgen, W.E.; Wang, E.; Yu, Q. Characterizing Spatial and Temporal Variability of Crop Yield Caused by Climate and Irrigation in the North China Plain. Theor. Appl. Climatol. 2011, 106, 365–381. [Google Scholar] [CrossRef] [Scilit]
  8. Wang, C.; Liu, M.; Han, Y.; Chen, S.; Zhang, F.; Qiu, R.; Wu, D.; Zhang, G.; Wang, F.; Liu, J. Assessing the Impacts of Irrigation and Soil Types on the Water Balance and Groundwater Depletion in an Irrigation District of the North China Plain Based on a Coupled SWAT-MODFLOW Model. Agric. Water Manag. 2025, 321, 109890. [Google Scholar] [CrossRef] [Scilit]
  9. Feng, W.; Zhong, M.; Lemoine, J.-M.; Biancale, R.; Hsu, H.-T.; Xia, J. Evaluation of Groundwater Depletion in North China Using the Gravity Recovery and Climate Experiment (GRACE) Data and Ground-Based Measurements. Water Resour. Res. 2013, 49, 2110–2118. [Google Scholar] [CrossRef] [Scilit]
  10. Liu, X.; Pan, Y.; Zhu, X.; Yang, T.; Bai, J.; Sun, Z. Drought Evolution and Its Impact on the Crop Yield in the North China Plain. J. Hydrol. 2018, 564, 984–996. [Google Scholar] [CrossRef] [Scilit]
  11. Kumar, V.; Sharma, K.V.; Pham, Q.B.; Srivastava, A.K.; Bogireddy, C.; Yadav, S.M. Advancements in Drought Using Remote Sensing: Assessing Progress, Overcoming Challenges, and Exploring Future Opportunities. Theor. Appl. Climatol. 2024, 155, 4251–4288. [Google Scholar] [CrossRef] [Scilit]
  12. Zargar, A.; Sadiq, R.; Naser, B.; Khan, F.I. A Review of Drought Indices. Environ. Rev. 2011, 19, 333–349. [Google Scholar] [CrossRef] [Scilit]
  13. Mukherjee, S.; Mishra, A.; Trenberth, K.E. Climate Change and Drought: A Perspective on Drought Indices. Curr. Clim. Change Rep. 2018, 4, 145–163. [Google Scholar] [CrossRef] [Scilit]
  14. Hao, Z.; Singh, V.P. Drought Characterization from a Multivariate Perspective: A Review. J. Hydrol. 2015, 527, 668–678. [Google Scholar] [CrossRef] [Scilit]
  15. Quiring, S.M. Monitoring Drought: An Evaluation of Meteorological Drought Indices. Geogr. Compass 2009, 3, 64–88. [Google Scholar] [CrossRef] [Scilit]
  16. Jiao, D.; Xu, N.; Yang, F.; Xu, K. Evaluation of Spatial-Temporal Variation Performance of ERA5 Precipitation Data in China. Sci. Rep. 2021, 11, 17956. [Google Scholar] [CrossRef] [Scilit] [PubMed]
  17. Wei, W.; Zhang, J.; Zhou, L.; Xie, B.; Zhou, J.; Li, C. Comparative Evaluation of Drought Indices for Monitoring Drought Based on Remote Sensing Data. Environ. Sci. Pollut. Res. 2021, 28, 20408–20425. [Google Scholar] [CrossRef] [Scilit] [PubMed]
  18. West, H.; Quinn, N.; Horswell, M. Remote Sensing for Drought Monitoring & Impact Assessment: Progress, Past Challenges and Future Opportunities. Remote Sens. Environ. 2019, 232, 111291. [Google Scholar] [CrossRef] [Scilit]
  19. Huete, A.R. A Soil-Adjusted Vegetation Index (SAVI). Remote Sens. Environ. 1988, 25, 295–309. [Google Scholar] [CrossRef] [Scilit]
  20. Mutanga, O.; Adam, E.; Cho, M.A. High Density Biomass Estimation for Wetland Vegetation Using WorldView-2 Imagery and Random Forest Regression Algorithm. Int. J. Appl. Earth Obs. Geoinf. 2012, 18, 399–406. [Google Scholar] [CrossRef] [Scilit]
  21. Kogan, F.N. Remote Sensing of Weather Impacts on Vegetation in Non-Homogeneous Areas. Int. J. Remote Sens. 1990, 11, 1405–1419. [Google Scholar] [CrossRef] [Scilit]
  22. Zambrano, F.; Lillo-Saavedra, M.; Verbist, K.; Lagos, O. Sixteen Years of Agricultural Drought Assessment of the BioBío Region in Chile Using a 250 m Resolution Vegetation Condition Index (VCI). Remote Sens. 2016, 8, 530. [Google Scholar] [CrossRef] [Scilit]
  23. Kogan, F.N. Application of Vegetation Index and Brightness Temperature for Drought Detection. Adv. Space Res. 1995, 15, 91–100. [Google Scholar] [CrossRef] [Scilit]
  24. Sandholt, I.; Rasmussen, K.; Andersen, J. A Simple Interpretation of the Surface Temperature/Vegetation Index Space for Assessment of Surface Moisture Status. Remote Sens. Environ. 2002, 79, 213–224. [Google Scholar] [CrossRef] [Scilit]
  25. Idso, S.B.; Jackson, R.D.; Pinter, P.J.; Reginato, R.J.; Hatfield, J.L. Normalizing the Stress-Degree-Day Parameter for Environmental Variability. Agric. Meteorol. 1981, 24, 45–55. [Google Scholar] [CrossRef] [Scilit]
  26. Jackson, R.D.; Kustas, W.P.; Choudhury, B.J. A Reexamination of the Crop Water Stress Index. Irrig. Sci. 1988, 9, 309–317. [Google Scholar] [CrossRef] [Scilit]
  27. Cetin, M.; Alsenjar, O.; Aksu, H.; Golpinar, M.S.; Akgul, M.A. Estimation of Crop Water Stress Index and Leaf Area Index Based on Remote Sensing Data. Water Supply 2023, 23, 1390–1404. [Google Scholar] [CrossRef] [Scilit]
  28. Mu, Q.; Heinsch, F.A.; Zhao, M.; Running, S.W. Development of a Global Evapotranspiration Algorithm Based on MODIS and Global Meteorology Data. Remote Sens. Environ. 2007, 111, 519–536. [Google Scholar] [CrossRef] [Scilit]
  29. Mu, Q.; Zhao, M.; Running, S.W. Improvements to a MODIS Global Terrestrial Evapotranspiration Algorithm. Remote Sens. Environ. 2011, 115, 1781–1800. [Google Scholar] [CrossRef] [Scilit]
  30. Dorjsuren, M.; Liou, Y.-A.; Cheng, C.-H. Time Series MODIS and in Situ Data Analysis for Mongolia Drought. Remote Sens. 2016, 8, 509. [Google Scholar] [CrossRef] [Scilit]
  31. Xiangtao, W.; Xianzhou, Z.; Junhao, W.; Ben, N. Variations in the Drought Severity Index in Response to Climate Change on the Tibetan Plateau. J. Resour. Ecol. 2020, 11, 304. [Google Scholar] [CrossRef] [Scilit]
  32. Wu, T.; Li, B.; Guo, H.; Wang, Y.; Zhu, Y. Analysis of drought variation characteristics in North China Plain based on optimized remote sensing drought index. Acta Ecol. Sin. 2023, 43, 1621–1634. [Google Scholar] [CrossRef] [Scilit]
  33. Sun, H.; Chen, Y.; Sun, H. Comparisons and Classification System of Typical Remote Sensing Indexes for Agricultural Drought. Trans. Chin. Soc. Agric. Eng. 2012, 28, 147–154. [Google Scholar] [CrossRef]
  34. Wang, S.; Zhang, X.; Chen, N.; Zhou, J.; Hu, C.; Peng, X. Monitoring and Comparison of Drought in Five Provinces of the Middle and Lower Reaches of the Yangtze River Based on the Multiple Drought Indices. J. Arid Meteorol. 2019, 37, 209–217. [Google Scholar] [CrossRef]
  35. Zhang, L.; Jiao, W.; Zhang, H.; Huang, C.; Tong, Q. Studying Drought Phenomena in the Continental United States in 2011 and 2012 Using Various Drought Indices. Remote Sens. Environ. 2017, 190, 96–106. [Google Scholar] [CrossRef] [Scilit]
  36. Hao, C.; Zhang, J.; Yao, F. Combination of Multi-Sensor Remote Sensing Data for Drought Monitoring over Southwest China. Int. J. Appl. Earth Obs. Geoinf. 2015, 35, 270–283. [Google Scholar] [CrossRef] [Scilit]
  37. Du, L.; Tian, Q.; Yu, T.; Meng, Q.; Jancso, T.; Udvardy, P.; Huang, Y. A Comprehensive Drought Monitoring Method Integrating MODIS and TRMM Data. Int. J. Appl. Earth Obs. Geoinf. 2013, 23, 245–253. [Google Scholar] [CrossRef] [Scilit]
  38. Alsenjar, O.; Aksu, H. Spatiotemporal Analysis of Temperature and Precipitation in Syria. Pure Appl. Geophys. 2026, 183, 2547–2589. [Google Scholar] [CrossRef] [Scilit]
  39. Yan, F.; Wang, Y.; Wu, B. Spatial and Temporal Distributions of Drought in Hebei Province over the Past 50 Years. Geogr. Res. 2010, 29, 423–430. [Google Scholar] [CrossRef]
  40. Yang, P.; Li, C.; Gao, Q.; Zhang, Y.; Cui, S. Study on Applicability of Multiple Drought Remote Sensing Monitoring Models in Hebei Area. Jiangsu Agric. Sci. 2018, 46, 231–237. [Google Scholar] [CrossRef]
  41. Zhao, N.; Yue, T.; Li, H.; Zhang, L.; Yin, X.; Liu, Y. Spatio-Temporal Changes in Precipitation over Beijing-Tianjin-Hebei Region, China. Atmos. Res. 2018, 202, 156–168. [Google Scholar] [CrossRef] [Scilit]
  42. Qian, W.; Wu, S.; Fang, M.; Qian, X. Water Scarcity in Hebei Province, China: A Predictive Model and Analysis of Contributing Factors. Desalin. Water Treat. 2025, 322, 101136. [Google Scholar] [CrossRef] [Scilit]
  43. Zhang, J.; Sun, F.; Liu, W.; Liu, J.; Wang, H. Spatio-Temporal Patterns of Drought Evolution over the Beijing-Tianjin-Hebei Region, China. J. Geogr. Sci. 2019, 29, 863–876. [Google Scholar] [CrossRef] [Scilit]
  44. Zeng, B.; Wen, B.; Zhang, X.; Zhao, S.; Shang, G.; An, S.; Li, Z. Analysis on Spatiotemporal Variation in Soil Drought and Its Influencing Factors in Hebei Province from 2001 to 2020. Agriculture 2025, 15, 1109. [Google Scholar] [CrossRef] [Scilit]
  45. Didan, K. MOD13A3 MODIS/Terra Vegetation Indices Monthly L3 Global 1km SIN Grid V006; NASA Land Processes Distributed Active Archive Center: Sioux Falls, SD, USA, 2015. [CrossRef] [Scilit]
  46. Wan, Z.; Hook, S.; Hulley, G. MOD11A2 MODIS/Terra Land Surface Temperature/Emissivity 8-Day L3 Global 1km SIN Grid V006; NASA Land Processes Distributed Active Archive Center: Sioux Falls, SD, USA, 2015. [CrossRef] [Scilit]
  47. Running, S.; Mu, Q.; Zhao, M.; Moreno, A. MODIS/Terra Net Evapotranspiration Gap-Filled 8-Day L4 Global 500m SIN Grid V061; NASA Land Processes Distributed Active Archive Center: Sioux Falls, SD, USA, 2021. [CrossRef]
  48. Shangguan, W.; Li, Q.; Shi, G. A 1 Km Daily Soil Moisture Dataset over China Based on In Situ Measurement (2000–2020); National Tibetan Plateau/Third Pole Environment Data Center: Beijing, China, 2022. [Google Scholar] [CrossRef]
  49. Wu, D.; Hu, Z.; Fan, Q.; Fu, C.; Fan, W. Historical Agricultural Drought Patterns and Drought-Related Factors over Western China. Hydrol. Sci. J. 2023, 68, 1016–1032. [Google Scholar] [CrossRef] [Scilit]
  50. Lu, Y.; Yang, T.; Fu, J.; Song, W. Utility of the Standardized Precipitation Evapotranspiration Index (SPEI) to Detect Agricultural Droughts over China. J. Hydrol. Reg. Stud. 2025, 58, 102190. [Google Scholar] [CrossRef] [Scilit]
  51. Zhang, Y.; Hao, Y.; Tian, J.; Zhang, Q.; Liu, R.; Li, J. Studying the Impacts of Land Use Types and Soil Textures on Agricultural Drought in Ziya River Basin Using SWDI. Sci. Rep. 2025, 15, 42088. [Google Scholar] [CrossRef] [Scilit] [PubMed]
  52. Jackson, R.D.; Idso, S.B.; Reginato, R.J.; Pinter, P.J., Jr. Canopy Temperature as a Crop Water Stress Indicator. Water Resour. Res. 1981, 17, 1133–1138. [Google Scholar] [CrossRef] [Scilit]
  53. Liu, L.; Wu, J.; Li, C.; Chang, X. Spatial and Temporal Distributions of Drought on the Loess Plateau during the Growing Seasons of 2001–2020. Acta Prataculturae Sin. 2024, 33, 28–36. [Google Scholar] [CrossRef]
  54. Zhao, X.; Xia, H.; Liu, B.; Jiao, W. Spatiotemporal Comparison of Drought in Shaanxi–Gansu–Ningxia from 2003 to 2020 Using Various Drought Indices in Google Earth Engine. Remote Sens. 2022, 14, 1570. [Google Scholar] [CrossRef] [Scilit]
  55. Kogan, F.; Sullivan, J. Development of Global Drought-Watch System Using NOAA/AVHRR Data. Adv. Space Res. 1993, 13, 219–222. [Google Scholar] [CrossRef] [Scilit]
  56. Guttman, N.B. Accepting the Standardized Precipitation Index: A Calculation Algorithm. J. Am. Water Resour. Assoc. 1999, 35, 311–322. [Google Scholar] [CrossRef] [Scilit]
  57. Song, Z.; Xia, J.; She, D.; Zhang, L.; Hu, C.; Zhao, L. The Development of a Nonstationary Standardized Precipitation Index Using Climate Covariates: A Case Study in the Middle and Lower Reaches of Yangtze River Basin, China. J. Hydrol. 2020, 588, 125115. [Google Scholar] [CrossRef] [Scilit]
  58. Um, M.-J.; Kim, Y.; Park, D. Evaluation and Modification of the Drought Severity Index (DSI) in East Asia. Remote Sens. Environ. 2018, 209, 66–76. [Google Scholar] [CrossRef] [Scilit]
  59. Lloyd-Hughes, B.; Saunders, M.A. A Drought Climatology for Europe. Int. J. Climatol. 2002, 22, 1571–1592. [Google Scholar] [CrossRef] [Scilit]
  60. Li, H.; Zhang, S.; Gao, Z.; Sun, Y. Evaluating the Utility of MODIS Vegetation Index for Monitoring Agricultural Drought. Spectrosc. Spect. Anal. 2013, 33, 756–761. [Google Scholar] [CrossRef]
  61. Vicente-Serrano, S.M.; Beguería, S.; López-Moreno, J.I. A Multiscalar Drought Index Sensitive to Global Warming: The Standardized Precipitation Evapotranspiration Index. J. Clim. 2010, 23, 1696–1718. [Google Scholar] [CrossRef] [Scilit]
  62. Beguería, S.; Vicente-Serrano, S.M.; Reig, F.; Latorre, B. Standardized Precipitation Evapotranspiration Index (SPEI) Revisited: Parameter Fitting, Evapotranspiration Models, Tools, Datasets and Drought Monitoring. Int. J. Climatol. 2014, 34, 3001–3023. [Google Scholar] [CrossRef] [Scilit]
  63. Taylor, K.E. Summarizing Multiple Aspects of Model Performance in a Single Diagram. J. Geophys. Res. 2001, 106, 7183–7192. [Google Scholar] [CrossRef] [Scilit]
  64. Hao, Z.; AghaKouchak, A. Multivariate Standardized Drought Index: A Parametric Multi-Index Model. Adv. Water Resour. 2013, 57, 12–18. [Google Scholar] [CrossRef] [Scilit]
  65. Bachmair, S.; Svensson, C.; Hannaford, J.; Barker, L.J.; Stahl, K. A Quantitative Analysis to Objectively Appraise Drought Indicators and Model drought Impacts. Hydrol. Earth Syst. Sci. 2016, 20, 2589–2609. [Google Scholar] [CrossRef] [Scilit]
  66. Monteleone, B.; Bonaccorso, B.; Martina, M. A Joint Probabilistic Index for Objective Drought Identification: The Case Study of Haiti. Nat. Hazards Earth Syst. Sci. 2020, 20, 471–487. [Google Scholar] [CrossRef] [Scilit]
  67. Hao, Z.; AghaKouchak, A. A Nonparametric Multivariate Multi-Index Drought Monitoring Framework. J. Hydrometeorol. 2014, 15, 89–101. [Google Scholar] [CrossRef] [Scilit]
  68. Fawcett, T. An Introduction to ROC Analysis. Pattern Recognit. Lett. 2006, 27, 861–874. [Google Scholar] [CrossRef] [Scilit]
  69. Davis, J.; Goadrich, M. The Relationship between Precision-Recall and ROC Curves. In Proceedings of the 23rd International Conference on Machine Learning—ICML ‘06; ACM Press: Pittsburgh, PA, USA, 2006; pp. 233–240. [Google Scholar] [CrossRef] [Scilit]
  70. Saito, T.; Rehmsmeier, M. The Precision-Recall Plot Is More Informative than the ROC Plot When Evaluating Binary Classifiers on Imbalanced Datasets. PLoS ONE 2015, 10, e0118432. [Google Scholar] [CrossRef] [Scilit] [PubMed]
  71. Forecast Verification: A Practitioner’s Guide in Atmospheric Science; Jolliffe, I.T., Stephenson, D.B., Eds.; Wiley: Hoboken, NJ, USA, 2011; ISBN 978-0-470-66071-3. [Google Scholar] [CrossRef] [Scilit]
  72. Gocic, M.; Trajkovic, S. Analysis of Changes in Meteorological Variables Using Mann-Kendall and Sen’s Slope Estimator Statistical Tests in Serbia. Glob. Planet. Change 2013, 100, 172–182. [Google Scholar] [CrossRef] [Scilit]
  73. Hamed, K.H. Trend Detection in Hydrologic Data: The Mann–Kendall Trend Test under the Scaling Hypothesis. J. Hydrol. 2008, 349, 350–363. [Google Scholar] [CrossRef] [Scilit]
  74. Hamed, K.H.; Ramachandra Rao, A. A Modified Mann-Kendall Trend Test for Autocorrelated Data. J. Hydrol. 1998, 204, 182–196. [Google Scholar] [CrossRef] [Scilit]
  75. Hussain, M.; Mahmud, I. pyMannKendall: A Python Package for Non Parametric Mann Kendall Family of Trend Tests. J. Open Source Softw. 2019, 4, 1556. [Google Scholar] [CrossRef] [Scilit]
  76. Kisi, O.; Ay, M. Comparison of Mann–Kendall and Innovative Trend Method for Water Quality Parameters of the Kizilirmak River, Turkey. J. Hydrol. 2014, 513, 362–375. [Google Scholar] [CrossRef] [Scilit]
  77. Cheng, Q.; Gao, L.; Zhong, F.; Zuo, X.; Ma, M. Spatiotemporal Variations of Drought in the Yunnan-Guizhou Plateau, Southwest China, during 1960–2013 and Their Association with Large-Scale Circulations and Historical Records. Ecol. Indic. 2020, 112, 106041. [Google Scholar] [CrossRef] [Scilit]
  78. Song, Y.; Wang, J.; Ge, Y.; Xu, C. An Optimal Parameters-Based Geographical Detector Model Enhances Geographic Characteristics of Explanatory Variables for Spatial Heterogeneity Analysis: Cases with Different Types of Spatial Data. GISci. Remote Sens. 2020, 57, 593–610. [Google Scholar] [CrossRef] [Scilit]
  79. Luo, K.; Samat, A.; Van de Voorde, T.; Li, W.; Xu, W.; Abuduwaili, J. Assessing Ecological Quality Dynamics and Driving Factors in the Irtysh River Basin Using AWBEI and OPGD Approaches. IEEE J. Sel. Top. Appl. Earth Obs. Remote Sens. 2025, 18, 1153–1173. [Google Scholar] [CrossRef] [Scilit]
  80. Sun, Z.; Yang, J.; Qi, Y.; Liu, J. Spatial Heterogeneity and Impact Factors of Soil Organic Carbon in Farmland in the Dry Loess Plateau of China Based on the OPGD Model. Environ. Res. Commun. 2025, 7, 095020. [Google Scholar] [CrossRef] [Scilit]
  81. Liu, J.; Wang, Y.; Guo, H.; Lu, Y.; Xu, Y.; Sun, Y.; Gan, W.; Sun, R.; Li, Z. Spatial and Temporal Patterns and Driving Factors of Forest Fires Based on an Optimal Parameter-Based Geographic Detector in the Panxi Region, Southwest China. Fire Ecol. 2024, 20, 27. [Google Scholar] [CrossRef] [Scilit]
  82. Wang, J.-F.; Zhang, T.-L.; Fu, B.-J. A Measure of Spatial Stratified Heterogeneity. Ecol. Indic. 2016, 67, 250–256. [Google Scholar] [CrossRef] [Scilit]
  83. Breiman, L. Random Forests. Mach. Learn. 2001, 45, 5–32. [Google Scholar] [CrossRef] [Scilit]
  84. Wang, Q.; Zhao, L.; Wang, M.; Wu, J.; Zhou, W.; Zhang, Q.; Deng, M. A Random Forest Model for Drought: Monitoring and Validation for Grassland Drought Based on Multi-Source Remote Sensing Data. Remote Sens. 2022, 14, 4981. [Google Scholar] [CrossRef] [Scilit]
  85. Meng, X.; Zhang, S.; Wang, G.; Ding, J.; Chu, C.; Zhang, J.; Wang, H. Decoding Agricultural Drought Resilience: A Triple-Validated Random Forest Framework Integrating Multi-Source Remote Sensing for High-Resolution Monitoring in the North China Plain. Remote Sens. 2025, 17, 1404. [Google Scholar] [CrossRef] [Scilit]
  86. Song, G. Hebei Announces Top 10 Climate Events of 2008; Hebei Farmers’ Daily: Shijiazhuang, China, 2009. [Google Scholar]
  87. Wang, S.; Duan, H.; Feng, J. Drought Situation, Influence and Cause of China in Spring of 2014. J. Arid Meteorol. 2014, 32, 491–496. [Google Scholar] [CrossRef]
  88. Chen, X.; Yan, Z.; Liu, Q.; Li, R.; Zhang, S. Spatiotemporal Characteristics of Drought in Inner Mongolia Based on GEE and Optimal Remote Sensing Drought Index. Arid. Land Geogr. 2025, 48, 1903–1912. [Google Scholar] [CrossRef]
  89. Tian, G.; Ren, Y.; Yang, Q.; Huang, X.; Zhao, S.; Zuo, X.; Li, Z. Application Study of Three Remote Sensing Drought Monitoring Indices in the Eastern Loess Plateau. J. Arid. Meteorol. 2024, 42, 338–346. [Google Scholar] [CrossRef]
  90. Sha, S.; Guo, N.; Li, Y.; Ren, Y.; Li, Y. Comparison of the Vegetation Condition Index with Meteorological Drought Indices: A Case Study in Henan Province. J. Glaciol. Geocryol. 2013, 35, 990–998. [Google Scholar] [CrossRef]
  91. Wang, Y.; Li, J.; Tong, X.; Wang, Y.; Yang, M. Regulation of Climatic Variables and Drought on Vegetation Dynamics in China from 2001 to 2020. Ecol. Indic. 2024, 165, 112094. [Google Scholar] [CrossRef] [Scilit]
  92. Yang, P.; Gao, Q.; Zhang, Y.; Li, C.; Shi, W.; Zhu, G. Drought Condition of Central-South Region of Hebei Province Monitored by Temperature Vegetation Drought Index. Guizhou Agric. Sci. 2018, 46, 120–124. [Google Scholar] [CrossRef]
  93. Yang, C.; Liu, C.; Wang, Y.; Gu, Y.; Ma, X. Assessment of the Spatiotemporal Evolution and Driving Forces of Meteorological Drought in the North China Plain. Int. J. Climatol. 2023, 43, 7883–7898. [Google Scholar] [CrossRef] [Scilit]
  94. Huang, J.; Zhang, Y.; Wang, M.; Wang, F.; Tang, Z.; He, H. Spatial and Temporal Distribution Characteristics of Drought and Its Relationship with Meteorological Factors in Xinjiang in Last 17 Years. Acta Ecol. Sin. 2020, 40, 1077–1088. [Google Scholar] [CrossRef] [Scilit]
  95. Cao, Y.; Wang, F. Spatial and Temporal Variation of Vegetation and Its Response to Meteorological Drought in Hebei Province. S. N. Water Transf. Water Sci. Technol. 2021, 19, 708–719+757. [Google Scholar] [CrossRef]
  96. Saxton, K.E.; Rawls, W.J. Soil Water Characteristic Estimates by Texture and Organic Matter for Hydrologic Solutions. Soil Sci. Soc. Am. J. 2006, 70, 1569–1578. [Google Scholar] [CrossRef] [Scilit]
  97. Wankmüller, F.J.P.; Delval, L.; Lehmann, P.; Baur, M.J.; Cecere, A.; Wolf, S.; Or, D.; Javaux, M.; Carminati, A. Global Influence of Soil Texture on Ecosystem Water Limitation. Nature 2024, 635, 631–638. [Google Scholar] [CrossRef] [Scilit] [PubMed]
  98. Qiu, R.; Katul, G.G.; Zhang, L.; Qin, S.; Jiang, X. The Effects of Changing Environments, Abiotic Stresses, and Management Practices on Cropland Evapotranspiration: A Review. Rev. Geophys. 2025, 63, e2024RG000858. [Google Scholar] [CrossRef] [Scilit]
  99. Wada, Y.; Van Beek, L.P.H.; Wanders, N.; Bierkens, M.F.P. Human Water Consumption Intensifies Hydrological Drought Worldwide. Environ. Res. Lett. 2013, 8, 034036. [Google Scholar] [CrossRef] [Scilit]
  100. Yang, Y.; Yang, Y.; Liu, D.; Nordblom, T.; Wu, B.; Yan, N. Regional Water Balance Based on Remotely Sensed Evapotranspiration and Irrigation: An Assessment of the Haihe Plain, China. Remote Sens. 2014, 6, 2514–2533. [Google Scholar] [CrossRef] [Scilit]
  101. Cheng, M.; Jiao, X.; Guo, W.; Wang, S.; Pan, Y.; Zhang, H.; Sang, H. Temporal and Spatial Distribution Characteristics of Irrigation Water Requirement for Main Crops in the Plain Area of Hebei Province. Irrig. Drain. 2020, 69, 1051–1062. [Google Scholar] [CrossRef] [Scilit]
  102. Chen, X.; Thorp, K.R.; Ouyang, Z.; Hou, Y.; Zhou, B.; Li, Y. Energy Consumption Due to Groundwater Pumping for Irrigation in the North China Plain. Sci. Total Environ. 2019, 669, 1033–1042. [Google Scholar] [CrossRef] [Scilit] [PubMed]
Figure 1. Location of the study area and distribution of the selected meteorological stations.
Land 15 01406 g001
Figure 2. Seasonal Pearson correlations between the four remote-sensing drought indices and SPEI-3 in Hebei Province during 2001–2020.
Land 15 01406 g002
Figure 3. Spatial distribution of station-level seasonal correlation coefficients between four MODIS remote-sensing drought indices and SPEI-3 at 19 meteorological stations in Hebei Province during 2001–2020. (a) Spring, (b) summer, (c) autumn, and (d) winter.
Land 15 01406 g003
Figure 4. Seasonal Taylor diagram comparison between four MODIS remote-sensing drought indices and SPEI-3 at 19 meteorological stations in Hebei Province during 2001–2020. (a) Spring, (b) summer, (c) autumn, and (d) winter.
Land 15 01406 g004
Figure 5. Seasonal Pearson correlations between the four remote-sensing drought indices and SPI-3 in Hebei Province during 2001–2020. * p < 0.05; ** p < 0.01.
Land 15 01406 g005
Figure 6. Spatial distribution of seasonal correlation coefficients between four MODIS remote-sensing drought indices and SMCI1.0 soil moisture in Hebei Province during 2001–2020.
Land 15 01406 g006
Figure 7. Temporal responses of CWSI, TCI, VCI, and TVDI during the spring drought events in Hebei Province in 2008 and 2014.
Land 15 01406 g007
Figure 8. Interannual variations in seasonal CWSI and area proportions of different drought grades in Hebei Province during 2001–2023. The black dotted line represents the CWSI trend estimated using Sen’s slope.
Land 15 01406 g008
Figure 9. Spatial distribution of seasonal occurrence frequency of different drought grades in Hebei Province during 2001–2023.
Land 15 01406 g009
Figure 10. Spatial distribution of multi-year mean seasonal CWSI drought grade classification in Hebei Province during 2001–2023. (a) Spring, (b) summer, (c) autumn, and (d) winter.
Land 15 01406 g010
Figure 11. Spatial distribution of trends in seasonal drought intensity in Hebei Province during 2001–2023. (a) Spring, (b) summer, (c) autumn, and (d) winter.
Land 15 01406 g011
Figure 12. Spatial distribution of trend significance in seasonal drought intensity in Hebei Province during 2001–2023. (a) Spring, (b) summer, (c) autumn, and (d) winter.
Land 15 01406 g012
Figure 13. OPGD factor detector results and q values of each explanatory variable.
Land 15 01406 g013
Figure 14. OPGD detection results of interactions among explanatory variables.
Land 15 01406 g014
Figure 15. OPGD risk detector results of CWSI under different explanatory variable strata in Hebei Province. Red indicates the stratum with the highest CWSI, blue indicates the stratum with the lowest CWSI, and gray indicates other strata.
Land 15 01406 g015
Figure 16. Risk detection matrix of CWSI differences under different explanatory variable strata. Y and N indicate significant and non-significant differences in mean CWSI between strata at the 95% confidence level, respectively.
Land 15 01406 g016
Figure 17. Ecological detector results showing differences in explanatory power among different explanatory variables for the spatial heterogeneity of CWSI in Hebei Province. The confidence level of the significance test was 95%. Y indicates a significant difference in explanatory power between the two factors, whereas N indicates no significant difference.
Land 15 01406 g017
Figure 18. Permutation importance of different explanatory variables for predicting multi-year mean CWSI in Hebei Province using the random forest model.
Land 15 01406 g018
Table 1. Parameters of MODIS remote-sensing data products.
ProductVariableTemporal ResolutionSpatial ResolutionStudy Period
MOD11A2 (V006)LST8 days1 km2001–2023
MOD13A3 (V006)NDVI30 days1 km2001–2023
MOD16A2GF (V061)ET/PET8 days500 m2001–2023
Table 2. Explanatory variables used in the OPGD and random forest analyses.
CodeVariableResolutionData Source/Processing MethodTime Range/Baseline Year
X1Vegetation type1 kmResource and Environment Science and Data Center, Chinese Academy of Sciences
(https://www.resdc.cn/)
2001
X2Soil type30 mChina Soil Database
(http://vdb3.soil.csdb.cn/)
1995
X3River density1 kmResource and Environment Science and Data Center, Chinese Academy of Sciences; calculated using density analysis (https://www.resdc.cn/)2023
X4Elevation30 mDerived from the digital elevation model (DEM) obtained from Geospatial Data Cloud (https://www.gscloud.cn)2023
X5Slope30 mDerived from DEM2023
X6Aspect2023
X7Temperature1 kmNational Tibetan Plateau Data Center
(https://data.tpdc.ac.cn)
2001–2023
X8Precipitation2001–2023
X9Population density1 kmResource and Environment Science and Data Center, Chinese Academy of Sciences
(https://www.resdc.cn/)
2005, 2010, 2015,
2020
X10Gross domestic product (GDP)2005, 2010, 2015,
2020
X11Distance to city2023
X12Distance to road1 kmOpenStreetMap, calculated using near analysis (https://www.openstreetmap.org/)2023
Note: All online data sources were accessed on 6 January 2026.
Table 3. CWSI drought classification thresholds.
ClassCWSICategory
10–0.6No drought
20.6–0.7Mild drought
30.7–0.8Moderate drought
40.8–0.9Severe drought
50.9–1.0Extreme drought
Table 4. Optimal discretization methods and number of classes for continuous explanatory variables.
VariableVariable NameOptimal MethodNumber of Classes
X3River densityQuantile7
X4ElevationEqual interval7
X5SlopeQuantile5
X7TemperatureNatural breaks7
X8PrecipitationQuantile6
X9Population densityQuantile7
X10GDPQuantile7
X11Distance to cityNatural breaks6
X12Distance to roadQuantile7
Table 5. Station-level correlations between SPI/SPEI at different accumulation scales and remote-sensing drought indices during 2001–2020.
Reference IndexCWSITCITVDIVCI
SPEI-1−0.445 (−0.463, −0.405); 19/190.326 (0.283, 0.369); 19/19−0.132 (−0.172, −0.074); 10/190.069 (0.026, 0.123); 4/19
SPEI-3−0.419 (−0.461, −0.401); 19/190.270 (0.241, 0.311); 19/19−0.082 (−0.120, −0.035); 4/190.038 (0.012, 0.126); 7/19
SPEI-6−0.340 (−0.407, −0.302); 19/190.264 (0.220, 0.285); 18/19−0.094 (−0.159, −0.078); 7/190.056 (−0.052, 0.138); 6/19
SPEI-12−0.276 (−0.344, −0.247); 18/190.173 (0.124, 0.256); 14/19−0.094 (−0.204, 0.012); 8/190.082 (−0.093, 0.219); 9/19
SPI-1−0.365 (−0.423, −0.359); 19/190.250 (0.199, 0.296); 19/19−0.130 (−0.142, −0.068); 10/190.100 (0.075, 0.163); 7/19
SPI-3−0.386 (−0.446, −0.353); 19/190.207 (0.180, 0.243); 16/19−0.087 (−0.128, −0.038); 5/190.090 (0.074, 0.167); 8/19
SPI-6−0.306 (−0.399, −0.255); 19/190.209 (0.167, 0.235); 16/19−0.099 (−0.161, −0.082); 7/190.106 (0.019, 0.138); 6/19
SPI-12−0.247 (−0.317, −0.206); 18/190.136 (0.089, 0.225); 11/19−0.103 (−0.203, −0.022); 7/190.084 (0.018, 0.206); 9/19
Note: The values in the table are the median Pearson correlation coefficients of the 19 meteorological stations. The values in parentheses are interquartile ranges, and the numbers after the semicolon indicate the number of stations with significant correlations at p < 0.05.
Table 6. Classification evaluation results for the drought identification ability of the four remote-sensing drought indices.
Reference LabelIndexROC–AUCPR–AUCPODFARCSIF1
SPI-3CWSI0.7060.2460.520.7970.1710.292
SPI-3TCI0.5970.1770.50.8890.10.182
SPI-3VCI0.5360.1420.4210.8930.0930.171
SPI-3TVDI0.5250.1440.2760.8860.0880.161
SPEI-3CWSI0.6980.3630.440.6810.2270.37
SPEI-3TCI0.6410.2960.50.7090.2250.368
SPEI-3VCI0.5120.2090.440.7920.1640.282
SPEI-3TVDI0.5350.220.4890.7490.1990.332
SMCI1.0CWSI0.670.3180.5850.5250.3550.524
SMCI1.0TCI0.5910.2480.430.5940.2640.418
SMCI1.0VCI0.5430.220.4760.6310.2620.416
SMCI1.0TVDI0.5230.2080.5170.6260.2780.434
Multi-sourceCWSI0.710.2950.4890.7170.2180.358
Multi-sourceTCI0.6260.2220.6090.7990.1780.302
Multi-sourceVCI0.5230.1620.440.8340.1370.241
Multi-sourceTVDI0.5380.1710.4180.7940.160.276
Note: ROC–AUC and PR–AUC were calculated using all valid samples from 2001 to 2020 as threshold-independent discrimination metrics. POD, FAR, CSI, and F1-score were evaluated during the independent validation period of 2015–2020 using thresholds determined from the 2001–2014 training period based on the maximum Youden index criterion.
Table 7. Prediction performance of the random forest model for the 2001–2023 multi-year mean CWSI in Hebei Province.
DatasetNR2RMSEMAEBias
Training set99840.95510.01440.01060.000
Independent spatial test set23060.83520.02620.0201−0.0042
Disclaimer/Publisher’s Note: The statements, opinions and data contained in all publications are solely those of the individual author(s) and contributor(s) and not of MDPI and/or the editor(s). MDPI and/or the editor(s) disclaim responsibility for any injury to people or property resulting from any ideas, methods, instructions or products referred to in the content.