1. Introduction
Urban perception refers to the subjective evaluations that people form about the safety, attractiveness, liveliness, social characteristics, and emotional atmosphere of urban places based on environmental cues. Early studies commonly used pairwise comparisons of street-view images to quantify perceptions of spatial attributes such as safety, social class, and uniqueness [
1]. With the development of street-view imagery, deep learning, and large-scale perception datasets, recent studies have expanded this framework to multiple dimensions, including beauty, wealth, liveliness, safety, boredom, and depressiveness [
2,
3]. Previous research has also shown that urban perception is associated with health-related outcomes, psychological distress, and urban well-being [
4,
5]. Urban perception can therefore provide an important evidence base for health-oriented urban planning and management.
Vision is one of the primary ways through which people perceive urban environments [
6]. Visual features in street spaces can shape cognition, attention allocation, and environmental evaluation [
7,
8]. Accordingly, a growing body of research has examined visual characteristics of the built environment, including streetscape composition [
9], architectural form [
10], color [
11], visual complexity [
12], and visual coherence and order [
13]. In visual psychology, visual clutter refers to the spatial congestion of visual information, in which visual features or object properties are densely packed and change repeatedly within a limited area [
14]. Such frequent local transitions can generate competing visual signals, thereby increasing the difficulty of visual search, object recognition, and information processing under the limited capacity of human visual attention [
15]. Visual complexity, by contrast, refers more broadly to the overall amount, richness, diversity, or degree of stimulation provided by visual information. The two concepts are related but not equivalent. Streetscapes containing similar amounts or types of visual information may differ substantially in clutter: visual elements organized into large and continuous regions produce relatively few local transitions, whereas the same elements divided into small, closely interspersed regions produce denser transitions and greater visual congestion. Accordingly, the conceptual distinction adopted in this study lies in the spatial density of feature transitions rather than in the overall amount or diversity of visual information.
Existing studies in visual psychology and computer vision have developed various approaches to measuring visual clutter. These approaches examine factors such as feature congestion, edge density, color transitions, and semantic fragmentation [
16]. In the present study, streetscape visual clutter is operationalized as the spatial density of feature transitions in street-view images. For edge, color, semantic, and depth clutter, respectively, the indicators quantify the density of structural contours and of boundaries between adjacent dominant color regions, semantic object categories, and relative spatial-depth layers. Across all four dimensions, denser boundaries indicate that the corresponding visual feature changes more frequently within the image and is therefore more spatially congested. The proposed indicators therefore characterize the spatial congestion of feature transitions rather than the number or diversity of visual elements per se.
This operationalization is consistent with previous studies showing that clutter arises from the combined effects of multiple visual features, which can intensify information competition, distract attention, and increase the difficulty of visual recognition [
14,
17,
18]. However, most of these concepts and methods have been applied to general images, interface design, or controlled experimental settings. They have not yet been fully translated into a multidimensional framework for studying perceptions of urban streetscapes and open spaces. Existing studies of streetscapes and open spaces have widely examined visual complexity and the amount of visual information, but have paid less attention to the distinct perceptual effects of different types of visual information. Moreover, the association between visual clutter and urban perception may not be strictly linear [
8,
19,
20,
21]. Previous research has also focused largely on small neighborhoods or individual sites, leaving citywide evidence limited. It is therefore necessary to examine both the differentiated and nonlinear associations between multiple types of streetscape visual clutter and multidimensional urban perceptions at the city scale.
The development of street-view imagery and deep learning has created new opportunities for large-scale analysis of urban visual environments. Compared with traditional field surveys and questionnaires, street-view imagery records urban spaces from a human-centered perspective and supports continuous visual assessment over large areas [
22]. In recent years, deep learning methods have been widely used to identify streetscape elements, estimate urban perceptions, and quantify visual characteristics [
2,
9,
22,
23]. In particular, deep learning models trained on the Place Pulse 2.0 dataset have shown a reliable capacity to predict perceptual dimensions such as beauty, safety, liveliness, and depressiveness in urban environments [
24]. These developments provide a methodological basis for translating the concept of visual clutter from visual psychology into city-scale streetscape indicators and for examining its associations with urban perceptions.
Building on previous research, this study addresses the limited city-scale evidence on whether different dimensions of streetscape visual clutter show distinct associations with specific urban perceptions and whether these associations exhibit stable nonlinear patterns. Shanghai was selected because its dense and heterogeneous urban fabric, extensive street network, and substantial variation across central, newly developed, and peripheral areas provide a suitable context for examining multiple dimensions of streetscape visual clutter at the city scale. Using street-view imagery from Shanghai, the study combines deep learning and computer vision methods to operationalize streetscape visual clutter through four dimensions—edge, color, semantic, and depth clutter—and examines their associations with six model-estimated urban perception dimensions: beauty, wealth, liveliness, safety, boredom, and depressiveness. The study aims not only to develop a multidimensional measurement framework but also to provide diagnostic evidence for municipal and district-level planning authorities, urban designers, landscape architects, and agencies responsible for streetscape renewal, signage, street furniture, planting, and public-space management. Rather than recommending a uniform increase or reduction in visual information, the findings are intended to support more targeted identification and management of different forms of streetscape visual clutter. The resulting evidence is intended to support targeted diagnosis and design review in visually congested settings, including major intersections, mixed-use streets, and peripheral town centers, where buildings, signs, vegetation, vehicles, and public facilities must be coordinated within limited street space.
Specifically, this study addresses three questions and one practical objective: (1) Does streetscape visual clutter remain associated with urban perceptions after controlling for built-environment characteristics? (2) Do different types of visual clutter show distinct associations with different dimensions of urban perception? (3) Are there stable nonlinear relationships between streetscape visual clutter and urban perceptions? With the questions addressed, (4) the study suggests considerations to lessen visual clutter.
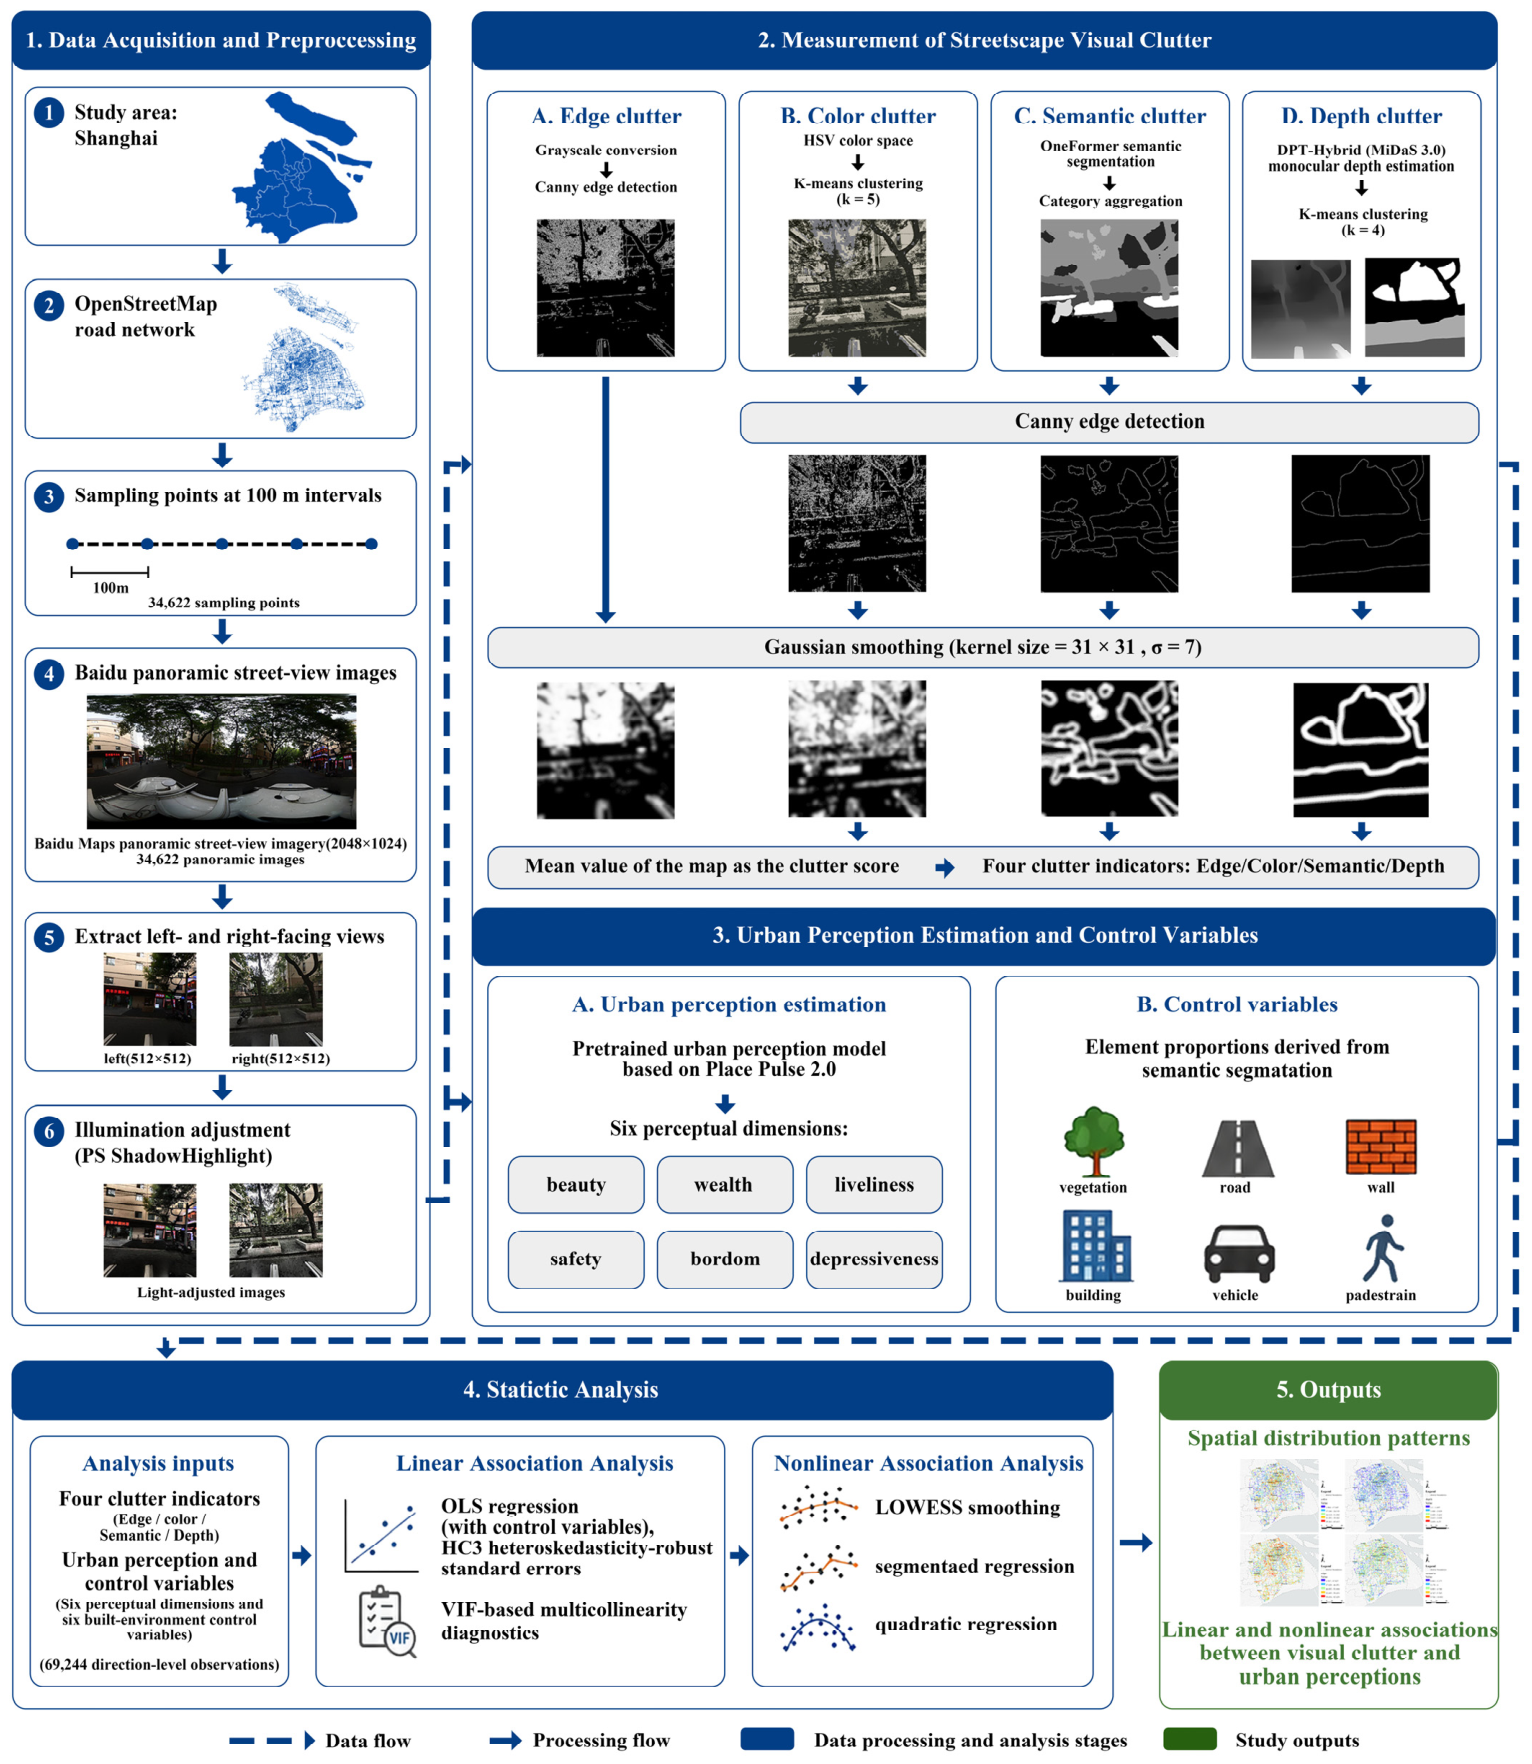
The overall research framework is shown in
Figure 1.
2. Study Area and Methods
2.1. Study Area and Street-View Data
Shanghai is a high-density megacity characterized by substantial spatial heterogeneity. Its urban landscape includes dense central districts, peripheral new towns, suburban built-up areas, and urban–rural transition zones. These areas differ markedly in building form, street frontage, vegetation, transport conditions, and levels of human activity. Such diversity provides sufficient spatial variation for examining the associations between streetscape visual clutter and urban perceptions [
3].
In Shanghai, the potential application of these findings involves multiple municipal, district-level, and local actors. Planning and natural-resources authorities, urban-design and urban-renewal agencies, and housing and urban–rural development departments may use such evidence to inform street-interface design, public-space layout, sightline organization, spatial continuity, and the coordination of buildings with surrounding streetscapes. Landscaping and city-appearance authorities are involved in the management of outdoor signs, landscape lighting, street greenery, and the visual quality of public environments, while transport and road-management authorities, district governments, and subdistrict offices participate in street renewal and the provision and maintenance of public facilities. Property owners, designers, and facility operators also influence facades, signs, lighting, planting, and other visible street elements. The findings may therefore support urban-design guidance, streetscape-renewal schemes, public-space design and review, signage and lighting management, street-furniture coordination, and planting design.
Road-network data were obtained from OpenStreetMap, and sampling points were generated at 100 m intervals along the road network. Based on the coordinates of these points, panoramic street-view images captured in the winter of 2022 were collected from Baidu Maps. A total of 34,622 sampling locations were obtained. To reduce redundancy between views along the road direction, only the left- and right-facing images were retained from each panorama, resulting in 69,244 directional images with a resolution of 512 × 512 pixels. The images were subsequently processed using the PSShadowHighlight function in Python 3.10 to reduce uneven illumination caused by shadows and highlights.
The data were organized at three analytical levels. The 69,244 directional-image observations were used for the primary OLS and nonlinear regression analyses. Measurements from the left- and right-facing images at each sampling location were averaged to generate 34,622 sampling-location records, which were used for principal component analysis, the sampling-location-level sensitivity analysis, and residual spatial autocorrelation diagnostics. For spatial visualization, the sampling-location values were further aggregated into 250 m × 250 m grid cells by calculating the mean value of all valid sampling locations within each cell.
2.2. Measurement of Streetscape Visual Clutter and Estimation of Urban Perception Scores
2.2.1. Measurement of Streetscape Visual Clutter
Streetscape visual clutter was measured from four complementary dimensions: edge, color, semantic, and depth clutter (
Table 1). These dimensions represent different forms of visual variation within streetscape images, including structural contours and textures, transitions among dominant colors, fragmentation among semantic object categories, and changes between relative spatial-depth layers.
Edge clutter was used to characterize the density of lines, object contours, textures, and spatial boundaries within the streetscape. Each directional street-view image was first converted to grayscale, after which Canny edge detection was applied using lower and upper thresholds of 0.11 × 255 and 0.27 × 255, respectively. The resulting binary map represented structural changes generated by elements such as building facades, road edges, vegetation, signs, windows, and street facilities.
Color clutter was used to describe the frequency and spatial distribution of transitions among dominant colors. Each image was converted from the RGB color space to the HSV color space, which separates hue, saturation, and brightness information. K-means clustering was then applied with the number of clusters set to five to identify the dominant color categories within each image. Boundaries between adjacent color categories were subsequently extracted to generate a color-boundary map, with denser boundaries indicating more frequent local color changes.
Semantic clutter was used to represent the spatial fragmentation and interaction of different object categories within the streetscape. Semantic segmentation was performed using the publicly available OneFormer Swin-L model pretrained on the MS COCO Panoptic dataset [
25]. The pixel-level classes generated by the model were regrouped into streetscape-related categories, including roads, buildings, walls and fences, vegetation, sky, pedestrians, vehicles, and other visible elements. The detailed correspondence between the original model classes and the regrouped categories is provided in
Supplementary Table S1. Boundaries between adjacent semantic categories were then extracted to produce semantic-boundary maps. A higher density of such boundaries indicates more frequent alternation and greater fragmentation among different streetscape elements.
Depth clutter was used to characterize the frequency of transitions among relative depth layers and variations in foreground–background organization. Monocular relative-depth maps were generated using the publicly available DPT-Hybrid model [
26,
27]. The predicted depth values were normalized to the range of 0–255 and divided into four relative depth layers using K-means clustering. Boundaries between adjacent depth layers were then extracted to produce depth-boundary maps. The resulting indicator represents an image-based measure of relative depth transitions rather than a direct measurement of physical enclosure or occlusion.
After the four feature maps had been obtained, they were processed using a consistent procedure. Each map was converted into a binary boundary map and smoothed using a Gaussian kernel of 31 × 31 pixels with a standard deviation of 7. Gaussian smoothing was used to represent the local concentration of visual changes and to reduce isolated pixel-level responses. The mean value of each smoothed map was then calculated as the corresponding image-level clutter score. Higher values indicate a greater overall density of structural, color, semantic, or depth-related boundaries in the streetscape image.
This treatment is conceptually consistent with the spatial characteristics of human vision, in which visual resolution is highest in central vision and gradually decreases toward the periphery. Visual clutter was therefore interpreted as the aggregation of visual changes within a local neighborhood rather than merely as a count of isolated boundary pixels. Because the normalized Gaussian kernel largely preserved the global mean, smoothing did not materially alter the relative scores among images but improved the representation and visualization of clutter patterns.
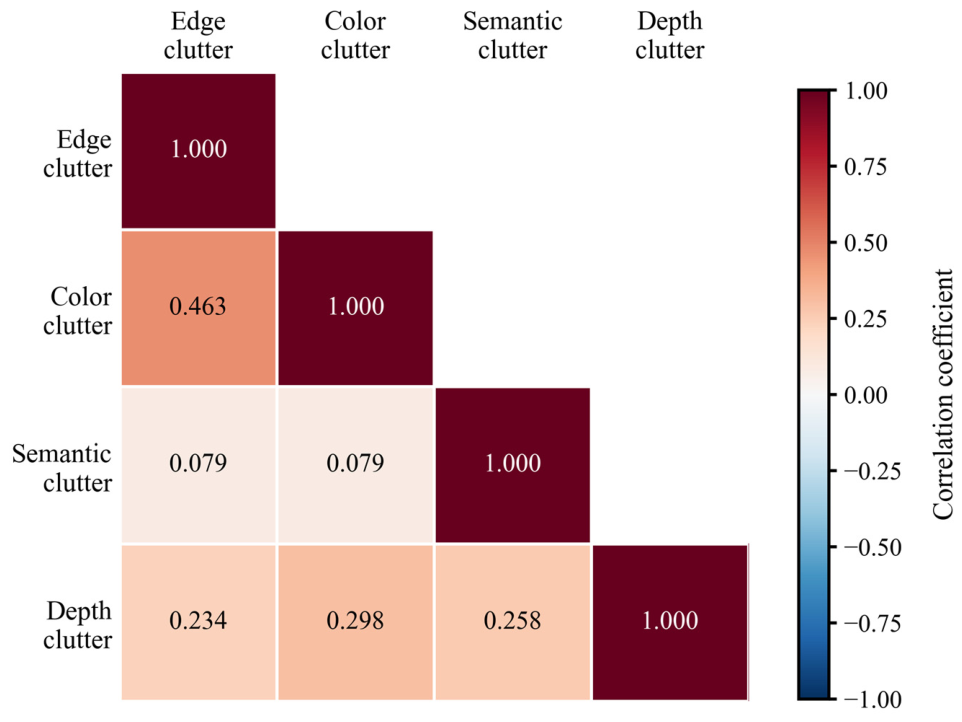
To assess the degree of overlap among the four clutter indicators, pairwise Pearson correlations were calculated using the 69,244 directional-image observations. The resulting correlation matrix was used to determine whether the indicators were highly redundant or captured related but distinct dimensions of streetscape visual clutter.
2.2.2. Estimation of Urban Perception Scores
Place Pulse-based computational perception modeling has become a well-established approach in large-scale urban research, enabling consistent estimation of subjective streetscape attributes from extensive street-view image collections. Models trained on Place Pulse 2.0 have been applied across multiple urban contexts and spatial scales [
2,
9,
11].
Six urban perception dimensions were estimated using pretrained models developed from the Place Pulse 2.0 dataset. Place Pulse 2.0 contains more than 1.1 million pairwise comparisons of urban images and records public evaluations across six perceptual dimensions: beauty, wealth, liveliness, safety, boredom, and depressiveness [
2,
9]. These pairwise comparisons provide the training basis for extending subjective urban perception assessment to large-scale street-view imagery.
This study used the publicly available human-perception-place-pulse models released by Ouyang, which have also been applied in the Global Streetscapes project to extract human-perception attributes from street-view images [
28]. The models use ViT-B/16 as the backbone and consist of six independent classifiers corresponding to beauty, wealth, liveliness, safety, boredom, and depressiveness. Each directional street-view image was independently processed by the six models, and the predicted probability of the positive class was used to represent the intensity of the corresponding perception. To facilitate interpretation and comparison, the positive-class probability was multiplied by 10 to obtain a perception score ranging from 0 to 10. According to the validation results reported by the model developer, the classification accuracies were 76.9% for beauty, 72.9% for wealth, 77.1% for liveliness, 76.7% for safety, 61.6% for boredom, and 67.2% for depressiveness.
2.3. Statistical Analysis
2.3.1. Construction of the Composite Streetscape Visual Clutter Index
Principal component analysis (PCA) was conducted using the four standardized clutter indicators at the sampling-location level. The first principal component was retained to construct the composite streetscape visual clutter index. This index was used to characterize and visualize the overall spatial distribution of visual clutter across the study area. The PCA diagnostics, eigenvalues, explained variance, and other detailed results are provided in the
Supplementary Materials. The composite index was not included in the subsequent regression analyses; instead, edge, color, semantic, and depth clutter were retained as separate explanatory variables to identify their dimension-specific associations with urban perceptions.
2.3.2. Linear Association Analysis
Ordinary least squares (OLS) regression was used to examine the linear associations between streetscape visual clutter and the six model-estimated urban perception scores. Separate models were estimated for beauty, wealth, liveliness, safety, boredom, and depressiveness. In each model, edge, color, semantic, and depth clutter were included simultaneously as the main explanatory variables. The proportions of vegetation, buildings, roads, walls, vehicles, and pedestrians, derived from the semantic segmentation results, were included as built-environment control variables.
These controls were included because visible physical elements may independently influence how streetscapes are perceived. Roads, vehicles, and pedestrian presence can indicate accessibility, mobility, and street activity and may therefore contribute to perceived liveliness. Vegetation is commonly associated with naturalness and environmental quality and can enhance perceptions such as beauty and wealth. By contrast, walls may interrupt visual continuity, reduce openness, and negatively affect safety and other environmental evaluations. Building proportion can also reflect development intensity, spatial enclosure, and the continuity of street frontages. Controlling for these elements allowed the associations of visual clutter with urban perceptions to be estimated beyond the effects of streetscape composition itself [
9,
11,
29].
The regression model was specified as follows:
where (
) denotes the score of observation (
) for a specific urban perception dimension. (
), (
), (
), and (
) represent edge, color, semantic, and depth clutter, respectively. (
) denotes the control variables, including vegetation, roads, walls, buildings, vehicles, and pedestrians. (
) is the intercept; (
) to (
) are the regression coefficients of the four core independent variables; (
) denotes the coefficient of control variable (
); and (
) is the random error term. Separate regression models were estimated for each of the six dependent variables.
Before model estimation, infinite values were treated as missing, and observations with missing values in any model variable were excluded. Variables were transformed where necessary to reduce distributional skewness and were subsequently standardized using Z-scores, allowing the magnitudes of the regression coefficients to be compared across indicators. HC3 heteroskedasticity-consistent standard errors were used for statistical inference. Multicollinearity was assessed using the variance inflation factor (VIF), and all statistical tests were two-sided, with
regarded as statistically significant. The detailed VIF results are provided in
Supplementary Table S2.
To assess the robustness of the primary OLS results and diagnose potential spatial dependence, two complementary analyses were conducted at the sampling-location level. First, the four clutter indicators, six model-estimated urban perception scores, and six built-environment control variables derived from the left- and right-facing images were averaged within each of the 34,622 sampling locations. The OLS models were then re-estimated using the same variable transformations, standardization procedures, control variables, and HC3 heteroskedasticity-robust standard errors as in the primary analysis. Second, residual spatial autocorrelation was assessed for the six clutter-only and six controlled models using Global Moran’s
. A row-standardized eight-nearest-neighbor spatial weights matrix (
) was constructed for all 34,622 sampling locations. The mean distance to the eight nearest neighbors was 272.45 m, and statistical significance was assessed using 499 permutations. Detailed results are provided in
Supplementary Tables S3 and S4.
2.3.3. Nonlinear Association Analysis
In addition to the OLS models, nonlinear analyses were conducted to determine whether the associations between visual clutter and urban perceptions changed across different levels of clutter. The analyses covered all 24 combinations of the four clutter indicators and six perception dimensions. The same directional-image dataset and built-environment controls used in the linear models were retained to maintain comparability between the linear and nonlinear results.
Three complementary methods were applied. First, locally weighted scatterplot smoothing (LOWESS) was used to examine the overall functional form of each relationship without imposing a predetermined curve. Second, segmented regression was used to estimate a potential breakpoint and the slopes below and above that breakpoint. Third, quadratic regression was used to test whether the relationship showed statistically significant curvature and to determine the direction of the quadratic term. Applying the three methods jointly reduced the risk of classifying a relationship as nonlinear on the basis of a single model or statistical test.
To account for multiple testing across the 24 relationships, statistical significance was adjusted using the false discovery rate (FDR). A relationship was classified as a stable inverted U-shape only when LOWESS indicated an initial increase followed by a decrease, segmented regression identified the same directional change around a statistically supported breakpoint, the quadratic term was significantly negative after FDR correction, and the overall pattern remained stable in the sensitivity analyses. Detailed model specifications, breakpoint estimation procedures, and sensitivity tests are reported in the
Supplementary Materials.
3. Results
3.1. Streetscape Visual Clutter Features in Shanghai
Using the street-view imagery, we derived four dimensions of streetscape visual clutter across Shanghai: edge, color, semantic, and depth clutter. A composite clutter indicator was also constructed from the first principal component of the PCA.
Pairwise Pearson correlations were examined to assess the degree of overlap among the four dimension-specific indicators. As shown in
Figure 2, the correlation coefficients ranged from 0.079 to 0.463. The strongest correlation was observed between color clutter and edge clutter (
), whereas semantic clutter showed only weak correlations with color clutter and edge clutter (both
). The correlations between depth clutter and the other three indicators ranged from 0.234 to 0.298. Overall, no pair of indicators showed a high correlation, indicating that the four measures were related but not highly redundant and captured distinct dimensions of streetscape visual clutter.
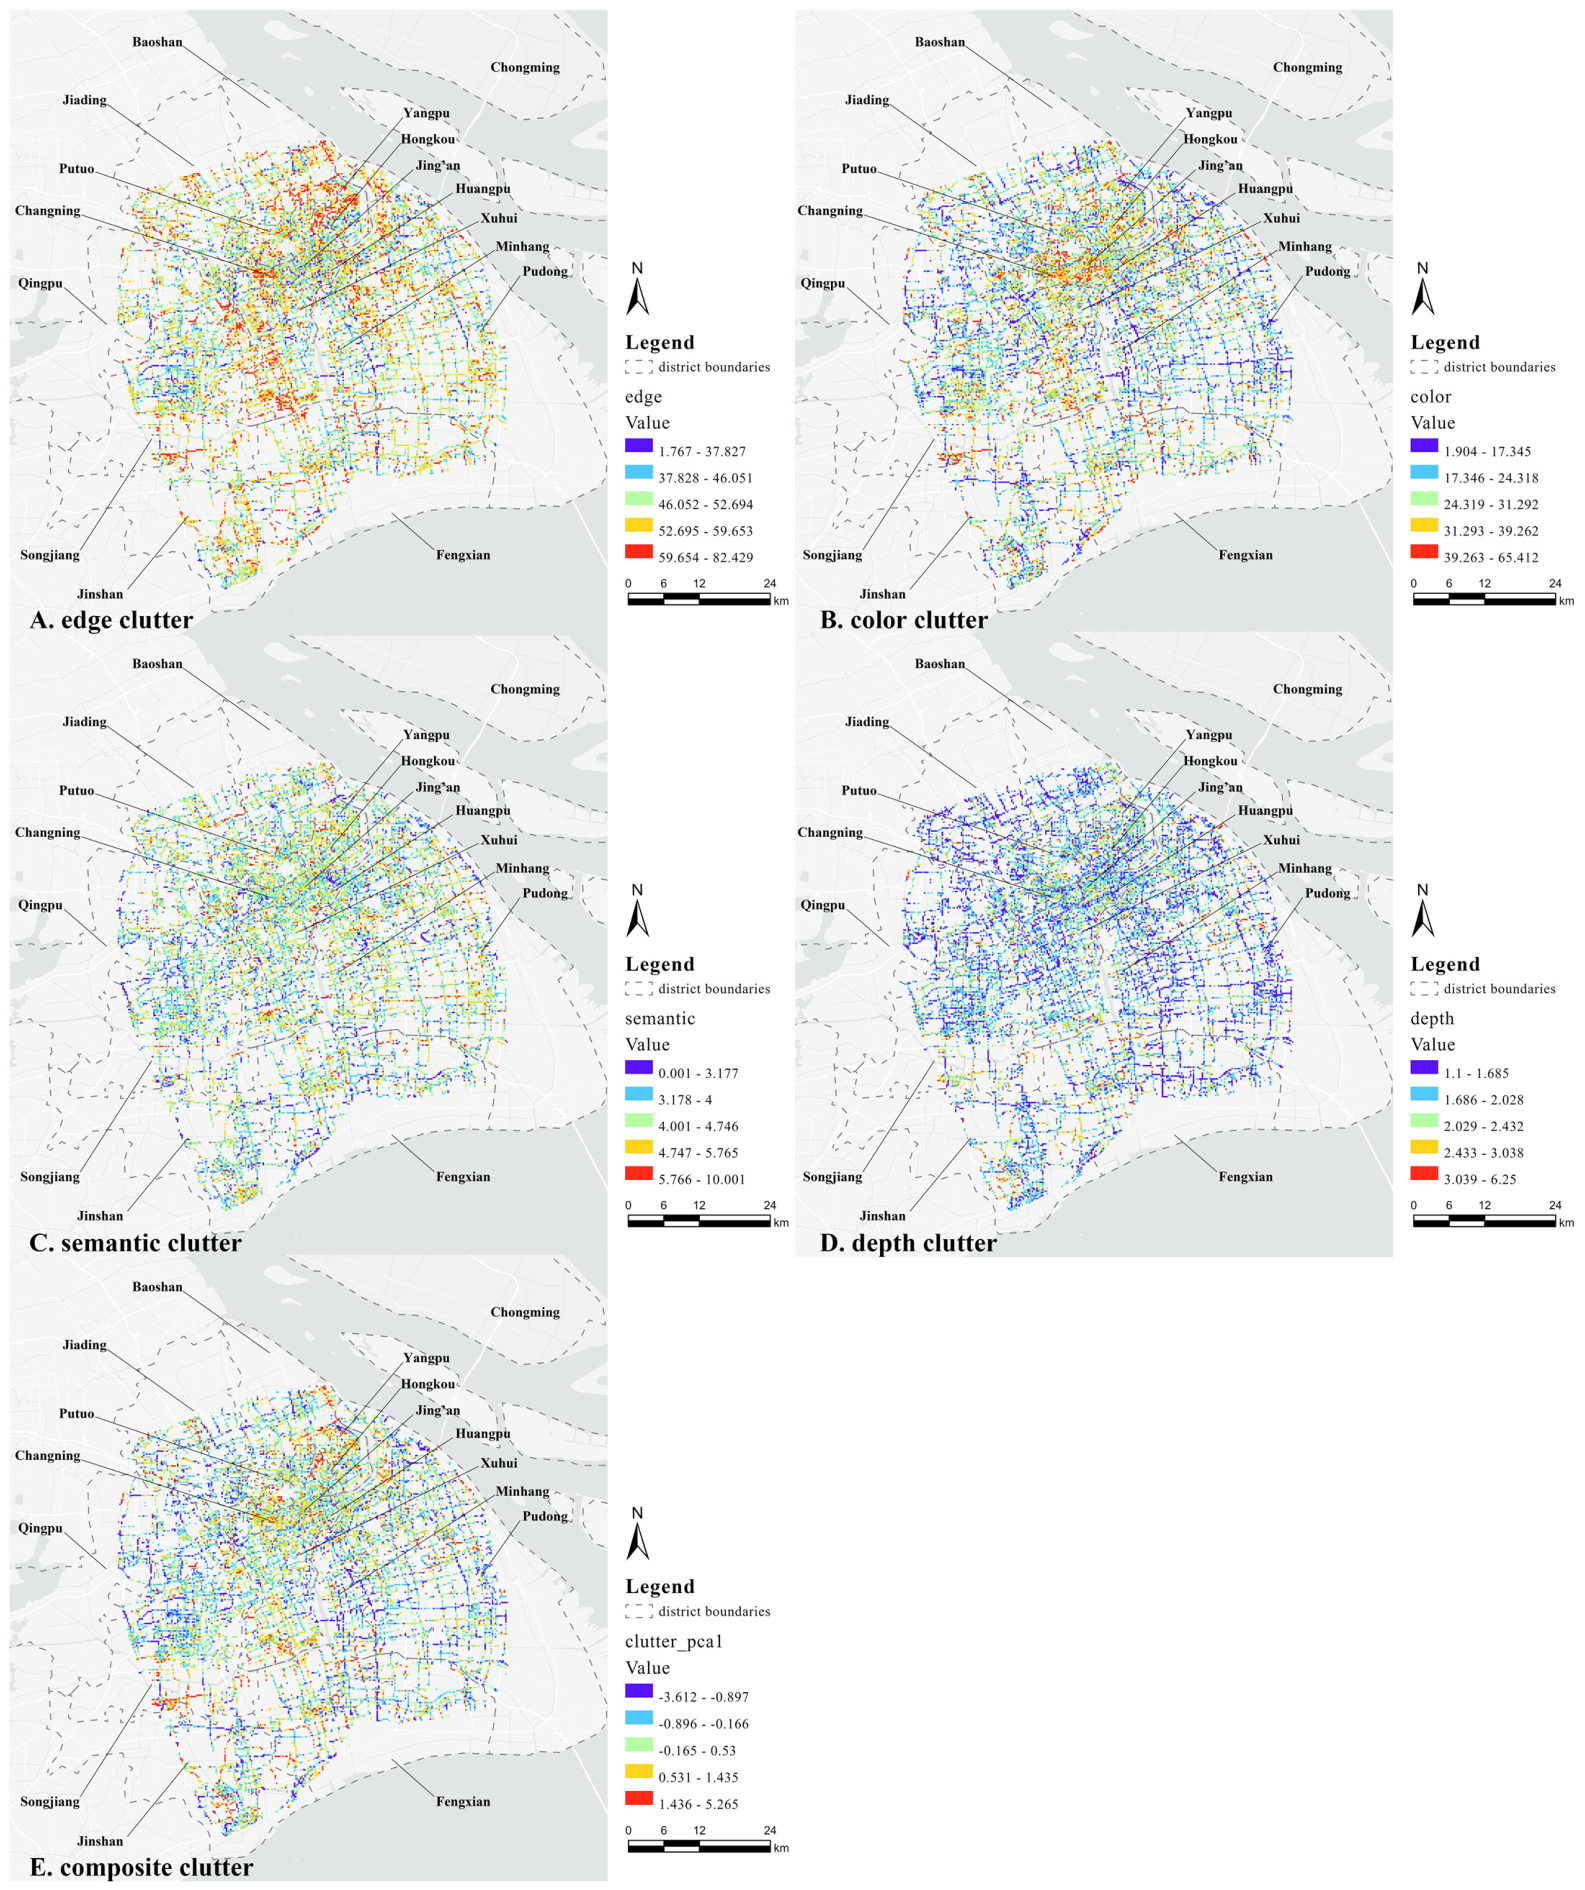
To further examine their spatial patterns, the point-level clutter values were mapped onto Shanghai’s street network and aggregated into 250 m × 250 m grid cells. The resulting values were classified using the Jenks natural breaks method. This method determines class boundaries based on clusters inherent in the data, allowing the spatial variation in each clutter indicator to be displayed more clearly.
Figure 3 presents the spatial distributions of the streetscape visual clutter indicators at the 250 m grid-cell level. The grid-cell values were classified using the Jenks natural breaks method for visualization.
Edge clutter exhibits a clear concentration in central Shanghai. High-value areas are distributed across Huangpu, Jing’an, Hongkou, Yangpu, Putuo, Changning, and Xuhui, forming a relatively dense pattern within the central street network. Outside the urban core, localized high-value clusters are also present around built-up nodes in Minhang, Songjiang, Jiading, northern Jinshan, and Pudong. Some elevated values extend along selected road corridors, particularly in the southwestern and southern parts of the study area. Lower values are more common in western Qingpu and parts of eastern and southern Pudong.
Color clutter shows a broadly similar center–periphery pattern but has a more continuous high-value concentration in the urban core. Elevated values extend across the central districts, while peripheral high-value areas are generally smaller and more fragmented. These localized clusters occur mainly around Minhang, Songjiang, northern Jinshan, Fengxian, and parts of Pudong. By contrast, lower values are more widely distributed in Qingpu, peripheral Jiading, and eastern Pudong. Compared with edge clutter, color clutter displays a clearer contrast between the continuous central cluster and the discontinuous peripheral distribution.
Semantic clutter is also relatively high in central Shanghai, although its high-value distribution extends more widely beyond the urban core than that of color clutter. In addition to the central districts, elevated values occur around peripheral built-up nodes, major road intersections, and town centers across Shanghai, particularly in Minhang, Songjiang, Jinshan, Fengxian, and Pudong. Outside these areas, high values generally appear as scattered clusters or short linear segments rather than continuous zones. Lower values are concentrated mainly in western Qingpu, eastern Pudong, and the peripheral parts of Jiading and Fengxian.
Depth clutter exhibits a markedly different spatial pattern. High-value cells are relatively sparse and widely dispersed, with no extensive continuous concentration in the central city. Most central and peripheral roads are dominated by low or medium–low values, while localized high-value segments are scattered across Huangpu, Jing’an, Yangpu, Minhang, Songjiang, Jinshan, Fengxian, and Pudong. Compared with edge, color, and semantic clutter, depth clutter shows weaker central concentration and a more fragmented distribution across both central and peripheral areas.
Composite streetscape visual clutter is generally higher in the urban core, where high and medium-high values form an interconnected pattern across the street network. Outside the central area, elevated values occur around several peripheral built-up nodes and selected road corridors in Baoshan, Minhang, Songjiang, Jinshan, Fengxian, and Pudong. Lower values are more common in western Qingpu, peripheral Jiading, eastern and southern Pudong, and parts of the southern urban fringe. Overall, the composite index shows a spatial pattern characterized by central concentration, localized peripheral clustering, and corridor-like extensions rather than a simple continuous decline from the urban center to the periphery. Edge, color, and semantic clutter share this general pattern but differ in spatial continuity and extent, whereas depth clutter remains substantially more dispersed and fragmented.
3.2. Model-Estimated Urban Perceptions in Shanghai
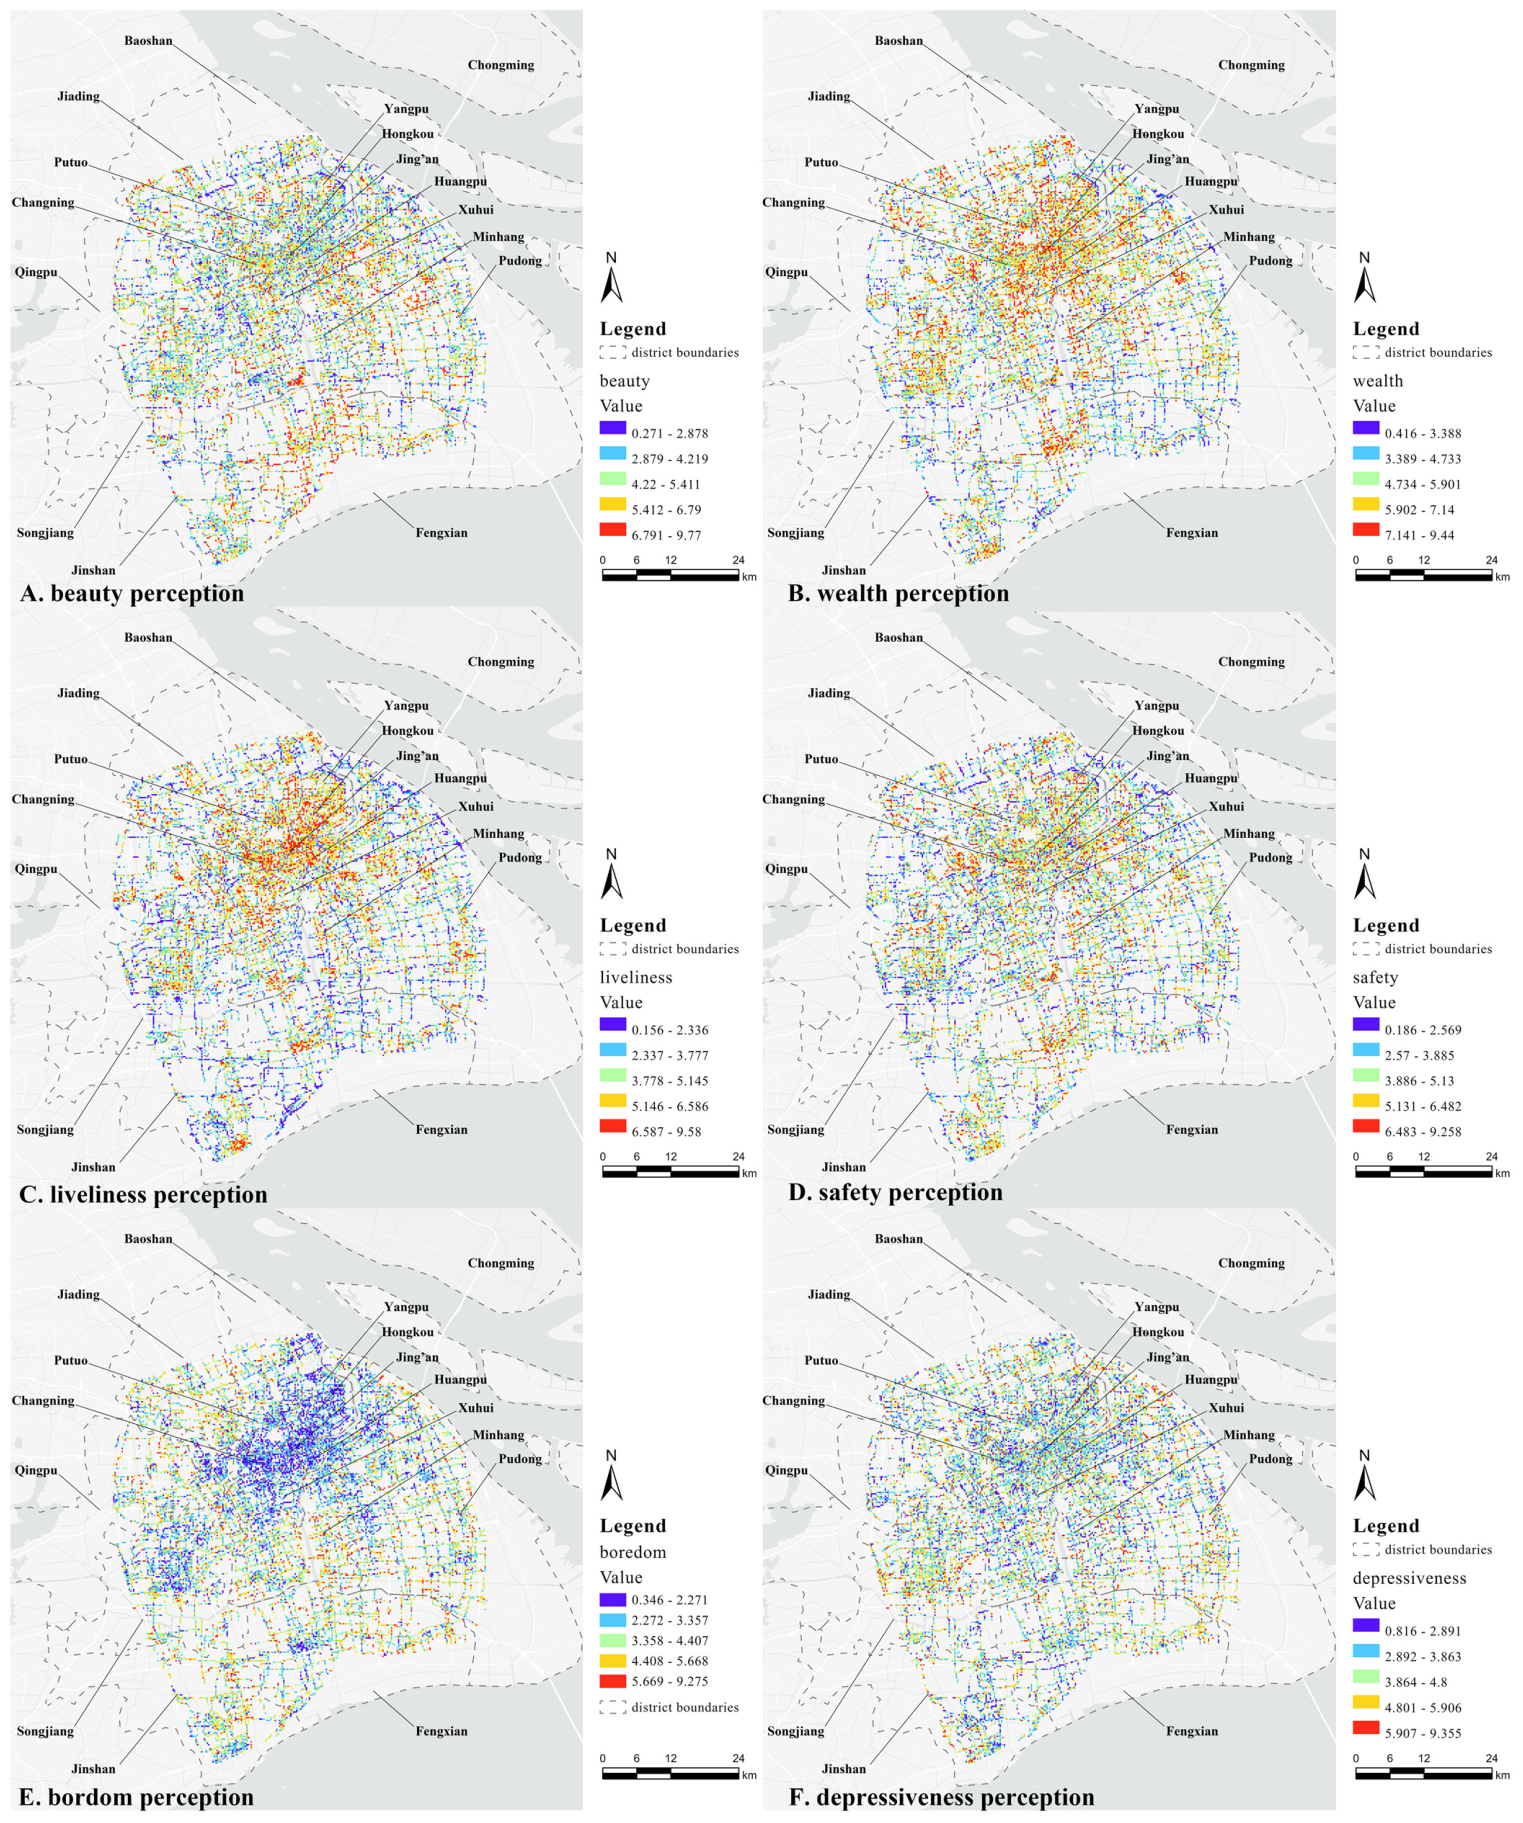
This study further mapped six model-estimated urban perception scores across Shanghai’s street network: beauty, wealth, liveliness, safety, boredom, and depressiveness.
Figure 4 presents the spatial distributions of these perception scores. All six dimensions show clear spatial variation across the city.
Figure 4 presents the spatial distributions of the six model-estimated urban perception dimensions across Shanghai. The grid-cell values were classified using the Jenks natural breaks method for visualization.
Beauty scores are generally higher in central Shanghai, with additional high-value clusters around several peripheral built-up nodes and selected road corridors in Minhang, Songjiang, Jinshan, Fengxian, and Pudong. Lower values are more common in western Qingpu, eastern and southern Pudong, and parts of the southern urban fringe.
Wealth shows a strong and relatively continuous high-value concentration across the central urban area. Smaller high-value clusters also occur around peripheral nodes in Minhang, Songjiang, Baoshan, Jiading, Fengxian, and Pudong, whereas lower values are concentrated mainly in western Qingpu, eastern Pudong, and southern Fengxian.
Liveliness exhibits a spatial pattern broadly similar to that of wealth, with a clear central concentration and smaller, more fragmented high-value clusters in peripheral areas. Among the positive perception dimensions, wealth and liveliness show the strongest center–periphery contrast.
Safety is also generally higher in central Shanghai, but its high-value distribution is less continuous than those of wealth and liveliness. Elevated values occur in both the urban core and several peripheral nodes, while lower values are more widely distributed in Qingpu, peripheral Jiading, eastern Pudong, and southern Fengxian.
Boredom displays a broadly inverse pattern, with lower values concentrated in the central districts and higher values distributed across much of the urban periphery. Some high-value areas also extend along road corridors and around peripheral built-up nodes.
Depressiveness shows a similar center–periphery contrast, but its high-value areas are more fragmented and dispersed than those of boredom. Overall, positive perceptions are generally higher in the urban core, whereas boredom and depressiveness tend to be higher toward the periphery. Wealth and liveliness form the most continuous central clusters, while beauty and safety show more dispersed peripheral high-value nodes.
3.3. The Relationship Between Streetscape Clutter Features and Urban Perceptions
3.3.1. Linear Relationships
To examine the relationships between different types of streetscape visual clutter and model-estimated urban perception scores, this study estimated the associations of edge, color, semantic, and depth clutter with six perception dimensions: beauty, wealth, liveliness, safety, boredom, and depressiveness. The models controlled for built-environment characteristics, including vegetation, buildings, roads, walls, pedestrians, and vehicles.
Table 2 presents the OLS regression results for the associations between the four streetscape visual clutter indicators and the six urban perception dimensions. Background shading indicates the direction and statistical significance of the associations: red represents a significant positive association, blue represents a significant negative association, and gray indicates a nonsignificant association.
Overall, the streetscape visual clutter indicators were significantly associated with most urban perception dimensions. Among the 24 associations between the four clutter indicators and the six perception dimensions, 23 reached statistical significance. The only nonsignificant result was the association between depth clutter and perceived safety. These findings indicate that streetscape visual clutter is not a uniformly negative visual characteristic. Instead, different forms of clutter show distinct directions and strengths of association with urban perceptions.
Edge and color clutter showed broadly consistent associations with the six urban perception dimensions. Edge clutter was positively associated with beauty, liveliness, safety, and wealth, with t-values of 31.465, 30.918, 26.424, and 17.292, respectively. It was negatively associated with boredom and depressiveness, with t-values of −2.014 and −7.053.
Color clutter showed a similar pattern. It was positively associated with beauty, liveliness, safety, and wealth, with t-values of 24.565, 16.479, 13.985, and 14.155, respectively. It was negatively associated with boredom and depressiveness, with t-values of −14.683 and −3.783.
Semantic clutter showed a more differentiated pattern of association. It was positively associated with liveliness, safety, and wealth, with t-values of 31.788, 10.042, and 38.506, respectively. It was negatively associated with boredom and depressiveness, with t-values of −23.165 and −14.044. However, semantic clutter was also negatively associated with beauty ().
Depth clutter displayed a pattern distinct from those of the other three clutter indicators. It was negatively associated with beauty, liveliness, and wealth, with t-values of −15.165, −6.214, and −20.181, respectively. By contrast, it was positively associated with boredom and depressiveness, with t-values of 7.464 and 10.946. Its association with safety was not statistically significant ().
A comparison of the absolute t-values further identifies the clutter indicator most strongly associated with each perception dimension. Edge clutter had the largest absolute t-values for beauty and safety, reaching 31.465 and 26.424, respectively. Semantic clutter had the largest absolute t-values for boredom, depressiveness, liveliness, and wealth, at −23.165, −14.044, 31.788, and 38.506, respectively. These results indicate that edge clutter is more strongly associated with evaluations of beauty and safety, whereas semantic clutter is more strongly associated with boredom, depressiveness, liveliness, and wealth.
The sampling-location-level estimates were broadly consistent with those from the primary directional-image-level models. The directions of all 24 associations between the four clutter indicators and six urban perception dimensions remained unchanged, and 23 of the 24 associations were statistically significant at
. Relative to the primary models, the weak negative association between edge clutter and boredom was no longer statistically significant (
, 95% CI [−0.019, 0.004]), whereas the positive association between depth clutter and safety became statistically significant (
, 95% CI [0.008, 0.028]). All other associations retained their significance status. Overall, the main linear patterns were robust to aggregation at the sampling-location level (
Supplementary Table S3).
Residual spatial autocorrelation diagnostics showed that all 12 sets of model residuals exhibited significant positive spatial autocorrelation (two-sided permutation
). Among the controlled models, Moran’s
ranged from 0.110 for depressiveness to 0.211 for wealth and was lower than that of the corresponding clutter-only model for all six perception dimensions. These results indicate that the built-environment controls reduced but did not eliminate residual spatial dependence. Therefore, although the sampling-location-level analysis supported the stability of the main coefficient patterns, statistical inference from the OLS models should be interpreted cautiously because residual spatial dependence remained (
Supplementary Table S4).
Regarding model fit, explanatory power varied across perception dimensions. After built-environment controls were included, adjusted
increased for all six models, ranging from 0.074 for depressiveness to 0.351 for liveliness. Although the models explained only part of the variation in urban perceptions, particularly for depressiveness and boredom, the broadly consistent directions and statistical support of the clutter coefficients indicate that streetscape visual clutter remained systematically associated with urban perceptions. These results therefore suggest stable associations, while the explanatory contribution varied across perception dimensions (
Supplementary Table S5).
3.3.2. Nonlinear Relationships
As shown in
Table 3, four of the 24 relationships met all criteria for a strict inverted U-shape: edge clutter–boredom, color clutter–depressiveness, depth clutter–wealth, and semantic clutter–wealth. For all four relationships, the slopes on both sides of the breakpoint, the hinge term in the segmented regression, and the quadratic term remained statistically significant after FDR correction (all adjusted
). The patterns identified by LOWESS and segmented regression also remained stable across the different sample ranges examined in the sensitivity analyses.
A significant inverted U-shaped relationship was identified between edge clutter and boredom. The segmented regression estimated a breakpoint of 0.486. The slope below the breakpoint was significantly positive (), adjusted ()), whereas the slope above the breakpoint was significantly negative (, adjusted ). The hinge term also remained significant after FDR correction (adjusted ). Consistent with these results, the coefficient of the quadratic term was significantly negative (( adjusted ). Thus, boredom initially increased with edge clutter but began to decrease after edge clutter exceeded the estimated breakpoint.
Color clutter showed a significant inverted U-shaped relationship with depressiveness. The segmented regression estimated a breakpoint of −0.264. The slope below the breakpoint was significantly positive , whereas the slope above the breakpoint was significantly negative . The hinge term remained significant after FDR correction (). The quadratic term was also significantly negative . Thus, depressiveness increased with color clutter below the breakpoint and decreased once color clutter exceeded the breakpoint.
Depth clutter also showed a significant inverted U-shaped relationship with wealth. The estimated breakpoint was −0.558. The slope below the breakpoint was significantly positive , whereas the slope above the breakpoint was significantly negative . The hinge term remained significant after FDR correction (), and the quadratic term was significantly negative . Wealth therefore increased with depth clutter below the breakpoint but declined after the breakpoint was exceeded.
A significant inverted U-shaped relationship was likewise identified between semantic clutter and wealth. The segmented regression estimated a breakpoint of 1.165. The slope below the breakpoint was significantly positive , whereas the slope above the breakpoint was significantly negative . The hinge term remained significant after FDR correction (), and the quadratic term was significantly negative . Among the four strict inverted U-shaped relationships, the semantic clutter–wealth relationship showed relatively large absolute slopes on both sides of the breakpoint.
The remaining 20 relationships between visual clutter and urban perception did not satisfy all criteria for a strict inverted U-shape. Although some relationships showed statistically significant hinge terms in the segmented regressions or significant quadratic terms, the LOWESS curve, the directions and significance of the slopes on either side of the breakpoint, the sign of the quadratic term, or the sensitivity-analysis results were not fully consistent. These relationships were therefore not classified as stable inverted U-shaped relationships.
4. Discussion
This study measured streetscape visual clutter across four dimensions—edge, color, semantic, and depth clutter—and examined their associations with six model-estimated urban perception scores. After controlling for built-environment characteristics, including vegetation, buildings, roads, walls, vehicles, and pedestrians, the four clutter dimensions remained associated with most perception outcomes. However, both the directions and magnitudes of these associations varied across clutter types and perception dimensions. The variation in explanatory power across perception dimensions further suggests that visual clutter represents one explanatory factor rather than a comprehensive account of perceptual variation. Streetscape visual clutter should therefore not be treated as a single or inherently negative environmental attribute. Its perceptual implications depend on the type of visual information involved and how that information is organized within the streetscape.
Methodologically, this study decomposed streetscape visual clutter into four distinct dimensions rather than representing it with a single overall measure. Compared with aggregate indicators such as image entropy, fractal dimension, the Shannon diversity index, or composite complexity scores, this framework provides greater insight into the specific sources of visual variation. The low-to-moderate correlations among the four indicators, together with their distinct spatial distributions and differentiated associations with urban perceptions, suggest that they capture related but non-redundant aspects of streetscape visual clutter. By distinguishing variations in structural boundaries, color composition, semantic elements, and relative depth transitions, the proposed framework improves the interpretability of streetscape visual measurement. It also provides a basis for linking visual clutter to specific planning and design elements, including building interfaces, urban color, visible functional elements, and foreground–background organization.
At the city scale, the spatial distributions of the perception scores further show that the implications of visual clutter depend on both the broader urban context and the specific type of street space. The continuous concentrations of model-estimated wealth and liveliness in central Shanghai may be related to active ground-floor frontages, commercial and service functions, pedestrian activity, architectural articulation, and dense but recognizable visual cues. By contrast, higher boredom and depressiveness in many peripheral areas may be associated with inactive or discontinuous street interfaces, fewer visible activities and facilities, and fragmented foreground–background relationships. These spatial differences indicate that the perceptual implications of visual clutter vary across urban contexts and street-space types.
Accordingly, the associations between streetscape visual clutter and model-estimated urban perceptions require dimension-specific interpretation. Edge and color clutter were generally positively associated with beauty, liveliness, safety, and wealth, and negatively associated with the two negative perception dimensions. Although both indicators capture changes in visual boundaries, they also reflect aspects of visual richness, such as architectural detail, vegetation contours, material variation, and color contrast. Their positive associations may therefore reflect the contribution of environmental detail and visual stimulation to lower perceived monotony and greater streetscape legibility and attractiveness [
30,
31,
32].
Semantic clutter showed a more differentiated pattern across perception dimensions. It was positively associated with liveliness, wealth, and safety, but negatively associated with beauty. Diverse building frontages, commercial facilities, pedestrians, and vehicles can convey functional diversity, social activity, and economic vitality, thereby strengthening perceptions of liveliness and wealth [
33,
34]. However, the frequent intermingling of different object categories may also disrupt compositional coherence and the continuity of street interfaces, reducing aesthetic harmony. This finding suggests that the same type of visual information may support functional evaluations while weakening aesthetic evaluations.
Depth clutter displayed a markedly different pattern from the other three indicators. It was negatively associated with beauty, liveliness, and wealth, and positively associated with boredom and depressiveness. Higher depth clutter reflects more frequent changes in relative depth structure and stronger variation in foreground–background organization, which may make spatial boundaries, road orientation, and relative depth relationships more difficult to interpret quickly. Research in visual psychology has shown that cluttered scenes can slow visual search, increase cognitive demands, and impair object recognition and situational awareness [
17,
35,
36,
37]. Depth clutter may therefore correspond more closely than edge, color, or semantic clutter to the concepts of information competition and cognitive load in visual psychology.
The nonlinear analyses identified stable inverted U-shaped patterns in only four of the 24 clutter–perception relationships. These patterns should therefore be regarded as relationship-specific supplementary findings rather than evidence of a universal nonlinear pattern or a generally optimal intermediate level of visual clutter.
Both depth and semantic clutter showed inverted U-shaped relationships with perceived wealth. At relatively low levels, limited variation in relative depth structure and semantic composition may correspond to insufficient visible facilities, low functional diversity, or weak street activity. As spatial layering, visible facilities, and semantic diversity increase, streetscapes may convey stronger cues of functional diversity, developed infrastructure, and economic activity, thereby strengthening model-estimated wealth scores. Beyond a certain level, however, greater occlusion, object intermingling, and frequent interface transitions may cause visual richness to be perceived as spatial congestion, visual disorder, or declining environmental quality, which may weaken perceived wealth.
Inverted U-shaped relationships were also found between edge clutter and boredom and between color clutter and depressiveness. When edge or color clutter increases from a low to a moderate level, the additional visual information may consist of scattered, discontinuous, or weakly organized local variations. Such changes may increase perceptions of fragmentation, boredom, or depressiveness. At higher levels, however, increased edge and color information may reflect richer architectural details, vegetation, commercial frontages, and street activity. These elements may provide stronger place cues and visual stimulation, thereby reducing negative perceptions.
5. Limitations
This study has several limitations. First, the cross-sectional research design identifies statistical associations rather than causal effects. The mechanisms proposed in the Discussion should therefore be interpreted as plausible explanations of the observed patterns rather than as confirmed causal processes.
Second, the six perception scores were estimated using pretrained Place Pulse-based models rather than obtained directly from surveys of Shanghai residents. Although this approach enables city-scale assessment, the resulting scores may not fully capture locally specific cultural, demographic, and contextual differences in environmental evaluation. Moreover, the clutter indicators, semantic control variables, and perception scores were all derived from the same street-view images using computer vision or deep learning procedures. This shared image source and partial algorithmic coupling may introduce correlated measurement errors or amplify visual characteristics that are simultaneously salient to multiple models.
Third, the primary regression analyses used 69,244 directional images, including paired left- and right-facing views from 34,622 sampling locations distributed at 100 m intervals along the road network. Although the sampling-location-level sensitivity analysis reduced the dependence arising from paired views at the same location, the Global Moran’s I diagnostics indicated significant positive residual spatial autocorrelation in all six controlled models. The inclusion of built-environment controls reduced but did not eliminate this spatial dependence, suggesting that neighboring sampling locations may share unobserved spatial characteristics not fully captured by the current explanatory variables. Consequently, the statistical significance of the OLS estimates should be interpreted with caution.
Finally, depth clutter should be interpreted with caution. As operationalized in this study, it represents image-based variations in relative depth structure and foreground–background organization rather than a direct measurement of physical occlusion, spatial enclosure, or three-dimensional spatial hierarchy. Its physical interpretation should therefore remain limited to relative depth transitions observed in street-view images.
6. Conclusions
Using street-view imagery from Shanghai, this study developed a multidimensional framework for measuring streetscape visual clutter through four indicators: edge, color, semantic, and depth clutter. The framework distinguishes different sources of visual variation rather than relying solely on a single aggregate measure and was used to examine associations with six model-estimated urban perception scores: beauty, wealth, liveliness, safety, boredom, and depressiveness.
The results revealed differentiated associations across clutter types and perception dimensions. Edge and color clutter were generally associated with more favorable perception scores, whereas semantic clutter showed contrasting associations across functional and aesthetic evaluations. Depth clutter exhibited a distinct pattern and was more frequently associated with less favorable perception scores. These findings indicate that streetscape visual clutter is neither a uniform nor inherently negative environmental attribute; its perceptual implications depend on the type and organization of visual information.
Stable inverted U-shaped patterns were identified in only four of the 24 clutter–perception relationships. These patterns should therefore be interpreted as relationship-specific supplementary findings rather than evidence of a universal nonlinear rule or a generally preferable intermediate level of visual clutter.
7. Practical Application and Future Research
To facilitate practical application, the four clutter dimensions can be translated into distinct planning and design considerations. High edge clutter may reflect either beneficial architectural articulation and vegetation contours or excessive accumulations of small projections, overlapping details, and fragmented street interfaces. Beneficial details may be retained, whereas unnecessary fragmentation can be reduced through clearer facade organization and the consolidation of minor visual elements. Color clutter should be managed by coordinating the hue, saturation, scale, and placement of facades, signs, lighting, and street facilities rather than by imposing visual uniformity. For semantic clutter, functional diversity and active street uses should be preserved, while signs, benches, waste bins, utility boxes, parked vehicles, and temporary facilities may be grouped, aligned, or incorporated into designated frontage and street-furniture zones. Depth clutter requires particular attention to foreground obstruction and spatial continuity. Decorative elements, signs, utilities, temporary installations, and dense planting should be kept outside pedestrian routes, major sightlines, intersections, crossings, and other visibility-critical locations.
These dimension-specific considerations can be applied differently across spatial settings. At intersections and road crossings, interventions may prioritize sightline continuity, crossing visibility, the consolidation of redundant signs, and the management of curbside parking and temporary installations. Along mixed-use and commercial streets, active frontages and functional diversity may be retained while signage, facade lighting, awnings, street furniture, and service facilities are organized within a clearer visual hierarchy. In peripheral town centers and road corridors with lower model-estimated wealth or liveliness scores, improvement should focus on continuous and well-maintained street interfaces, visible public and community facilities, active ground-floor uses, connected pedestrian spaces, vegetation, lighting, and coordinated material and color variation rather than further visual simplification. Citywide clutter and perception maps may support initial screening, followed by field audits and site-specific design review by planning, urban renewal, landscaping, transport, and district-level authorities. Because the present study identifies statistical associations rather than causal effects, the resulting recommendations should be regarded as evidence-informed planning priorities and tested through context-specific pilot interventions and before-and-after evaluations before wider implementation.
Future research should further test and refine these planning considerations. Multi-temporal street-view imagery, natural experiments, quasi-experimental designs, and before-and-after studies could be used to examine whether changes in specific clutter dimensions lead to corresponding changes in urban perceptions. Model-estimated perception scores should also be validated against ratings from local residents and supplemented with field surveys, behavioral observations, eye-tracking experiments, traffic-safety records, GIS data, and manually verified environmental indicators. Spatial econometric models, network-based spatial weights, spatially clustered standard errors, and grid-level analyses could be applied to address residual spatial dependence more directly. In addition, LiDAR, three-dimensional point clouds, stereo imagery, and independently measured urban-form indicators could help validate the physical meaning of depth clutter. Comparative studies across cities, seasons, and cultural contexts would further assess the generalizability of the proposed framework and identify where context-specific adaptation is required.