Article

Forest Transition and Its Ecological and Environmental Effects in Hainan, China

1
Key Laboratory of Earth Observation of Hainan Province, Hainan Aerospace Information Research Institute, Sanya 572029, China
2
Satellite Application Center for Ecology and Environment, Ministry of Ecology and Environment, Beijing 100094, China
3
Key Laboratory of Satellite Remote Sensing, Ministry of Ecology and Environment, Beijing 100094, China
4
Hubei Key Laboratory of Regional Ecology and Environmental Change, School of Geography and Information Engineering, China University of Geosciences, Wuhan 430074, China
5
College of Resources and Environment, Henan Agricultural University, Zhengzhou 450046, China
6
Aerospace Information Research Institute, Chinese Academy of Sciences, Beijing 100094, China
*
Author to whom correspondence should be addressed.
Land 2026, 15(7), 1307; https://doi.org/10.3390/land15071307
Submission received: 15 June 2026 / Revised: 10 July 2026 / Accepted: 15 July 2026 / Published: 21 July 2026

Abstract

Forest transition is a defining feature of global terrestrial ecosystem change. Systematically identifying and quantitatively assessing its eco-environmental effects provides a critical scientific foundation for regional ecological conservation and territorial spatial governance. Here, we take the terrestrial area of Hainan Island from 1988 to 2020 as the study area. We examine the spatiotemporal heterogeneity of the eco-environmental effects of forest transition and decompose the associated contributions. The principal findings are as follows: The ERI displays a persistent concentric pattern of low values in the interior and high values in the periphery. High-ESV areas largely coincide with the concentrated distribution of natural forests in the central and southern parts of the island. The per-unit-area ESV of natural forests is significantly higher than that of plantations. GTWR results demonstrate that forest quantity, structure and quality all exert stable inhibitory effects on ecological risk. The structural factor exhibits the strongest effect and the greatest temporal stability. This study provides a quantitative basis for the refined management and conservation of the Hainan Tropical Rainforest National Park and for province-wide ecological restoration planning, and also offers a framework for assessing the eco-environmental effects of forest transition in tropical regions.

1. Introduction

Forest ecosystems constitute one of the largest terrestrial ecosystems by area and perform critical environmental functions while providing a wide range of ecosystem services [1]. They encompass nearly all major categories of ecosystem services, including provisioning, supporting, regulating and cultural services [2], are essential to the Earth’s biosphere [3], and play a pivotal role in the human–natural system [4], forming the foundation for human survival and development. Consequently, research on the patterns of forest change and their eco-environmental effects has become an indispensable component of global change, natural resource and land system science.
Since the 1970s and 1980s, a reversal from deforestation to net forest increase has been observed in many countries [5,6,7,8,9,10]. This phenomenon, termed “forest transition” [11], has drawn increasing scholarly attention. Research on forest transition in Europe and North America emerged between the late 19th and early 20th centuries, driven primarily by farmland abandonment resulting from post-industrial urbanization and agricultural intensification; in these contexts, governments acted more as providers of institutional frameworks than as direct intervenors [12]. In contrast, forest transition in Asian countries generally occurred later, mostly after the 1980s, and was directly propelled by proactive public policies such as natural forest protection, the Grain for Green programme, and ecological compensation schemes [13]. This temporal lag and divergence in driving mechanisms imply that forest transition theories largely grounded in European and North American experiences need to be adapted by incorporating region-specific policy–economy–ecology coupling contexts when interpreting forest change in Asia, particularly in tropical China.
China, as one of the major contributors to forest expansion in Asia [14], entered the forest transition phase as early as the 1980s–1990s [15,16]. Hainan Province encompasses the largest island along China’s southern coast [17] and hosts the country’s most extensive contiguous tropical rainforest, which forms part of one of the world’s 34 biodiversity hotspots. Characterised by a tropical monsoon climate—with abundant water and heat resources coinciding in the same season—deep, fertile soils, a large island area, and a wide altitudinal range, Hainan exhibits complex forest vegetation types with pronounced vertical zonation and serves as a treasure trove of plant and animal resources [18]. Previous studies indicate that Hainan underwent forest transition during the 1980s–1990s [19,20,21,22]; however, research on the eco-environmental effects of this transition remains lacking. Given the island’s distinctive topography and natural conditions, the strategic importance of its geographical location, and the emblematic nature of its forest recovery, analysing the evolutionary patterns of forest transition characteristics and evaluating their eco-environmental effects represents an urgent scientific and practical issue for Hainan in serving the carbon peak and neutrality goals, ensuring regional ecological security, enabling integrated natural resource management, and implementing new-era territorial spatial planning—particularly against the backdrop of the development of the Hainan Free Trade Port, the National Ecological Civilization Pilot Zone, and the Hainan Tropical Rainforest National Park.
Based on the above analysis, taking Hainan Island as the study area, we propose a three-dimensional forest transition characterization framework of “quantity–structure–quality” and construct a dual-perspective eco-environmental effect assessment system of “pattern–function”. The contributions of this study are threefold. First, it extends forest transition from the traditional single dimension of area change to three dimensions—quantity, structure, and quality—thereby filling a gap in existing research that has paid insufficient attention to internal forest structural transitions. Second, it integrates landscape ecological risk and ecosystem service value into a unified analytical framework, overcoming the limitations of previous single-indicator assessments. Third, it introduces a joint attribution strategy combining GTWR and XGBoost–SHAP, enabling the examination of spatiotemporal heterogeneity and the decomposition of the net contributions of transition effects at both pixel and grid scales. At the practical level, the findings can directly inform the zoning-based management and conservation of the Hainan Tropical Rainforest National Park and provincial ecological restoration planning.
Therefore, to systematically address the above scientific questions, this study establishes the following technical route. At the forest transition identification level, a Transformer transfer learning method is applied to multi-temporal Landsat imagery to reclassify natural forests and plantations, and the spatiotemporal process of forest transition on Hainan Island from 1988 to 2020 is characterized across the three dimensions of quantity, structure, and quality. At the ecological effect assessment level, the Landscape Ecological Risk Index (ERI) is used to represent ecological security pressure, while Ecosystem Service Value (ESV) represents the supply of ecological well-being, thereby constructing mutually reinforcing “dual-response” pathways. At the effect attribution level, Geographically and Temporally Weighted Regression (GTWR) is employed to identify the spatiotemporally heterogeneous effects of each forest dimension on ecological risk, and XGBoost–SHAP is used to decompose, at the pixel scale, the direction and intensity of the net contribution of each dimension to ESV changes, thus achieving a full-chain quantitative revelation of “transition process–ecological effect–contribution attribution”.

2. Materials and Methods

2.1. Study Area

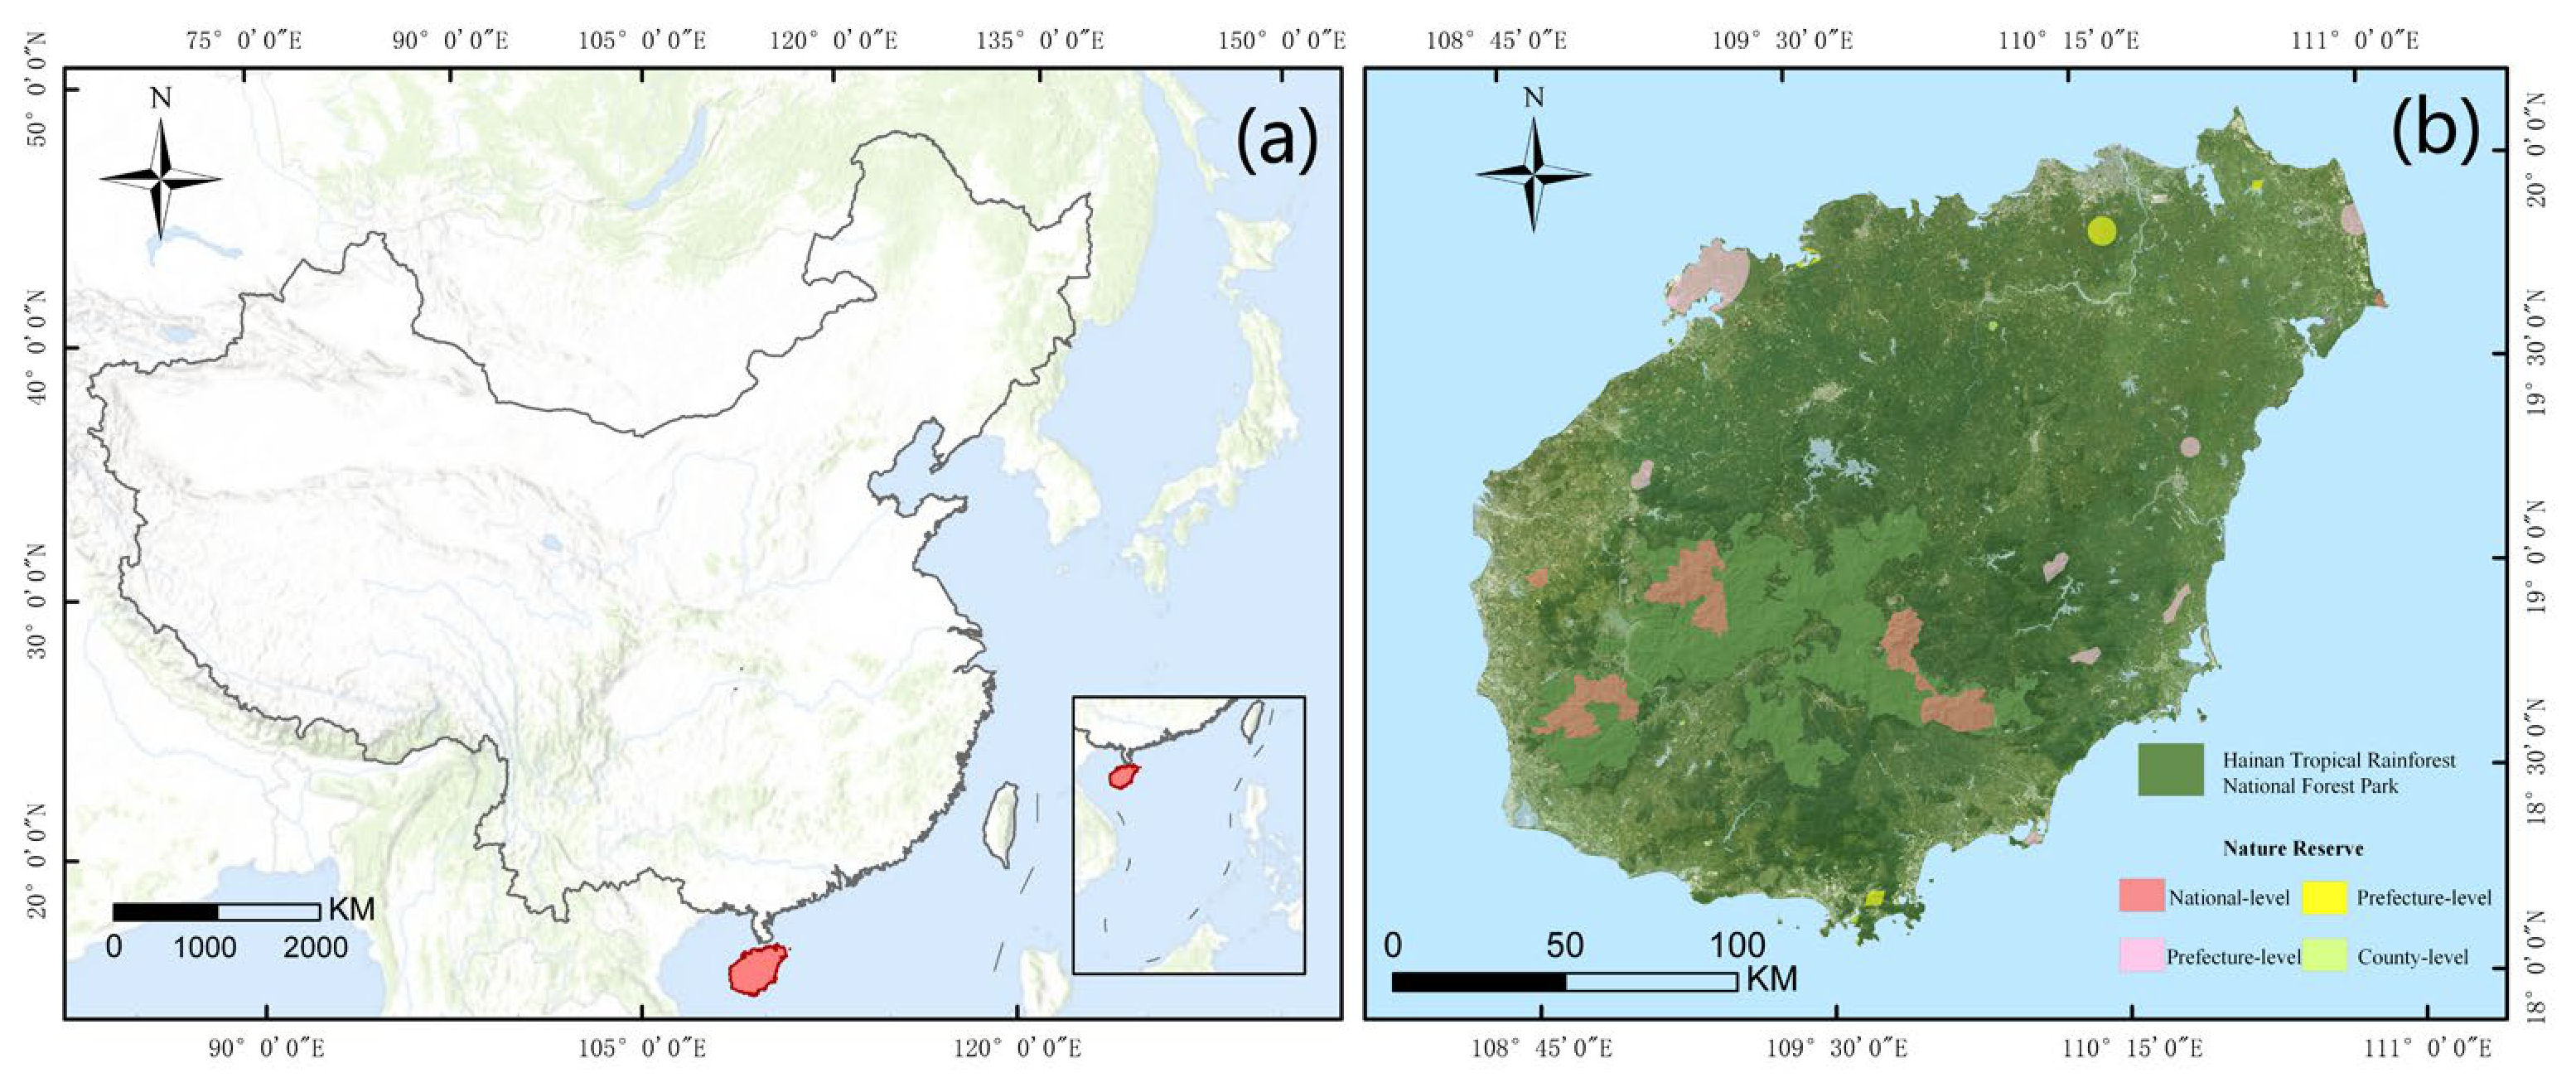
Hainan Province, China’s southernmost provincial-level administrative region, encompasses a land area of approximately 35,400 km2 (Figure 1). Surrounded by sea, it occupies a unique geographical position and experiences a typical maritime tropical monsoon climate with abundant water and heat, remaining warm and humid throughout the year. The topography, shaped by landform influences, is markedly undulating and exhibits a characteristic pattern of “high in the centre, low in the periphery”. The central region, dominated by mountains and hills with highly variable relief, harbours the most extensive, concentrated and diverse tropical rainforest resources in China, which are of critical importance for biodiversity maintenance and ecological security. By contrast, the relatively low-lying and expansive coastal periphery supports forestry, agriculture and tourism. To more directly illustrate forest dynamics and their eco-environmental effects in Hainan, the study area is restricted to the terrestrial landmass of the province; Sansha City, comprising numerous widely scattered islands, is excluded.

2.2. Data Sources

The data used in this study primarily comprise remote sensing imagery, basic geographic data, land use data, meteorological data, soil data, and statistical yearbook data (Table 1).

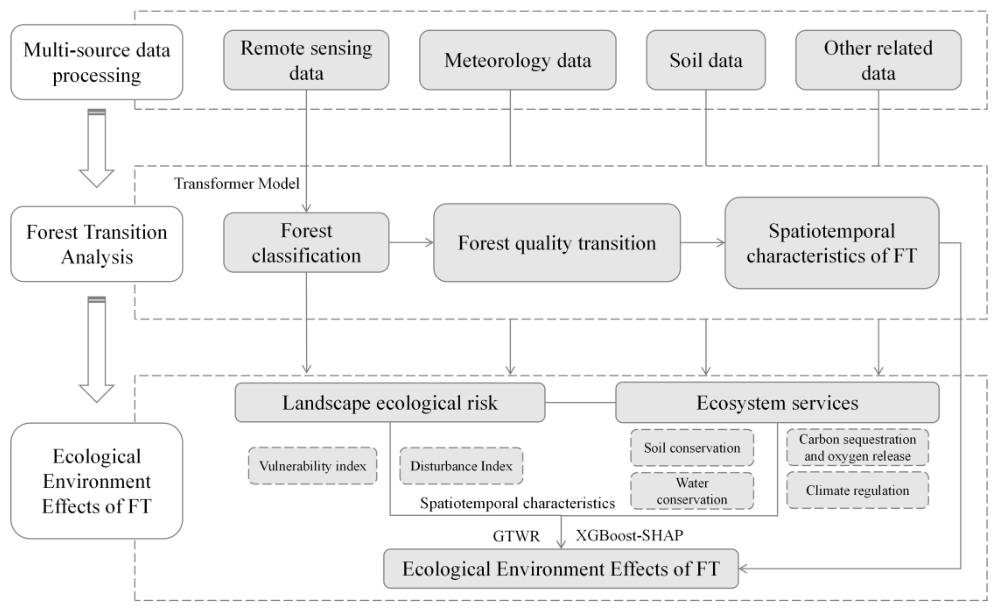
2.3. Research Framework

This study is organized around three logically progressive levels: transition identification, effect assessment, and attribution analysis (Figure 2). At the first level—forest transition identification—a Transformer transfer learning method is employed to reclassify natural forests and plantations. This method captures high-order nonlinear coupling relationships among multispectral features through the self-attention mechanism, which is particularly critical for distinguishing the two forest types given their high spectral similarity. At the second level—eco-environmental effect assessment—ERI and ESV are used to represent the two response dimensions of pattern and function, respectively. ERI captures the ecological security baseline, whereas ESV reflects the supply of ecological well-being; only by combining the two can a complete picture of the eco-environmental effects be obtained. At the third level—effect attribution analysis—GTWR is adopted from the pattern perspective because the relationship between ecological risk and forest factors exhibits significant spatial and temporal non-stationarity; from the functional perspective, XGBoost–SHAP is adopted because the response of ESV to forest change may be nonlinear and the direction of the dominant factor may differ across locations. The methodological choices at each level serve the corresponding scientific questions, together forming a coherent technical framework.

2.4. Research Methodology

2.4.1. Transformer-Based Forest Image Reclassification

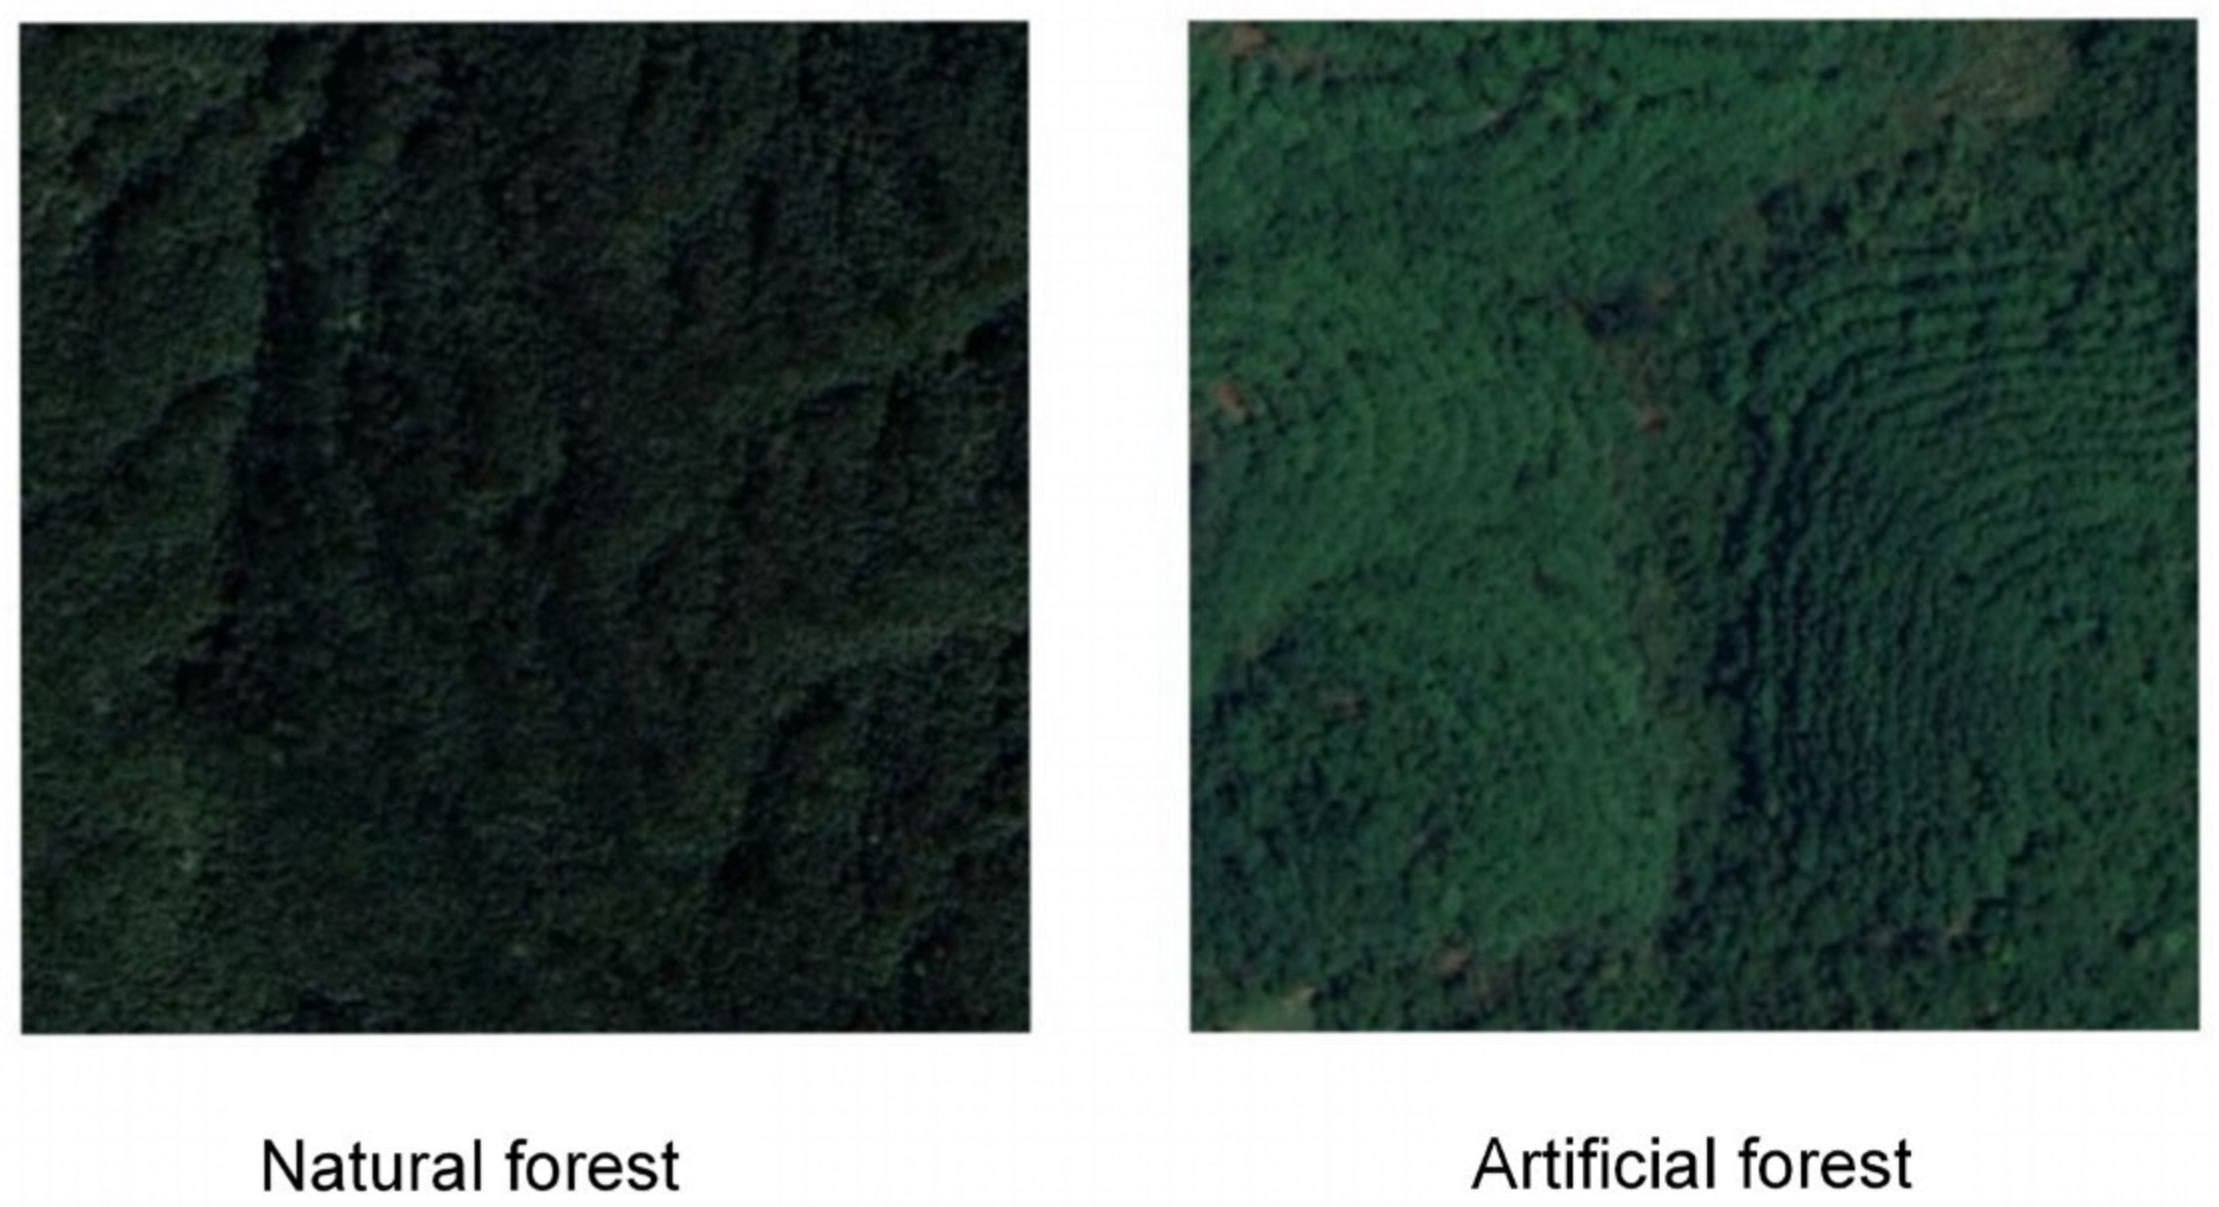
We selected 12 features to form the classification feature set (Table 2, Figure 3). To minimize the influence of cross-sensor differences on feature extraction and model results, only those spectral bands common to Landsat 5 TM and Landsat 8 OLI were used. The spectral indices employed were the Normalized Difference Vegetation Index (NDVI), Enhanced Vegetation Index (EVI), Normalized Difference Water Index (NDWI), and Normalized Difference Built-up Index (NDBI). Topographic features included elevation and slope. Natural forests typically exhibit higher species diversity and more complex horizontal and vertical structures, resulting in greater habitat heterogeneity; conversely, plantation forests, shaped by management practices and species composition, display simplified community structure and functional components with a higher degree of homogenization in ecosystem composition and processes. According to the spectral variation hypothesis, such differences alter canopy radiative transfer processes and surface reflectance properties, manifesting as differential absorption and reflection of incident radiation that is ultimately recorded as reflectance differences in remotely sensed imagery [23,24]. We therefore introduced the coefficient of variation (CV) of spectral reflectance—a metric commonly used to characterize the dispersion and variability of spectral response—as an additional classification feature [25,26].
Here, we adopt the TabTransformer architecture for forest image reclassification. TabTransformer is a tabular data classification method built upon the Transformer encoder, which learns high-order interactions among features through the self-attention mechanism. Unlike Vision Transformer (ViT), TabTransformer directly encodes the feature vector of each pixel, making it more suitable for pixel-level classification tasks using multispectral remote sensing imagery. The model consists of an input embedding layer, four Transformer encoder layers, and an output classification layer. Each encoder layer contains an eight-head self-attention mechanism and a feed-forward network with a hidden dimension of 128; Layer Normalization and residual connections are applied to stabilize training. Continuous features are first projected to a 64-dimensional embedding space via linear transformation before being fed into the encoder. To prevent overfitting, the dropout rate is set to 0.2, an early stopping strategy (patience = 10 epochs) is employed, and the Adam optimizer (learning rate = 1 × 10⁻³) is used together with the cross-entropy loss function for parameter optimization. The batch size is 64, and the maximum number of training epochs is 200. Training samples are split into training, validation, and test sets at a ratio of 8:1:1, yielding 36,000, 4500, and 4500 samples, respectively.
To address the cross-sensor spectral mismatch between Landsat 5 TM and Landsat 8 OLI, we adopted the following control measures: (1) During the construction of classification features, only the spectral bands common to both sensors were selected, excluding the coastal and cirrus bands unique to Landsat 8 OLI. (2) In the preprocessing stage prior to transfer classification, Landsat 8 OLI imagery from 2020 was used as the reference. Pseudo-invariant features (PIFs) such as bare rock and deep water were selected, and band-wise radiometric correction equations were established using least-squares linear regression to normalize the spectral values of historical images to the spectral space of Landsat 8 OLI, thereby reducing systematic biases introduced by sensor differences and varying atmospheric conditions.

2.4.2. Landscape Ecological Risk Assessment

To accurately evaluate the spatial distribution of landscape ecological risk across Hainan Province, we divided the study area into a grid of 2.5 km × 2.5 km cells and calculated the landscape ecological risk index (ERI) for each cell. The ERI, constructed from a landscape disturbance index and a landscape vulnerability index, was adopted to characterize the disturbance intensity and vulnerability of ecosystems in the province [27,28].
(1)
Landscape Ecological Risk Index
ERI = i = 1 n A i A   ×   R i
where ERI is the landscape ecological risk index for a given assessment unit; Ai is the area of landscape type i within the assessment unit; A is the total area of the unit; and Ri is the landscape loss degree index for landscape type i.
(2)
Landscape Disturbance Index
Landscape disturbance reflects the sensitivity of the landscape to external perturbations and its capacity to resist disturbance and undergo self-recovery. Here, the landscape disturbance index was derived by weighting the landscape fragmentation, landscape division, and landscape dominance indices [29].
E i = aC i + bN i + cD i
where Ei is the landscape disturbance index of landscape type *i*; Ci, Ni and Di are the fragmentation, division and dominance indices of landscape type *i*, respectively; *a*, *b* and *c* are the corresponding weights for fragmentation, division and dominance, satisfying *a* + *b* + *c* = 1. In this study, we set *a* = 0.5, *b* = 0.3 and *c* = 0.2.
(3)
Landscape vulnerability index
Landscape vulnerability reflects the expected loss or damage to the internal structure and functions of a landscape system when subjected to external disturbances [30,31], and ecosystems composed of different landscape types differ in their sensitivity to external perturbations. In accordance with prior work, the vulnerability indices were set from 1 to 7 for cropland, forest, grassland, shrubland, water bodies, impervious surfaces, and bare land, respectively. After normalization, the final normalized vulnerability indices for the seven land-use types were 0.036, 0.071, 0.107, 0.143, 0.179, 0.214, and 0.250, respectively.

2.4.3. Quantification and Valuation of Ecosystem Services

(1)
Soil retention
We estimated soil retention using the Revised Universal Soil Loss Equation (RUSLE) [32,33].
A c = A pot     Aact act = R   ×   K   ×   L   ×   S   ×   1     C   ×   P
where Ac is the soil retention; A pot is the potential soil erosion; Aact act is the actual soil erosion; R, K, L and S are the rainfall erosivity, soil erodibility, slope length and slope steepness factors, respectively; and C and P are the vegetation cover factor and the soil conservation practice factor, respectively.
(2)
Water conservation
We estimated the water conservation service in Hainan Province using the InVEST Annual Water Yield module and a comprehensive correction coefficient method.
Y i = 1     AET i P i P i
AET i P i = 1 + PET i P i     1 + PET i P i ω 1 ω
where Yi is the annual water yield of pixel *i* (mm); AETi is the actual annual evapotranspiration of pixel *i* (mm); Pi is the annual precipitation of pixel *i* (mm); PETi is the potential evapotranspiration of pixel *i*; and ω is an empirical fitting parameter that characterizes the combined influence of catchment climatic conditions and underlying surface properties, such as soil, on water partitioning.
(3)
Carbon sequestration and oxygen release
We quantified carbon sequestration and oxygen release services based on net ecosystem productivity (NEP) derived from net primary productivity (NPP) estimated by the Carnegie–Ames–Stanford Approach (CASA) model [34,35], combined with the stoichiometric relationship of photosynthesis—the mass balance between carbon fixation and oxygen release. The calculations are as follows:
V CO   =   V Cf   +   V op   =   Q CO 2   ×   C CO 2   +   Q op   ×   C O
where VCO is the total value of carbon sequestration and oxygen release; VCf is the value of ecosystem CO2 fixation; VOp is the value of ecosystem oxygen supply; QCO2 is the amount of CO2 fixed; CCO2 is the unit CO2 transaction price (CNY t−1), set to 28; QO2 is the amount of O2 released; and CO2 is the unit industrial oxygen production price (CNY t−1), set to 800.
It should be noted that the CO2 price (28 CNY t−1) and the industrial oxygen production price (800 CNY t−1) adopted in this study were held constant over the 32-year study period, without accounting for the effects of inflation or market fluctuations. Since the primary objective of this study was to identify the spatiotemporal patterns and relative differences in ecosystem service value (ESV), rather than to precisely estimate absolute economic value, the constant-price assumption has limited impact on the direction and relative magnitude of our core conclusions—such as the comparison of ESV between natural forests and plantations and the decomposition of the relative contributions of forest transition to ESV changes. We recommend that future studies apply a discount adjustment to the price parameters over time using the Consumer Price Index (CPI).
(4)
Climate regulation
The value of the climate regulation service was estimated using the replacement cost method, with the calculation formula provided below:
V cr   =   E cr   ×   P e
where Vcr is the value of climate regulation; Ecr is the total energy consumed by the climate regulation service; and Pe is the unit electricity price (CNY kWh−1), set to 0.63, which corresponds to the average electricity price for ordinary resident users under the combined meter tariff in Hainan Province.
(5)
Total ecosystem service value
ESV = V sr + V wr + V co + V cr
where ESV is the total ecosystem service value; Vsr is the soil retention value; Vwr is the water conservation value; Vco is the carbon sequestration and oxygen release value; and Vcr is the climate regulation value.

2.4.4. Geographically and Temporally Weighted Regression

We constructed a Geographically and Temporally Weighted Regression (GTWR) model with forest indicators as explanatory variables and annual landscape ecological risk as the response variable to characterize the spatiotemporal effects of forest transition on ecological risk. GTWR performs locally weighted regression at each spatiotemporal location, allowing regression coefficients to vary with both space and time.
y i , t = β 0 u i , v i , t + k = 1 n β k u i , v i , t x k , t + ε i , t  
where yi,t denotes the ecological risk value at location *i* in year *t*; xi, k, t is the value of the *k*-th indicator at location *i* in year *t*; and βk is the corresponding coefficient.
The statistical diagnostics of the GTWR model are as follows: (1) Multicollinearity test—the VIF values of all variables were below 3.0 (maximum 2.47), well under the collinearity threshold of 10. (2) Bandwidth selection—cross-validation determined a spatial bandwidth of 152 km and a temporal bandwidth of 6 years. (3) Model fitting performance—the adjusted R2 of the GTWR model across years ranged from 0.62 to 0.75, substantially outperforming both OLS (0.31–0.45) and GWR (0.51–0.63). (4) Residual test—the global Moran’s I of the residuals was consistently close to zero (−0.03 to 0.05) and did not pass the 5% significance test, indicating the absence of significant spatial autocorrelation.

2.4.5. Pixel-Level Net Effect Decomposition with XGBoost–SHAP

To reveal the net impact of forest change on variations in ecosystem service value (ESV) and its spatial heterogeneity, we employed XGBoost regression to construct a nonlinear mapping between ESV change and changes in forest indicators, together with control variables. We then introduced SHAP to perform pixel-level attribution decomposition of the model outputs [36]. The model’s prediction target was the change in ESV; core explanatory variables included changes in forest area, forest quality, and forest structure, while climate change, topographic factors, and baseline ESV were incorporated as control variables to enhance the robustness of forest effect estimation. To precisely capture the spatial differentiation in the net effect of forest change, we applied SHAP, grounded in the principle of Shapley additive explanations, to decompose the prediction for each pixel into a base value and the sum of feature contributions [37]. This yielded the spatial heterogeneity in the direction and magnitude of the contributions of forest quantity, structure, and quality fluctuations to ESV change.

3. Results

3.1. Classification Results and Accuracy Validation of Plantations and Natural Forests

Because the analysis of forest transition and its eco-environmental effects depends on the classification data distinguishing natural forests and plantations, we performed an accuracy validation to ensure the reliability of subsequent analyses. The classification accuracy for each period is presented in Table 3. The overall accuracy of the 2020 baseline model was 89.2%, with a Kappa coefficient of 0.785; both the user’s and producer’s accuracies for natural forests and plantations exceeded 85%. For the historical images, the accuracy of the transfer-classified results declined slightly as the time span increased, yet the Kappa coefficient for each period remained above 0.75, indicating consistently high accuracy that meets the data-quality requirements for the subsequent analysis of forest-transition patterns and ecological effect assessment.

3.2. Analysis of Forest Transition Characteristics in Hainan Province

3.2.1. Analysis of the Evolution of Quantity Characteristics During Forest Transition

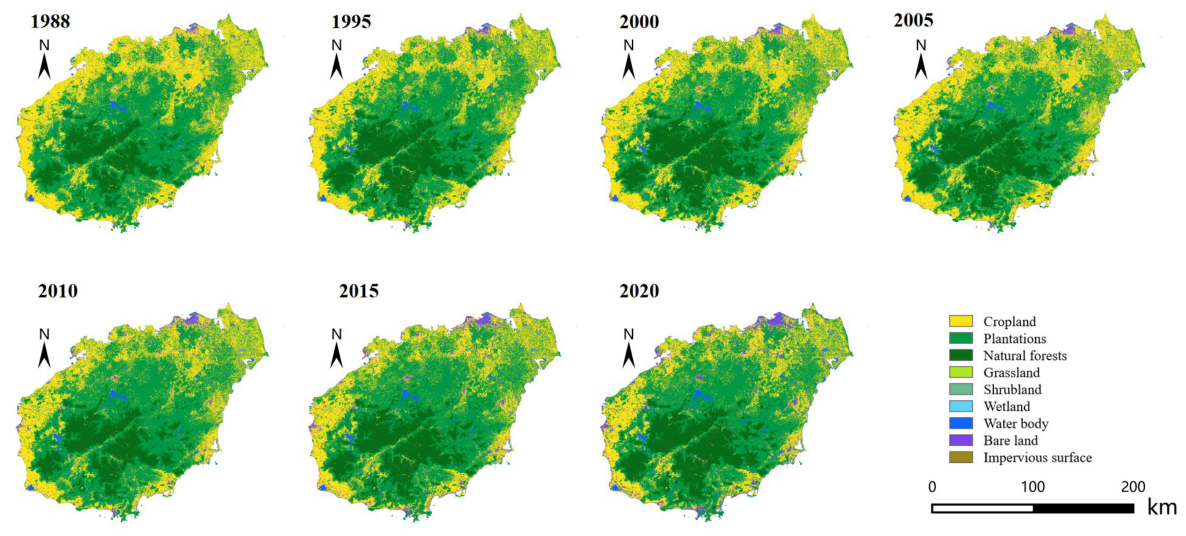
The temporal evolution of structural characteristics during the forest transition period in Hainan Province showed that, from 1988 to 2020, the total forest area of the province exhibited an overall increasing trend (Figure 4). The area of natural forests increased from 4074.40 km2 in 1988 to 6122.40 km2 in 2020, an increase of approximately 50.27%. In contrast, the area of plantations declined slightly, from 16,852.89 km2 in 1988 to 16,513.01 km2 in 2020, a decrease of about 2.17%. Overall, the total forest area rose from 20,927.29 km2 to 22,635.42 km2, representing a net gain of 1708.13 km2 and an 8.16% expansion.
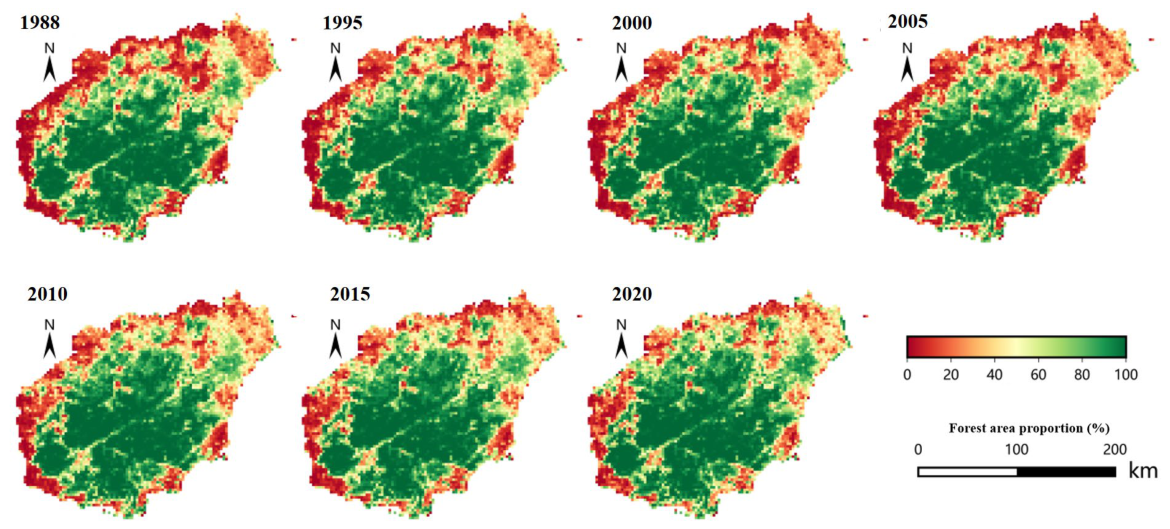
Spatially, the forest quantity pattern remained generally stable throughout the study period, consistently displaying a marked differentiation characterized by high values in the interior and low values at the periphery (Figure 5). High-value zones were predominantly and contiguously distributed across the central and southern interior, forming a relatively stable forest cover core; low-value zones were mainly located in the northern, northeastern, and marginal areas, displaying a peripheral ring-like distribution. Over the entire study period, the spatial backbone of forest quantity did not undergo fundamental reorganization: forest resources remained largely concentrated in the contiguous central-southern region, while the peripheral margins consistently exhibited a relatively low forest cover proportion and were the most dynamic areas of change.

3.2.2. Analysis of the Evolution of Structure Characteristics During Forest Transition

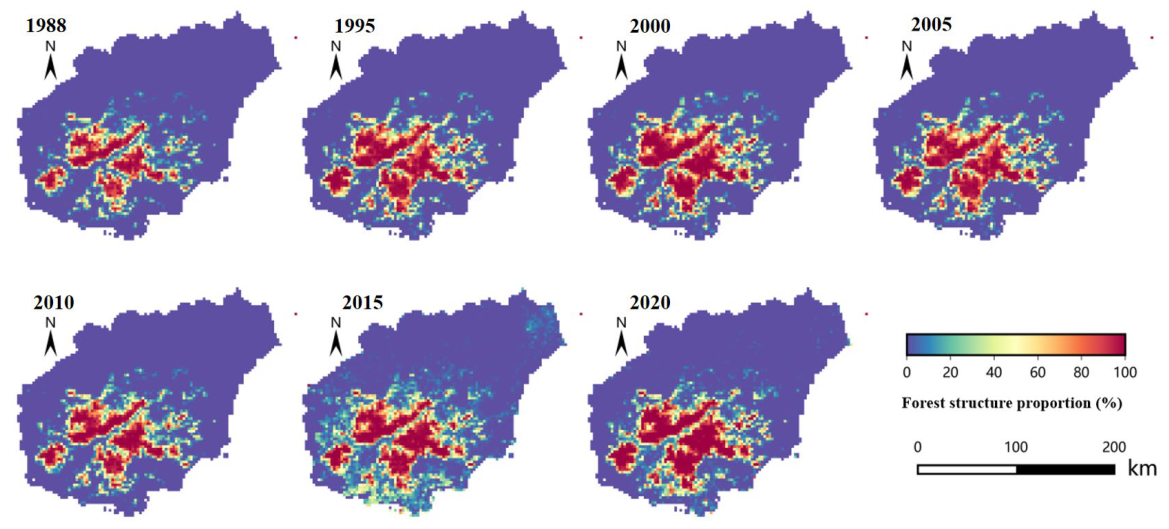
From 1988 to 2020, the overall forest structure indicator of the study area was approximately 19.47, 25.98, 27.60, 27.28, 21.54, 26.26, and 27.05 in the respective study years (Figure 6). Overall, the structure indicator continued to rise or remained at a high plateau from 1988 to 2005, experienced a marked decline around 2010, and subsequently recovered rapidly to reach a relatively high level again by 2020. Spatially, the structure indicator exhibited a stable gradient-like distribution pattern. Throughout the 1988–2020 period, the spatial pattern of forest structure was characterized by a broad background of low values with high values concentrated in distinct clusters. Low-value zones persistently occupied the majority of the study area, whereas high-value zones were stably distributed mainly in localized areas of the central-south and southwest, where they appeared as belt-like and cluster-like aggregations. This indicates that, over the entire study period, the spatial backbone of forest structure did not undergo fundamental reorganization; the zones of structural advantage remained consistently concentrated in a small number of localized core areas, demonstrating strong spatial stability.

3.2.3. Analysis of the Evolution of Quality Characteristics During Forest Transition

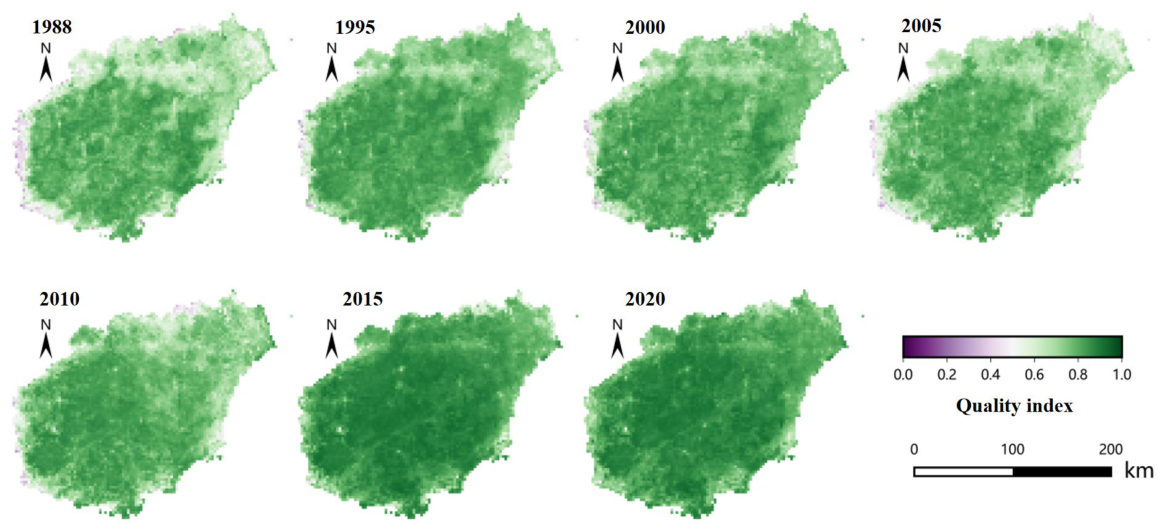
Spatially, from 1988 to 2020, the overall forest quality in the study area displayed a persistent pattern characterized by higher values in the interior and lower values at the periphery (Figure 7). High-value zones were predominantly distributed across the central, southern, and southwestern interior with strong spatial continuity, whereas low-value zones were concentrated in the northern, northeastern, and some peripheral marginal areas. Unlike the localized clustering of high values observed for forest structure, the high-value zones of forest quality covered a considerably broader extent, indicating that forest quality across the study area was maintained at a relatively high overall level over a large spatial domain, rather than relying on a small number of isolated core patches. This “high interior, low periphery” spatial framework persisted throughout the entire study period, although the degree of continuity and the spatial extent of the high-value zones varied across different periods.

3.3. Landscape Ecological Risk Dynamics in Hainan Province Under Forest Transition

3.3.1. Overall Level and Grade Structure Characteristics of Landscape Ecological Risk

We constructed a landscape ecological risk model and characterized the landscape ecological risk level of Hainan Province from 1988 to 2020 using the Landscape Ecological Risk Index (ERI). The mean ERI values for the individual study years were 0.2107, 0.1980, 0.2003, 0.2018, 0.2071, 0.2132 and 0.2013, respectively. Although the ecological risk level fluctuated across periods, the overall mean hovered around 0.205 with minor fluctuations, showing no significant unidirectional downward trend. The ERI values across the study area were visualized using Kriging interpolation. To more intuitively reveal the spatial differences in risk grades, we classified the ERI results for each year into five categories using the Jenks natural breaks method: low-risk (0 ≤ ERI < 0.0148), relatively low-risk (0.0148 ≤ ERI < 0.1117), medium-risk (0.1117 ≤ ERI < 0.2243), relatively high-risk (0.2243 ≤ ERI < 0.2792), and high-risk (0.2792 ≤ ERI < 1) zones, thereby obtaining the spatial distribution of landscape ecological risk across Hainan Province.

3.3.2. Spatial Pattern of Landscape Ecological Risk in Hainan Province

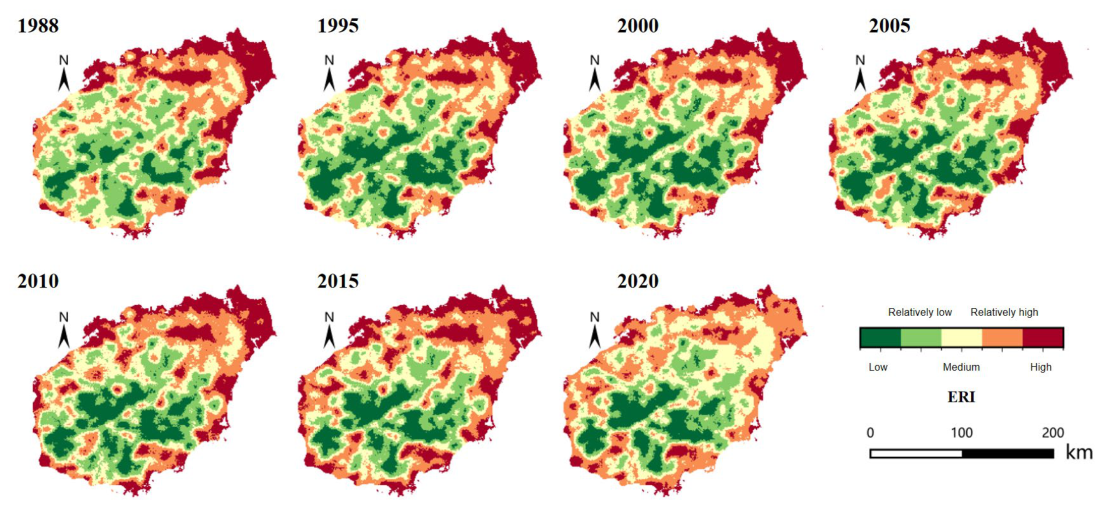
The landscape ecological risk in Hainan Province exhibited a stable and distinct spatial differentiation pattern (Figure 8). Overall, it displayed a concentric zonation structure characterized by low-risk agglomeration in the interior and a surrounding ring of medium-to-high risk, accompanied by local belt-like expansion. Low-risk and relatively low-risk zones were persistently concentrated in the mountainous areas of the central and southern island, closely coinciding with the distribution of tropical natural rainforests in core mountain regions such as Wuzhi Mountain and Yingge Ridge. Medium-risk zones were mainly situated at the periphery of this core area and along forest margins, forming a ring-like or band-like distribution, a pattern indicative of a typical spatial transition zone. Relatively high-risk and high-risk zones were predominantly located along the study area’s edges, in parts of the northern region, and along certain linear corridors. The different risk grades displayed a relatively clear “core–transition–periphery” spatial sequence. Owing to the continuous forest cover in the central part of the study area, the low-risk zones formed a contiguous and extensive distribution there, exhibiting the most pronounced spatial continuity; high-risk zones mostly appeared as localised clusters that expanded towards their surroundings.

3.4. Ecosystem Service Functions and Value Dynamics in Hainan Province

3.4.1. Soil Retention Service

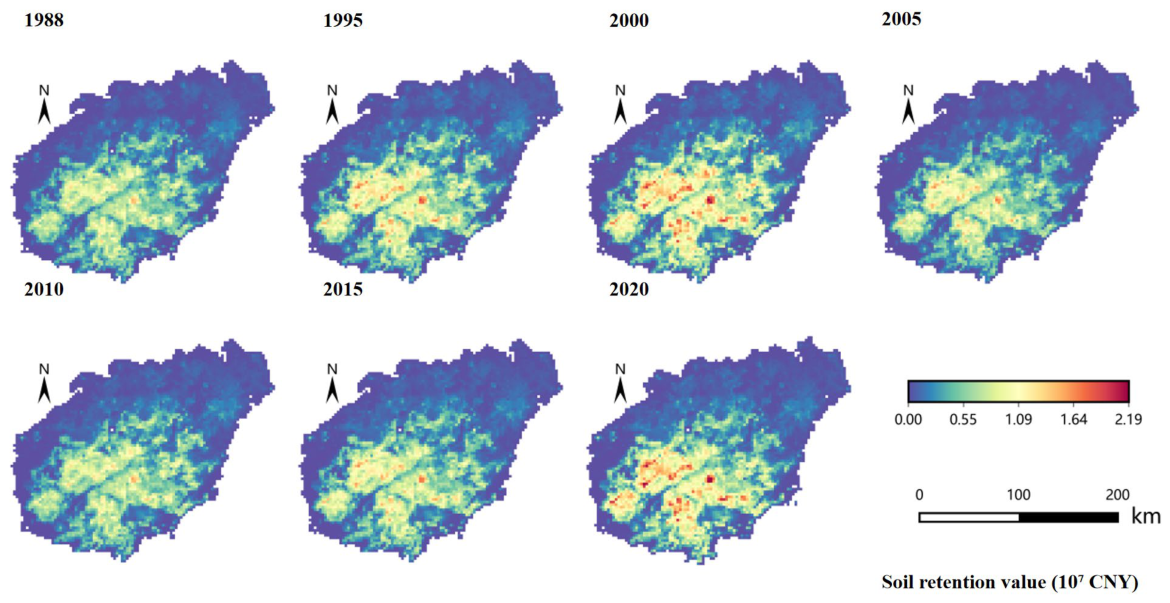
According to the results, the soil retention in Hainan Province for the individual study years from 1988 to 2020 was 205.6 Mt, 248.3 Mt, 288.4 Mt, 208.2 Mt, 207.8 Mt, 226.0 Mt and 269.3 Mt, respectively, displaying a fluctuation trend similar to that of total forest area change (Figure 9). Medium-to-high soil retention service values were consistently concentrated in the central forested areas, with particularly high values in the central mountainous region, where the soil retention value per 2.5 × 2.5 km grid cell exceeded 55 million CNY, and exhibited a declining trend from the central Hainan Tropical Rainforest National Park towards the periphery; the relatively flat, non-forest peripheral areas had low soil retention function. Soil retention service in natural forest areas remained at a high level throughout the study period. Over the long term, high-value zones gradually concentrated towards the natural forests in the interior of the study area, while the non-forest periphery displayed relatively stable low values. In terms of interannual variation, soil retention in the study area exhibited a fluctuating upward trend of “rise–decline–rise”, with an overall increase over the study period; During 1988–2020, the total forest soil retention value increased from 14.74 billion CNY to 20.12 billion CNY in 2020, with the highest value recorded in 2000 and the lowest in 1988. Overall, the total forest soil retention value in Hainan Province increased over the study period.

3.4.2. Water Conservation Service

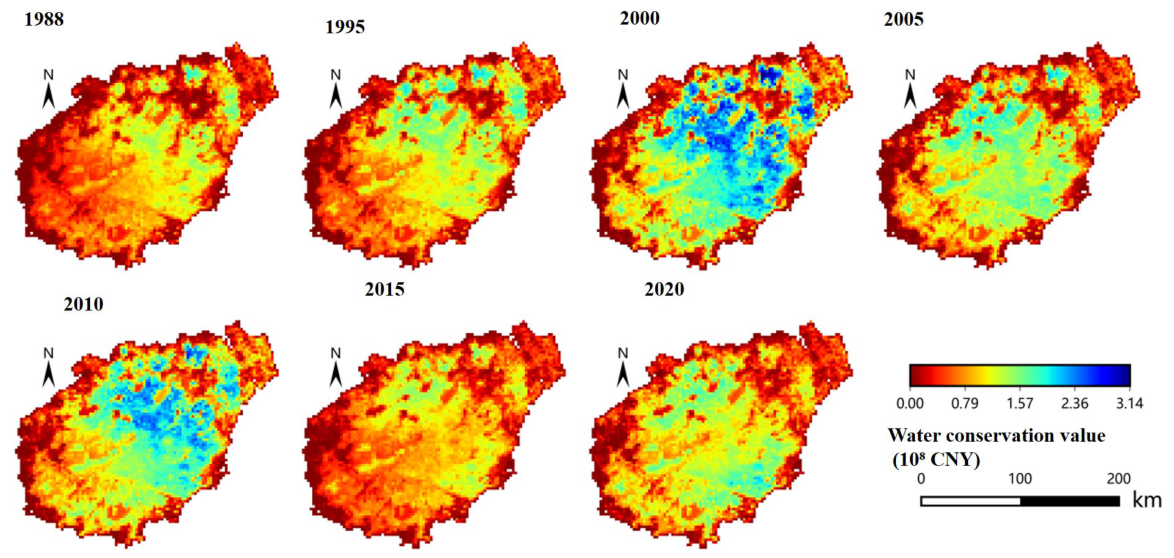
The spatial pattern of water conservation service in Hainan Province exhibited pronounced spatial differentiation, diverging substantially from the distributions of other ecosystem services (Figure 10). It displayed a gradient of high values in the interior and low values in the periphery. High-value zones were concentrated mainly in the central region and parts of the north, where terrain is relatively low-lying and forest cover is more continuous. In contrast, the southern region showed weaker water conservation service, with generally lower values than the north. This spatial differentiation was closely linked to regional precipitation conditions and vegetation coverage. The central and northern regions receive more abundant precipitation and have high forest coverage; the northern terrain is low-lying and relatively flat, conditions that enhance precipitation interception, promote soil infiltration, and reduce runoff loss, thereby strengthening water regulation and storage functions. Although the core natural forest area in the south has high forest coverage, its rugged topography and lower rainfall result in a relatively smaller water conservation capacity. Along the periphery of the study area, a ring-like or belt-like low-value zone was observed, forming a clear spatial gradient. With respect to temporal dynamics, the water conservation service value in Hainan Province displayed marked stage-specific fluctuations between 1988 and 2020, yet showed an overall increase; The total forest water conservation values for the seven study periods were 34.25, 42.76, 65.52, 48.75, 59.08, 35.41 and 46.16 billion CNY, respectively. The interannual variation trend exhibited high consistency and synchronicity with precipitation changes in the study area. Over the study period, the total water conservation value provided by forest ecosystems increased by approximately 11.90 billion CNY.

3.4.3. Carbon Sequestration and Oxygen Release Service

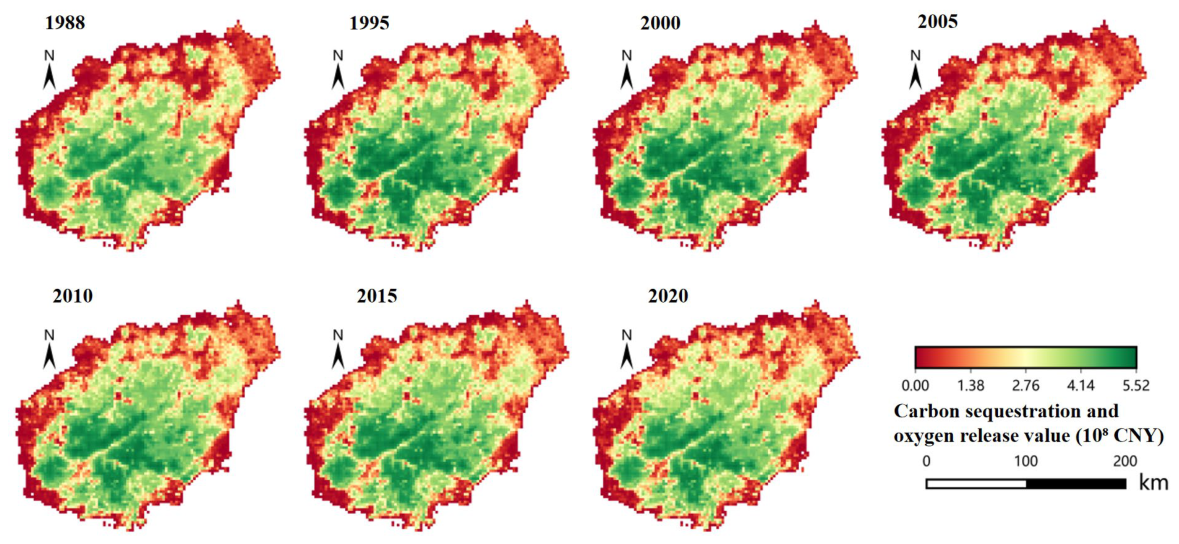
Here we reconstructed the carbon sequestration and oxygen release service across Hainan Province for 1988–2020 using the CASA model and estimated its value with the market value method (Figure 11). The results revealed pronounced spatial heterogeneity in carbon sequestration and oxygen release value at every time step, with a relatively stable spatial pattern characterized by a gradient of high values in the interior and low values at the periphery. High-value zones were concentrated in the natural-forest-covered areas of the central and southern island, where the value per grid cell exceeded CNY 41.4 million; low-value zones occupied the surrounding cropland and urban built-up land. The pattern was already clearly established in 1988, with high-value zones located in the central mountainous region and low-value zones forming a continuous band along the northern and peripheral areas. In 1995 the overall structure persisted, while high-value zones expanded markedly in response to improved forest quality and natural forest expansion; patch boundaries became smoother and connectivity increased, and the northern low-value ring remained conspicuous. The patterns in 2000 and 2005 showed little change—the high-value core remained stable with strong internal connectivity, low-value zones still occupied the northern and peripheral margins, but a few punctate or strip-like low-value patches began to appear internally. In 2010 the pattern was generally stable, the extent of the high-value core was similar to that of the previous period, the northern and marginal low-value belt encroached slightly inward, and the transition zone thickened locally. In 2015 and 2020, the high-value zone still dominated the interior with no evident fragmentation of its connected structure; the northern and peripheral low-value zones constituted the main low-value clusters, and in some areas low-value patches showed a tendency to expand. Across the multiple periods, the evolution of the carbon sequestration and oxygen release value followed a trajectory of “stable core, fluctuating periphery, and adjusting transition zone”. Aggregating the forest carbon sequestration and oxygen release value in Hainan over the study period, the total values for the seven years were 137.50, 153.71, 147.84, 144.87, 151.95, 151.70 and 147.41 billion CNY, respectively, showing an overall increasing trend.

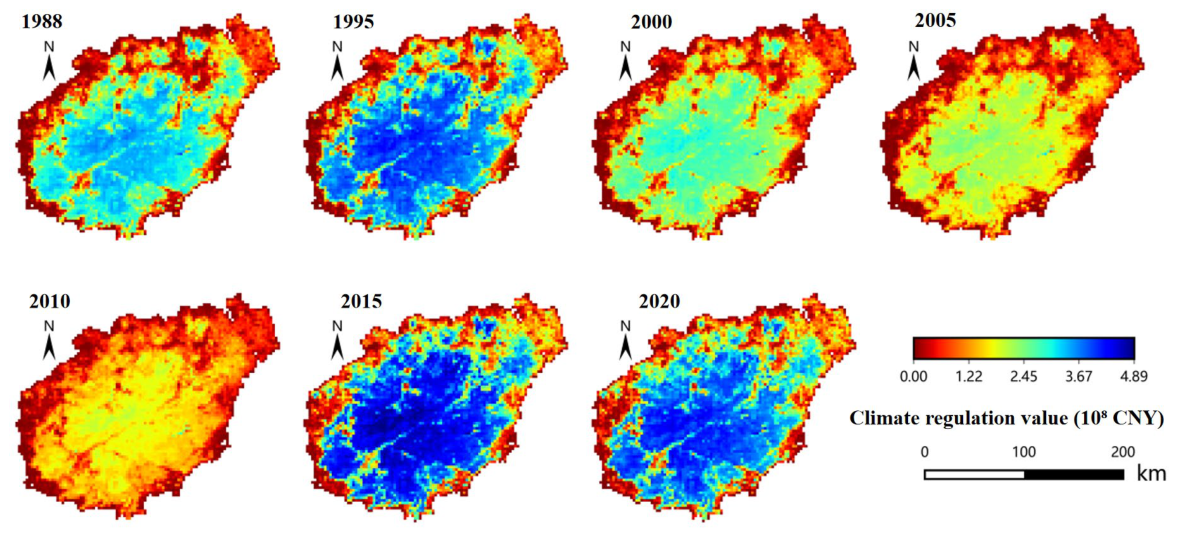
3.4.4. Climate Regulation Service

Overall, the spatial distribution pattern of climate regulation service value in the study area remained relatively stable during 1988–2020, displaying a structure of high values in the interior and low values in the periphery (Figure 12). High-value zones were concentrated mainly in the central region and parts of the north of Hainan Province, while low-value zones formed a belt-like distribution along the study area edges, overlying cropland and built-up land. In 1988, a clear high-value core and a peripheral low-value ring had already been established; medium- and high-value zones were contiguously distributed in the interior, exhibiting pronounced spatial clustering. In 1995, the climate regulation service value increased overall, the high-value zones expanded inward with enhanced continuity, and the total value reached a study-period high, indicating that the increase mainly stemmed from improved interior vegetation quality. In 2000, the service value declined periodically: the high-value zones contracted, shifting from concentrated and contiguous patches to dispersed patches, the interior was dominated by medium values, and the degree of spatial agglomeration decreased. In 2005, the pattern was similar to that of 2000, but local values recovered, the boundaries of high-value areas became clearer, fragmentation lessened slightly, and the service capacity entered a gradual recovery phase. In 2010, the service value dropped to its lowest level of the study period; overall, medium and low values prevailed, high-value zones were small and scattered, the clustering of high values in the interior weakened markedly, and low values expanded inward, showing a spatial retreat characteristic. In 2015, the service value recovered notably: high-value zones expanded rapidly and became contiguously connected in the interior, spatial continuity was significantly enhanced, a stable core formed in the central region with local outward expansion, reflecting effective vegetation restoration. In 2020, the service value remained at a relatively high level but declined slightly compared with 2015; high-value zones shrank locally, the proportion of medium values increased, the spatial gradient structure in which the interior outperformed the periphery remained stable, and the high-value pattern persisted but with minor interannual fluctuations. In terms of total value, plantations clearly dominated, with their contribution significantly exceeding that of natural forests in every year, thus playing a leading role in the climate regulation service. The plantation value was 879.62 billion CNY in 1988, rose to 990.40 billion CNY in 1995, and subsequently declined; the natural forest value stood at 223.90 billion CNY in 1988, increased to 366.92 billion CNY in 1995, then declined, before rising to 403.68 billion CNY in 2020.

3.4.5. Total Ecosystem Service Value

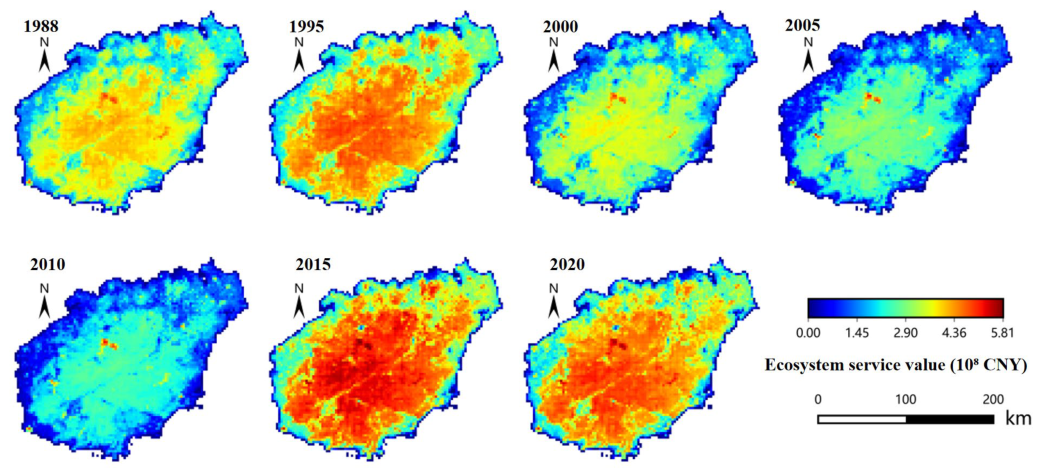
Figure 13 shows the spatial distribution of ecosystem service value (ESV) for each year and its interannual variation characteristics. The results reveal pronounced spatial differentiation in total ESV across the study area, displaying a gradient pattern of high values in the interior and low values in the periphery. Medium-to-high value zones are mainly concentrated in the forested areas of the central study region; in particular, in the core areas where natural forests are concentrated, ESV is persistently maintained at a high level. In contrast, the periphery, dominated by non-forest land, forms a relatively continuous low-value belt. Water bodies play a prominent role in the composition of ESV and constitute an important source of high-value areas. Relatively speaking, the low-lying, sparsely vegetated non-forest areas along the periphery consistently exhibit low ESV. Overall, forested areas generally appear as high-ESV zones; notably, the core zones of the tropical rainforest and forest parks, which are dominated by natural forests, show significantly higher service value than surrounding forested areas. This indicates that, apart from water bodies, forest ecosystems are the primary supplier of ecosystem services in the study area. In terms of interannual variation, total ESV exhibits phased fluctuations, following an alternating “rise–decline–rise” pattern, but with an overall upward trend; The total ecosystem service value provided by plantations consistently exceeded that provided by natural forests. Although the total ecosystem service value supplied by natural forests was lower than that of plantations, natural forests delivered a higher value per unit area, making them the more efficient provider of ecosystem services in Hainan Province.

3.5. Analysis of the Eco-Environmental Effects of Forest Transition in Hainan Province

3.5.1. Relationship Between Forest Transition and Ecological Risk

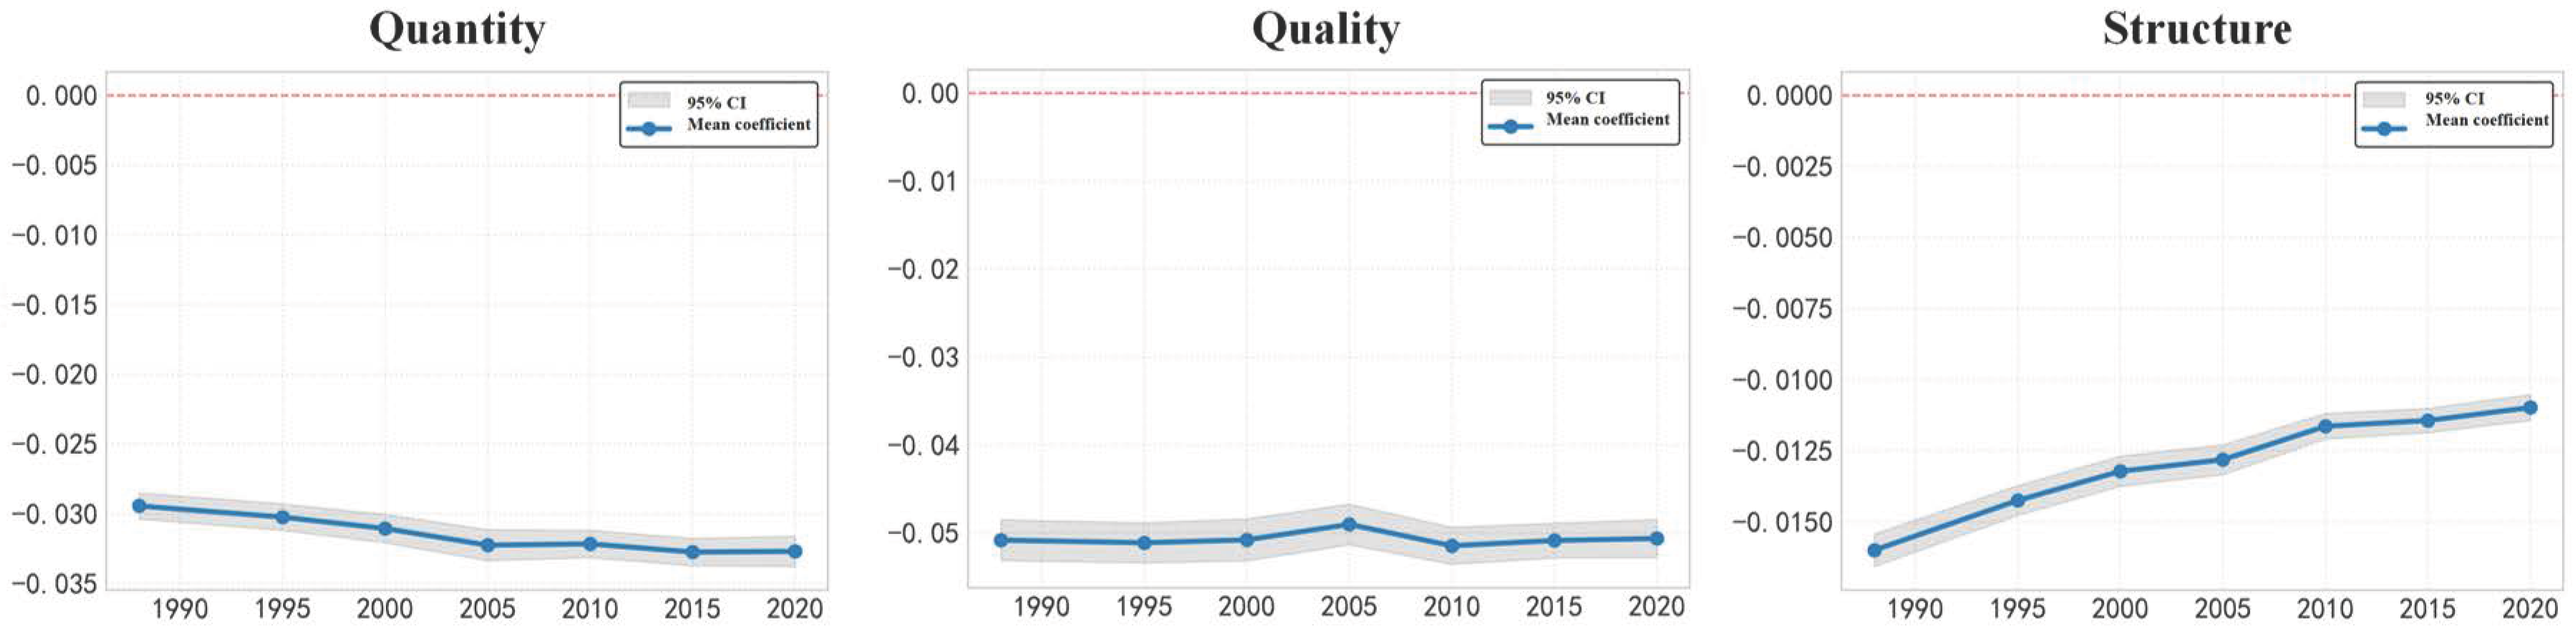
Examining the temporal trends across multiple periods, although the three indicators shared a consistent direction of influence, their influence intensities exhibited divergent trends (Figure 14). The absolute value of the mean coefficient for the quantity indicator showed a steady upward trend, suggesting that the regulatory capacity of increasing forest coverage on ecological risk strengthened continuously. By contrast, the inhibitory effect of forest structure was highly stable: its mean coefficient persisted at a relatively steady level (approximately −0.053) with small fluctuations. The mean coefficient for the quality indicator displayed a continuous upward shift, with its absolute value progressively decreasing, yet it still maintained an inhibitory effect on ecological risk. Considering the trajectory of forest quality change in the study area, forest quality in Hainan had already reached a high level in the later period and the disparity in forest quality across the area had narrowed.
Throughout the study period, the regression coefficients of forest indicators on ERI were predominantly negative, with the proportion of negative coefficients exceeding 90% for each indicator. Thus, in terms of the long-term mean effect, forests exerted a consistent suppressive influence on ecological risk across Hainan Province.
The influence coefficients of forest quantity on ERI showed marked spatial differentiation across the island: the multi-year mean coefficient was negative across approximately 94.67% of the area, with values ranging from −0.133 to 0.022, and the negative coefficients were spatially contiguous. The spatial distribution of forest quality coefficients was also predominantly negative, with negative coefficients accounting for approximately 90.50% and concentrated between −0.042 and 0. Among the three factors, the coefficients of forest structure on ecological risk had the largest absolute values and displayed a relatively regular spatial gradient. Apart from the positive values in the northwestern coastal transition zone, coefficients over the rest of the island all fell within the negative range of −0.311 to 0, revealing an almost island-wide negative response relationship between forest structure and ecological risk.

3.5.2. Spatiotemporal Effects of Forest Transition on Ecosystem Service Value

To investigate the relationship between ecosystem service value (ESV) and forest change, we developed an XGBoost regression model using nine variables drawn from the forest change indicator system. The R2 values for both the training and testing sets at each time step exceeded 0.90, indicating reliable model fit and providing a credible explanatory basis for the SHAP attribution results.
Based on the SHAP attribution statistics over the entire 1988–2020 period, the contributions of changes in forest quantity, structure and quality to ESV change exhibited marked asymmetry in magnitude (Table 4). Among them, the contribution of the forest quantity indicator was the most prominent: over the whole period, the cumulative positive contribution of forest quantity change reached 104.00 billion CNY, while the cumulative negative contribution amounted to −83.91 billion CNY, far exceeding the contribution intensities of changes in structure and quality. The substantial offset between positive and negative contributions reveals the significant driving effect of forest area expansion and contraction on total ESV over the study period.
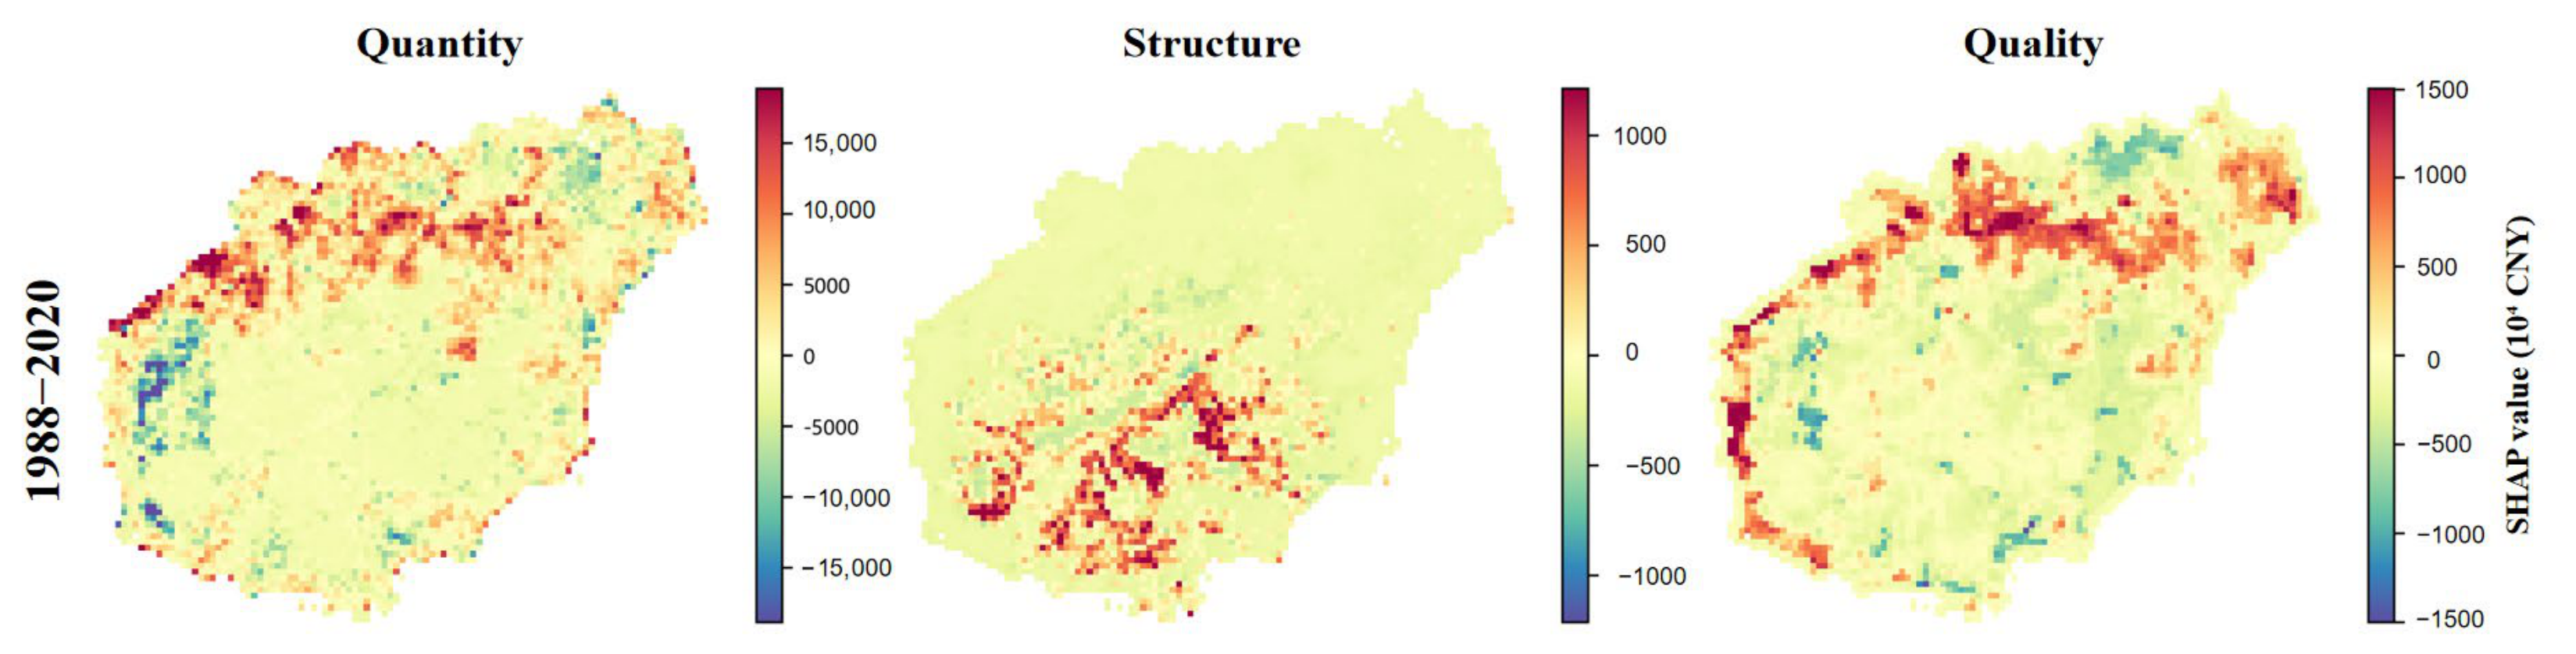
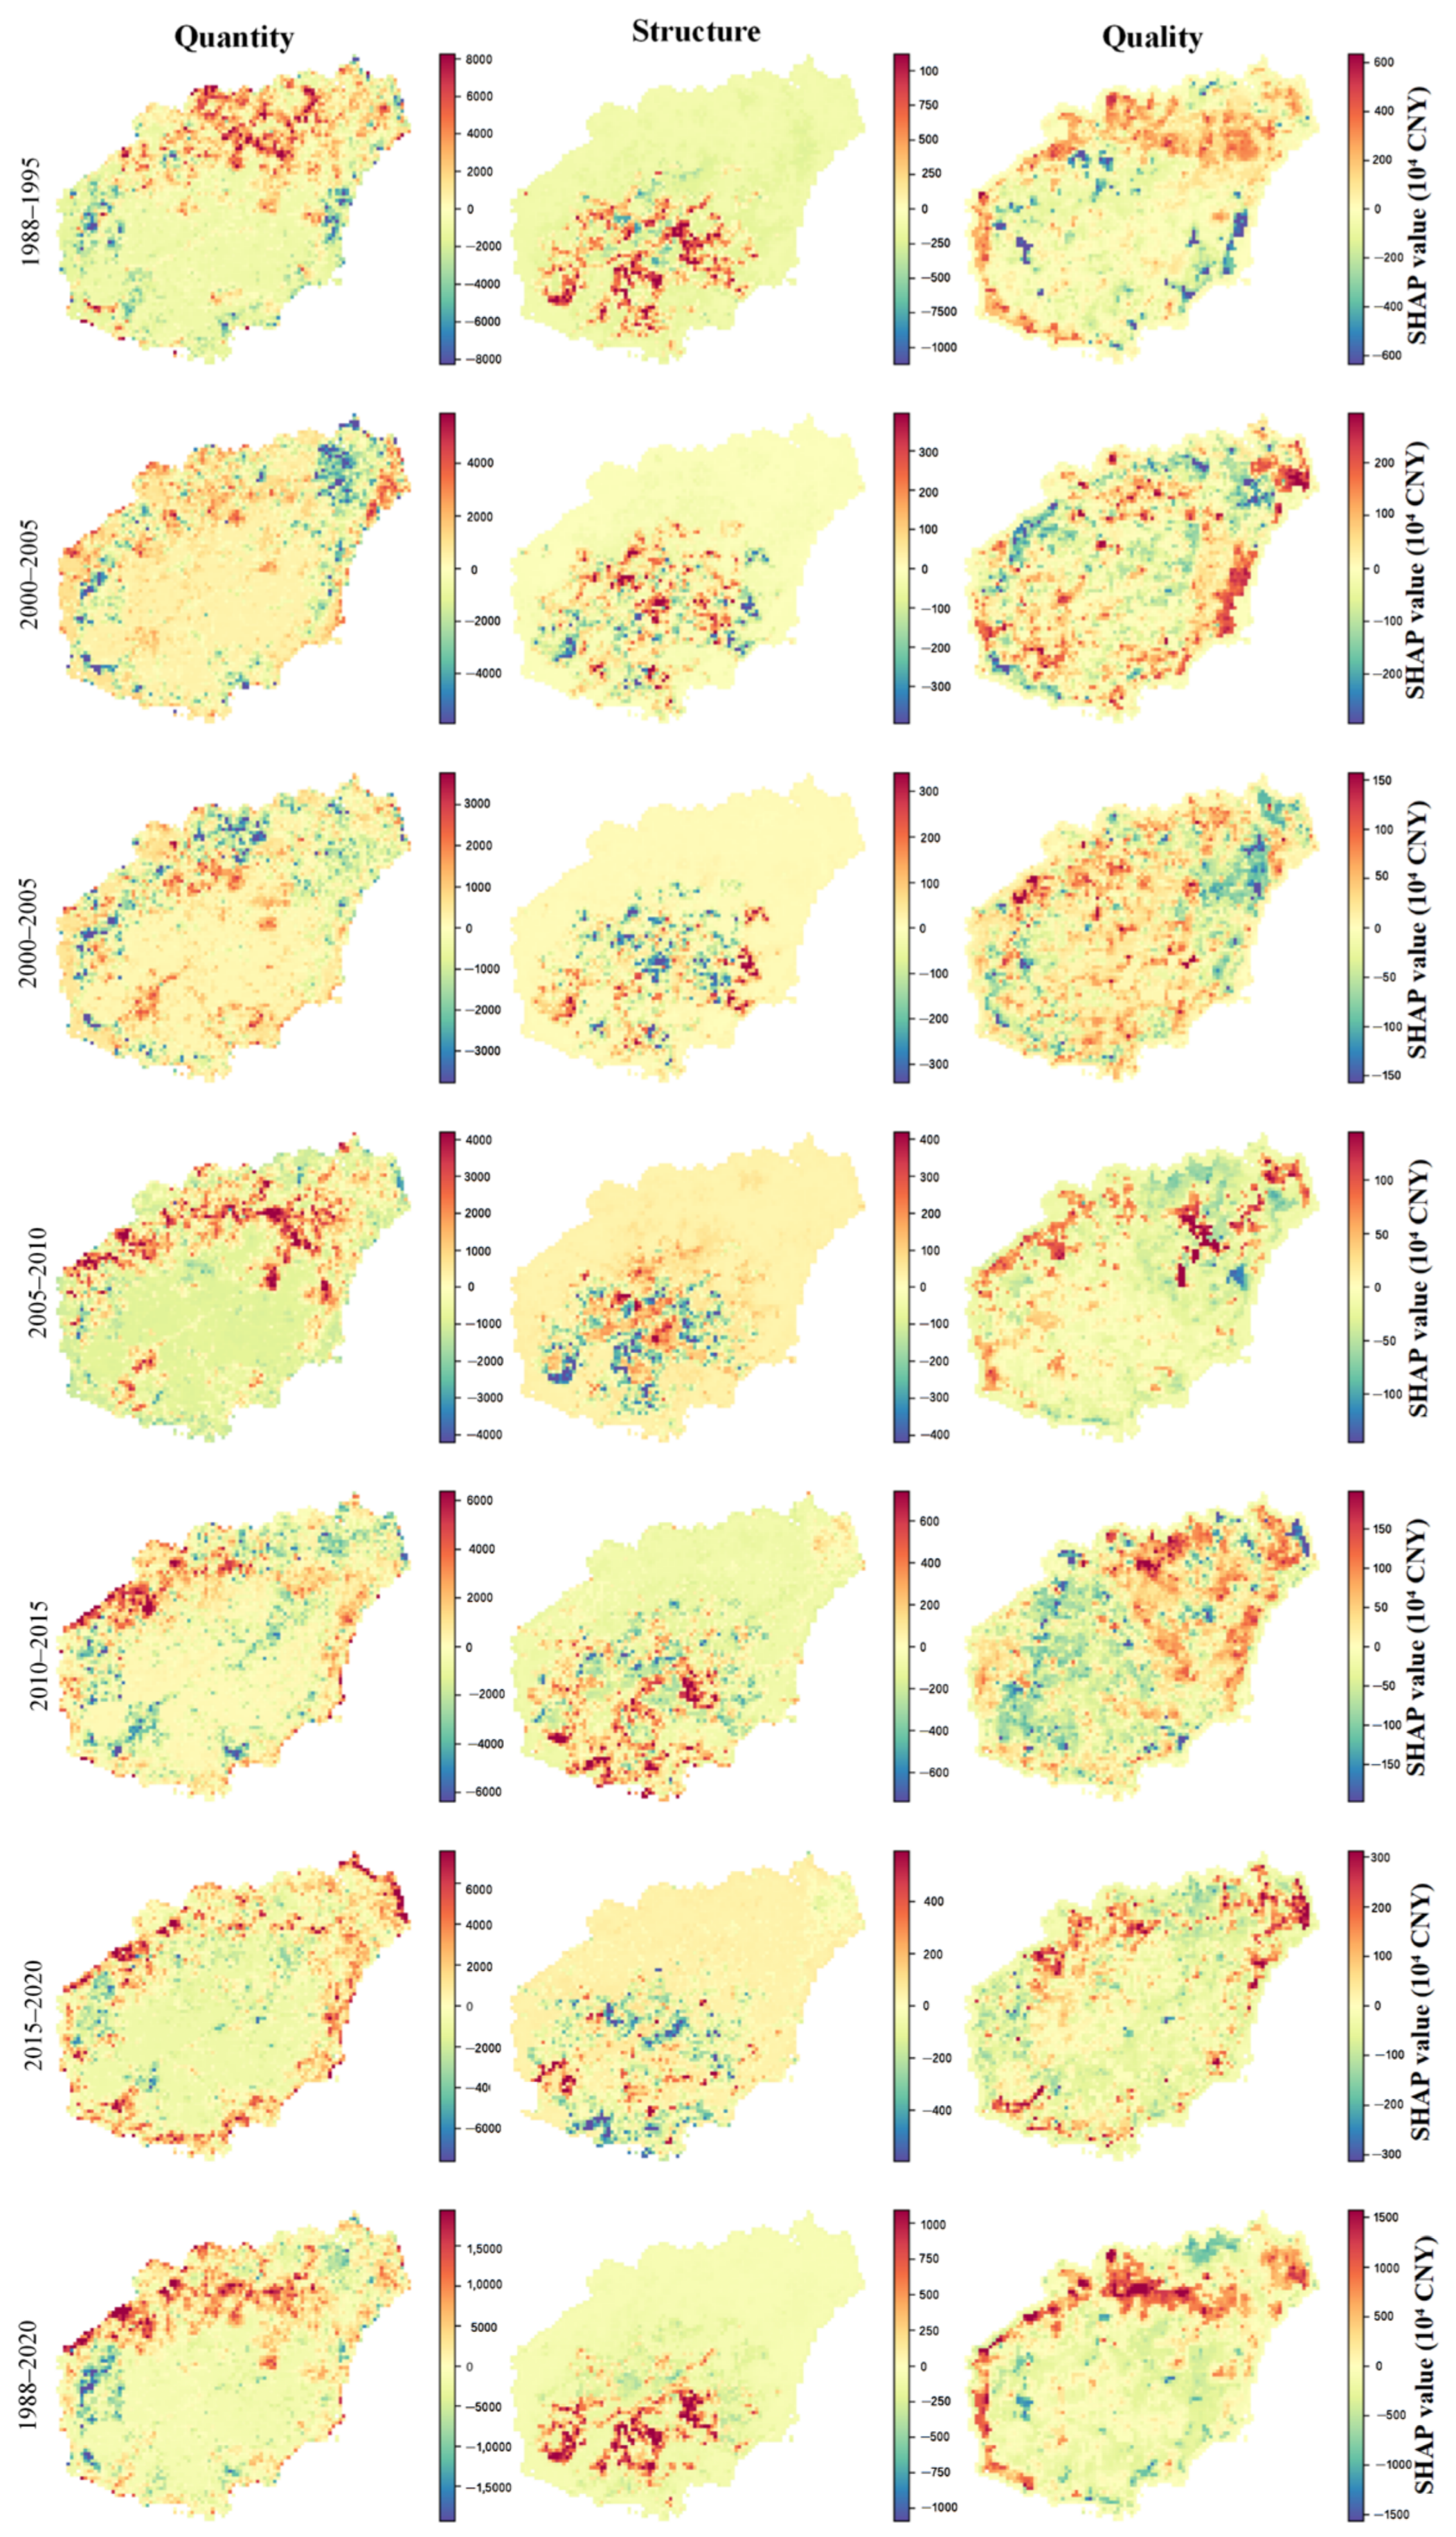
The SHAP distributions of the three indicators displayed complementary characteristics (Figure 15). The SHAP values of forest quantity change exhibited the widest fluctuation range, and their spatial cold- and hot-spot pattern was highly consistent with the spatial distribution of forest area gains and losses. Positive contributions were strongly concentrated in the northwestern forest-cover expansion zones, corroborating the substantial increase in forest area; negative contributions appeared as contiguous patches in coastal urban expansion zones such as Haikou and Sanya, as well as in the southwestern forest degradation zones. Taken together, these results indicate that forest quantity change determines the dominant large-scale pattern of ESV contribution across the island, whereas structure and quality primarily exert localised modifying effects on service delivery efficiency. This is consistent with the forest evolution pattern described earlier—namely, a relatively stable core area with greater sensitivity in transition zones and along the periphery.
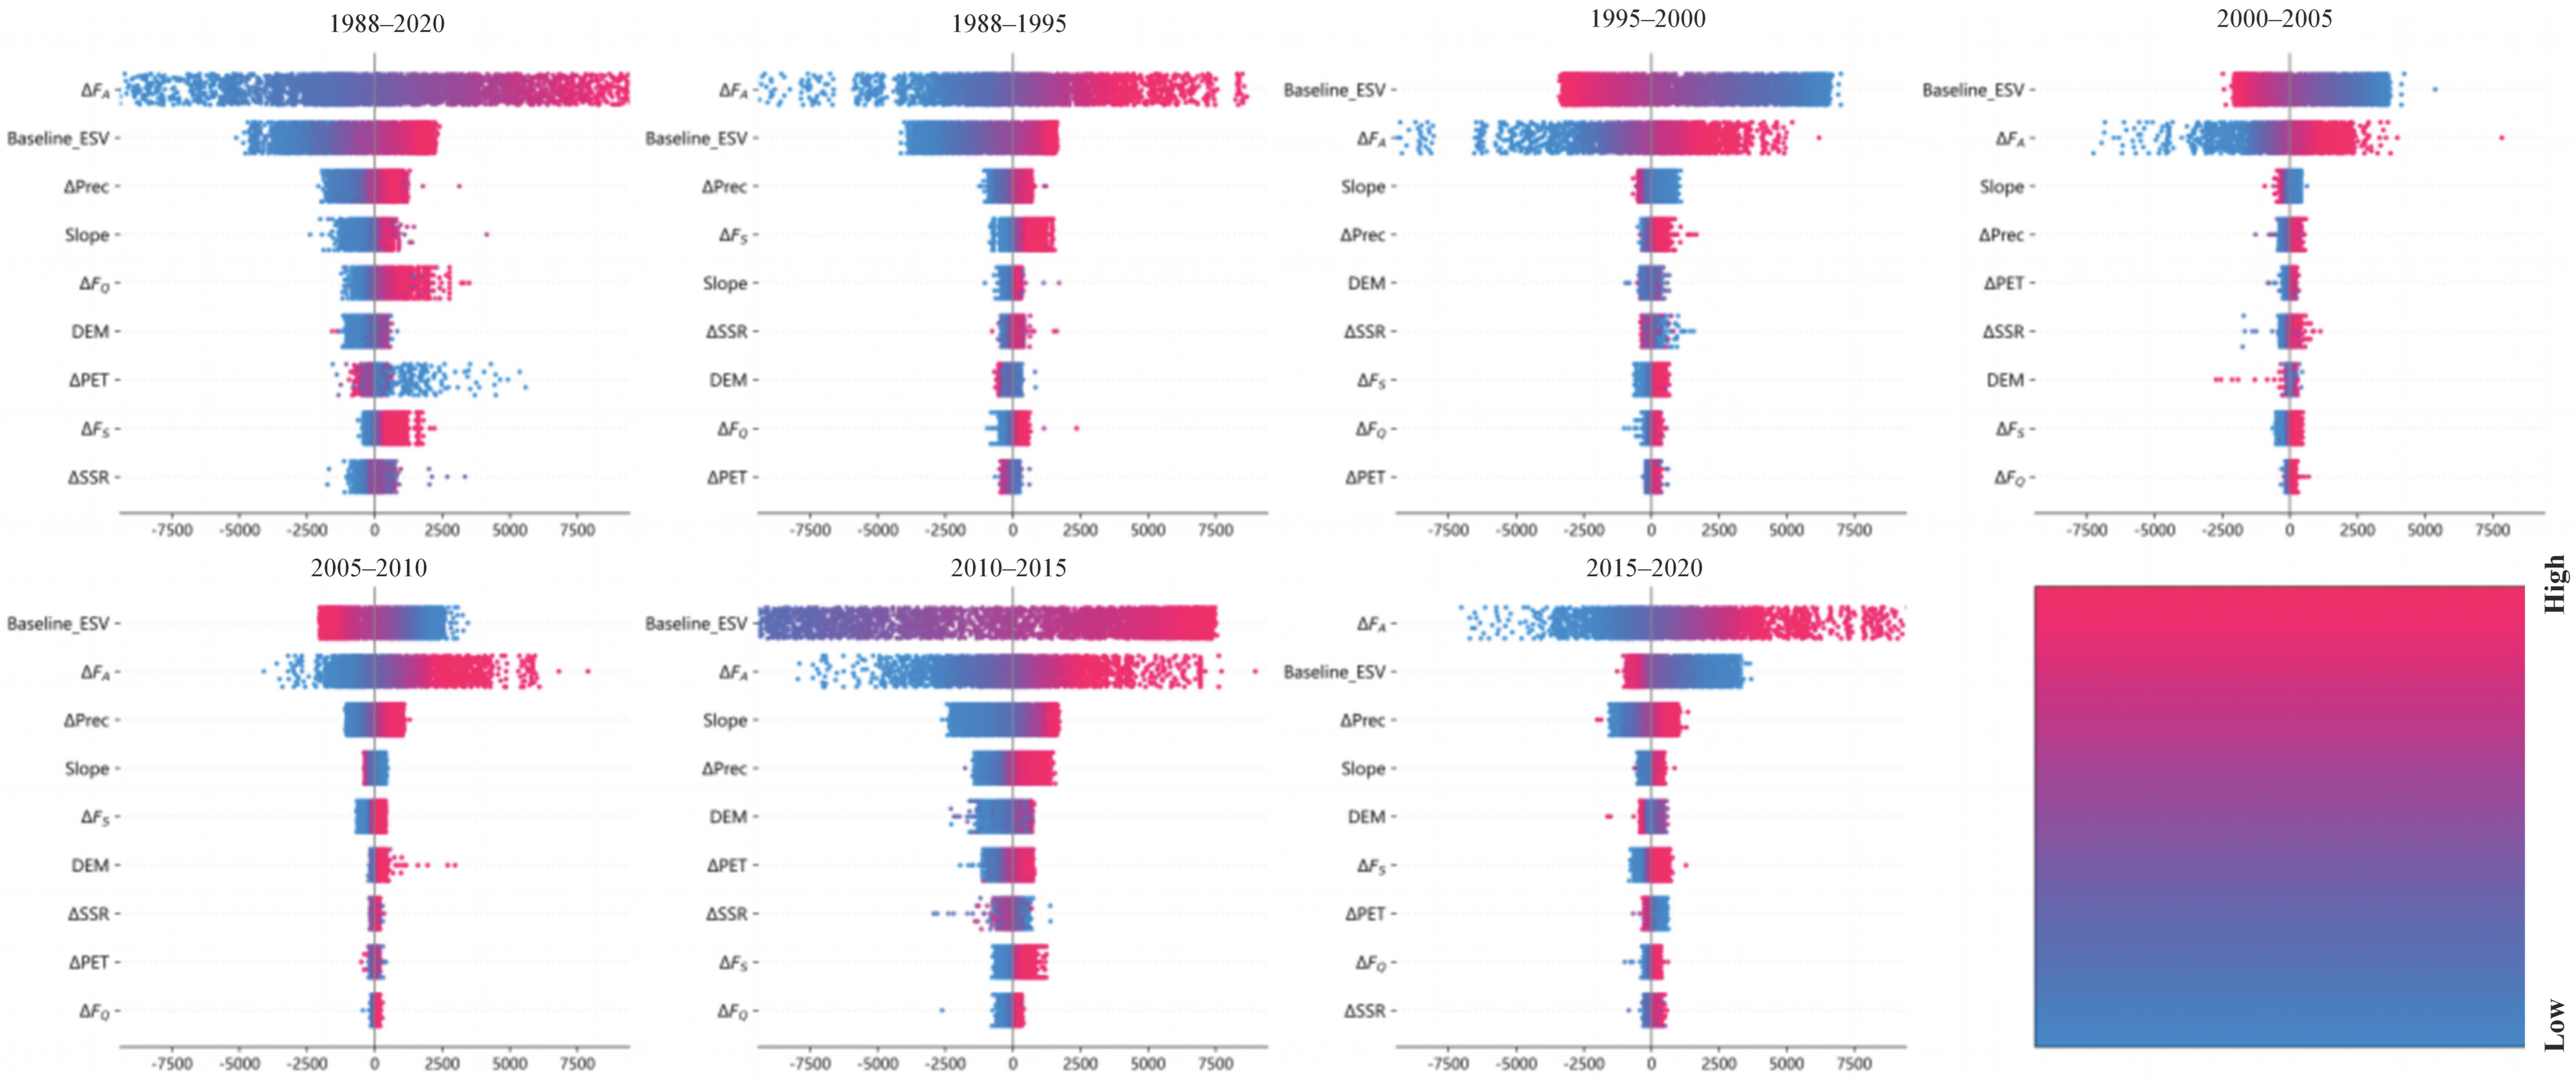
Figure 16 presents the contribution distributions of the driving factors for each time period in the form of SHAP bee swarm plots. Together with the decomposition of the net effect of forest change in Hainan Province for each period, these reveal the evolutionary pattern of the driving mechanisms. During the early period following the establishment of Hainan Province (1988–1995), the overall contribution of forest change to ESV was predominantly negative, and the decline in forest area was the primary cause of the decrease in ecosystem service value during this period. Spatially, positive contributions from forest area were concentrated mainly in the north and surrounding areas, whereas negative contributions were distributed predominantly in the west, southwest, and parts of the periphery. The positive contribution of forest quality was 3.103 billion CNY, while the negative contribution was −2.834 billion CNY; 55.76% of grid cells exhibited a negative change. Although the net value was slightly positive, the margin between positive and negative contributions was very small. The improvement in ecosystem service value driven by quality was thus marginal and insufficient to offset the losses caused by area reduction and structural degradation.
The period 1995–2005 marked a turning point in which the forest driving mechanism shifted from negative to positive (Figure 17). During 1995–2000, the proportion of grid cells with a positive contribution of the quantity indicator rose from 34.53% to 71.45%, yielding a net benefit of approximately 5.97 billion CNY from area expansion, which served as the primary driver of ecological value growth. In 2000–2005, the positive pull of quantity remained prominent, contributing 19.28 billion CNY; the proportion of grid cells with a positive contribution of forest structure jumped from 23.32% to 81.55%, with a contribution of 1.13 billion CNY; and the positive contribution of forest quality amounted to about 1.11 billion CNY, with 65% of grid cells exhibiting positive change. Across the decade, quantity, structure and quality jointly drove growth, positive areas in the central and surrounding regions tended to become contiguous, and overall ecological value recovered. During 2005–2010, the proportion of grid cells with positive contributions fell to 33.26%, and the cumulative negative impact of forest area reduction reached −29.34 billion CNY. Negative pressure was concentrated in the central-western part, with only a strip-like area in the north maintaining positive values. However, structural change was particularly pronounced: the proportion of grid cells with positive contributions reached 84.26% (the highest of the study period), with a positive contribution of 2.31 billion CNY, indicating that adjustments in species composition partly offset the losses from area reduction. During 2015–2020, the proportion of grid cells with positive contributions declined to 40.89%, yet the total positive contribution from area increase amounted to 46.01 billion CNY, yielding a net pull effect of approximately +12.33 billion CNY. Overall, forest change remained a distinctly positive driver, but a slight decline in forest quality had already constrained service efficiency.

4. Discussion

The differential inhibitory effects of the three forest dimensions on ecological risk can be explained by ecological mechanisms. Increases in forest quantity reduce risk accumulation driven by soil erosion through enhancing surface roughness and vegetation interception capacity. Improvements in forest structure—represented by a higher proportion of natural forests—promote more diverse species composition and more complex food webs; this structural complexity confers greater disturbance resistance and faster post-disturbance recovery, which explains why the proportion of natural forests exhibits the strongest risk-suppressing effect among the three factors. Forest quality reflects the overall condition of vegetation, and when quality indicators such as NDVI reach a relatively high level, the marginal regulatory space for further risk suppression becomes limited, accounting for the gradual convergence of the absolute coefficient values of the quality factor in the later part of the study period.
Between 1988 and 2020, Hainan Province experienced several major policy milestones that profoundly shaped the spatiotemporal process of forest transition. The establishment of Hainan Province as a Special Economic Zone in 1988 triggered an extensive expansion of forest quantity in the early years, driven primarily by the rapid proliferation of tropical economic plantations such as rubber and betel nut. In 1994, Hainan took the lead in implementing a logging ban on natural forests; around 1995, the forest structure indicator underwent its first notable jump during the study period (from 19.47 to 25.98), and the proportion of natural forests began to recover. The launch of the national Natural Forest Protection Program in 1998 reinforced the effect of the local logging ban. However, from 2000 to 2010, driven by the economic returns from pulpwood plantations, some natural forests in the central mountainous areas were replaced by fast-growing plantations such as eucalyptus. This resulted in a marked decline in the structure indicator between 2005 and 2010 (from 27.28 to 21.54) and a concurrent rise in landscape ecological risk, reflecting a persistent tension between policy-driven conservation and economic substitution. The proposal of the International Tourism Island strategy in 2009 intensified coastal development, temporally coinciding with the sustained risk escalation observed during 2005–2015. Following the release of the National Ecological Civilization Pilot Zone (Hainan) plan in 2019 and the establishment of the Hainan Tropical Rainforest National Park in 2021, the signals detected in our results—forest quantity recovery, stabilization of forest quality at a high level, and a sharp decline in the proportion of high-risk areas from 20.68% to 9.17% during 2015–2020—correspond to the deepening of ecological civilization institutional reforms. These analyses indicate that policy drivers have played a dual role in forest transition: conservation-oriented policies promote recovery, whereas development-oriented policies may exert phased pressure.
Many studies have emphasized that natural forests are irreplaceable in maintaining ecological functions and regional ecological security, and that plantations and secondary forests cannot fully compensate for them in key dimensions [22]. These findings provide contextual support for the spatially oriented conclusions drawn in this study—namely, that risks tend to accumulate more readily in sensitive edge zones and that a higher proportion of natural forests confers a stronger risk-suppression advantage in mountainous areas.
The two perspectives, pattern and function, reveal both consistency and divergence in their responses to forest transition. GTWR results demonstrate that forest quantity, forest quality, and forest structure (represented by the proportion of natural forests) all exert inhibitory effects on ecological risk, with the effect of natural forest proportion being stronger and more stable. This aligns theoretically with the understanding that natural forests play an irreplaceable role in maintaining ecological functions and regional ecological security, whereas plantations and secondary forests cannot offer equivalent compensation in key dimensions. From the functional perspective, ESV changes at the dominant scale are more strongly driven by fluctuations in forest area, while structure and quality act primarily as efficiency modifiers. This indicates that simply expanding forest area cannot substantially improve ecosystem service gains; simultaneous improvements in structure and quality are more likely to determine the spatial heterogeneity and periodic fluctuations in service efficiency.
This study has several limitations concerning data accuracy and indicator selection. Regarding the data, although the classification accuracy based on 30-m Landsat imagery exceeded 85% (Kappa > 0.75), the mixed-pixel problem cannot be overlooked in the complex terrain of the central and southern mountains, and local misclassification may occur in the transitional boundary zones between natural forests and plantations. The calculation of certain ecosystem services relies on interpolated meteorological station data, and the sparse distribution of stations in the central mountainous area introduces uncertainty into the spatial representativeness of the interpolation results. At the indicator level, the structural indicator only reflects the binary ratio of natural forests to plantations and does not capture internal type differences within plantations—such as the pronounced ecological functional disparities among rubber, betel nut, and eucalyptus plantations. The valuation of ecosystem services depends on parameters such as the CO2 price (28 CNY t−1) and the industrial oxygen production price (800 CNY t−1), which were held constant over the 32-year study period without considering the potential effects of inflation and market fluctuations. Despite these limitations, the core of our analysis lies in identifying relative spatiotemporal patterns and the direction of net effects; therefore, the impact on the main conclusions is limited. Furthermore, the spatial patterns and driving regularities revealed in this study can help guide management directions, but refined management still requires explicit quantitative thresholds. Future work should introduce threshold-identification methods to determine the critical values of key variables.
Consistent with and extending beyond existing international studies, our findings exhibit both concordance and further refinement. Gibson et al. [37], in a global meta-analysis of tropical regions, demonstrated that natural forests significantly outperform plantations in maintaining biodiversity and ecosystem services. Brockerhoff et al. [23] similarly showed that natural forests possess advantages in key services—such as carbon storage, hydrological regulation, and soil retention—that plantations cannot readily match. Our ESV comparison, revealing that the per-unit-area ecosystem service value of natural forests is significantly higher than that of plantations, aligns with these international conclusions. Compared with the study by Meyfroidt and Lambin [8] on forest transition in Vietnam, the pattern of “quantity as the dominant driver, structural sensitivity, and marginal convergence of quality effects” identified here echoes the Vietnamese case, where increased plantation area did not yield proportionally enhanced ecological benefits. Relative to the ecosystem services transition framework proposed by Wilson et al. [38], our study integrates ERI and ESV within a unified analysis, thereby addressing the limited attention to ecological security pressures in existing frameworks.
It should be noted that this study takes Hainan Island as a case, and the generalizability of its conclusions should be interpreted with caution under the following constraints. Hainan Island is characterised by pronounced geographic isolation typical of an island, meaning its forest ecosystem receives limited species pool supplementation from the mainland; certain conclusions—such as the magnitude of the ESV difference between natural forests and plantations—may show different quantitative expressions in mainland tropical regions. Hainan Island also benefits from the superposition of multiple national policies, so the weight of policy-driven factors in forest transition is likely higher than in regions dominated by market-driven forces. Nevertheless, the analytical framework developed here—the three-dimensional characterization of forest transition in terms of quantity, structure and quality, the dual-perspective effect assessment based on “pattern” and “function”, and the joint attribution strategy coupling GTWR with XGBoost–SHAP—is itself regionally transferable and provides a methodological foundation that can be replicated in similar tropical settings.
The primary beneficiaries of these findings include the following. (1) Policy-makers: the spatially differentiated philosophy of “consolidating the core, restoring the transition and managing the periphery” offers a quantitative basis for formulating differentiated forest management policies. (2) Conservation practitioners: the Hainan Tropical Rainforest National Park Administration can optimize the allocation of management and conservation resources according to the identified ecologically risk-sensitive zones and high-ESV core areas. (3) Spatial planning professionals: the differential impacts of the various forest dimensions on ecological effects can provide technical support for determining the priority ranking of sub-tasks within territorial spatial ecological restoration.

5. Conclusions

We take the terrestrial area of Hainan Island from 1988 to 2020 as the study area. Based on multi-temporal Landsat imagery and transfer learning classification, we systematically characterize the spatiotemporal process of forest transition across three dimensions—quantity, structure, and quality. We construct two response pathways, pattern and function, using the Landscape Ecological Risk Index (ERI) and Ecosystem Service Value (ESV, quantified through a valuation framework grounded in the Gross Ecosystem Product (GEP) accounting concept). Geographically and Temporally Weighted Regression (GTWR) and XGBoost–SHAP are then applied to examine the spatiotemporal heterogeneity of the eco-environmental effects of forest transition and to decompose the contributing factors. The principal findings are as follows:
(1)
The overall classification accuracy for each period exceeded 85%, and the Kappa coefficient remained above 0.75, confirming that the forest reclassification accuracy meets application requirements. The spatial pattern of forest quantity was generally stable, persistently exhibiting high values in the interior and low values at the periphery. Forest structure displayed a pattern of higher values in the central-south and lower values in the periphery, with its evolution dominated by reorganization in core areas and transitional zones. Forest quality maintained a stable framework of higher values in the interior and lower values at the margins, but experienced pronounced phased fluctuations; after 2005 it began a general recovery, and from 2015 to 2020 it entered a phase of stabilization at a high level.
(2)
The ERI persistently displayed a concentric zonation pattern of low values in the interior and high values in the periphery. The area proportion of low-risk zones reached its peak in 1995 and then shrank continuously; by 2020, the area proportion of high-risk zones plummeted from 20.68% to 9.17%, while medium- and relatively high-risk zones expanded markedly, together accounting for nearly 59%. Ecological pressure thus manifested as a shift and diffusion of risk forms rather than overall alleviation.
(3)
High-ESV areas largely coincided with the concentrated distribution of natural forests in the central-south. The per-unit-area ESV of natural forests was significantly higher than that of plantations, with the difference being particularly pronounced for key services such as climate regulation, soil retention, and carbon sequestration with oxygen release. This highlights the clear limitation of evaluating ecological benefits solely based on forest area expansion.
(4)
GTWR results demonstrated that forest quantity, structure, and quality all exerted stable inhibitory effects on ecological risk. The structural factor showed the strongest effect and the greatest temporal stability, the inhibitory effect of the quantity factor strengthened during the latter part of the study period, and the marginal contribution of the quality factor tended to converge. XGBoost–SHAP decomposition revealed that forest area change was the dominant driver of ESV variation, with its contribution exhibiting a bidirectional effect that varied with the direction of area change.
(5)
The spatially differentiated management philosophy of “consolidating the core, restoring the transition and managing the periphery” proposed in this study can provide a quantitative basis for departments such as the Hainan Forestry Bureau and the Department of Natural Resources and Planning to formulate differentiated forest management policies—particularly for determining differentiated ecological compensation standards for natural forests and plantations. The quantitative findings regarding the differential effects of forest quantity, structure and quality on ecological risk and ecosystem service value can supply data support for setting the priority order of ecological restoration sub-tasks in county- and city-level territorial spatial planning. The analytical framework established here—the three-dimensional characterization of forest transition in terms of “quantity–structure–quality” and the dual-perspective effect assessment based on “pattern–function”—provides a replicable analytical paradigm for tropical regions facing a similar natural-forest–plantation coexistence pattern.
In summary, the eco-environmental effects of forest transition on Hainan Island exhibit the combined characteristics of “quantity as the dominant driver, structural sensitivity, marginal convergence of quality effects, and spatial unevenness”. Regional ecological management should not rely solely on forest area expansion but must also emphasize structural optimization and balanced quality improvement. We recommend advancing management according to the spatially differentiated philosophy of “consolidating the core, restoring the transition and managing the periphery”. This study can provide a quantitative basis for the refined management and conservation of the Hainan Tropical Rainforest National Park and for province-wide ecological restoration planning, and offers an interpretable, integrated methodological framework for assessing the eco-environmental effects of forest transition in tropical regions.

Author Contributions

Conceptualization, L.L.; methodology, L.L. and Y.D.; software, Y.D.; validation, Y.D.; formal analysis, Y.D.; investigation, Y.D.; resources, L.L. and H.Y.; data curation, S.C.; writing—original draft preparation, Y.D. and S.C.; writing—review and editing, L.L.; visualization, Y.D.; supervision, L.L.; project administration, L.L., H.Y.; funding acquisition, L.L. All authors have read and agreed to the published version of the manuscript.

Funding

This research was funded by Hainan Provincial Natural Science Foundation of China (423QN324), National Natural Science Foundation of China (Grant No. 42301288), The Project of Hainan Province Science and Technology Special Fund under Grant ZDYF2025SHFZ037.

Data Availability Statement

The data presented in this study are available on request from the corresponding author. The data are not publicly available due to privacy restriction.

Conflicts of Interest

The authors declare no conflicts of interest.

Abbreviations

The following abbreviations are used in this manuscript:
ERILandscape Ecological Risk Index
ESVEcosystem service value
GTWRGeographically and Temporally Weighted Regression (GTWR) model
XGBoosteXtreme Gradient Boosting

References

  1. Thapa, S.; Gibson, D.J.; Li, R. Forest Transition Under Climate Pressure: Land Use Land Cover Change in the Greater Shawnee National Forest. Remote Sens. 2026, 18, 1079. [Google Scholar] [CrossRef]
  2. Wang, B.; He, W.; An, M.; Fang, X.; Ramsey, T.S. Natural capital accounting of land resources based on ecological footprint and ecosystem services value. Sci. Total Environ. 2024, 914, 170051. [Google Scholar] [CrossRef] [PubMed]
  3. Bottalico, F.; Pesola, L.; Vizzarri, M.; Antonello, L.; Barbati, A.; Chirici, G.; Corona, P.; Cullotta, S.; Garfì, V.; Giannico, V.; et al. Modeling the influence of alternative forest management scenarios on wood production and carbon storage: A case study in the Mediterranean region. Environ. Res. 2016, 144, 72–87. [Google Scholar] [CrossRef] [PubMed]
  4. Rammer, W.; Seidl, R. Coupling human and natural systems: Simulating adaptive management agents in dynamically changing forest landscapes. Glob. Environ. Change 2015, 35, 475–485. [Google Scholar] [CrossRef]
  5. Belay, K.T.; Van Rompaey, A.; Poesen, J.; Van Bruyssel, S.; Deckers, J.; Amare, K. Spatial Analysis of Land Cover Changes in Eastern Tigray (Ethiopia) from 1965 to 2007: Are There Signs of a Forest Transition? Land Degrad. Dev. 2015, 26, 680–689. [Google Scholar] [CrossRef]
  6. Ellis, E.A.; Angélica, N.; Martha, G. Drivers of forest cover transitions in the Selva Maya, Mexico: Integrating regional and community scales for landscape assessment. Land Degrad. Dev. 2021, 32, 3122–3141. [Google Scholar] [CrossRef]
  7. Marcos-Martinez, R.; Bryan, B.A.; Schwabe, K.A.; Connor, J.D.; Law, E.A. Forest transition in developed agricultural regions needs efficient regulatory policy. For. Policy Econ. 2018, 86, 67–75. [Google Scholar] [CrossRef]
  8. Meyfroidt, P.; Lambin, E.F. Forest transition in Vietnam and its environmental impacts. Glob. Change Biol. 2008, 14, 1319–1336. [Google Scholar] [CrossRef]
  9. Perz, S.G.; Skole, D.L. Social determinants of secondary forests in the Brazilian Amazon. Soc. Sci. Res. 2003, 32, 25–60. [Google Scholar] [CrossRef]
  10. Rudel, T.K.; Meyfroidt, P.; Chazdon, R.; Bongers, F.; Sloan, S.; Grau, H.R.; Van Holt, T.; Schneider, L. Whither the forest transition? Climate change, policy responses, and redistributed forests in the twenty-first century. Ambio 2020, 49, 74–84. [Google Scholar] [PubMed]
  11. Rudel, T.K.; Schneider, L.; Uriarte, M. Forest transitions: An introduction. Land Use Policy 2009, 27, 95–97. [Google Scholar] [CrossRef]
  12. Mather, A.S.; Needle, C.L.; Coull, J.R. From resource crisis to sustainability: The forest transition in Denmark. Int. J. Sustain. Dev. World Ecol. 1998, 5, 182–193. [Google Scholar] [CrossRef]
  13. Jianguo, L.; Shuxin, L.; Zhiyun, O.; Christine, T.; Xiaodong, C. Ecological and socioeconomic effects of China’s policies for ecosystem services. Proc. Natl. Acad. Sci. USA 2008, 105, 9477–9482. [Google Scholar] [CrossRef] [PubMed]
  14. Mather, A.S. Recent Asian Forest Transitions in Relation to Forest-Transition Theory. Int. For. Rev. 2007, 9, 491–502. [Google Scholar] [CrossRef]
  15. Lu, L.H.; Marcos-Martinez, R.; Xu, Y.Q.; Huang, A.; Duan, Y.M.; Ji, Z.X.; Huang, L. The spatiotemporal patterns and pathways of forest transition in China. Land Degrad. Dev. 2021, 32, 5378–5392. [Google Scholar] [CrossRef]
  16. Rudel, T.K.; Coomes, O.T.; Moran, E.; Achard, F.; Angelsen, A.; Xu, J.C.; Lambin, E. Forest transitions: Towards a global understanding of land use change. Glob. Environ. Change 2005, 15, 23–31. [Google Scholar] [CrossRef]
  17. Liu, J. Some opinions on forestry construction in Hainan Island. Ecol. Sci. 1983, 81–85. Available online: https://kns.cnki.net/kcms2/article/abstract?v=hUjjRxyvaVOc0OZHLZusRZIRo7ERjJU2zvH5Bs7R8Cu-VZlQInCFOsKt_0mh1ctclV3Q3L4Blp1Lu9KasGI2k7krq0-LZW48STAFkWzqfS8PCWJkVHepLHW_I3GGWSqA7UxamQTzo0Wu9fT3SLlQfar5W4WNg1A4l2k6CIjm9qWdXR8-MNeVKQ==&uniplatform=NZKPT&language=CHS (accessed on 10 July 2026).
  18. Jiang, Z.; Jiang, E. Biodiversity: The Natural Capital of Hainan Island. For. Hum. 2021, 31–33. Available online: https://kns.cnki.net/kcms2/article/abstract?v=hUjjRxyvaVO5YNydM7Yr7WXue76tzTf4JmAogoRVeW-HQnPQA-aDAgKIGoW3WC68kOuMXuISqr5eYize-ApVwrMIXYCTIm1KXE6d6YCB3A9rUgJ5-wxeWTXYPvhZKhr708QPBFaRxLIhMmRHZXQVWaNt-mlHZ-bxDRH9xTD4y3qK6hsviNGRkg==&uniplatform=NZKPT&language=CHS (accessed on 10 July 2026).
  19. Zhang, Y.; Uusivuori, J.; Kuuluvainen, J. Econometric analysis of the causes of forest land use changes in Hainan, China. Can. J. For. Res. 2000, 30, 1913–1921. [Google Scholar] [CrossRef]
  20. Zhai, D.; Xu, J.; Dai, Z.; Schmidt-Vogt, D. Lost in transition: Forest transition and natural forest loss in tropical China. Plant Divers. 2017, 39, 149–153. [Google Scholar] [CrossRef] [PubMed]
  21. Mather, A.S. Forest transition theory and the reforesting of Scotland. Scott. Geogr. J. 2004, 120, 83–98. [Google Scholar] [CrossRef]
  22. Longhui, L.; Yueqing, X.; An, H.; Chao, L.; Raymundo, M.M.; Ling, H. Influences of Topographic Factors on Outcomes of Forest Programs and Policies in a Mountain Region of China: A Case Study. Mt. Res. Dev. 2020, 40, R48–R60. [Google Scholar] [CrossRef]
  23. Brockerhoff, E.G.; Barbaro, L.; Castagneyrol, B.; Forrester, D.I.; Gardiner, B.; González-Olabarria, J.R.; Lyver, P.O.B.; Meurisse, N.; Oxbrough, A.; Taki, H.; et al. Forest biodiversity, ecosystem functioning and the provision of ecosystem services. Biodivers. Conserv. 2017, 26, 3005–3035. [Google Scholar] [CrossRef]
  24. Dezhi, W.; Penghua, Q.; Bo, W.; Zhenxiu, C.; Quanfa, Z. Mapping α- and β-diversity of mangrove forests with multispectral and hyperspectral images. Remote Sens. Environ. 2022, 275, 113021. [Google Scholar] [CrossRef]
  25. Liu, X.; Frey, J.; Munteanu, C.; Denter, M.; Koch, B. Tree species diversity mapping from spaceborne optical images: The effects of spectral and spatial resolution. Remote Sens. Ecol. Conserv. 2024, 10, 463–479. [Google Scholar] [CrossRef]
  26. Lu, L.; Sun, Z.; Qimuge, E.; Ye, H.; Huang, W.; Nie, C.; Wang, K.; Zhou, Y. Using Remote Sensing Data and Species—Environmental Matching Model to Predict the Potential Distribution of Grassland Rodents in the Northern China. Remote Sens. 2022, 14, 2168. [Google Scholar] [CrossRef]
  27. Huang, L.; Yuan, L.; Xia, Y.; Yang, Z.; Luo, Z.; Yan, Z.; Li, M.; Yuan, J. Landscape ecological risk analysis of subtropical vulnerable mountainous areas from a spatiotemporal perspective: Insights from the Nanling Mountains of China. Ecol. Indic. 2023, 154, 110883. [Google Scholar] [CrossRef]
  28. Cui, L.; Zhao, Y.H.; Liu, J.C.; Han, L.; Ao, Y.; Yin, S. Landscape ecological risk assessment in Qinling Mountain. Geol. J. 2018, 53, 342–351. [Google Scholar] [CrossRef]
  29. Ju, H.; Niu, C.; Zhang, S.; Jiang, W.; Zhang, Z.; Zhang, X.; Yang, Z.; Cui, Y. Spatiotemporal patterns and modifiable areal unit problems of the landscape ecological risk in coastal areas: A case study of the Shandong Peninsula, China. J. Clean. Prod. 2021, 310, 127522. [Google Scholar] [CrossRef]
  30. Lu, L.; Huang, A.; Xu, Y.; Marcos-Martinez, R.; Duan, Y.; Ji, Z. The Influences of Livelihood and Land Use on the Variation of Forest Transition in a Typical Mountainous Area of China. Sustainability 2020, 12, 9359. [Google Scholar] [CrossRef]
  31. Nyakatawa, E.Z.; Reddy, K.C.; Lemunyon, J.L. Predicting soil erosion in conservation tillage cotton production systems using the revised universal soil loss equation (RUSLE). Soil Tillage Res. 2001, 57, 213–224. [Google Scholar] [CrossRef]
  32. Chen, S.; Li, L.; Li, X.; Li, D.; Wu, Y.; Ji, Z. Identification and Optimization Strategy for the Ecological Security Pattern in Henan Province Based on Matching the Supply and Demand of Ecosystem Services. Land 2023, 12, 1307. [Google Scholar] [CrossRef]
  33. Ryan-Keogh, T.J.; Tagliabue, A.; Thomalla, S.J. Global decline in net primary production underestimated by climate models. Commun. Earth Environ. 2025, 6, 75. [Google Scholar] [CrossRef] [PubMed]
  34. Chen, S.; Ji, Z.; Lu, L. A Method for Identifying Key Areas of Ecological Restoration, Zoning Ecological Conservation, and Restoration. Land 2025, 14, 1439. [Google Scholar] [CrossRef]
  35. Naghdi, M.; Erfani, A. Multimodal and Temporal Modeling of Highway–Rail Grade Crossing Crash Severity Using Explainable Artificial Intelligence. Reliab. Eng. Syst. Saf. 2026, 277, 113081. [Google Scholar] [CrossRef]
  36. Wang, T.; Zhang, M.; Li, Z. Explainable machine learning links erosion damage to environmental factors on Gansu rammed earth Great Wall. npj Herit. Sci. 2025, 13, 366. [Google Scholar] [CrossRef]
  37. Gibson, L.; Lee, T.M.; Koh, L.P.; Brook, B.W.; Gardner, T.A.; Barlow, J.; Peres, C.A.; Bradshaw, C.J.A.; Laurance, W.F.; Lovejoy, T.E.; et al. Correction: Corrigendum: Primary forests are irreplaceable for sustaining tropical biodiversity. Nature 2014, 505, 710. [Google Scholar]
  38. Jane, W.S.; John, S.; Ricardo, G.; Sofía, N.A.; Sean, S. Forest ecosystem-service transitions: The ecological dimensions of the forest transition. Ecol. Soc. 2017, 22, art38. [Google Scholar] [CrossRef]
Figure 1. Study area. (a), Location of the study area within China; the study area is shown in red. (b), Remote sensing image of the study area, which encompasses only the terrestrial portion of Hainan Province, excluding Sansha City.
Land 15 01307 g001
Figure 2. Technology Roadmap.
Land 15 01307 g002
Figure 3. Differences between natural forests and plantations on Google Earth imagery.
Land 15 01307 g003
Figure 4. Spatial distribution of plantations and natural forests in Hainan Province across different periods.
Land 15 01307 g004
Figure 5. Spatial distribution pattern of forest quantity characteristics in Hainan Province.
Land 15 01307 g005
Figure 6. Spatial distribution pattern of forest structure characteristics in Hainan Province.
Land 15 01307 g006
Figure 7. Spatial distribution pattern of forest quality characteristics in Hainan Province.
Land 15 01307 g007
Figure 8. Distribution of landscape ecological risk grades in Hainan Province, 1988–2020.
Land 15 01307 g008
Figure 9. Spatial distribution of soil retention value in Hainan Province, 1988–2020.
Land 15 01307 g009
Figure 10. Spatial distribution of water conservation value in Hainan Province, 1988–2020.
Land 15 01307 g010
Figure 11. Spatial distribution of carbon sequestration and oxygen release value in Hainan Province, 1988–2020.
Land 15 01307 g011
Figure 12. Spatial distribution of climate regulation value in Hainan Province, 1988–2020.
Land 15 01307 g012
Figure 13. Spatial distribution of ecosystem service value in Hainan Province, 1988–2020.
Land 15 01307 g013
Figure 14. Interannual variation in the mean coefficients of the effects of forest quantity, quality and structure on landscape ecological risk (ERI) based on GTWR.
Land 15 01307 g014
Figure 15. Stage-specific spatial distribution of the net SHAP contributions of forest quantity, structure and quality changes to total ESV change.
Land 15 01307 g015
Figure 16. Distribution of SHAP contributions of driving factors to ESV evolution across different periods in the study area.
Land 15 01307 g016
Figure 17. Spatial distribution of net SHAP contributions of forest quantity, structure and quality changes to total ESV change across different periods.
Land 15 01307 g017
Table 1. Data description, sources and products.
Data FormatData NameSpatial
Resolution
Data Source
ExcelSocioeconomic data-Hainan Statistical Yearbook
Vector dataBasic geographic data-National Geomatics Center of China (https://www.ngcc.cn/ (accessed on 2 June 2026))
Vector dataLand cover dataset (ALCC)30 mZenodo
(https://zenodo.org/communities/gtnum/about (accessed on 2 June 2026))
Vector dataDigital elevation model (DEM)30 mGoogle Earth Engine (GEE)
Vector dataRemote sensing imagery30 mGoogle Earth Engine (GEE)
Vector dataSoil data1 kmHarmonized World Soil Database (HWSD) (https://iiasa.ac.at/models-tools-data/hwsd (accessed on 2 June 2026))
Vector dataMeteorological data1 kmInstitute of Tibetan Plateau Research Chinese Academy of Sciences (https://data.tpdc.ac.cn/home)
Table 2. Classification features and their acquisition methods.
FeatureAccess Method
BlueRemote sensing image
GreenRemote sensing image
RedRemote sensing image
NIRRemote sensing image
SWIR1Remote sensing image
SWIR2Remote sensing image
NDVI NDVI = NIR     Red NIR + Red
EVI G   ×   NIR     Red NIR + C 1   ×   Red     C 2   ×   Blue + L
NDWI Green     NIR Green + NIR
NDBI SWIR 1     NIR SWIR + NIR
ElevationDigital Elevation Model
SlopeDigital Elevation Model
Spectral coefficient of variation (CV) CV = 1 n   × i = 1 n 1 m     1 j = 1 m ( R j , i     R i ¯ ) 2 R i
G, gain factor; L, soil background correction term; C1 and C2, aerosol correction coefficients; Rj,i, reflectance of pixel j in band i; Ri, mean reflectance of band i for the target pixel within the spatial unit; m, number of valid pixels after masking; n, number of bands used in the calculation; CV, mean coefficient of variation across bands.
Table 3. Summary of classification accuracy for plantations and natural forests, 1988–2020.
Overall Accuracy (%)Kappa CoefficientNatural Forest UA (%)Natural Forest PA (%)Plantation UA (%)Plantation PA (%)
202089.20.78589.389.189.289.4
201588.00.76086.989.289.186.8
201088.20.76487.58988.987.5
200588.10.76186.689.789.686.5
200088.50.76988.188.488.888.5
199588.30.76588.587.988.188.6
198887.80.75688.087.787.687.9
Table 4. Proportion of grid cells with positive and negative SHAP contributions of forest change indicators by period (%).
QuantityStructureQualityForest Contribution
PositiveNegativePositiveNegativePositiveNegative
1988–199534.5365.4720.3479.6644.2455.7634.53
1995–200071.4528.5523.3276.6851.2948.7171.45
2000–200570.0829.9281.5518.4565.0035.0070.08
2005–201033.2666.7484.2615.7425.7374.2733.26
2010–201558.6541.3529.3870.6245.9854.0258.65
2015–202040.8959.1172.4827.5231.1168.8940.89
1988–202039.1360.8715.8784.1332.9967.0139.13
Disclaimer/Publisher’s Note: The statements, opinions and data contained in all publications are solely those of the individual author(s) and contributor(s) and not of MDPI and/or the editor(s). MDPI and/or the editor(s) disclaim responsibility for any injury to people or property resulting from any ideas, methods, instructions or products referred to in the content.