Article

Sustainable Urban Vitality Enhancement of Green View Index (GVI): A Computational Assessment Using Baidu Street View and the Spatial Hedonic Model

1
College of Arts and Media, Wuhan College, Wuhan 430212, China
2
Department of Horticulture and Landscape Architecture, Oklahoma State University, Stillwater, OK 74075, USA
*
Author to whom correspondence should be addressed.
Land 2026, 15(7), 1293; https://doi.org/10.3390/land15071293
Submission received: 6 June 2026 / Revised: 4 July 2026 / Accepted: 14 July 2026 / Published: 19 July 2026

Abstract

Digital street-view imagery delivers computationally enabled fine-grained quantitative perception of urban landscape, supporting the refined assessment of urban spatial quality, ecological livability, and socio-economic externalities for socio-environmental sustainability. Taking Shanghai as the research area and 500 m × 500 m grid cells as basic analytical units, this study adopts the Segformer machine learning segmentation algorithm to accurately extract visual features of urban green infrastructure from massive Baidu street-view images. Combined with visitor volume and real estate transaction data, this paper systematically explores vitality effects and sustainable economic compensation of Green View Index (GVI) via the spatial hedonic model. Multi-model comparison verifies that the double-logarithmic framework is optimal for street-view visual data. Two empirical models are constructed to eliminate multicollinearity and differentiate effects of integrated built environments and segmented visual elements. The results indicate that Shanghai’s vitality presents a polycentric agglomeration pattern, while GVI shows a scattered spatial distribution, with strong spatial correlation in urban cores and weak linkage in suburbs. GVI acts as a determinant of block vitality, outperforming land use diversity and commercial density. A 1% increase in the GVI improves block vitality by 6.21% in C gradient, with positive effects concentrated on outer-ring green belts and inhibitory impacts in remote suburbs. Multi-scale analysis from 500 m to 5000 m confirms green optimization brings stable residential premiums, generating sustainable economic compensation to offset urban renewal costs. This study proposes a digital-imagery-based paradigm for GVI benefit evaluation and provides empirical evidence for the planning of ecologically sustainable communities.

1. Introduction

Against the backdrop of ongoing global urbanization and growing conflicts concerning human settlement environments, the construction of urban green spaces has evolved into a core approach to advancing socio-environmental sustainable development and improving urban infrastructure systems [1,2,3,4]. Distinct from conventional plain green space, vertical greening exemplified by roadside facade vegetation and street trees is embedded within the built streetscapes of cities. It supplements urban green resources at low cost in land-scarce built-up areas and optimizes the micro-scale visual environment for pedestrians, serving as a crucial carrier for green development amid stock-based urban renewal [5,6,7]. Accordingly, vertical greening has garnered extensive attention from global urban planning and landscape regeneration academia and practitioners in recent years. Cities across Europe, the United States, Japan and South Korea have successively formulated regulatory guidelines for roadside greenery. For instance, the European Union divides vertical greening into four categories within its building retrofitting boom; Philadelphia, USA integrates vertical green facilities into building rainwater-harvesting pipelines under integrated stormwater management and incorporates the Green View Index (GVI) into block regulatory provisions. Multiple incentive instruments including zonal greening subsidies and roadside vertical greening premiums are adopted to boost green space quality improvement. As a core city in the Yangtze River Delta, Shanghai has consistently promoted roadside green renovation through a package of initiatives covering new town development, outer-ring forest belt upgrading and micro-renewal of aged neighborhoods, aiming to improve citywide visual green conditions from the practical spatial implementation perspective [8,9,10].
Green View Index (GVI) generally serves as the core evaluation indicator for vertical greening construction, with research focusing on comparative analysis of urban spatial landscape discrepancies before and after greening implementation. Conventional perceptions hold that routine supplementary vegetation planting can effectively improve urban GVI; nevertheless, practical GVI-upgrading projects are confronted with numerous practical obstacles and implementation barriers during on-site deployment. First of all, land ownership within built-up urban areas is highly complicated, and standardized quantifiable planning criteria are absent for site selection, construction scale confirmation and functional layout matching of vertical greening. No consensus has been reached on optimal GVI thresholds across multi-ring urban zones and functional districts, triggering fragmented and unregulated green space development. Second, mounting cost pressure constitutes a critical bottleneck restricting planning policymaking [11,12,13]. Expenditures including sapling procurement, on-site construction and long-term maintenance for newly added roadside vegetation keep rising, imposing heavy fiscal burdens on municipal governments. In consideration of input–output efficiency, investors and constructors remain cautious about large-scale and extensive green expansion schemes. Furthermore, neighborhood-scale GVI improvement is not an isolated spatial project. Green renovation on a single block generates cascading impacts on adjacent local vitality and land prices via multiple channels such as pedestrian agglomeration and ancillary value spillover [14,15,16,17]. In contrast, blind green expansion tends to crowd out limited urban spatial resources by squeezing spaces for commercial operations, resident daily activities and diverse public amenities, eventually leading to inefficient allocation of urban land resources [18,19,20]. Such complex positive and negative spatial spillover effects cannot be accurately identified relying on conventional planning experience, which substantially hinders the formulation of refined and evidence-based greening policies. Therefore, quantitative empirical research is urgently required to unpack the transmission mechanisms and inherent correlations among GVI, urban local vitality and land asset value, so as to provide solid theoretical foundations and empirical evidence for refined spatial arrangement and targeted investment decisions of urban vertical greening.
With the advancement of digital urban construction and computational planning technologies, retrieving neighborhood greening conditions from urban imagery has evolved into a prevalent research frontier. Early studies mostly adopted field manual photographic sampling to measure GVI, which is labor-intensive and constrained by limited sample coverage [21,22,23]. Aerial remote sensing and satellite imagery were later widely applied in green space monitoring, yet their top-down perspective fails to reflect real pedestrian-eye-level green perception [24,25,26]. Benefiting from the booming application of massive street-view big data and deep learning semantic segmentation algorithms, the automatic extraction of visual green elements from vehicle-borne street-view imagery via artificial intelligence has become a mature technical approach [27,28]. Against such practical constraints and technological progress, this study conducts empirical analysis from three dimensions: spatial correlation, influence effects and economic internalization, and proposes three core research questions:
  • Do GVI extracted from Baidu street-view imagery and local urban vitality present statistically significant spatial synergies?
  • Does GVI exert significant correlated relationships with urban local vitality?
  • Can GVI capitalize land value via the improvement of neighborhood vitality to realize economic internalization of landscape renewal costs?
By adopting computational planning methods to disentangle the coupling nexus of GVI, local vitality and land value, this research delivers empirical implications for the sustainable implementation of green infrastructure and sound fiscal operation of municipal green investment.

2. Methods

2.1. Basic Overview of the Study Area

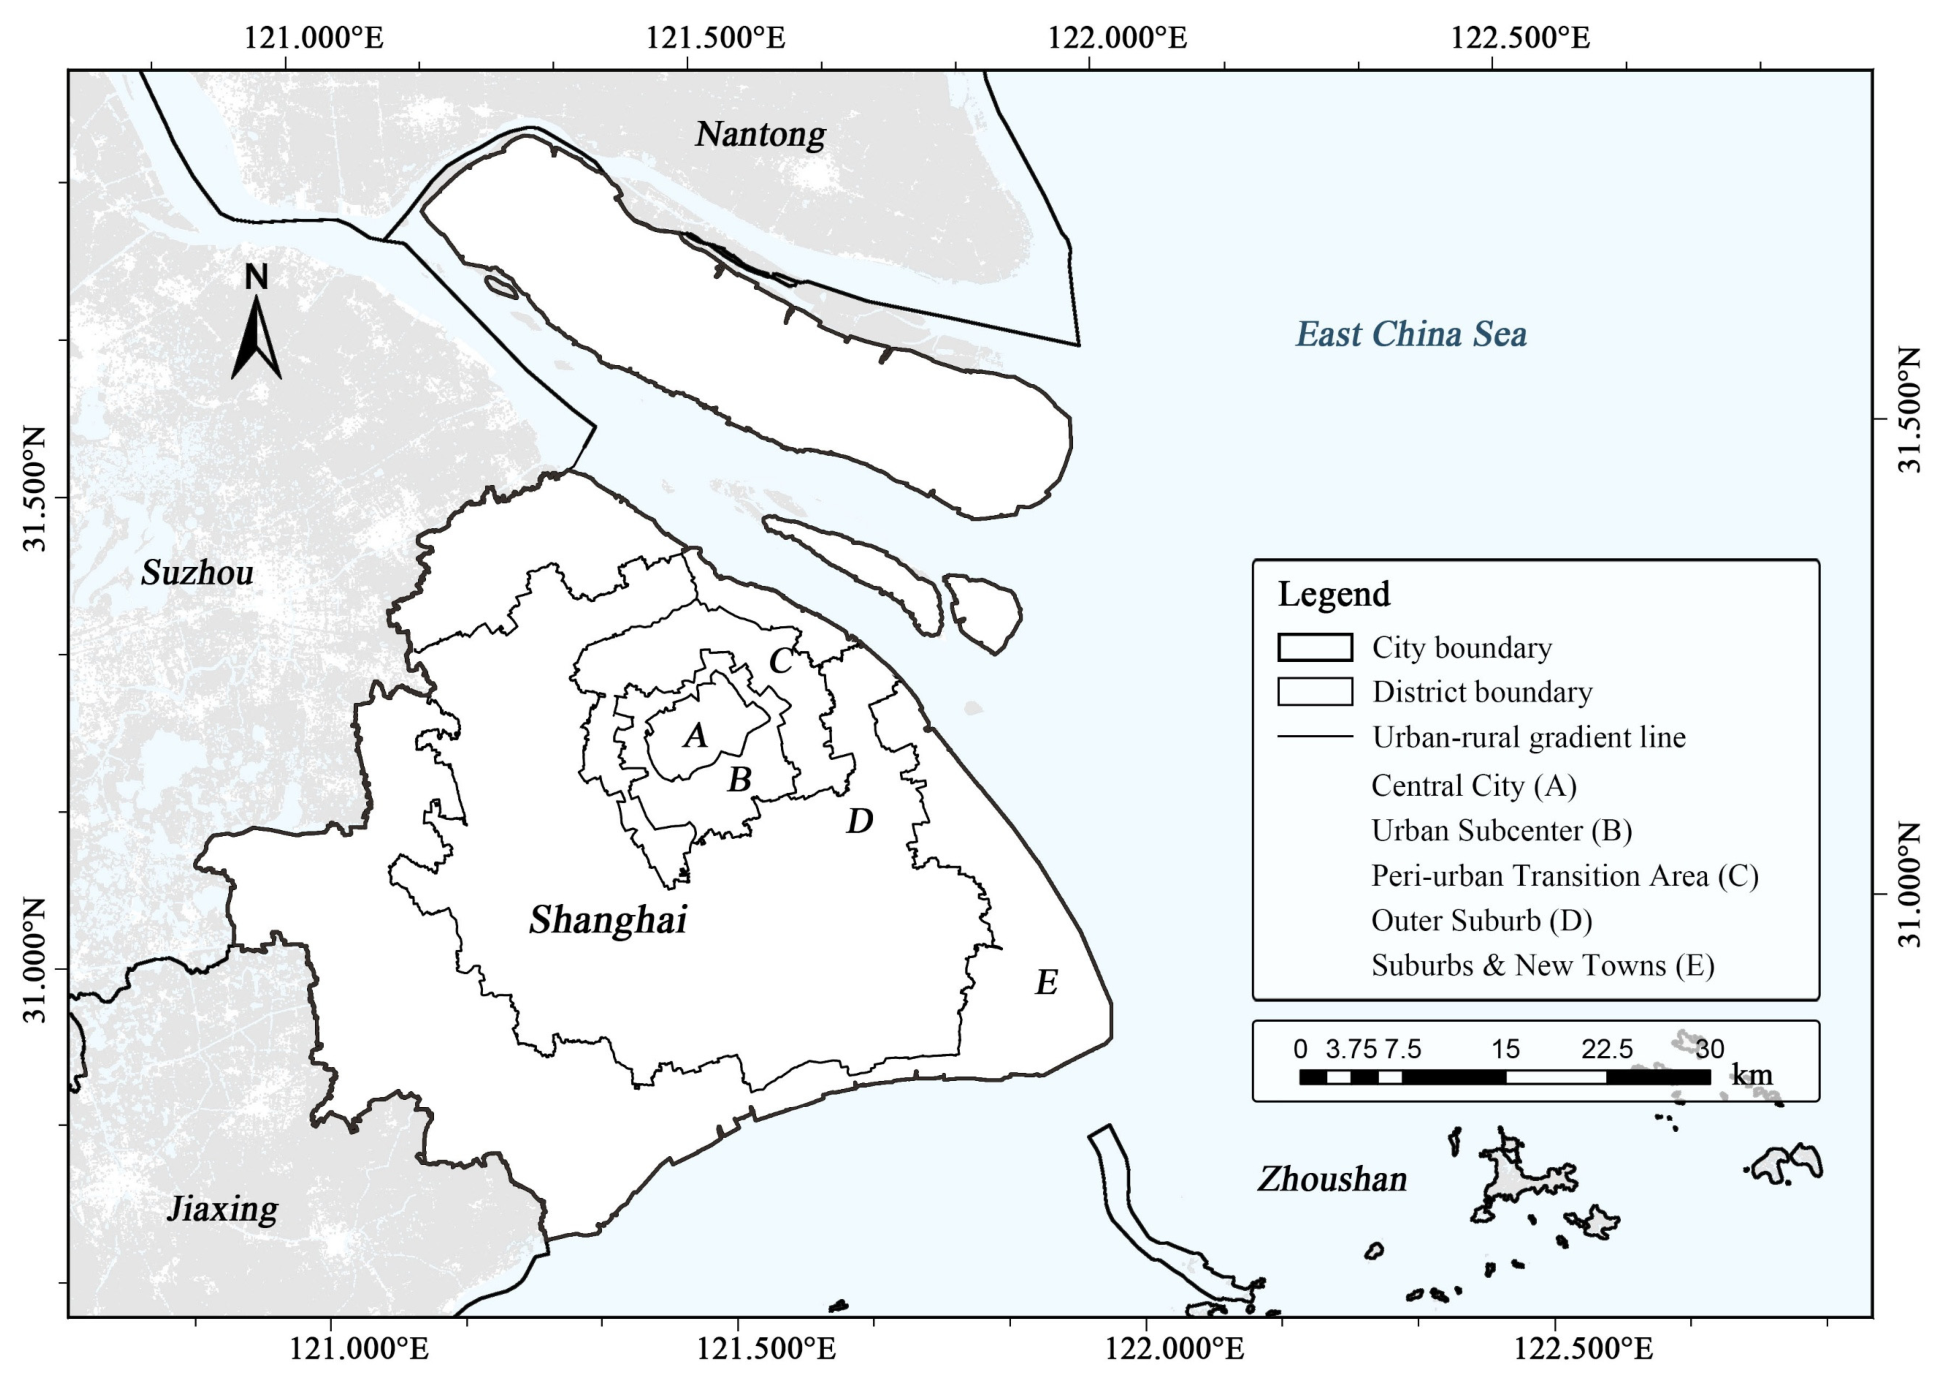
This study selects Shanghai as the research area, geographically located between 30°40′–31°53′ N and 120°52′–122°12′ E in the core coastal region of eastern China (Figure 1). As a typical megacity in China, Shanghai accommodates diversified functional spaces covering residential, commercial, industrial, public service and ecological green land uses. In terms of socioeconomic conditions and urban construction, Shanghai boasts a mature real estate market with complete, high-precision housing transaction datasets, which furnish reliable data support for quantitative analysis linking Green View Index (GVI), local vitality and land value in this research. Furthermore, the Shanghai municipal government has prioritized the construction, renewal and refined governance of vertical greening and vigorously promoted wall greening and rooftop greening projects over recent decades [29,30]. Abundant greening practices with distinct spatial differentiation and phased developmental characteristics have been accumulated, rendering Shanghai an ideal empirical case for exploring spatial patterns, value effects and optimization strategies of urban GVI.
A regular 500 m × 500 m fishnet grid is defined as the basic analytical unit for spatial statistics in this paper. Compared with irregular administrative units such as subdistricts and communities with inconsistent spatial scales, standardized fishnet grids eliminate analytical bias derived from artificially demarcated administrative boundaries and facilitate equalized and refined spatial partitioning across the entire city. The 500 m grid corresponds to residents’ daily walking perceptual scope and matches the micro-spatial layout of vertical greening, enabling accurate identification of subtle intra-urban disparities in GVI, local spatial vitality and land value. To mitigate confounding impacts from uneven urbanization intensity and reveal heterogeneous GVI effects across varied urban–rural development gradients, the whole territory of Shanghai is categorized into five gradient zones in line with the spatial framework specified in Shanghai Master Plan (2017–2035): Central Urban Area (A), Sub-center Area (B), Urban–rural Fringe (C), Outer Suburban District (D), and Remote Suburbs and New Towns (E). Such zoning establishes a rigorous spatial classification foundation for subsequent examinations of differentiated value effects and targeted optimization pathways of vertical greening across diverse urban–rural gradients.

2.2. Research Flow

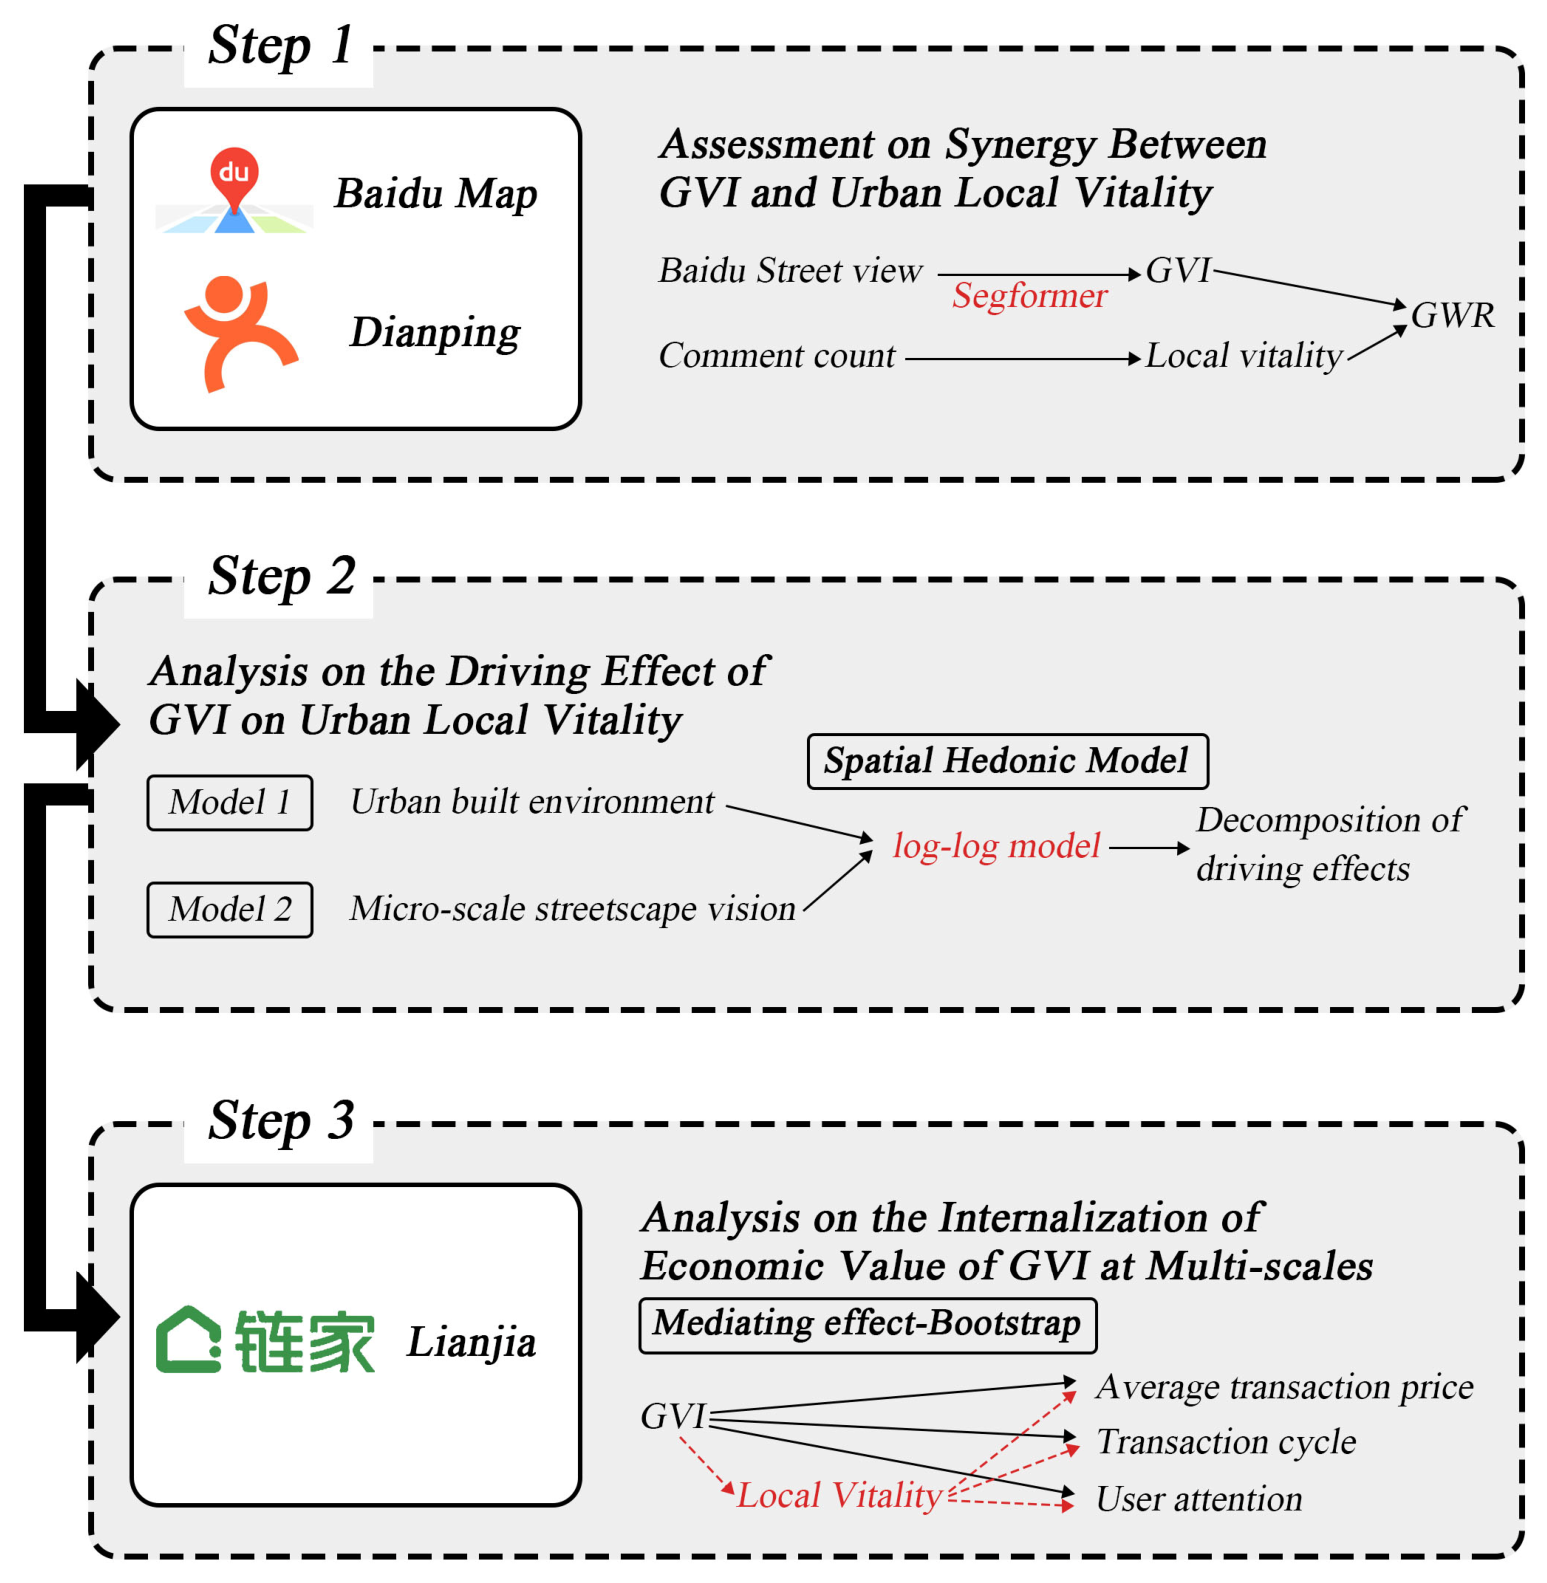
A systematic research framework is established in accordance with the three core research questions proposed in this study (Figure 2). First, to explore the spatially synergistic distribution between urban Green View Index (GVI) and local spatial vitality, this study adopts street-view imagery and commercial vitality data retrieved from Dianping as core datasets. After spatial matching and correlation analysis, the overall spatial pattern and differentiated synergy laws of GVI and neighborhood vitality across Shanghai are clarified, laying a factual foundation for subsequent effect and mechanism examinations.
Second, regarding the influence of GVI on local spatial vitality, multiple regression specifications are compared to verify methodological robustness. The optimal specification is selected as the baseline for the hedonic pricing model to construct an analytical framework quantifying the nexus between GVI and neighborhood vitality, so as to decompose GVI’s influence and precisely identify its vitality-promoting contribution.
Third, targeting the economic internalization mechanism of GVI’s ecological benefits, the Bootstrap-mediated effect model is employed for multi-scale empirical tests. Taking local vitality as the mediating variable, this paper systematically examines whether GVI boosts urban land value indirectly by improving neighborhood vitality. The chained transmission pathway is further uncovered to elaborate how ecological benefits of GVI are capitalized into urban asset value, filling existing research gaps concerning the value transmission mechanism of green view.

2.3. Synergy Assessment Method Between Green View Index and Urban Local Vitality Based on Baidu Street-View Imagery

2.3.1. Data Acquisition

Baidu street-view imagery (BSV) is adopted as the primary data source for Green View Index (GVI) quantification in this study. Featuring full spatial coverage, high temporal freshness and authentic horizontal pedestrian perspective, Baidu street-view data accurately reconstruct three-dimensional street interfaces from the eye-level view of pedestrians and remedies the limitation of top-down satellite remote sensing, which fails to depict micro-scale visual living environments [31,32,33]. Candidate sampling points were generated at a fixed interval of 50 m along the full-domain road centerlines extracted from OpenStreetMap (OSM), and all coordinate points were spatially matched to 500 m fishnet grid cells. Only coordinates with complete panoramic imagery accessible via the Baidu Map API were retained, while blurry, occluded and outdated invalid images were eliminated. Meanwhile, we set a threshold that each grid shall contain a minimum of three valid sampling points to guarantee the representativeness of the grid-averaged GVI values. Panoramic multi-directional street-view photos at all sampling sites across Shanghai are acquired via the static street-view API of the open Baidu Map Developer Platform. The exact data capture dates and API access timestamps are detailed in Appendix A.3.
Local vitality indicators are derived from the Dianping platform. As a dominant daily consumption and recreation-oriented life-service platform for Shanghai residents, Dianping contains full-category urban POIs and customer visitation records covering shopping, catering, entertainment and public services, which sufficiently reflect block functional configuration and crowd agglomeration patterns [34,35,36]. Different from conventional static POI datasets, user comment records objectively reflect the actual intensity of on-site visits and consumption activities [37]. Therefore, the total volume of user comments generated between 2021 and 2025 within each grid cell is adopted as the core proxy variable to quantify crowd activity at the neighborhood level. Full details regarding data collection time and contents are provided in Appendix A.3. The Octopus crawler tool is applied to batch scrape full-range Dianping POI information and matched comment data over Shanghai, supplying big behavioral data for subsequent spatial pattern identification and quantitative vitality modeling.

2.3.2. Data Analysis

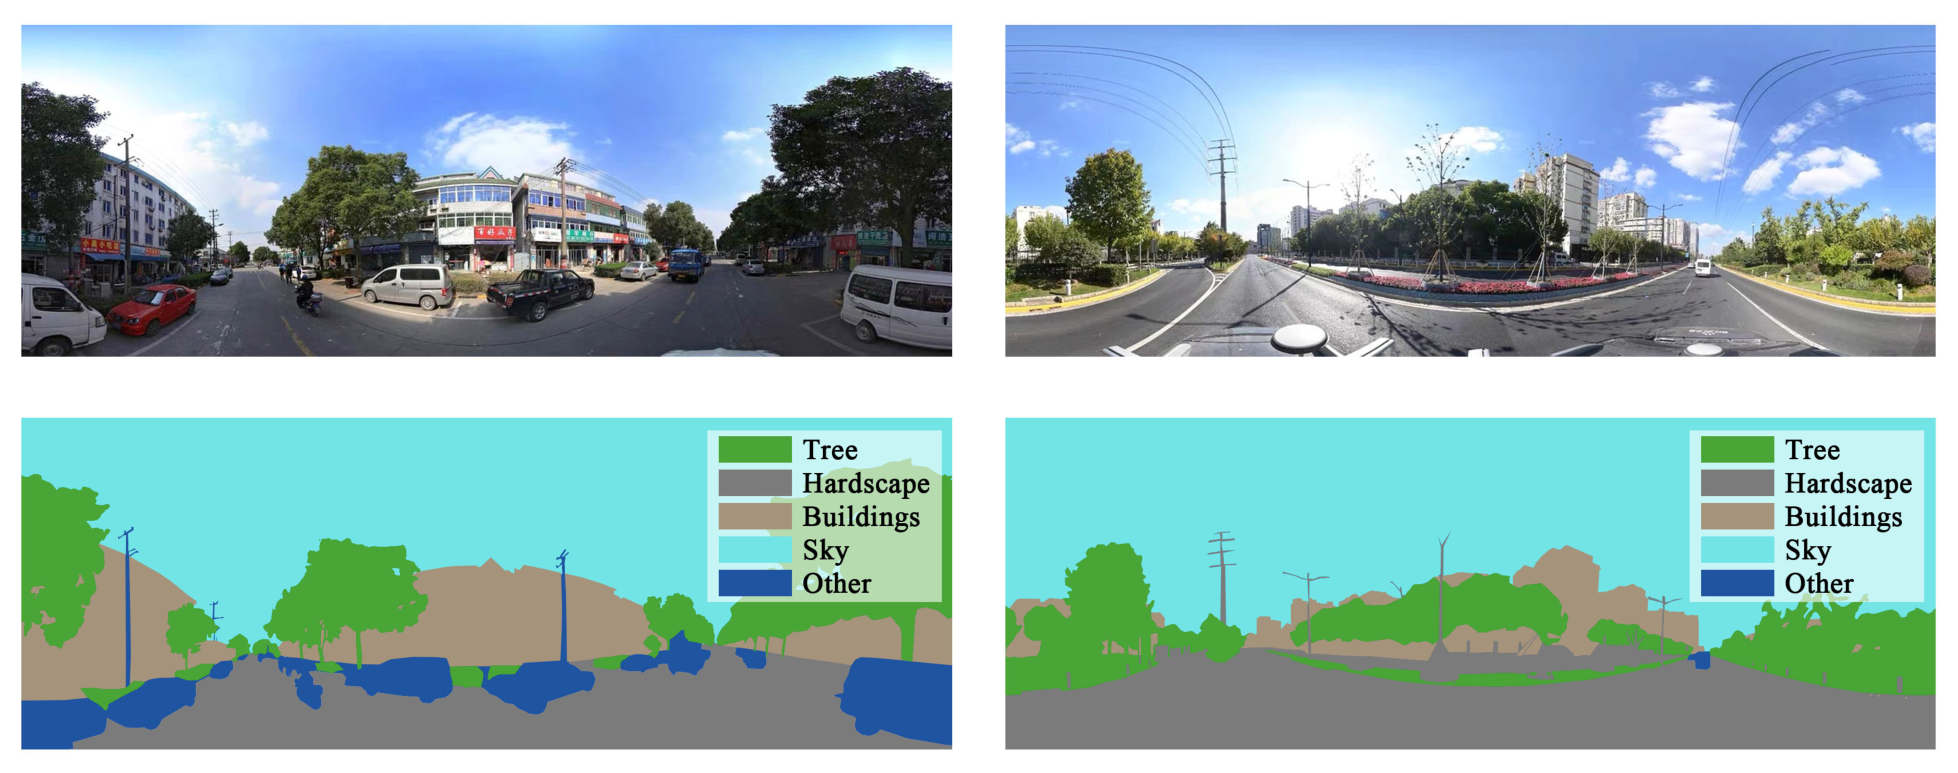
The Segformer deep learning semantic segmentation algorithm is implemented for visual feature interpretation and GVI calculation of Baidu street-view images. Compared with classic segmentation architectures including U-Net and FCN, Segformer has merits of lightweight architecture, precise edge detection and outstanding generalization performance, making it more suitable for multi-class feature segmentation under complicated urban contexts [38,39,40]. Single perspective photographs fail to capture pedestrians’ full horizontal field of view. By segmenting panoramic images into multi-angle sub-images, we can fully record roadside vertical greenery, which aligns with the core connotation of Green View Index (GVI) measured from the pedestrian perspective. All original 360° equirectangular panoramic images undergo distortion correction first, followed by segmentation into four standard perspective sub-images with a fixed field of view before being fed into the Segformer model. This processing pipeline unifies the perspective characteristics of input images to match the model’s training dataset, eliminating land cover classification errors induced by stretching distortion. Afterwards, the pre-trained Segformer model executes pixel-wise semantic segmentation to automatically categorize four dominant landscape elements: green vegetation, hardscape, building and sky (Figure 3). The pixel proportion of green coverage is finally counted to compute site-specific GVI and supplementary visual landscape metrics, realizing refined digital quantification of micro streetscape environments. For the collected Dianping vitality dataset, systematic data cleaning and vitality aggregation are performed by removing duplicated locations, invalid store entries and abnormal outliers, before spatially matching all processed records into the predefined 500 m grid analytical units.
The Geographically Weighted Regression (GWR) model is introduced to quantify spatial synergies and local heterogeneity between GVI and block vitality, as well as the continuous geographic variation in their correlation across urban space. Traditional global regression only generates uniform average coefficients and cannot capture spatially varied correlational patterns and synergy disparities among neighborhoods. By embedding geographic coordinates into regression parameters, GWR allows coefficient estimates of dependent and explanatory variables to vary continuously over space, effectively depicting local fluctuation of variable correlation magnitudes [38,41]. Hence, GWR is well-suited for investigating non-stationary spatial synergy between street visual greenery and local vitality, with the specification expressed as:
y i = β 0 u i , v i + k = 1 p β k u i , v i x i k + ε i ,
where y i denotes the local vitality of grid cell i ; x i k is the corresponding GVI value; u i , v i represents the geographic coordinate of sample i ; β 0 u i , v i is the location-specific intercept; β k u i , v i refers to spatially varying regression coefficient measuring local synergy intensity between GVI and neighborhood vitality; ε i stands for the random error term.

2.4. Analysis on the Correlative Impacts of GVI on Urban Local Vitality Based on Hedonic Model

2.4.1. Data Acquisition

The correlation between street-scale GVI to local vitality is jointly disturbed by multi-dimensional built-environment attributes, whereby a single regression specification tends to suffer from omitted variable bias and multicollinearity, hindering the precise isolation of the independent contribution of green streetscapes. To disentangle influence pathways across diverse factor categories and mitigate collinearity-induced bias, two sets of regression models are constructed to quantify the correlative impacts of GVI separately from macro built-environment and micro streetscape visual dimensions. Data sources and selection rationales for all variables are summarized in Table 1.
Model 1 centers on the macro-scale built environment by incorporating demographic density, land-use composition, commercial provision, traffic accessibility and aggregate GVI to estimate the comprehensive influence of green space conditioned upon conventional urban spatial attributes. Residential population density reflects resident carrying capacity at the block level; land-use mixing degree characterizes functional diversification; commercial facility counts are screened from original Dianping POI taxonomy to match real-world urban business distribution; road density of primary and secondary roads as well as tertiary and quaternary roads quantifies disparities in neighborhood accessibility. By contrast, Model 2 targets micro-scale street facade features, extracting ratios of greening (GVI), hardscape, buildings and sky from Segformer segmentation outputs. This design enables separate identification of heterogeneous impacts from individual visual elements and supports multi-layer mechanistic interpretation spanning macroscopic built context down to microscopic street perception.

2.4.2. Data Analysis

As a canonical econometric tool for quantifying marginal impacts of explanatory variables, the spatial hedonic model has been widely adopted in policy appraisal and asset valuation research. Capable of controlling for confounding covariates, the model accurately isolates the marginal correlation magnitude of core predictors and satisfies this study’s objective of measuring GVI’s marginal effects on local vitality. Given that functional form specification substantially determines regression precision and interpretability, four mainstream specifications are tested to select the optimal formulation and avoid specification bias in R studio 4.5.3: linear model, semi-log model, log–log (double-log) model, and Box–Cox transformed model. The linear model assumes constant marginal effects across all observations with straightforward formulation yet struggles to accommodate non-linear spatial associations [42,43]. The semi-log specification interprets percentage changes in dependent variables induced by unit shifts in independent variables and fits partial elasticity analysis. The log–log model directly yields elasticity coefficients for marginal effect interpretation. The Box–Cox transformation improves data normality and alleviates heteroskedasticity via monotonic variable transformation. Optimal model selection is implemented via integrated comparison of goodness-of-fit statistics, residual normality diagnostics and coefficient statistical significance to finalize the most appropriate functional form for streetscape and vitality datasets.

2.5. Economic Internalization Analysis of GVI Value via Multi-Scale Bootstrap-Based Mediation Effect Test

2.5.1. Data Acquisition

Urban residential transaction attributes serve as reliable proxies for urban land value [44,45]. Residential resale transaction data are retrieved from the Lianjia second-hand housing platform, which archives granular transaction records, market attention and deal duration with rich attribute dimensions and high data authenticity. Valid second-hand housing transactions across Shanghai over 2021–2025 are screened after eliminating abnormal deals, vacant housing listings and invalid observations. Three core indicators, namely average housing transaction price, transaction cycle and online user attention, are selected to reflect block-level asset value, spatial liquidity vitality and market popularity, respectively, constructing a complete dataset for empirical tests on multi-scale economic compensation mechanisms.

2.5.2. Data Analysis

The Bootstrap mediation test is adopted to quantitatively identify the causal chain spanning GVI improvement, local vitality elevation and residential price premium, and verify the self-sustaining economic compensation loop of landscape renewal. Different from conventional stepwise regression-based mediation approaches, the Bootstrap resampling method releases the strict normality prerequisite, featuring superior statistical robustness and test power to reduce estimation bias, which fits well with the non-linear attributes of urban spatial big data [46,47]. In this study, resampling is repeated for 1000 iterations, and bias-corrected confidence intervals are applied to judge the statistical significance of mediating effects. The core specification of mediation model is specified as Formula (2):
Y = c X + ε 1 M = a X + ε 2 Y = c X + b M + ε 3
where Y denotes residential economic indicator (dependent variable); X is Green View Index (core independent variable); M represents block local vitality (mediator); c stands for total effect; coefficients a and b measure path-specific mediating effects; c refers to direct effect.
To further capture the scale heterogeneity of green space value spillover, concentric ring buffers ranging from 0 m to 5000 m with an increment of 500 m are constructed using ArcGIS Pro 3.5 for multi-scale mediation tests. Combined with the pre-defined urban–rural gradient zoning, this study examines whether elevated GVI can realize economic internalization and offset landscape renovation costs via stimulating neighborhood vitality across diverse spatial extents, thereby forming a sustainable economic circulation.

3. Results

3.1. Synergy Assessment Between GVI and Local Urban Vitality in Shanghai Using Baidu Street-View Imagery

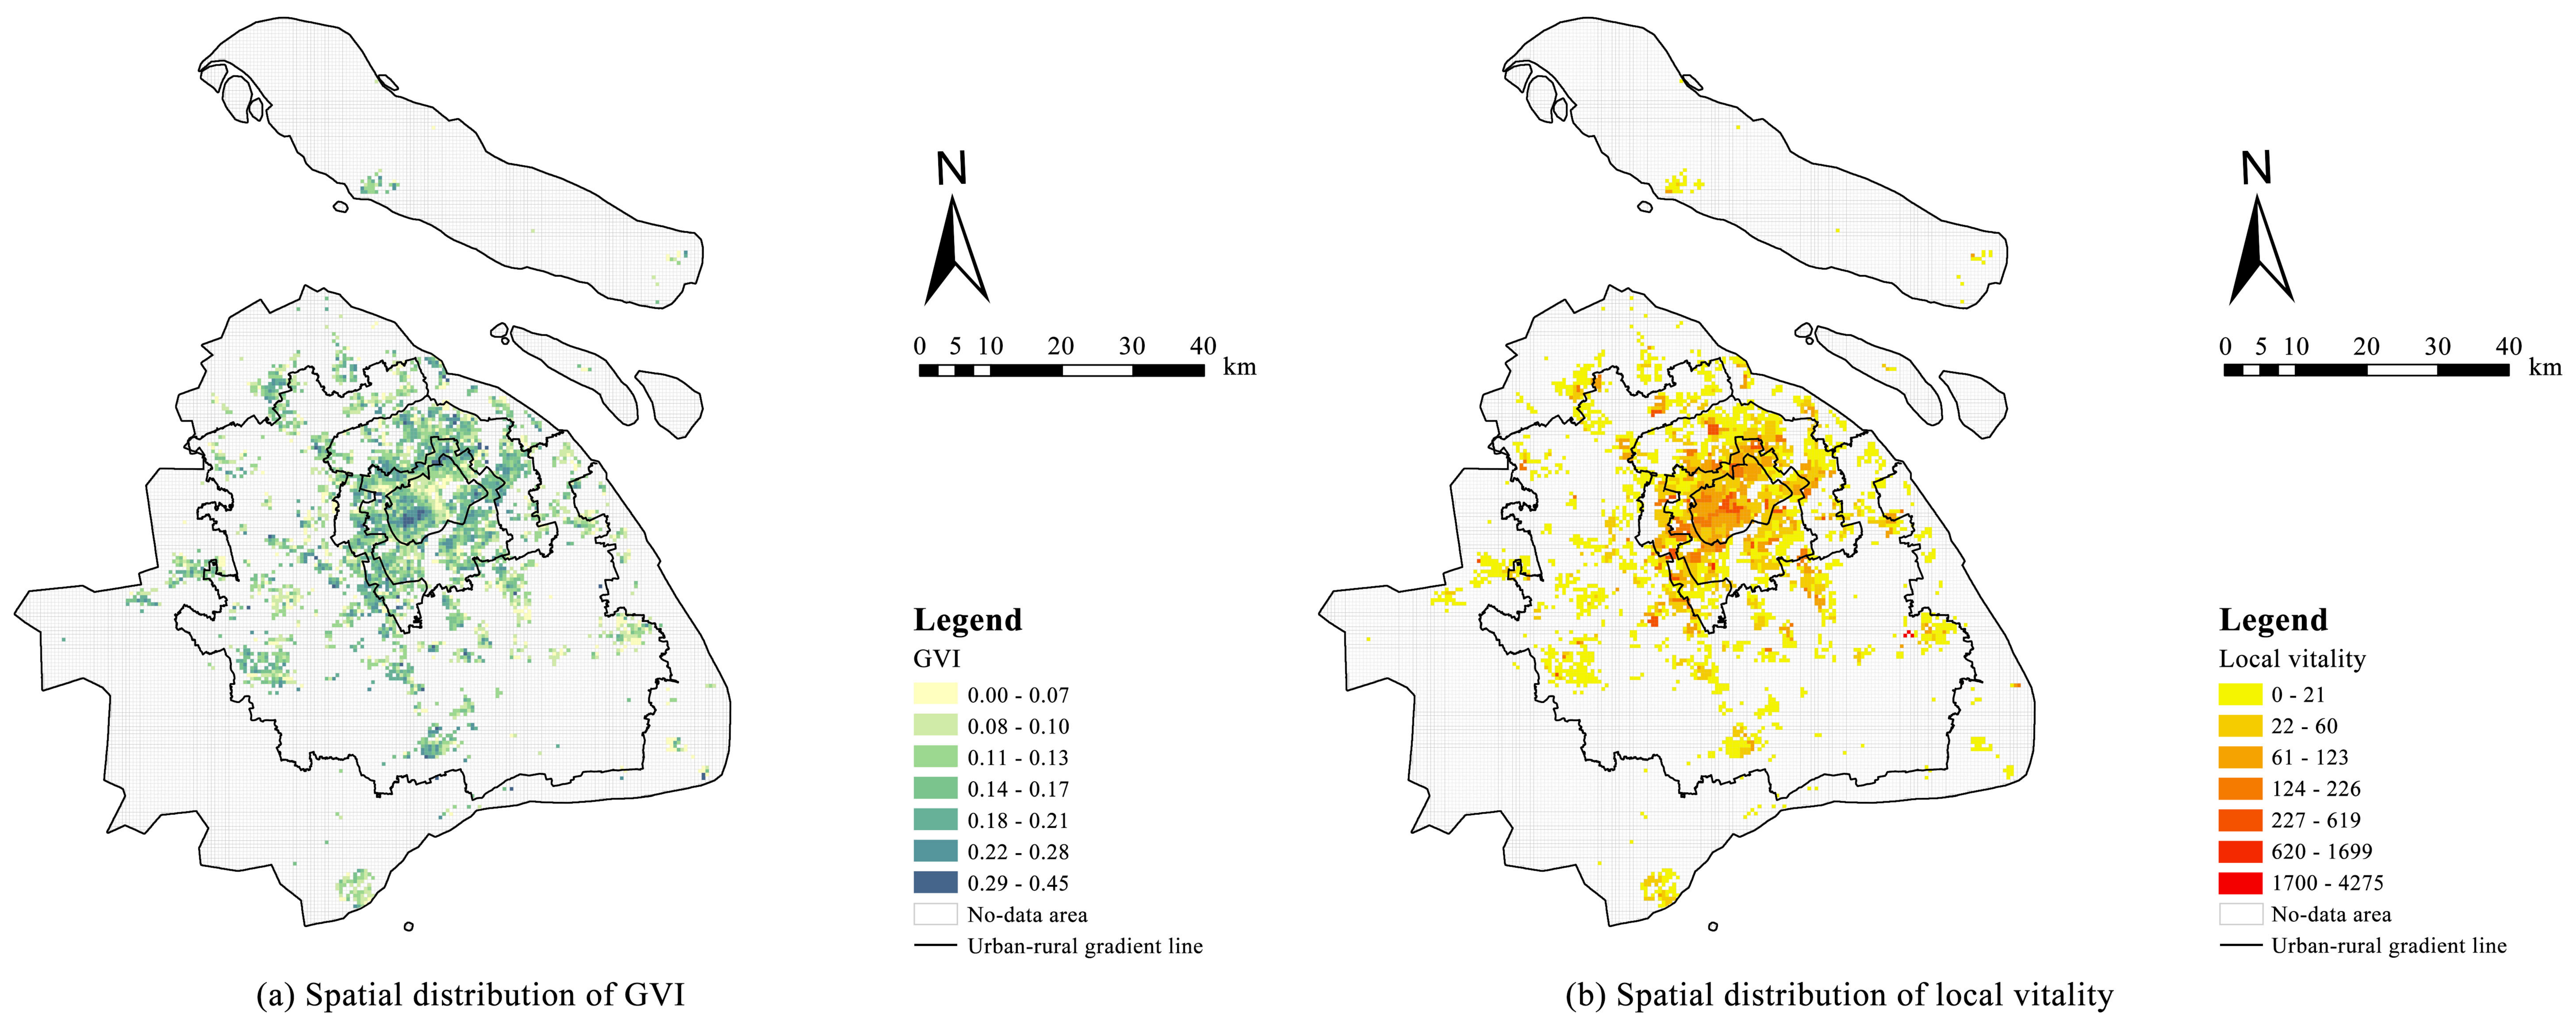
Based on Baidu street-view imagery and multi-dimensional vitality data from the Dianping platform, this study quantifies and spatially visualizes citywide Green View Index (GVI) and local urban vitality across Shanghai; their overall spatial patterns are displayed in Figure 4. Spatial clustering and attribute analysis of all grid samples reveal that street-perspective GVI exhibits a scattered polycentric distribution with localized agglomeration, lacking extensive high-value clustering across the whole city. From the perspective of urban–rural zoning gradients, the western Central Urban Area (Zone A) hosts Shanghai’s most prominent GVI hotspots, spatially overlapping with the Hengshan Road–Fuxing Road Historic Conservation District. Dominated by low-rise garden villas and low-density block layout, this district features open building spacing and limited vertical occlusion. Dense street trees and courtyard vegetation with stable seasonal canopy coverage generate abundant in-view greenery at pedestrian eye level, yielding distinctly higher GVI values than other central urban segments. Beyond this core high-GVI cluster, sporadic GVI hotspots are scattered across Sub-central Area (B), Urban–rural Fringe (C), Outer Suburban District (D) and New-built Suburban Towns (E), yet both magnitude and clustering scale remain markedly lower than those of the Hengfu Historic District.
In contrast to the dispersed spatial pattern of GVI, local urban vitality presents stronger agglomeration and more pronounced spatial differentiation, featuring intensive clustering in central cores plus isolated scattered hotspots in peripheral areas. High-vitality zones are heavily concentrated within mature central business districts and functional clusters in the central city with favorable spatial continuity and dense aggregation. By contrast, only fragmented, isolated vitality patches emerge across Zones C, D and E; large-scale contiguous vitality agglomeration is absent, leading to striking vitality gaps between urban and suburban territories.
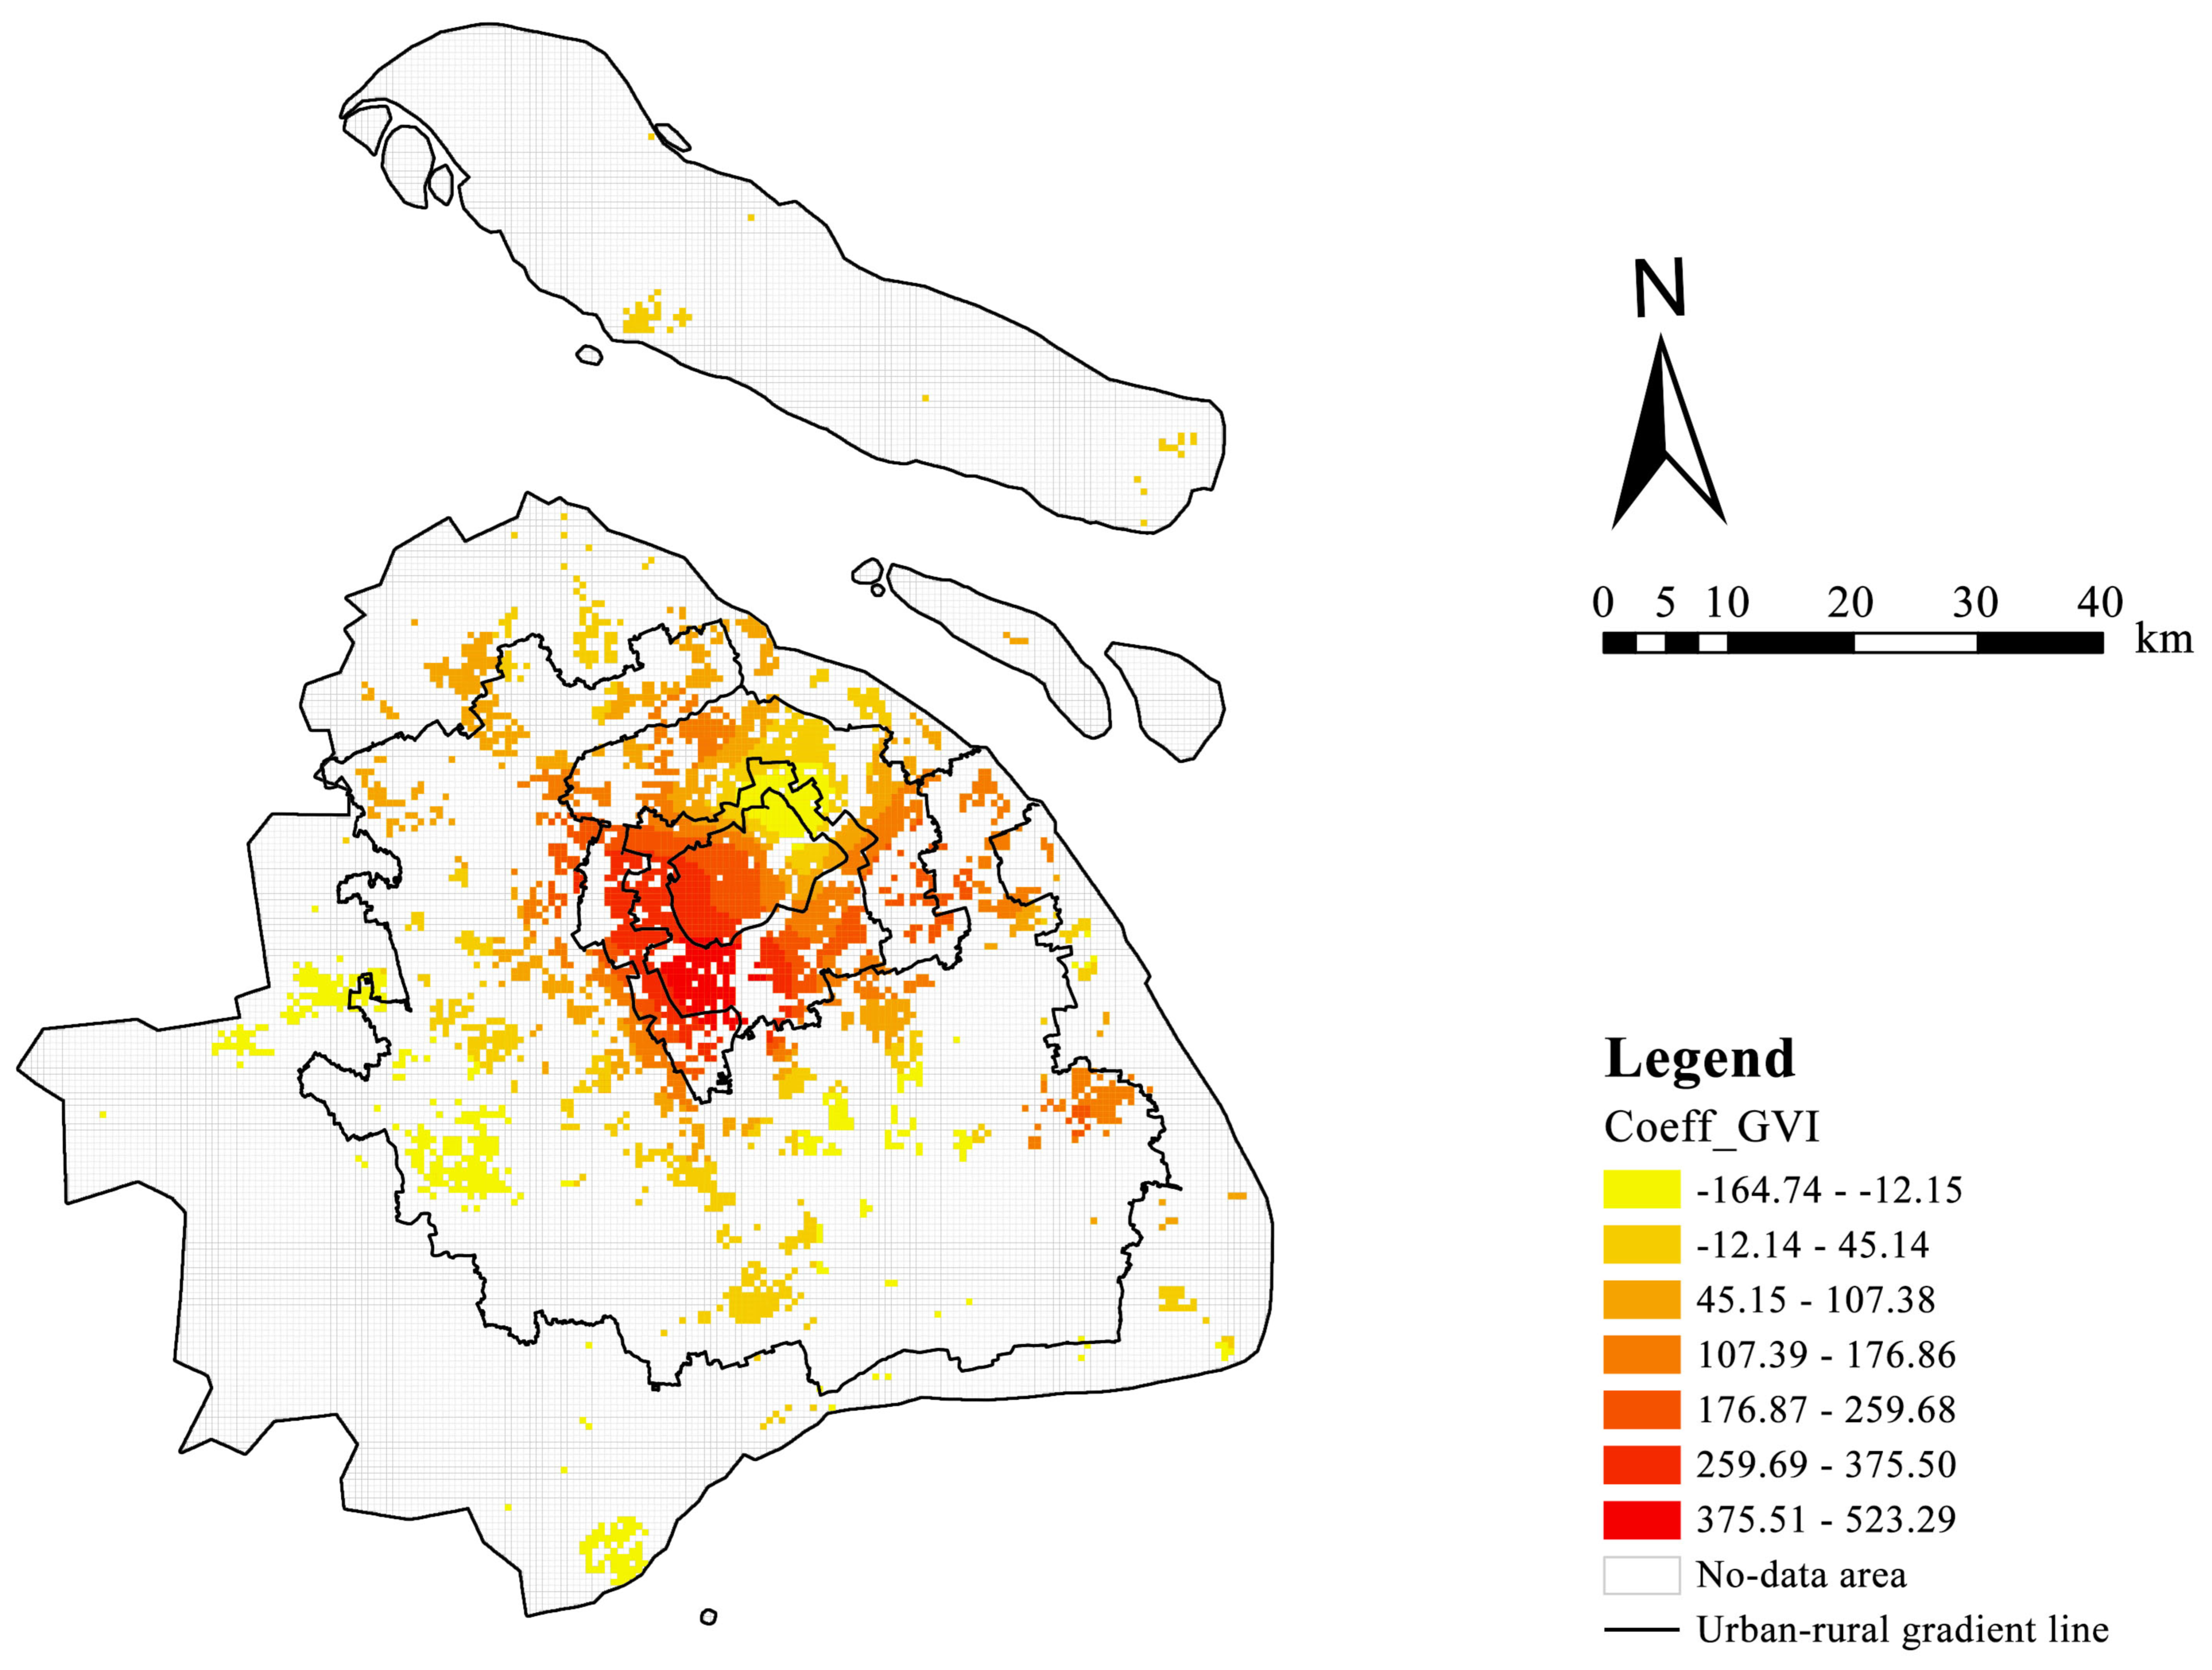
The Geographically Weighted Regression (GWR) model is employed to detect heterogeneous spatial correlations between GVI and local vitality, with regression outputs and synergy patterns illustrated in Figure 5. GWR estimation confirms significant spatial non-stationarity in the positive linkage between the two variables. Zones with strong positive correlations concentrate in the western Central Urban Area (Zone A) and extend southwestward in a belt-shaped pattern. Within such areas, elevated street-level GVI aligns well with clustered human activities, commercial amenities and public-space vitality, generating mutually reinforcing coupling between GVI and urban vitality. By comparison, correlation coefficients turn generally insignificant across the rest of central city and all suburban gradient zones (B, C, D, E), showing negligible synergistic coupling. One plausible explanation is that high-density historic central districts such as Huangpu District are dominated by intensive construction, compact residences and clustered commerce, where premium, transport accessibility and industrial agglomeration predominate vitality formation and dilute the marginal visual benefits of roadside greenery. Although suburban districts possess abundant underlying green stock, insufficient resident concentration, monotonous commercial formats and incomplete public service facilities restrict the transformation of ecological advantages into population inflow and spatial vitality.

3.2. Analysis of GVI’s Impacts on Local Urban Vitality Based on Hedonic Pricing Model

3.2.1. Comparative Performance of Alternative Regression Specifications

To eliminate specification bias and guarantee the robustness and interpretability of empirical outputs, four mainstream econometric specifications (linear, semi-log, log–log and Box–Cox transformed models) are compared in terms of model fitness. Optimal specification is selected comprehensively based on goodness-of-fit indicators (R2, adjusted R2) and information criteria (AIC, BIC). Higher R2 and adjusted R2 denote stronger explanatory power, whereas lower AIC and BIC correspond to superior fitting precision, fewer redundant parameters and better overall statistical performance. Table 2 summarizes fitting statistics for Model 1 and Model 2 across all four functional forms.
Empirical results demonstrate that the conventional linear specification yields the poorest performance in both model groups, with extremely low R2 and adjusted R2 ranging only between 0.02 and 0.03 alongside substantially inflated AIC and BIC values. Such evidence indicates that the linear assumption fails to capture sophisticated non-linear associations between streetscape visual attributes and local vitality, resulting in severely limited explanatory capacity. Both semi-log and Box–Cox models achieve evident fitness improvement relative to the linear form yet retain inherent drawbacks: the semi-log model only allows unilateral logarithmic transformation and cannot fully characterize elasticity patterns among variables; despite improving the normality of raw data, Box–Cox transformation is prone to overfitting discrete visual landscape data, impairing out-of-sample generalization and incurring substantially higher information cost. By contrast, the log–log specification delivers the most robust comprehensive performance across Model 1 and Model 2. Within Model 1, the log–log model attains the maximum R2 (0.33) and adjusted R2 (0.33) together with the minimum AIC (14,535.83) and BIC (14,585.08). For Model 2, it maintains favorable goodness-of-fit and optimal information criterion metrics with superior overall stability compared with competing alternatives. From a theoretical perspective, relationships between street-level GVI, visual landscape composition and neighborhood vitality follow typical elastic marginal effects rather than simple linear monotonic changes. The log–log framework is well-suited for quantifying percentage-based elasticities and precisely calculating marginal vitality increments corresponding to proportional GVI growth, perfectly matching the study’s objective of quantifying influence magnitudes. Synthesizing statistical superiority and theoretical compatibility, the log–log spatial hedonic model is selected as the core empirical specification for subsequent regression analysis.

3.2.2. Log–Log Regression Results for Full Sample and Multi-Tier Urban–Rural Zones

Based on the foregoing optimal specification selection, the log–log spatial hedonic model is adopted for citywide regression to precisely quantify the practical and marginal contribution of street GVI to block-level local vitality. Full-sample benchmark regression outcomes are first reported to identify the general influence of GVI on neighborhood vitality. To streamline the main text and concentrate on core findings, heterogeneous estimation results across five urban–rural gradients (central urban area, urban sub-center, peri-urban fringe, outer suburb and new towns) are compiled in the Appendix A.1 and Appendix A.2.
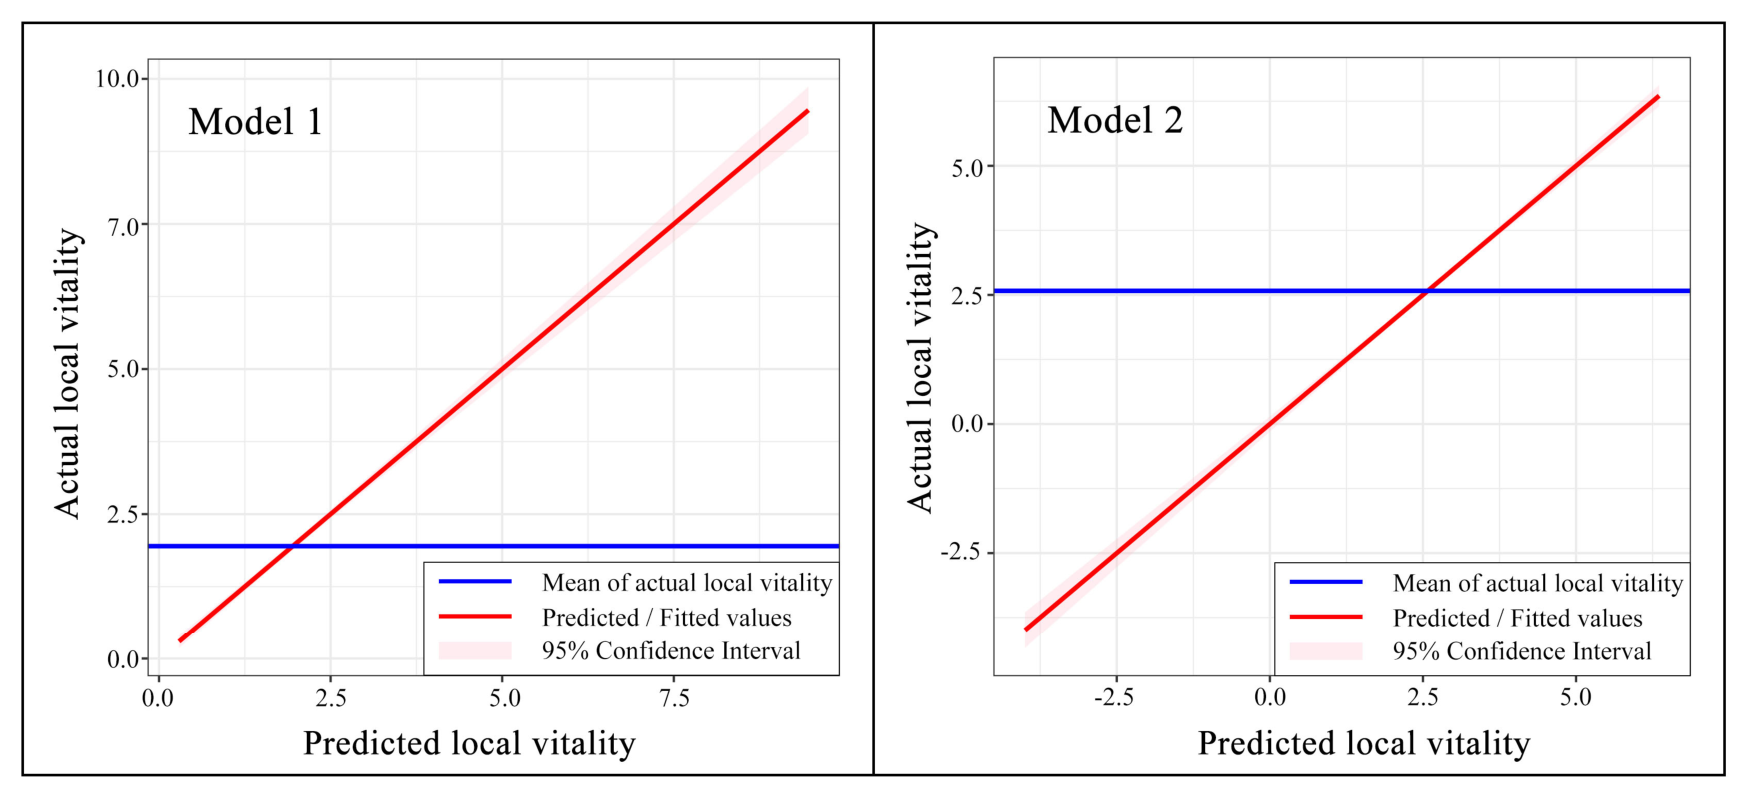
Full-sample regression results of Model 1 are presented in Table 3 and Figure 6. The model achieves satisfactory goodness-of-fit and adequately accounts for spatial disparities in local vitality conditioned on macro built-environment covariates. As the core explanatory variables of Model 1, macro built-environment attributes include residential population density, land-use mixing degree, quantity of commercial amenities and multi-class road density, which have long been recognized as fundamental determinants of pedestrian agglomeration and commercial prosperity. Remarkably, after controlling for a comprehensive set of macro built-environment confounders, the regression coefficient of street GVI exceeds those of conventional predictors such as population density, land-use diversification and commercial provision, solidifying GVI as a critical latent driver of contemporary neighborhood vitality whose boosting effect cannot be neglected.
However, the regression results of Model 1 show that the p-value of GVI fails to reach statistical significance. According to the estimation results stratified by urban–rural gradients, GVI exerts significant impacts on vitality only within Gradients A, C and E. Specifically, GVI presents boosting effects in Gradients A and C while an inhibitory effect in Gradient E, with the most pronounced correlation observed in Gradient C. For Gradients A and C, a 1% increase in GVI corresponds to approximately 3.12% and 6.21% growth in neighborhood vitality respectively. Such prominent elasticity implies that pedestrian-oriented green visual perception enhances neighborhood attractiveness, concentrates foot traffic and stimulates both commercial and residential vitality. Upgrading existing street green landscapes thereby delivers substantial vitality-promoting benefits. Distinct from conventional urban regeneration strategies prioritizing industrial restructuring, public facility improvement and population relocation, micro-scale enhancement of in-view green volume efficiently elevates neighborhood vitality without drastic restructuring of urban land use and functional layout, furnishing robust empirical evidence for refined, low-cost and sustainable block renewal schemes. Such demand for refined urban regeneration is particularly prominent in the central urban gradients where GVI exerts positive correlative effects on neighborhood vitality.
The log–log spatial hedonic model is further applied to implement full-sample regression for Model 2, whose estimation outputs are summarized in Table 4 and illustrated in Figure 6. Satisfactory overall goodness-of-fit enables the model to reliably identify the influence patterns and heterogeneous impacts of micro streetscape visual components on local vitality. Centering on four core street visual elements, namely GVI, hardscape, building facades and sky view, the regression outcomes of Model 2 reveal that GVI delivers neither the maximum nor minimum marginal influence, with its average coefficient showing a slight negative value. This outcome is distinctly inconsistent with the strong positive vitality correlation of GVI observed in Gradients A and C under Model 1. For Gradient C in Model 2, a 1% rise in GVI only generates a 2.15% growth in neighborhood vitality. Such discrepancy originates from divergent covariate setups and inter-element interaction mechanisms. Model 1 is constructed under a macro built-environment framework that filters out confounding interactions among micro streetscape features and isolates the long-term positive contribution of green infrastructure. In comparison, Model 2 simultaneously incorporates highly correlated visual attributes of buildings, hardscape and sky with intensive spatial covariation; the negative standalone coefficient of GVI statistically arises from mutual constraint and coupling among multiple streetscape constituents. Furthermore, pooled average regression coefficients capture only overall mean effects and conceal heterogeneous dynamic trends across variable ranges, whereas marginal fitting curves accurately quantify positive marginal returns from progressive GVI growth after eliminating biased samples from built-up blocks with scarce greenery and excessive hardscape. These findings demonstrate that isolated GVI improvement fails to boost neighborhood vitality independently; rational proportional allocation of diverse street interfaces and coordinated spatial configuration between buildings and green space are indispensable to fully unlock the positive vitality-driven potential of green view.

3.3. Economic Internalization Analysis of GVI Value via Multi-Scale Bootstrap Mediation Test

To systematically verify whether the improvement of street Green View Index (GVI) can realize economic internalization and cost compensation of landscape renewal through boosting local vitality, stratified Bootstrap mediation tests are implemented for three core real estate indicators (average housing transaction price, transaction duration and online user attention), based on multi-scale concentric buffers ranging from 0 m to 5000 m and the predefined five-category urban–rural zoning framework. The overall empirical results reveal that GVI imposes no direct unilateral influence on urban land value but transmits its economic impact predominantly via an indirect pathway mediated by neighborhood vitality. Statistically significant mediation effects covering full and partial mediation are detected across most spatial buffers and urban–rural subregions, which verifies that local vitality functions as an indispensable mediating bridge linking green landscape upgrading and the capitalization of urban spatial economic value. Increases in street GVI can stimulate pedestrian agglomeration to internalize economic returns of landscape renovation, supplying solid empirical evidence for cost compensation of municipal green construction and the establishment of self-sustaining urban renewal circulation.
Distinct heterogeneous mediation patterns are observed across the three housing transaction metrics (Table 5). GVI improvement generates prominent vitality-mediated premium effects on average transaction price and user attention, whereas its mediating influence on housing transaction cycle remains marginal. Specifically, average residential price is dominated by partial mediation, indicating that GVI contributes to housing appreciation through dual channels: a direct capitalization effect on land value and an indirect premium driven by enhanced neighborhood vitality. By contrast, user attention is mainly governed by full mediation, which implies GVI cannot independently raise market attention; all its premium benefits materialize exclusively via the agglomeration of local crowd vitality. However, housing transaction duration is barely affected by the vitality-mediated pathway. Such discrepancy demonstrates that GVI and neighborhood vitality predominantly determine asset pricing and market preference rather than transaction cycles. Homebuyers and investors incorporate scenic amenities into housing premiums and market enthusiasm, while transaction cycles are largely dominated by long-run macro market fluctuations and less sensitive to micro street-level visual greenery.
Multi-scale buffer estimations confirm significant vitality-mediated transmission across all spatial extents, yet mediation magnitude follows a typical inverted U-shaped curve alongside rising buffer radius (Table 6). The strongest mediation concentrates within 3000–4000 m buffers, peaking at the 3500 m threshold, which is identified as the optimal spatial range for GVI to generate value spillover via vitality growth. This inverted-U trend conforms to urban spatial spillover theory: within small near-distance buffers, green amenities deliver limited localized economic dividends insufficient to trigger large-scale vitality clustering and housing appreciation; around the optimal 3500 m threshold, environmental benefits of greenery, population congregation and spatial value spillover achieve optimal coupling to maximize economic compensation returns; when buffer scope further expands toward remote peripheries, marginal gains from landscape improvement diminish gradually, accompanied by growing disturbances from spatial heterogeneity and uneven public facilities, thereby depressing mediation intensity and forming the observed inverted-U evolutionary pattern.
Zonal regression across five urban–rural gradients identifies Central Urban Area (A), Urban–rural Fringe (C) and Outer Suburban District (D) as core zones with statistically meaningful mediation effects, alongside evident inter-zone disparities in the proportion of full versus partial mediation (Table 7). Outer Suburban District (D) exhibits a remarkably higher share of full mediation and stands out as the dominant zone for indirect vitality-driven value transmission. Central Urban Area (A) features mature commercial amenities, solid inherent vitality and high baseline housing values, resulting in diminishing marginal returns from green upgrading and prevalent partial mediation with limited incremental premium from landscape improvement. Located in the transitional functional belt, Urban–rural Fringe (C) balances complete urban infrastructures and ecological endowments, yielding stable and significant mediation with well-coordinated linkage among greenery, vitality and housing price. In contrast, Outer Suburban District (D) suffers from pre-existing insufficient population agglomeration and monotonous streetscape, with loose built-environment constraints on property prices. Upgraded street green view efficiently fuels neighborhood vitality, and nearly all resultant housing appreciation is realized indirectly via vitality growth, explaining its dominant full-mediation structure and highlighting greater economic compensation potential and sustainable renewal value for suburban green-space investment.

4. Discussion

4.1. Heterogeneous Synergy Between GVI and Urban Vitality Within Central Shanghai

Synthesizing spatial distribution patterns of Green View Index (GVI) and local vitality alongside GWR-based synergy estimations, the central urban area serves as the core carrier of urban functions, human activities and commercial agglomeration with pronounced internal heterogeneity in GVI–vitality coordination, which contrasts sharply with loose coupling across suburban zones. Such divergence reveals inherent conflicts and synergistic laws linking GVI and human activity in dense megacity core districts. Overall, central Shanghai fails to realize citywide homogeneous coordination between green view and neighborhood vitality; instead, it presents a fragmented spatial pattern featuring intensive coupling in sporadic hotspots and mismatched synergy across most built-up areas, demonstrating both unique benefits and practical constraints of GVI improvement within high-density built environments.
The Hengshan–Fuxing Historic Conservation District in western central Shanghai achieves the most favorable GVI–vitality synergy across the whole city as a rare zone featuring mutually reinforcing gains between streetscape greenery and local prosperity. Benefiting from low-density block fabric, low-rise garden-villa layout and open street space, this district possesses superior inherent green resources. Continuous dense roadside vegetation, courtyard greenery and vertical facade greening form intact street-level green corridors and generate top-tier GVI values citywide. By contrast, the remaining high-density central districts suffer from prominent mismatches characterized by robust vitality yet weak green-view coordination. Dominated by intensive central business quarters and compact residential blocks, these zones feature high land exploitation intensity, dense building coverage and extensive impervious pavement with limited street green view. Local vitality is predominantly governed by locational superiority and supporting amenities, substantially diluting the marginal contribution of GVI. Consequently, spatial correlation between GVI and neighborhood vitality weakens considerably, restricting the vitality-stimulating capacity of urban greenery and leading to insufficient synergy.

4.2. GVI Surpasses Selected Macro Built Environment Indicators in Terms of Influencing Local Vitality

Full-sample results from the log–log spatial hedonic model verify that, after controlling canonical macro covariates including residential population density, land-use mixing degree, commercial agglomeration and multi-tier road accessibility, street-level GVI exerts statistically stronger positive impacts on local vitality than multiple conventional urban spatial indicators; specifically, in Gradient C, a 1% rise in GVI yields even a 6.21% vitality uplift. The existing literature on urban vitality generally attributes crowd congregation and commercial prosperity to macro structural factors: population concentration, functional diversification, diversified business formats and transport convenience. Conventional urban planning practices have long prioritized population introduction, mixed land-use development, commercial district construction and road network densification to boost neighborhood vitality, while green space is commonly classified as an ancillary ecological amenity rather than a core vitality determinant. Most prior studies posit that urban greenery primarily delivers auxiliary ecological, esthetic and livability benefits with limited direct influence on pedestrian flow and commercial performance, remaining subordinate to location, demographic and functional attributes. This study revisits the pivotal role of GVI in vitality formation within dense megacities and delivers fresh empirical evidence and practical references for stock-oriented urban regeneration in Shanghai.
Empirical findings overturn conventional macro-dominated cognition and confirm that pedestrian-perspective GVI outperforms several macro built-environment variables in stimulating neighborhood vitality, a trend rooted in contemporary stock-based urban transition and shifting resident preferences in mature megacities represented by Shanghai. Urban demographic layout, land-use configuration, commercial distribution and transport frameworks have largely stabilized across Shanghai, leaving scant room for further macro functional optimization; marginal vitality gains from population density and mixed land use gradually diminish and converge to a plateau. Meanwhile, residents and consumers have shifted their residential and consumption preferences from location- and function-dominated choices toward experience- and environment-oriented decisions. Micro perceptual factors including walkability, visual comfort and street ambiance become critical determinants of pedestrian visits, prolonged stays and repeated consumption. As the most intuitive and sensitive streetscape metric from eye-level observation, GVI alleviates cramped visual feelings caused by excessive impervious construction, improves walking pleasure and spatial attractiveness, and ultimately drives significant crowd agglomeration, endowing GVI with superior marginal vitality-enhancing value under stock built-up contexts.
The conclusions carry strong practical implications for Shanghai’s urban governance. As Shanghai fully transitions toward stock upgrading and micro-renewal, large-scale land acquisition, land readjustment, commercial reconstruction and massive road renovation become economically and spatially unsustainable with diminishing vitality returns from traditional macro planning instruments. Against such backdrop, vertical greening-driven GVI promotion constitutes a refined regeneration pathway with low investment, minimal construction disturbance and high spatial adaptability, enabling vitality growth without altering land ownership or original functional layout. The verified superiority of GVI over partial macro indicators supplies quantitative foundations for future block renewal, streetscape upgrading and vertical greening deployment in Shanghai. Accordingly, urban planning governance ought to moderately shift the focus from a macroscopic functional layout to microscopic visual governance and incorporate street GVI into core indicator systems for vitality promotion and refined urban spatial management.

4.3. Threshold Range for GVI’s Economic Internalization and Spillover via Mediating Local Vitality

Based on multi-scale Bootstrap mediation estimation, this study elaborates the chained transmission mechanism linking street Green View Index (GVI), neighborhood vitality and urban land value, verifying that GVI facilitates the economic internalization and spatial spillover of landscape renewal benefits by stimulating pedestrian congregation. Most of the existing literature on landscape capitalization and housing premium adopts fixed-buffer radius or city-wide aggregate analysis while overlooking scale restrictions and diminishing marginal returns of green amenity spillover. Although a handful of studies have identified effective spillover boundaries for large urban parks and extensive ecological green spaces at macro scales, few have systematically quantified multi-scale threshold characteristics for pedestrian-level street green view quality. This paper fills such research gap and reveals that GVI’s economic internalization effect rises gradually from low levels across small buffers, peaks within the 3000–4000 m band with the optimal threshold at 3500 m, and declines continuously beyond this cutoff, following an evident inverted-U trajectory. Such threshold feature confirms a confined effective spatial range for landscape value spillover, consisting of a lower accumulation threshold restricting near-distance benefit diffusion and an upper boundary limiting long-distance marginal effectiveness.
From a mechanistic perspective, muted mediation effects within small near-field buffers (0–2500 m) originate from the micro and localized nature of street vertical green renovation. Green upgrading within an individual block only exerts limited geographic radiation and fails to trigger city-wide environmental improvement and steady market recognition at fine spatial scales. Within compact geographic units, housing prices are predominantly shaped by location advantage, public amenities and building attributes, which suppress the external premium signal of street greenery and interrupt the vitality-mediated transmission pathway, resulting in fewer full and partial mediation cases and restrained economic capitalization capacity. As the buffer radius expands toward 3000–4000 m, environmental dividends, improved walkability and crowd agglomeration generated by localized green upgrades accumulate spatially and amplify vitality concentration. Stable market recognition of landscape upgrading facilitates tight chained coupling among GVI, human agglomeration and residential appreciation, peaking at 3500 m and enabling efficient cost compensation and economic internalization of landscape investment. Once the spatial coverage exceeds 4000 m, rising spatial heterogeneity, disparate functional zoning and uneven public resource endowment dilute marginal spillover gains from local green improvement, gradually weakening mediation magnitude and shaping the documented inverted-U decay pattern.
For practical urban planning, the quantified threshold provides critical scale reference for refined, low-cost and sustainable block green regeneration in Shanghai. Conventional street green projects are often implemented discretely at block or community levels without scientific spillover-radius assessment, frequently leading to inefficient outcomes featuring substantial green investment, insufficient economic return and unaffordable renewal expenses. The identified optimal spillover threshold of 3500 m implies that vertical greening and streetscape improvement should be deployed in connected clusters within the 3000–4000 m buffered zones. Clustered and moderately scaled green renewal unlocks scale-driven spillover dividends and maximizes the transformation from ecological landscape value into tangible property appreciation.

5. Conclusions

Taking Shanghai as the empirical case, this study integrates Baidu street-view imagery, Dianping-based vitality datasets and second-hand housing transaction records, alongside Segformer semantic segmentation, geographically weighted regression, log–log spatial hedonic model and multi-scale Bootstrap mediation test, to systematically unpack spatial synergy between GVI and local vitality, GVI’s impact on neighborhood vitality, and the internalization-spillover rules of landscape economic value.
Empirical outcomes demonstrate prominent spatial differentiation and mismatched coordination between GVI and urban vitality across Shanghai: historic conservation precincts in central districts achieve mutually beneficial high-GVI and high-vitality coupling, whereas dense core built-up areas suffer from weak green-vitality coordination. After controlling macro built-environment covariates, the GVI in central urban areas exerts stronger positive influence on local vitality than conventional predictors including population density and land-use mixing ratio; every 1% increment in GVI raises neighborhood vitality by 6.21%. Multi-scale mediation results confirm that GVI capitalizes residential value and offsets landscape renovation expenditure via the impacts on vitality promotion following an inverted-U spillover curve with the optimal value-conversion radius of 3500 m, and outer suburban zones exhibit greater full-mediated value appreciation potential relative to central urban core.
From the pedestrian eye-level perception perspective, this research advances quantitative frameworks for urban green landscape benefits and supplies empirical support for refined vertical green layout and sustainable urban regeneration in megacities. Several limitations remain: the analysis is restricted to Shanghai as a single case without incorporating seasonal fluctuation and demographic heterogeneity. Secondly, the visitor data derived from comment volume can only serve as a proxy for vitality, failing to quantify urban vitality comprehensively and with high precision. Finally, housing transactions are subject to numerous complex economic factors. Future research can extend to cross-city comparative analysis and multi-scenario simulation to enrich the theoretical framework of green landscape value transmission. Meanwhile, geospatial big data can be further acquired from social media and other platforms, which can be combined with urban economic and demographic data to further characterize urban vitality and explore its more detailed economic boosting effects.


Author Contributions

Conceptualization, C.W.; methodology, C.W. and B.Z.; software, C.W.; validation, C.W. and B.Z.; formal analysis, C.W. and B.Z.; investigation, C.W. and B.Z.; resources, C.W. and B.Z.; data curation, C.W. and B.Z.; writing—original draft preparation, C.W. and B.Z.; writing—review and editing, C.W. and B.Z.; visualization, C.W. and B.Z.; supervision, C.W. and B.Z.; project administration, C.W. and B.Z.; funding acquisition, C.W. and B.Z. All authors have read and agreed to the published version of the manuscript.

Funding

This research received no external funding.

Data Availability Statement

The raw data supporting the conclusions of this article will be made available by the authors on request.

Conflicts of Interest

The authors declare no conflicts of interest.

Abbreviations

The following abbreviations are used in this manuscript:
GVIGreen View Index
BSVBaidu street-view

Appendix A

Appendix A.1

Table A1. A gradient regression outputs of Model 1 for Shanghai.
VariableCoefficientStd. Errort-Statisticp-Value
Intercept1.710.325.29p < 0.001 ***
Population Density0.000.003.91p < 0.001 ***
Land-use Mix Degree0.640.222.920.004 **
Commercial Facilities Density0.000.003.040.003 **
Primary & Secondary Road Density 14.310.71.340.180
Tertiary & Quaternary Road Density 21.28.402.530.012 *
GVI3.121.052.980.003 **
Significance notation: *** p < 0.001, ** p < 0.01, * p < 0.05; no marking denotes p ≥ 0.05.
Table A2. B gradient regression outputs of Model 1 for Shanghai.
VariableCoefficientStd. Errort-Statisticp-Value
Intercept1.6700000.1930008.640p < 0.001 ***
Population Density0.0041700.0004998.370p < 0.001 ***
Land-use Mix Degree0.0815000.1620000.5030.615
Commercial Facilities Density0.00004130.00001313.1500.002 **
Primary & Secondary Road Density 9.8500008.5100001.1600.248
Tertiary & Quaternary Road Density 15.6000008.9900001.7400.083
GVI1.6200001.0600001.5300.128
Significance notation: *** p < 0.001, ** p < 0.01, * p < 0.05; no marking denotes p ≥ 0.05.
Table A3. C gradient regression outputs of Model 1 for Shanghai.
VariableCoefficientStd. Errort-Statisticp-Value
Intercept0.5940.2082.860.004 **
Population Density0.003620.0005786.27p < 0.001 ***
Land-use Mix Degree0.7840.2003.92p < 0.001 ***
Commercial Facilities Density0.00007710.00002033.79p < 0.001 ***
Primary & Secondary Road Density 34.2009.3903.64p < 0.001 ***
Tertiary & Quaternary Road Density −4.4907.820−0.5740.566
GVI6.2101.2005.19p < 0.001 ***
Significance notation: *** p < 0.001, ** p < 0.01, * p < 0.05; no marking denotes p ≥ 0.05.
Table A4. D gradient regression outputs of Model 1 for Shanghai.
VariableCoefficientStd. Errort-Statisticp-Value
Intercept0.1740.1631.070.287
Population Density0.007310.0009197.96p < 0.001 ***
Land-use Mix Degree0.5140.2252.280.023 *
Commercial Facilities Density0.0001500.00002745.49p < 0.001 ***
Primary & Secondary Road Density 10.80012.6000.8610.389
Tertiary & Quaternary Road Density 43.70010.7004.09p < 0.001 ***
GVI0.4290.9700.4430.658
Significance notation: *** p < 0.001, ** p < 0.01, * p < 0.05; no marking denotes p ≥ 0.05.
Table A5. E gradient regression outputs of Model 1 for Shanghai.
VariableCoefficientStd. Errort-Statisticp-Value
Intercept0.2820.2701.040.297
Population Density0.008150.001625.04p < 0.001 ***
Land-use Mix Degree0.8760.5061.730.0840
Commercial Facilities Density0.0001560.00006852.280.023 *
Primary & Secondary Road Density 36.80023.6001.560.120
Tertiary & Quaternary Road Density −34.10022.100−1.540.124
GVI−4.0001.510−2.660.008 **
Significance notation: *** p < 0.001, ** p < 0.01, * p < 0.05; no marking denotes p ≥ 0.05.

Appendix A.2

Table A6. A gradient regression outputs of Model 2 for Shanghai.
VariableCoefficientStd. Errort-Statisticp-Value
Intercept5.330.6448.28p < 0.001 ***
GVI−1.670.996−1.680.095
Hardscape3.133.7800.8290.408
Building3.771.2503.010.003 **
Sky−7.031.170−6.02p < 0.001 ***
Significance notation: *** p < 0.001, ** p < 0.01, * p < 0.05; no marking denotes p ≥ 0.05.
Table A7. B gradient regression outputs of Model 2 for Shanghai.
VariableCoefficientStd. Errort-Statisticp-Value
Intercept4.8800.6517.49p < 0.001 ***
GVI0.7741.1700.6590.510
Hardscape1.0302.6400.3890.697
Building1.8501.4901.2400.215
Sky−5.3401.180−4.500p < 0.001 ***
Significance notation: *** p < 0.001, ** p < 0.01, * p < 0.05; no marking denotes p ≥ 0.05.
Table A8. C gradient regression outputs of Model 2 for Shanghai.
VariableCoefficientStd. Errort-Statisticp-Value
Intercept4.3500.5747.570p < 0.001 ***
GVI2.1501.0202.1100.035 **
Hardscape−0.1883.000−0.06270.950
Building4.2501.4402.9400.003 **
Sky−5.0601.040−4.840p < 0.001 ***
Significance notation: *** p < 0.001, ** p < 0.01, * p < 0.05; no marking denotes p ≥ 0.05.
Table A9. D gradient regression outputs of Model 2 for Shanghai.
VariableCoefficientStd. Errort-Statisticp-Value
Intercept5.3000.9145.790p < 0.001 ***
GVI−0.7231.610−0.4500.653
Hardscape−8.2602.690−3.0700.002 **
Building2.6601.9801.3400.180
Sky−5.7801.630−3.540p < 0.001 ***
Significance notation: *** p < 0.001, ** p < 0.01, * p < 0.05; no marking denotes p ≥ 0.05.
Table A10. E gradient regression outputs of Model 2 for Shanghai.
VariableCoefficientStd. Errort-Statisticp-Value
Intercept7.651.2805.97p < 0.001 ***
GVI−8.652.350−3.68p < 0.001 ***
Hardscape−6.863.220−2.130.033 *
Building2.343.2400.7220.471
Sky−11.802.380−4.96p < 0.001 ***
Significance notation: *** p < 0.001, ** p < 0.01, * p < 0.05; no marking denotes p ≥ 0.05.

Appendix A.3

Table A11. Data acquisition details.
Data TypeData ResourceWebsiteData Acquisition TimeData Temporal Coverage
BSVBaidu street-view imageryhttps://quanjing.baidu.com1 October 20252024–2025
Demographic conditionLandScanhttps://landscan.ornl.gov10 June 20252022–2024
Land useBaidu Map AOI datasethttps://lbs.baidu.com/products10 June 20252024–2025
Commercial amenityDianping datasethttps://www.dianping.com15 April 20252021–2025
POI user comment records
Spatial accessibilityOpenStreetMap (OSM)https://www.openstreetmap.net.cn15 April 20252024
Residential resale transaction dataLianjia second-hand housing platformhttps://sh.lianjia.com10 June 20252021–2025

References

  1. Bai, H.; Li, Z.; Guo, H.; Chen, H.; Luo, P. Urban Green Space Planning Based on Remote Sensing and Geographic Information Systems. Remote Sens. 2022, 14, 4213. [Google Scholar] [CrossRef] [Scilit]
  2. Li, X.; Xia, G.; Lin, T.; Xu, Z.; Wang, Y. Construction of Urban Green Space Network in Kashgar City, China. Land 2022, 11, 1826. [Google Scholar] [CrossRef] [Scilit]
  3. Guo, H.; Sun, Y.; Wang, Q.; Wang, X.; Zhang, L. Construction of Greenspace Landscape Ecological Network Based on Resistance Analysis of GeoDetector in Jinan. Stoch. Environ. Res. Risk Assess. 2023, 37, 651–663. [Google Scholar] [CrossRef] [Scilit]
  4. Han, S.; Kwan, M.-P.; Miao, C.; Sun, B. Exploring the Effects of Urban Spatial Structure on Green Space in Chinese Cities Proper. Urban For. Urban Green. 2023, 87, 128059. [Google Scholar] [CrossRef] [Scilit]
  5. Alsaad, H.; Hartmann, M.; Hilbel, R.; Voelker, C. The Potential of Facade Greening in Mitigating the Effects of Heatwaves in Central European Cities. Build. Environ. 2022, 216, 109021. [Google Scholar] [CrossRef] [Scilit]
  6. Pérez, G.; Coma, J.; Chàfer, M.; Cabeza, L.F. Seasonal Influence of Leaf Area Index (LAI) on the Energy Performance of a Green Facade. Build. Environ. 2022, 207, 108497. [Google Scholar] [CrossRef] [Scilit]
  7. Wang, P.; Wong, Y.H.; Tan, C.Y.; Li, S.; Chong, W.T. Vertical Greening Systems: Technological Benefits, Progresses and Prospects. Sustainability 2022, 14, 12997. [Google Scholar] [CrossRef] [Scilit]
  8. Guo, S.; Yang, F.; Jiang, Z. Thermal Environmental Effects of Vertical Greening and Building Layout in Open Residential Neighbourhood Design: A Case Study in Shanghai. Archit. Sci. Rev. 2022, 65, 72–88. [Google Scholar] [CrossRef] [Scilit]
  9. Geng, H.; Lin, T.; Han, J.; Zheng, Y.; Zhang, J.; Jia, Z.; Chen, Y.; Lin, M.; Yu, L.; Zhang, Y. Urban Green Vitalization and Its Impact on Green Exposure Equity: A Case Study of Shanghai City, China. J. Environ. Manag. 2024, 370, 122889. [Google Scholar] [CrossRef] [Scilit] [PubMed]
  10. Jiang, Z.-D.; Luo, S.-L.; Shi, X.; Tang, S.-N.; Qian, F.; Yang, F. Thermal Environmental and Energy Effects of Vertical Greening System under the Influence of Localized Urban Climates. Urban For. Urban Green. 2024, 100, 128485. [Google Scholar] [CrossRef] [Scilit]
  11. Rao, Y.; Zhong, Y.; He, Q.; Dai, J. Assessing the Equity of Accessibility to Urban Green Space: A Study of 254 Cities in China. Int. J. Environ. Res. Public Health 2022, 19, 4855. [Google Scholar] [CrossRef] [Scilit] [PubMed]
  12. Liu, W.; Zhao, H.; Sun, S.; Xu, X.; Huang, T.; Zhu, J. Green Space Cooling Effect and Contribution to Mitigate Heat Island Effect of Surrounding Communities in Beijing Metropolitan Area. Front. Public Health 2022, 10, 870403. [Google Scholar] [CrossRef] [Scilit] [PubMed]
  13. Li, Z.; Qi, Z.; Zheng, B.; Luo, X. The Impact of Changes in Green Space Structures on Thermal Mitigation and Costs under a Constant Green Volume. Forests 2024, 15, 1525. [Google Scholar] [CrossRef] [Scilit]
  14. Xiao, Y.; Chen, J.; Wang, X.; Lu, X. Regional Green Development Level and Its Spatial Spillover Effects: Empirical Evidence from Hubei Province, China. Ecol. Indic. 2022, 143, 109312. [Google Scholar] [CrossRef] [Scilit]
  15. Wilson, J.; Xiao, X. The Economic Value of Health Benefits Associated with Urban Park Investment. Int. J. Environ. Res. Public Health 2023, 20, 4815. [Google Scholar] [CrossRef] [Scilit] [PubMed]
  16. Cho, C.-J.; Cheon, K.; Kang, W. Assessment of the Spatial Variation of the Economic Benefits of Urban Green Spaces in a Highly Urbanized Area. Land 2024, 13, 577. [Google Scholar] [CrossRef] [Scilit]
  17. Kang, T.; Jiang, Y.; Yang, C.; She, Y.; Jiang, Z.; Li, Z. Spatial Spillover Effects of Urban Gray–Green Space Form on COVID-19 Pandemic in China. Land 2025, 14, 896. [Google Scholar] [CrossRef] [Scilit]
  18. Bressane, A.; Galvão, A.L.d.S.; Loureiro, A.I.S.; Ferreira, M.E.G.; Monstans, M.C.; Medeiros, L.C.d.C. Valuing Urban Green Spaces for Enhanced Public Health and Sustainability: A Study on Public Willingness-to-Pay in an Emerging Economy. Urban For. Urban Green. 2024, 98, 128386. [Google Scholar] [CrossRef] [Scilit]
  19. Odhengo, P.; Lutta, A.I.; Osano, P.; Opiyo, R. Urban Green Spaces in Rapidly Urbanizing Cities: A Socio-Economic Valuation of Nairobi City, Kenya. Cities 2024, 155, 105430. [Google Scholar] [CrossRef] [Scilit]
  20. Yang, H.; Jin, C.; Li, T. A Paradox of Economic Benefit and Social Equity of Green Space in Megacity: Evidence from Tianjin in China. Sustain. Cities Soc. 2024, 109, 105530. [Google Scholar] [CrossRef] [Scilit]
  21. Liu, L.; Qu, H.; Ma, Y.; Wang, K.; Qu, H. Restorative Benefits of Urban Green Space: Physiological, Psychological Restoration and Eye Movement Analysis. J. Environ. Manag. 2022, 301, 113930. [Google Scholar] [CrossRef] [Scilit] [PubMed]
  22. Zhou, Y.; Yang, L.; Yu, J.; Guo, S. Do Seasons Matter? Exploring the Dynamic Link between Blue-Green Space and Mental Restoration. Urban For. Urban Green. 2022, 73, 127612. [Google Scholar] [CrossRef] [Scilit]
  23. Aikoh, T.; Homma, R.; Abe, Y. Comparing Conventional Manual Measurement of the Green View Index with Modern Automatic Methods Using Google Street View and Semantic Segmentation. Urban For. Urban Green. 2023, 80, 127845. [Google Scholar] [CrossRef] [Scilit]
  24. Zhang, L.; Wang, L.; Wu, J.; Li, P.; Dong, J.; Wang, T. Decoding Urban Green Spaces: Deep Learning and Google Street View Measure Greening Structures. Urban For. Urban Green. 2023, 87, 128028. [Google Scholar] [CrossRef] [Scilit]
  25. Rahaman, G.M.A.; Längkvist, M.; Loutfi, A. Deep Learning Based Automated Estimation of Urban Green Space Index from Satellite Image: A Case Study. Urban For. Urban Green. 2024, 97, 128373. [Google Scholar] [CrossRef] [Scilit]
  26. Li, J.; Gao, J.; Zhang, Z.; Fu, J.; Shao, G.; Zhao, Z.; Yang, P. Insights into Citizens’ Experiences of Cultural Ecosystem Services in Urban Green Spaces Based on Social Media Analytics. Landsc. Urban Plan. 2024, 244, 104999. [Google Scholar] [CrossRef] [Scilit]
  27. Özyilmaz Küçükyağci, P. Examining the change of Green View Index (GVI) at street-level with GSV and YSV. GRID—Archit. Plan. Des. J. 2025, 8, 263. [Google Scholar] [CrossRef] [Scilit]
  28. Teeuwen, R.; Milias, V.; Bozzon, A.; Psyllidis, A. How Well Do NDVI and OpenStreetMap Data Capture People’s Visual Perceptions of Urban Greenspace? Landsc. Urban Plan. 2024, 245, 105009. [Google Scholar] [CrossRef] [Scilit]
  29. Lai, D.; Liu, Y.; Liao, M.; Yu, B. Effects of Different Tree Layouts on Outdoor Thermal Comfort of Green Space in Summer Shanghai. Urban Clim. 2023, 47, 101398. [Google Scholar] [CrossRef] [Scilit]
  30. Liu, Y.; Yu, Z.; Song, Y.; Yu, X.; Zhang, J.; Song, D. Psychological Influence of Sky View Factor and Green View Index on Daytime Thermal Comfort of Pedestrians in Shanghai. Urban Clim. 2024, 56, 102014. [Google Scholar] [CrossRef] [Scilit]
  31. Yu, X.; Her, Y.; Huo, W.; Chen, G.; Qi, W. Spatio-Temporal Monitoring of Urban Street-Side Vegetation Greenery Using Baidu Street View Images. Urban For. Urban Green. 2022, 73, 127617. [Google Scholar] [CrossRef] [Scilit]
  32. Yue, H.; Xie, H.; Liu, L.; Chen, J. Detecting People on the Street and the Streetscape Physical Environment from Baidu Street View Images and Their Effects on Community-Level Street Crime in a Chinese City. ISPRS Int. J. Geo-Inf. 2022, 11, 151. [Google Scholar] [CrossRef] [Scilit]
  33. Liang, C.; Jiang, H.; Yang, S.; Tian, P.; Ma, X.; Tang, Z.; Wang, H.; Wang, W. Characterizing Street Trees in Three Metropolises of Central China by Using Street View Data: From Individual Trees to Landscape Mapping. Ecol. Inform. 2024, 80, 102480. [Google Scholar] [CrossRef] [Scilit]
  34. He, X.; Zhou, Y.; Yuan, Y. Exploring the Relationship between Urban Polycentricity and Consumer Amenity Development: An Empirical Study Using Dianping Data in China. Cities 2025, 166, 106197. [Google Scholar] [CrossRef] [Scilit]
  35. Huo, W.; He, M.; Zeng, Z.; Bao, X.; Lu, Y.; Tian, W.; Feng, J.; Feng, R. Impact Analysis of COVID-19 Pandemic on Hospital Reviews on Dianping Website in Shanghai, China: Empirical Study. J. Med. Internet Res. 2024, 26, e52992. [Google Scholar] [CrossRef] [Scilit] [PubMed]
  36. Zhang, E.; Wan, L.; Long, Y. Beyond Street-Level Shops: Characteristics of Three-Dimensional Commercial Distribution Dynamics in Beijing Combining Gaode and Dianping Data. Cities 2026, 171, 106765. [Google Scholar] [CrossRef] [Scilit]
  37. Guo, Y.; Shen, X.; Qin, Y.; Che, S.; Wei, M.; Wang, L. Mitigating and Adapting to Extreme Climate: Developing a Novel Assessment Model for Unexplained Hot-Humid Exposure in Metropolitan Areas. Sustain. Cities Soc. 2025, 127, 106432. [Google Scholar] [CrossRef] [Scilit]
  38. Guo, Y.; Shao, Q.; Liu, F.; Lin, W.; Wang, M.; Li, Z.; Chen, S.; Liu, H.; Su, J.; Wang, X. Urban Green Space Extraction from BJ-2 Remote Sensing Image Based SegFormer Semantic Segmentation Model. Can. J. Remote Sens. 2025, 51, 2439835. [Google Scholar] [CrossRef] [Scilit]
  39. Liu, S.; Zhou, Z.; Lin, J.; Zhang, F. Global Seamount Semantic Segmentation on Bathymetric Maps Based on Improved Deep Learning Model Segformer. Mar. Geophys. Res. 2025, 46, 23. [Google Scholar] [CrossRef] [Scilit]
  40. Spasev, V.; Dimitrovski, I.; Chorbev, I.; Kitanovski, I. Semantic Segmentation of Unmanned Aerial Vehicle Remote Sensing Images Using SegFormer. In Proceedings of the Intelligent Systems and Pattern Recognition; Bennour, A., Bouridane, A., Almaadeed, S., Bouaziz, B., Edirisinghe, E., Eds.; Springer Nature: Cham, Switzerland, 2025; pp. 108–122. [Google Scholar]
  41. Xu, Y.; Xu, F.; Chi, G.; Gong, Z. Carbon Emissions and Government Interventions in Urban Agglomerations of China: An Integrated GWR and Neural Network Approach. Appl. Geogr. 2025, 179, 103645. [Google Scholar] [CrossRef] [Scilit]
  42. Boudier, A.; Markevych, I.; Jacquemin, B.; Abramson, M.J.; Accordini, S.; Forsberg, B.; Fuertes, E.; Garcia-Aymerich, J.; Heinrich, J.; Johannessen, A.; et al. Long-Term Air Pollution Exposure, Greenspace and Health-Related Quality of Life in the ECRHS Study. Sci. Total Environ. 2022, 849, 157693. [Google Scholar] [CrossRef] [Scilit] [PubMed]
  43. Tang, L.; Zhan, Q.; Fan, Y.; Liu, H.; Fan, Z. Exploring the Impacts of Greenspace Spatial Patterns on Land Surface Temperature across Different Urban Functional Zones: A Case Study in Wuhan Metropolitan Area, China. Ecol. Indic. 2023, 146, 109787. [Google Scholar] [CrossRef] [Scilit]
  44. Soltani, A.; Heydari, M.; Aghaei, F.; Pettit, C.J. Housing Price Prediction Incorporating Spatio-Temporal Dependency into Machine Learning Algorithms. Cities 2022, 131, 103941. [Google Scholar] [CrossRef] [Scilit]
  45. Yang, L.; Liang, Y.; He, B.; Yang, H.; Lin, D. COVID-19 Moderates the Association between to-Metro and by-Metro Accessibility and House Prices. Transp. Res. Part Transp. Environ. 2023, 114, 103571. [Google Scholar] [CrossRef] [Scilit]
  46. Alfons, A.; Ateş, N.Y.; Groenen, P.J.F. A Robust Bootstrap Test for Mediation Analysis. Organ. Res. Methods 2022, 25, 591–617. [Google Scholar] [CrossRef] [Scilit]
  47. Falk, C.F.; Vogel, T.A.; Hammami, S.; Miočević, M. Multilevel Mediation Analysis in R: A Comparison of Bootstrap and Bayesian Approaches. Behav. Res. Methods 2024, 56, 750–764. [Google Scholar] [CrossRef] [Scilit] [PubMed]
Figure 1. Study area.
Land 15 01293 g001
Figure 2. Research flow.
Land 15 01293 g002
Figure 3. BSV processing workflow based on the Segformer algorithm.
Land 15 01293 g003
Figure 4. Spatial distributions of GVI and local urban vitality in Shanghai derived from Baidu street-view data. (a) Spatial pattern of GVI in Shanghai; (b) spatial pattern of local urban vitality in Shanghai.
Land 15 01293 g004
Figure 5. GWR-based estimation results for synergy between GVI and local urban vitality in Shanghai using Baidu street-view data.
Land 15 01293 g005
Figure 6. Fitting outcomes of Model 1 and Model 2.
Land 15 01293 g006
Table 1. Spatial Attribute Indicator System.
ModelPrimary DimensionSpecific IndicatorData Source
Model 1Demographic conditionResidential population densityLandScan
Land useLand-use mixing degreeBaidu Map AOI dataset
Commercial amenityQuantity of commercial facilitiesDianping dataset
Spatial accessibilityPrimary and secondary roadsOpenStreetMap (OSM)
Tertiary and quaternary roads
Green infrastructureGreen View Index (GVI)Baidu street-view imagery
Model 2Street-view pixel proportionGreen View Index (GVI)Baidu street-view imagery
Hardscape Ratio
Building Ratio
Sky Ratio
Table 2. Comparison of fitting performance across alternative model specifications.
ModelModel TypeR2Adjusted R2AICBIC
Model 1Linear0.020.0244,043.0844,092.33
Semi-log0.280.2714,786.2314,835.48
Log–log0.330.3314,535.8314,585.08
Box–Cox0.290.2915,743.8415,793.09
Model 2Linear0.030.0343,301.1543,350.40
Semi-log0.280.2813,370.4213,419.67
Log–log0.280.2813,408.5713,457.82
Box–Cox0.300.3016,111.5516,160.80
Table 3. Full-sample regression outputs of Model 1 for Shanghai.
VariableCoefficientStd. Errort-Statisticp-Value
Intercept0.260.102.750.006 **
Population Density0.010.0022.40<0.001 ***
Land-use Mix Degree0.650.125.55<0.001 ***
Commercial Facilities Density0.000.006.79<0.001 ***
Primary and Secondary Road Density 25.706.004.27<0.001 ***
Tertiary and Quaternary Road Density 21.605.134.21<0.001 ***
GVI0.950.571.670.094
Significance notation: *** p < 0.001, ** p < 0.01, * p < 0.05; no marking denotes p ≥ 0.05.
Table 4. Full-sample regression outputs of Model 2 for Shanghai.
VariableCoefficientStd. Errort-Statisticp-Value
Intercept6.800.4315.70p < 0.001 ***
GVI−2.210.79−2.800.005 **
Hardscape−5.961.46−4.08p < 0.001 ***
Building5.970.996.02p < 0.001 ***
Sky−10.400.78−13.40p < 0.001 ***
Significance notation: *** p < 0.001, ** p < 0.01, * p < 0.05; no marking denotes p ≥ 0.05.
Table 5. Counts of full and partial mediation across three dependent variables.
VariableTotal Mediation CasesFull MediationPartial Mediation
All indicators663036
Average transaction price25520
Transaction cycle1688
user attention25178
Table 6. Counts of full and partial mediation across different spatial buffers.
VariableTotal Mediation CasesFull MediationPartial Mediation
All scales663036
0 m110
500 m651
1000 m321
1500 m431
2000 m431
2500 m743
3000 m835
3500 m1138
4000 m826
4500 m725
5000 m725
Table 7. Counts of full and partial mediation across five urban–rural gradients.
VariableTotal Mediation CasesFull MediationPartial Mediation
All gradients663036
A19910
B954
C15510
D1486
E936
Disclaimer/Publisher’s Note: The statements, opinions and data contained in all publications are solely those of the individual author(s) and contributor(s) and not of MDPI and/or the editor(s). MDPI and/or the editor(s) disclaim responsibility for any injury to people or property resulting from any ideas, methods, instructions or products referred to in the content.